Embed Size (px)
Citation preview

DETERMINANTS OF CAPITAL STRUCTURE AND ITS
IMPACT ON THE PERFORMANCE OF ETHIOPIAN
INSURANCE INDUSTRY
A RESEARCH PAPER IN PARTIAL FULFILLMENT OF THE
REQUIREMENTS FOR THE DEGREE OF MASTER OF SCIENCE
IN ACCOUNTING AND FINANCE
By: Mohammed Getahun
Principal Advisor: Sujatha Selvaraji (PHD)
Co-advisor:- Yonas Mekonnen (MSC)
POST GRADUATE PROGRAME
DEPARTMENTOF ACCOUNTING AND FINANCE
COLLEGE OF BUSINESS AND ECONOMICS
JIMMA UNIVERSITY
June, 2014
Jimma, Ethiopia

Declaration
This is to certify this is thesis prepared by Mohammed Getahun, entitled:
determinants of capital structure and its impact on the performance of Ethiopian
insurance industry and submitted in partial fulfillment of the requirements for
the degree of Master of Accounting and Financecomplies with the regulations
of the university and meets the accepted standards with respect to originality
and quality.
Approved by the examining committee
Examiner_________________________ Signature ___________Date______________
Examiner_________________________ Signature ___________Date______________
Advisor _________________________ Signature ___________Date______________
Co-advisor________________________Signature___________Date______________
________________________________
Chair of department or Graduate program coordinator

I
ABSTRACT
An appropriate capital structure is a critical decision for any business organization to be
taken by business organization for maximization of shareholders wealth and sustained
growth. The mainobjectives this study wasexamining the determinants of capital structure
and its impact on the performance of Ethiopian insurance industry. Thus, the major focus of
this study was to investigate empirically firm specific factors such as, firm leverage, growth
opportunities, size, risk, tangibility and liquidity were impacts on performance in Ethiopian
insurance industry. To achieve the research objectives panel analysis was used. In this study,
the researcher used only secondary data. All insurance companies were included in the
sample frame if they had Ten years annual report. Document review has beenused for
collecting data from 2004-2013 annual reports. The statistical tests were used includes:
descriptive statistics, correlation, specific linear assumption and fixed effect regression
estimation model, a relationship was established between firm specific factors and
performance,measures return on asset (ROA) of the firms over a period of ten years. The
results show that firm leverage, Size, tangibility and business risk were significant impact on
performance of Ethiopian insurance companies. While firm growth and liquidity were not
clear and statistical proved relationship are obtained from the regression analysis. The
results provide strong evidence in support of the pecking order theory of capital structure
which asserts that leverage was a significant determinant of firms’ performance. A
significant negative relationship is established between leverage and performance.
From the findings the researcher recommended that the sample of Ethiopian insurance
industry use more equity than debt in financing their business activities, this because if the
value of business can be enhanced with debt capital, it is dangerous for the firm. Each
Ethiopian insurance industryestablishes with the aid of professional financial managers, that
particular debt-equity mix that maximizes its value and minimizes its weighted average cost
of capital.
Keywords: capital structure, performance, Ethiopian insurance industry, Returns on asset.

II
ACKNOWLEDGEMENT
Prays and truthful thanks to Allah who gave me the patience and the ability to accomplish
this paper.
I would like to thank my main advisor, Dr.Sujatha Selvaraji, for her guidance through the
year researcher spent under her supervision is greatly appreciated. This work is better for her
inputs and directions regarding capital structure of insurance companies.
In addition, I extend my appreciations to Mr. Yonas Mekonnen for his comments,
encouragements and guidance for the accomplishment of this research paper.
I am indebted to express my gratitude to Jimma University, specifically College of Business
and Economics, for giving me the chance to conduct this research paper.
In addition, I express my gratitude to the people who have helping and support me during the
study period in Jimma University. Also, special thanks are furthermore given to my
colleagues in the college for all the time, feedback and discussion.

III
Table of content
Abstract………………………………………………………….…………………. I
Acknowledgement…………………………………….…………………………................ii
Table content…………………………………………………….…………………………………….iii
List of Acronyms………………………………………………..…………………………………….Vi
Chapter one………………………………………………………………………………………..…...1
1. Introduction.........................................................................................................................1
1.1 Background of the study…………………………………………………………….…….…..….1
1.2 Statement of the problem………………………………………………………….…………......3
1.3 Objectives of the study…………………………………………………………….….................6
1.3.1 Specific objectives of the study……………………………………………………….…....6
1.4 Research question……………………………………………………………………………..…....6
1.5 Research hypothesis…………………………………………………………………………….….6
1.6 significance of the study……………………………………………………………………..…….9
1.7 Scope of Study and limitation study..………………………………………….……….….….10
1.8Structure of the research………………………………………………………………..….…….11
CHAPTER TWO…………………………………………………………………………………..…...12
2. Literature review……………………………………………………………………………………12
2.1 Introduction…………………………………………………………………………………...……12
2.1 Theories of Capital Structure……………………………………………………………….…...13
2.1.1 The Modigliani-Miller Theorem……….……………………………………………….…….14
2.1.2 Trade-Off Theory……………………………………………………………………….……...14
2.1.2.1 Empirical result of trade off theory……………………………………………………....16
2.1.3 Pecking Order Model………………………………………………………………………… ..17
2.1.3.1 Empirical result of pecking order off theory…….…………………………………….18
2.1.4 Agency Cost Theory……..…………………………………………………………………… .19
2.1.5 Free cash flow theory…………………………………………………………..…………….
202.2 Optimum capital
structure……………………………………………….…………………...…20
2.3 Capital structure and corporate performance… …………………………………………….21
2.4 Empirical studies of determinants of capital structure and performance………………...22
2.5 Review of empirical studies…………………………………………………………………......26
2.6 Conclusion and knowledge gap…………………………………………………………………34
2.7 Overview of the insurance in Ethiopia industry…………………………………………..35

IV
2.7.1 Present status and the challenges facing Ethiopian insurance industry………………..36
2.7.2. The regulatory framework of the Ethiopian insurance industry………………………..36
Chapter three………………………………………………………………………………………….38
3 Research methodology……………………………………………………………………………..38
3.1 Research design………………………………………………………………………………….38
3.2 Sources data………………………………………………………………………………….38
3.3 Study population and sampling technique……………………………………………………39
3.5Method of data analysis & Presentation ……………………………………………………..40
3.6 Model specification…………………………………………………………………………….. 40
3.7 Definition of variable and measurements…………………………………………………..42
3.7.1 Dependent variable …………………………………………………………………………42
3.7.2 Independent variable………………………………………………………………………..43
3.8 Conceptual Frame Work………………………………………………………………………46
Chapter four ………………………………………………………………………………………...47
4. Data analysis and interpretation …………………………………………………….47
4.1 Specification and misspecification classical linear assumption…….. ………….……..48
4.1.1 Descriptive statistics……………………………………………………………………48
4.1.2 Pearson correlation matrix……………………………………………………………49
4.1.3 Unit root test…………………………………………………………………………….50
4.1.4 Test normality Data…………………………………………………………………….51
4.1.5 Heteroskedasticity Test…………………………………………………………………52
4.1.6 Testing for multicollinearity……………………………………………………………53
4.2 Random Effect versus Fixed Effect Models…………………………………….………54
4.3 Regression result……………………………………………………………..………….55
4.4 Discussion of the results………………………………………………….…..…….…….58
Chapter Five…………………………………………………………………………….…......65
5. Conclusion and Recommendation……………………………………………...............65
5.1 Conclusion………………………………………………………………………………….65
5.2 Recommendation…………………….…………………………………………..………. 67
Reference………………………………………………………………………………………..69
Appendix……………………………………………………………………………. ………..77

V
List of Figures
Fig 2.1: trade off theory…………………………………………………………………….14
Fig 3.1; conceptual framework of the study………………………………………………45
List of Tables Page
Table 2.2 Summary of capital structure theories………………………………….21
Table 3.1 sample of Ethiopian insurance companies………………………...….38
Table 3.2 Summary of variable and measurements……….…………………….44
Table 4.1 descriptive statistics ……………………………………………………..48
Table 4. 2Pearson correlation matrix for insurance company ……….………..49
Table 4.3 unit root test……….……………………………….…….………………50
Table 4.4 Test normality Data……………………………………………………50
Table 4.5 Heteroskedasticity Test………………………….……………………50
Table 4.6 Testing for Multicollinearity………………….……………………….51
Table 4. 7 Haussmann specification test ………………………………………..53
Table 4.8 Regression Result: Fixed effect regression model….…………….54
Table 4.9 Results summary………………………………………………….…...61

VI
List of Acronyms
AFIC-African Insurance Corporation
AIC- Awash Insurance Corporation
Br- Business risk
EIC - Ethiopian Insurance Corporation
FEM- Fixed effect model
GR- Growth Opportunities
GIC - Global Insurance Corporation
LEV- Firm leverage
LQ – Liquidity
MM- Modigliani and Miller
NIC- National Insurance Corporation
NIC- Nile Insurance Corporation
NYIC-Nyala Insurance Corporation
NBIC- Nib insurance companies
NBE- National Bank of Ethiopia
SZ –Size
REM- Random effect model
ROA- Return on Asset
UIC- united Insurance Corporation

1
Chapter one
1. Introduction
The main objective of this study was to investigate the determinants of capital structure and its
impact on the performance in the context of Ethiopian insurance industries. The first chapter of
the research was intends to introduce the background the study, which was the knowledge
researcher intend to fill gap,statement of the problem, objective of the study, hypothesis
,significance of the study and scope and limitation of the study.
1.1 Background of the study
The capital structure of a firm describes the way in which a firm raised capital needed to
establish and expand its business activities. It is a mixture of various types of equity and debt
capital a firm maintained resulting from the firms financing decisions. In one way or another,
business activity must be financed. Without finance to support their fixed assets and working
capital requirements, business could not exist.In all aspects of capital investment decision, the
capital structure decision is the vital one since the profitability of an enterprise is directly
affected by such decision. Therefore, proper care and attention need to be given while
determining capital structure decision.
Capital structure decisions are among the most significant finance decisions companies
encounter. It has been long debated whether capital structures are influential on costs of capital
and firm values. The theory of capital structure and its relationship with a firm‘s value and
performance has been a puzzling issue in corporate finance and accounting literature since the
Modigliani and Miller (1958) argue that under the perfect capital market assumption that, if
there is no bankrupt cost and capital markets are frictionless, if without taxes, the firm‘s value is
independent with the structure of the capital. Debt can reduce the tax to pay, so the best capital
structure of enterprise should be one hundred percent of the debt. Since then, several theories
have been developed to explain the capital of a firm including the Pecking order theory, Static
Trade-off theory and agency cost theory. The firm‘s decision about its source of capital will
affect its competitiveness among its peers. Therefore, firm should use the appropriate mix of
debt and equity that will maximize its profitability.
Note that: The indicator of firm performance is profitability. Therefore, the researcher used throughout
the paper profitability and firmperformance interchangeably.
2
The lack of consensus among the theories that try to explain the capital structure of a firm has
led to many empirical studies in capital structure of the firm. These studies were trying to reach
a conclusion about the impact of capital structure on firm‘s performance.
In connection to this,financing the firm‘s needs, the amount of debt to be undertaken is affected
by several factors.Capital structure theory, specifically the trade-off model suggests that firms
with high business risks should use less debt than lower risk firms. This because the higher the
risk the higher probability that the firm will face financial distress. Furthermore, firms that have
tangible asset should use more debt than firms that have more intangible assets since only
tangible assets can be used as collateral. Besides, when financial distress occurs, intangible
assets will most likely to lose value. It also stated that firms that are paying taxes at higher rates
should take more debt since its bankruptcy risks is lesser than the lower taxpayer firms Brigham
et.al,(1999).
Pecking order theory that has been introduced by Myers (1977) is also relevant to deviation of
capital structure. It states that firms have a preferred hierarchy for financing decisions. The
highest preference is to use internal financing before resorting to any form of external fund.
The Agency cost theory lastly states that an optimal capital structure is attainable by reducing
the costs resulting from the conflicting between the managers and the owners.
Jensen and Meckling (1976) argued that leverage level can be used to monitor the managers to
pursue the overall firm‘s objectives and theirs. By doing so, cost is reduced leading to efficiency
which shall eventually enhance firm performance Buferna et.al, (2005).
How an organization is financed to both the managers of the firms and providers of funds. This
because if wrong mix debt and equity of finance is employed theperformance and survival of
the business enterprise may be seriously affected. This study wants to contribute to the debate
on the relationship between capital structure and firm performance from capital structure theory
perspective. Financing decision facilitates the survival and growth of a business enterprise,
which calls for the need to channel efforts of businesses towards realizing efficient financing
decision, which will protect the shareholders interest. This implies effective planning and
financial management through combination of an optimum capital structure by managers so as
to maximize the shareholders wealth. A firm can finance investment decision by debts, equity or
both. Financial managers are facing difficulties in precisely determining the optimal capital
structure. Optimal capital structure means with a minimum weighted average cost of capital and
maximize the value of the organization.

3
Furthermore, capital structure and its impact on performance have been investigated for many
years, but researchers have found different results with different contexts. Accordingly, there is
no specific result, which can be generalizes on the extent of the relationship between capital
structure and firm performance, thus there is a constant for new research in different context for
achieving a more complete understanding for the dynamics of the capital structure and firm
performance interchange.
Theissues of capital structure are commonly, not given attention in developing countries, such
as Ethiopia. The primary reason is that firms in those countries face major financing constraints,
such as undeveloped bond markets and ineffective bank lending. It is important for developing
countries to better understanding their financial institutions and the nature of their funding
sources.The financial managers very important to know issue capital structure decision in these
institutions.To them in fulfilling their goals, it is important to provide them with knowledge that
relates to various determinants of financing. It would help financial managers to improve their
financing decisions regarding theirfinancing mix. By taking into account some key variables
that affect their capital structure, financial managers can better achieve their overall
performance goals.As result, these are important issues for the insurance managers,
professionals, regulators and policy makers to support the sector in achieving the excellence so
that required economic outcomes could be obtained from the help of the sector in Ethiopia by
understanding the success and failure factors of performance.
1.2 Statement of the Problem
The issue of capital structure has been a subject of major concern for researchers and scholars in
recent years.Such concern has brought about a lot of arguments on the subject which led to
numerous studies on it in the area of firms finance over the years.
The study made by Modigliani and Miller (1958) stated that under the perfect market, a firm‘s
financial structure would not affect firm value of its cost of capital. However, in 1963
Modigliani and Miller argued that in a reality, a firm‘s value could be increased by changing the
firm‘s capital structure, because of tax advantage of debts. Since they study, capital structure
and its effect on firm performance has became an issue that attract a large amount of
researchers, such as Kester W. (1986) Capital andOwnership structure, Zeitun and Tian, 2007),
Onaolapo, A. and Kajola S.O (2010), Saeedi A. (2011),etc.

4
An appropriate capital structure is a critical decision for any business organization. The decision
is important not only because of the need to maximize returns to various organizational
constituencies, but also because of the impact such a decision have on an organization‘s ability
to deal with its competitive environment. Following the work of Modigliani and Miller (1958
and 1963), much research has been carried out in corporate finance to determine the influence
of a firm‘s choice of capital structure on performance.
In spite of the number of theories havein explaining the capital structure of firms. Despite the
theoretical, appeal of capital structure, researchers in financial management have not found the
optimal capital structure. For example, the lack of a consensus about what would qualify as
optimal capital structure has necessitated the need for this research. A better understanding of
the issues at hand requires a look at the concept of capital structure and its effect on firm
performance.
According to Jensen and Meckling, (1976) drew concentration to the impact of capital structure
on the performance of enterprises, number of tests as an extension port to inspect the
relationship between performance of firm and financial leverage.However, the results
documented were contradictory and mixed. Some studies have reported positive
relationshipsGhosh.et al, (2000), Hadlock and James, (2002) etc. Several others have reported a
negative relationship between debt and financial achievement like (Fama and French, 1998) and
Simerly and Li, (2000). Capital structure is said to be closely link to the financial performance
Zeitun and Tian, (2007).
But, there were few researches directed towards developing countries that applicability of the
theories of capital structure derived from the developed nations. Mayer (1990), Singh (1995),
Cherian (1996), Cobham and Subramanian (1998) were among the scholars who have studied
the capital structure issue in the developing nations.One of the recent empirical studies
ondetermining the factors affecting capital structure in developing countries have been
attempted by Booth et al. (2001). In their studies, a sample consisting of 10 developing
countries were analyzed. From their analysis, the authors have concluded that the variables that
explain the capital structures in developed nations are also relevant in the developing countries
irrespective of differences in institutional factors across these developing nations.
However, in Ethiopia as to the knowledge of the researcher there were few papers, which relates
with this title these are Kebede (2011) investigated the determinants of capital structure in
Ethiopia small scale manufacturing co-operatives, Bayeh(2011)investigate empirically capital

5
structure determinants in the case of insurance industry in Ethiopia,Amanuel (2011)The
determinants of capital structure evidence from manufacturing share companies of Addis Ababa
city, Shibru (2012) who examined determinants of capital structure of commercial banks in
Ethiopia,yuvarajsambasivam and Abate(2013) the study examine the performance of insurance
companies in Ethiopia.
Those previously conducted research in Ethiopia were a few investigated determinants of
capital structure. But, the aim this research was to investigated the determinants of capital
structure and its impacts on the performance of the firm. This study attempted to reduce the gap
by analyzing capital structure determinants and its impacts on performance specifically in
Ethiopian insurance industry.Many insurance companies do not know explicitly the specific
determinants that affect their performance, which leading them to make informal decisions
regarding their financial mix that are suffer to error. Therefore, the researcher attempt to clarify
some of the key firm characteristics that managers need to consider when setting their ―optimal‖
capital structure.
The light of above , there is no extensive of empirical studies in Ethiopia concerning the
relationship between of capital structure and performance in the context of the Ethiopian
insurance companies, which is, motivated the researcher to put his own contribution on what
factors affect the financial performance of insurance companies. While taking in to
consideration the insufficient empirical investigation into the factors affecting insurance
companies‘ financial performance, the researcher attempts to work on such untouched empirical
evidence in the country.
Besides this, the study attempts to determine how firms choose their capital structure, while
considering many significantfactors that might affect it in order to achieve their primary
objective: maximizing value and shareholder wealth,while overcoming the conflict of interest
between its shareholders and managers. The researcher particular goal here is to investigate the
capital structure determinants and its impacts on performance in the context of Ethiopian
insurance industry.This study attempts to analyze the relationship between capital structure and
firm performance and provides applicable guideline for anyone who wants to have insight of the
theory capital structure perspective.

6
1.3 Objectives of the study
The primary objective of this study was to understand determinants of capital structure andits
impact on the performance of Ethiopian insurance industry and to know which theories of
capital structure are attractive to Ethiopian insurance industry.
1.3.2 Specific objectives of the study
The specific objectives this study tried to find evidence for:
1. To identify the most important determinants of the capital structure of Ethiopia insurance
industry.
2. To determine relationship between capital structure determinants and the performance of
Ethiopian insurance industry.
1.4 Research questions (RQ)
The researcher wants to explore the current study with reference to the following research
questions:
1. What are the most important determinants of capital structure in Ethiopian
insurancecompanies?
2. What extent the impact of capital structure determinants on the performance of
Ethiopianinsurance companies.
1.5 Research Hypotheses
The trade-off theory suggests an optimal capital structure mix for a firm to achieve the
minimum cost of capital for financing. Theoretically, the expected minimum cost of capital
should reflect the maximum financial performance and maximum welfare of shareholders. This
is important for financial management in which, if the determinants of capital structure does not
lead to the increase of the firm's performance, there is no need for financial managers to search
for those determinants. The following hypotheses test whether the of capital structure directly
affect the profitability the firm (performance).To achieve the objective of this study, in addition
to the research questions presented above the following hypotheses concerning the capital
structure determinants and its impact on performance of Ethiopian insurance companies would
be test.

7
First, a set of hypotheses represent the relationship between determinants of capital structure
and leverage level.
Growth opportunity
Empirically, there is much controversy about the relationship between growth opportunity and
level of leverage. Pecking –order theory assumes that growing firms depend on internal funds
more than external funds. According to Michaela‘s& Chittenden (1999) Firms with rapid
growth opportunities are looking for more debt due to the lack of their
internalearnings.Therefore, it is expected,growth opportunity positive relationship with debt.
H0: There is a positive relation between growth opportunities and debt.
Firm's Size
Trading-off theory assumes that large firms are more diversified, have lower risk,better
reputation, more stable cash flows and fewer hazards to be liquidated. This gives large firms
easier accessto the capitalmarkets with negligible debt costs. Thusthese firms are stronger to
face bankruptcy and financial distress. Consequentlya,positive relationship between a firm's size
and debt level is expected.
H0:There is either a positive relationship between a firm's size and leverage.
Tangibility assets
Agency theory suggests that collateralized assets can be used as a monitoring instrument to
control managers, and prevent threats of transferring wealth from debt holders to shareholders.
Lenders require collateral since it is considered an explicit promise over debt. Therefore, a
positive relationship is expected between tangibility asset and leverage level.
H0: There is a positive relation between assets' tangibility and leverage
Firm's liquidity
Liquidity has various impacts on the capital structure choice. Firms with high liquidity may
have high debt because of their ability to meet short-term liabilities which means a positive
relationship between liquidity and leverage level.
H0: There is either a positive relationship between liquidity and leverage.

8
Business risk
According to Castanias, (1983) the level of risk is said to be one of the primary determinants of
a firm‘s capital structure. The tax shelter-bankruptcy cost theory of capital structure determines
a firm‘s optimal leverage as a function of business risk. Despite the broad consensus that firm
risk is an important determinant of corporate debt policy, empirical investigation has led to
contradictory results. A number of studies have indicated an inverse relationship between risk
and debt ratio (Bradley et al., (1984), Titman &Wessels (1988). But in this study, positive
relationship was expected.
H0: There is no significant relation between the business risk andleverage
The second part of hypotheses represents the direct relationship between
determinants of capital structure and a firm’s performance
Firm's Leverage
The pecking order theory of capital structure shows that if a firm is profitable, then it is more
likely that financing would be from internal sources rather than external sources. In other words,
firms tend to use internally generated funds first and then resort to external financing. This
implies that profitable firms will have less amount of leverage (Myers and Majluf, 1984).By this
profitable firms that have access to retained profits can rely on them as opposed to depending on
outside sources (debt). In developing countries most of studies like,Antoniou et al, (2002) and
Bevan and Dan bolt (2002), Booth et al, (2001), Pandey (2001), Wiwattanakantang (1999),
Chen (2003) and Al-Sakran (2001) all found a negative relationship between leverage ratios and
profitability. Therefore, it is expected that there is negative impacts between firmleverage
andperformance.
H01: Firm's Leverage has a negative impact on performanceof insurance companies in Ethiopia.
Firm's Growth opportunities
Trade –off theory considers the growth opportunities as the indicator of the firm success, these
firms are stronger to face financial distress. Firm with good growth opportunities have a good
recognition in getting funds, easier access tothe finance market and it shows or reflected in
better performance for these firms. According to the agency theory perspective, firms with high
good growth opportunities, have lower agency costs.The extant literature considers growth
opportunities available to a firm as an important determinant of firm‘s performance, hence the
introduction of independent variable, GROW, a proxy for growth opportunities in this study.

9
Zeitun and Tian (2007) argue that growth firms are able to generate profit from investment.
Therefore, it is expected,growthinfluenced the profitability of the firm.
H02: Growth has a positive impact on performance of insurance companies in Ethiopia.
Firm's Size
Trading-off theory assumes that large firms are more diversifid, more to use economies of scale
production, have greater access to new technology and cheaper sources of funds, and investors
believe that large companies are less risky. This suggests a positive relationship between size
and performance.
H03: Firm‘s size has a positive impact on performanceof insurance companies in Ethiopia.
Tangibility assets
The most common argument in the literature favors a positive relationship between asset
tangibility and performance.Macide (1990) concludes that a firm with high fraction of plant and
equipment (tangible assets) is the asset base made the debt choice more likely and influences
the firm profitability.Akistnye (2008) argues that a firm, which retains large investments, is
tangible assets will have smaller costs of financial distress than a firm that relies on intangible
assets. The relationship between asset tangibility and profitability the firm is expected to be
positive. The hypothesis to be tested here is:
H04: Tangibility has a positive relationship with performance of insurance companies in
Ethiopia.
Firm's liquidity
According to trade-off theory high liquidity position, for the firm's indicates that this firm's
strong enough to face any short or long term financial problems, this strong firm can perform
better than a weak firm which has weak liquidity position in its financial statements. This may
indicate a relationship between a firm's liquidity and the profitability the firm's as stated by the
following hypothesis.
H05: Liquidity has a positive relationship with performance of insurance companies in Ethiopia.
Firm's business risk
According to the agency theory, the required return of the investors should be suitable to their
risk in the firm. Shareholders will require high return in order to hold the risk related to the
bankruptcy and financial distress since debt holders have the priority in the case of bankruptcy.
10
In addition, the debt holders will require such to hold the risky agency conflicts with
shareholders and management. This will encourage the managers to maximize their
performance in order to fulfill the requirements of these investors, which may indicate a
relationship between firm's risk and performance as represented the following hypothesis.
H06: There is a positive relationship between business risk and performance of Ethiopian
insurance companies.
1.6 Significance of the Study
The main objective of this study was the determinants capital structure and its impacts on the
performanceof Ethiopian insurance industry. Ingeneral, this study will cover many aspects of
the topicbut specifically it has been tried to determine the relationship between of capital
structure determinants and performance of the firm. This study especially will help the
managers to take the financing decision for their firms.The creditors can also take the benefit to
minimize their risk, in funding a specific sector firms.This study will be beneficial to Ethiopian
insurance company's management and investors in making clear decisions on capital structure.
In addition to the above, a lot of work is written because of the endless argument on capital
structure theories. This study is another contribution to the existing work on the study of the
impact of capital structure on performance of Ethiopian insurance companies.
1.7Scope of Study and limitation study
The main objective of this studywas limited to the capital structure determinants and its impact
on theperformance in the context of Ethiopian insurance during the period 2004-2013. This
study has clear and expected limitation in the amount of data that will be used, because the
researcher only using data from balance sheet and income statement during the period (2004-
2013. This thesis only focuses on the issues raised in the research question.
This study was based on secondary data collected from National Bank of Ethiopia. Therefore,
the quality of the study depends purely upon the accuracy, reliability and quality of the
secondary data source. Approximation and relative measure with respect to the data source
might impact the results.

11
1.8Structureof the research
The research paperis structured as follows. The first chapter discusses background of the study,
statement of the problem, objectives, hypotheses, significance, and scope of the study.The
second chapter 2 ,contains a review of the literature including, the Modigliani-Miller
Theorem,theories of capital structure,empirical studies ondeterminants of capital
structure&profitability of the firm andoverview of insurance industry in Ethiopia. The third
chapter deals with about research methodology.The fourth chapter is also presents the analysis
and empirical finding. The last chapter five which is presents the conclusion of the finding and
recommendation.
Figure 1: Thesis Outline

12
Chapter two:
2. Literature review
Introduction
A literature review is the backbone of research and connected tothe research topic and the
appropriate research methodology. It is essential for researchers, as a reader, and for us, as
authors, to have a concrete frame of reference in mind before continuing their search journey.
Most of all, a solid framework represents the coherence of the theories chosen. This chapter
discusses Modigliani-Miller theorem, theory of capital structure, (trade-off theory, pecking
order theory & agency cost theory), capital structure and corporate performance, determinants
of capital structure,review of empirical studies, and over view of Ethiopian insurance industry.
Capital structure has been an important focus point in the literature since Modigliani andMiller
started publishing their research about it in 1958. Capital structure is a remarkable topic because
it has researched in both academic level and corporate level since the financing decisions of a
firm are of vital importance for its operating and investing activities. Therefore, there are many
theories, which discuss it in many different ways. It is referred how a firm mixes debt and
equity in order to finance itself or in other words, it concerns about combination of funds, in the
form of debt and equity.
Therefore, there is still hot debate regarding that does an optimal capital structure exist and how
capital structure affects firm performance and vice versa.The issue of capital structure is
concerned with the optimal mix of debt and equity in the capital structure.This mix results in
minimum weighted average cost of capital andthis consequently maximizes the firm‘s financial
performance in terms of shareholders‘ value.
The optimal capital structure in the real world can beexplained by the trading-off between the
gains from debt and different related costs such as bankruptcy, financial distress and agency
costs (Scott 1976) and (Copeland & Weston 1992).The leading theory of capital structure was
started in 1958 by Modigliani and Miller. The demonstrate that in a perfect world (no taxes,
perfect and credible disclosure of the information and no transaction and agency costs), the level
of debt in a firm‘s capital structure would have no impact on the firm‘s value and performance,
as well as shareholder value. After this initial work, capital structure mainly depends on theories
which include corporate taxes, financial distress, agency costs, trade off and signaling. In their
later work, (Modigliani and Miller 1963) focus initially on the advantages of debt finance

13
through the effect of corporate taxes. Debt is useful through the trading-off between the benefits
of tax reduction on interest payments and the costs of financial distress. In 1977 Miller
continues to their work and states that the firm has an incentive to use debt and will continue to
use it until their additional supply drives up interest rates to the point where tax advantages of
interest deduction are completely offset by higher rates.
2.1 Theories of Capital Structure
Capital structure theory, as known today, originates from the work of Modigliani and Miller,
hereafter named M&M, who published their famous article in 1958. Many, if not all business
and finance academics have heard and know about M&M‘s capital structure irrelevance
proposition and several textbooks within corporate finance begin their explanations of capital
structure and cost of capital with the work of M&M.
In addition M&M Myers (2002) indicates that the capital structure theories and empirical
evidences focus mainly on financing strategy as well as the selection of an optimal debt ratio for
a certain type of firm that operates in a distinct institutional environment. According to Myers
(2002), these theories are credible not because they do a perfect job highlighting the differences
in total debt ratios, but because the costs and benefits that drive the theories at work in financing
strategies can be observed. While there is no universal theory of capital structure, there are
however, some relevant conditional theories and these theories can be distinguished in their
relative focus on the factors that could significantly impact the right mix of debt and equity.
These factors comprise taxes, agency costs, and differences in information, institutional or
regulatory constraints and a whole lot more (Myers, 2002). The same author stressed that each
of these factors could be very significant for some firms and for other firms they could be
highly unimportant. The leading theories are given below. Majority of these theories overlap
and a blend of these theories help in explaining capital structure.
2.1.1 The Modigliani-Miller Theorem
As previously mentioned, the irrelevance theory of capital structure, which has been introduced
by Merton Miller and Franco Modigliani (1958)-denoted by M&M throughout the researcher
paper-was the first break through in relation to the subject of capital structure and its effects on
financial performance. They first hypothesized that if markets are perfectly competitive, firm
performance will not be related to capital structure, there by suggesting no significant
relationship between a firm‘s capital structure and its performance. The value of the firm is
similarly unaffected by its financial structure. Their assumptions of a perfectly competitive

14
market exclude the impacts tax, inflation and transaction costs associated with raising money or
going bankrupt. In addition they also assume that disclosure of all information is credible, thus
there is no information asymmetry (Hamada, 1969 and Hatfield et.al, 1994). There were various
criticisms, which encouraged M&M to issue an alteration to their first theory, which refers to as
MM2. In their revised proposition they incorporated tax benefits as determinants of capital
structure. The vital characteristic of taxation is the acknowledgement of the interest as a tax-
deductible expenditure.
According to M&M a company that respects its tax obligations, benefit from partially offsetting
interest, namely the tax shield, in the form of paying lower taxes. Thus M&M indicate that
companies can maximize their value by employing more debt due to tax shield benefits allied
with the use of debt. Hence, firms benefit from taking on more leverage. M&M show that firm
value and firm performance is an increasing function of leverage due to the tax deductibility of
the interest payments at the corporate level (Modigliani & Miller, 1963).
In reality, markets are inefficient, due to taxes, information asymmetry, transaction costs,
bankruptcy costs, agency conflicts and any other imperfect elements. When taking these
elements into consideration, the M&M theorem tends to lose the majority of its explaining
power. Even though M&M theory was heavily criticized of some weaknesses and its irrelevant
assumptions of the real world, this theory still provides the foundation for many other theories
suggested by other researches.
2.1.2Trade-Off Theory
The tradeoff theory model originated from the debate over the M&M‘s theorem. When
corporate tax was added to the original irrelevance proposition of M&M, a benefit for debt is
observed that serves to shield earnings from taxes.This theory states that the optimal capital
structure is the trade-off between the benefits of debt (i. e., the interest tax shields) and the costs
of debt (i. e., the financial distress andagency costs) (Brigham and Houston, 2004). The figure
below clarifies the idea of this theory.

15
Figure 2.1 trade off theory
As we can see from the above figures,the straight line represents the firm's value in a world
without bankruptcy costs; the curved line shows the value with these costs.The curved line
increasesas the firm moves from all equity to a small amount of debt toward point A in the
figure. On this point, the expected present value of distress costs is less because the probability
of distress is unimportant. Beyond point A, the bankruptcy costs becomerises importantand the
present value of these costs rises at an increasing rate,and they reduce the tax benefits of debt in
an increasing rate.Between A and B, point‘s bankruptcy costs will minimize,but not equalize the
tax benefits of debt so the firm's value increasing at decreasing rate as its debt ratio increases. At
point B, the rise of the present values of these costs from an additional amount of debt equals
the rise in the present value of the tax shields. This level of debt is the optimal level which
maximizes the value of the firm represented by B in the figure above. Beyond this point,
bankruptcy costs more than the tax shields and this implies a reduction in the firm's value for
further leverage. Therefore, the firm's value of the levered firm will be the value of the un-
levered firm plus the value of tax savings minus the present value of the expected costs of
financial distress (Brealey& Myers 2000).
Because interests are tax deductible, debt will be less expensive than other financing resources
like common or preferred stocks and then debt provides tax shelter benefits. Consequently, the
more debt a company uses, the higher it value and stock price.
According to Damodaran (1997) summarizes the advantage and disadvantage of borrowing as
shown in the following table.

16
Advantage of borrowing Disadvantage of borrowing
Tax benefits:
Higher tax rates =higher tax benefits
Bankruptcy costs:
Higher business risk=higher the costs
Added discipline:
Greater the separation between managers
and shareholders=greater benefits
Agency costs:
Greater separation between managers and
lenders =higher the costs
Table 2.1 Adopted from Damodaran (1997)
2.1.2.1 Empiricalresults of trade-off theory
Study made byWippern(1966) investigated relationship between financial leverage and firm
performance. In his study he used debt to equity ratio as financial leverage indicator and earning
to market value of common stock as performance indicator. His results indicated that leverage
has positive effects on firm performance.
Capon et al. (1990) conducted a meta- analysis from 320 published studies related financial
performance, and found a positive relationship between usage of leverage levels and financial
performance. In 1995 Roden and Lewellen analyzed the impact of capital structure on
performance for 48 US based firms with a leveraged buyout during the period 1981 through
1990, using multinomial logit models. Their results indicate a positive relationship between firm
performance and its leverage policy based on tax considerations. Their findings wereconsistent
with the trade-off theory.
According toAbor (2005) carried out regression analyses to analyze the impact of leverage ratio
on firm performance between Ghanaian listed firms over the period 1998 to 2002. Throughout
his analysis, he compared the capital structures of publicly quoted firms, large unquoted firms
and small and medium enterprises. He based his models on three measures of leverage, namely,
short-term debt over total assets, long-term debt over total assets and total debt over total assets,
on performance, measured by the Return on Equity. His results indicate that there exists a
significantly positive relationship between the short-term and total debt and Return on Equity.
The study made by Arbiya and safari (2009) also documented similar results, after analyzing
the impact ofleverage ratios of 100 Iranian publicly listed firms on their performance over
theperiod 2001 to 2007. They found that short term and total debts are positively related to
profitability measured by ROE, but found a negative relationship between long-term debts and
ROE.

17
According to the studies Umar et al.‘s 2012, findings also suggest a positive link between firm
performance and leverage, wherethey measured performance and leverage by respectively
earnings per share andcurrent liabilities to total assets. They used an exponential generalized
least squaresapproach to study the top 100 firms on the Karachi Stock Exchange over the
period2006 to 2009 and they document consistent findings supporting the trade-off theory.
2.1.3. Pecking Order Model
Unlike the trade-off theory, the pecking order theory does not assume an optimal level of capital
structure. As previously indicated Myers and majluf (1984) favor the pecking order theory,
which incorporates the assumption of information asymmetries and transaction costs.This
pecking order theory therefore suggests that firms should follow a financing hierarchy in order
to minimize information asymmetry between the parties. It states that companies prioritize their
source of financing, from internal financing to equity financing, according to the principle of the
least resistance, preferring to raise equity as a financing means of last resort. So, the pecking
order theory claims that internal funds are used first and only when all internal finances have
been depleted, firms will optimum for debt. When it is not sensible to issue any more debt, they
will eventually turn to equity as a last financing resource.
Summarizing, theory predicts that more profitable firms that generate high cash flows are
expected to use less debt capital than those who generate lower cash flows. The pecking order
theory argues that businesses adhere to a hierarchy of financing sources and prefer internal
financing when available. However, when external financing is required, firms prefer debt over
equity.Equity entails the issuance of additional shares of a company, which generally brings a
higher level of external ownership into thecompany. Therefore; the form of debt that a firm
chooses can act as a signal for its needof external finance.Thus firms that are profitable and
therefore generate high cash flows are expected to use less debt compared to those who do not
generate high cash flows. This theory therefore suggests that firms prefer debt to equity
(Muritala, 2012).
All of the mentioned mechanisms suggest that the pecking order theory claims a negative
relationship between capital structure and firm performance, since more profitable firms opt to
use internal financing over debt.

18
2.1.3Empirical results of pecking order theory
Hitherto, extant literature on the pecking order theory has provided mixed evidence regarding
the impact of capital structure on firm performance. Analyzing the data from the network stock
exchange covering various sectors over the period 1971 to 1989, shyman-sunder and Myers
(1999) find evidence in favor of the pecking order theory. On the other hand, Frank and Goyal
(2003) found a little support for the pecking order theory, while they also used American
publicly traded firms covering period‘s 1971 to1998. They argued that net equity issued as
opposed to net debt issued, is more closely correlated with financing deficit.They also
highlighted that the pecking order hypothesis seems to be more applicable for data prior to
1990.
Study made by kester (1986 ) recorded a negative link between capital structure and firm
performance in the U.s and Japan. Similar results, negative relationship between capital
structure and financial performance, were reported for US firms by friend and Lang (1988) as
by Titman and wessels(1988). According to the study Rajan and Zingales(1995) used data from
F7 countries and recorded a negative relationship between firm leverage andfirm performance.
Also, Wald (1999) found similar results for the developed countries, whileWiwattanakantang
(1999) also reported a negative relation between book leverage and market leverage and ROA
for 270 Thai firms.
According the studies of Fama and French also tested the pecking order and the trade-off
theories on more than 3000 firms in their publication of 2002. Their study covered the period
1965 to 1999. Their models were based on both cross-section and time series methods in order
to check for robustness of their results. They support the pecking order theory by documenting a
negative relationship between a firm‘s leverage and its performance.
Accordingto Minton and Wruck (2001) examined domestic financial conservative firms and
their capital structure over the period of 1974 to 1998 and they concluded that the performance
of low leverage firms outweigh the performance of high level firms. This thus indicates that
there is a negative relationship between leverage and a firm‘sperformance.
2.1.4. Agency Cost Theory
The next important theory mentioned in the literature is the agency cost theory. Jensen and
Meckling developed this theory in their 1976 publications. This theory considered debt to be a
necessary factor that creates conflict between equity holders and managers. Both scholars used
this theory to argue that the probability distribution of cash flows provided by the firm is not
19
independent of its ownership structure and that this fact may be used to explain optimal capital
structure. Jensen and Mecklingrecommended that, given increasing agency costs with both the
equity-holders and debt-holders, there would be an optimum combination of outside debt and
equity to reduce total agency costs.
Research made by Fama, Miller, Jensen (1976) observed how agency cost model. This is known
as an agency cost model. It states that capital structure is determined by its agency cost. They
found two types of problems create agency theory those are conflict between firm managers and
shareholders as well as conflict between debt holders and shareholders.
Conflict between firm managers and shareholders:
According to the Brealey and Myers (2003) observed firm manager directly deal with the agent
on behalf of major shareholder interest. Most of the firm manager wants to run large with high
probability of risk. This tends to undertake negative NPV projects. However, without a reward
firm manager do not involve large and risky project even if they expect the project give positive
NPV. This problem creates a conflict of interest between managers and shareholders. As a
consequence, the agency cost problem arises. Some time manager consumes firm valuable
resources used their power (Jensen and Meckling, 1976).
The conflict also places in the corporation because shareholders and managers always disagree
when modifying company business policy. They want to set business policy in a way that will
meet their own interest. So, this problem crucial and emerged every corporation.
Conflict between debt holders and shareholders: Managers are working for shareholders and
they want to give priority shareholders interest. Manager invests risky project that will benefit
for major shareholder not better for the bondholder. According to the empirical study of paper
found three kinds of problem arise between bondholders and shareholders. These are: asset
substitution problem, managers invests risky project that increases firm value, but they don‘t
like engaged appropriate mature bond that increases bondholders return and under investment
problem.
Bondholders also expect the manager invest safe and low return project that probability of risk
is very low. Thus, firm can paid their debt on time. But firm manager chooses risky projects that
indicated a high probability of losing capital. If they lose, no cash available to paid their loan.
Most of the cases, shareholders prefer a firm manager invest risky project with high probability
of success that they repaid their loan quickly and keep their ownership safe. If the risky project
gave negative NPV, than shareholder has possibility of defaulter. They can‘t repay their loan on

20
time.As a result, shareholders lost their control of ownership and they simply transfer their firm
to the bondholder and creditor like bank in case of China (Megginson and Smart, 2006).
Solution of agency problem:After empirical study this paper found two important paths that
reduce agency problems. These areas as follow: Shareholders can monitor manager activity that
may reduce the problem. It can reduce agency cost (Brealey and Myers, 2003). Monitor is done
by the board of the firm, auditors and the lender (Bank) andShareholder concern about firm
managers benefits not think about their own interest.
2.1.5 Free cash flow theory
Following the main agency theory as advanced by Jensen and Meckling 1976 and the existence
of information of information asymmetry between managers and shareholders, (Jensen 1986)
expanded the work to highlight an important problem, the free cash flow.
"Free Cash flow is cash flow in excess of that required to fund all projects that
havepositive net present values when discounted at the relevant cost of capital "...
(Jensen1986).
Substantial free cash flows in the hands of managers can be used in increasing dividends or
repurchasing stocks and there by payout current cash. Otherwise, managers will invest in low-
return projects. Debt is used to control the manager‘s opportunistic behavior by reducing the
free cash flows. This will prevent over investment or investment in negative projects by
committing the managements to pay fixed interest payments.
2.2 Optimum capital structure
Over half a century ago, the theory of capital structure has been dominated by the search for
optimal capital structure. The firm‘soptimal capital structure involves trade-off between tax
advantages of debt and various leverage related costs. When a firm is called optimum, it is
actually balancing between debt and equity. The firm‘s optimum capital structure has been
studied by many research scholars like Miller (1977), Myers (1984), etc. In most studies of
finding the optimal capital structure, macroeconomic data will be used. However, study using
the firm specific factors on optimal capital structure was carried out by Bradley et al. (1984). A
model that captures the existence of tax advantage and bankruptcy cost trade –off was
developed. To represent the optimal capital structure model, the assumptions are made.
Investors are risk-neutral, Investors face a progressive tax rate on return from bonds while the
firmfaces fixed tax margin, Corporate and personal taxes are based on the end of period wealth,
equity returns are taxed at a constant rate, there exist non-debt tax shields, negative tax bill are
21
not transferable, the firm will incur various costs associated with financial distress should it fail
to pay
For the purpose of the study, a sample of 851 firms in the US covers 25, two digits SIC
industries was selected. Three firm specific factors were examined to see the implication on the
theory of optimal capital structure namely volatility (represents financial distress or risk), non-
debt tax shield (represent tax advantage), advertisement, research and development
expenses.Volatility was calculated as the standard deviation of the first difference in annual
earnings before interest, depreciation and taxes over the period 1962 to 1982 divided by the
average value of total assets. The non-debt tax shield was measured by the ratio of the 20 years
1962 to 1982 sum of annual depreciation plus investment tax credits divided by the sum of
annual earnings before interest, depreciation and taxes over the period.Whereas, the level of
advertisement, research and development was given by the 10 years 1973 to 1981 sum of annual
advertisement plus research and development expenses divided by the sum of annual net sales
over the same period. They found that optimal firm leverage was inversely related to variability
of firm‘s earnings and advertisement plus research and development costs and positively with
tax benefits. From the study, the result is confirmed that optimal capital structure existed in the
US dataset.
In generally the issue of capital structure is concerned with the optimum mix of debt and equity
in financing structure and its expected role to affects the firm value.Modigliani and Miller
(1958) theory provides the background for the subsequent theories. They start their work
assuming a perfect world. However, financial distress costs in the real world are playing an
important role in defining the optimal structure. Agency problem is appeared since the agent
will not behave perfectly in the interest of the principal and this includes the agency costs of
debt and equity.
The preceding arguments led to the development of the trade-off theory of capital structure.
This theory states that the optimal capital structure is trade-off between the benefits of debt
(interest tax shields) and the cost of debt (the financial distress and agency costs). In addition
pecking order theory, assumes that it is better to issue safe securities than risky ones, starting
with bonding markets from external financing, raise equity by retention if possible. Moreover,
firms whose investment opportunities exceed operating cash flows and which have spent their
ability to issue low risky debt may forgo good investments rather than issue risky securities to
finance them.

22
Theory Relationship Causality
Modigliani and Miller(1963) positive Performance affect debt
Trade-off Positive Performance affect debt
Pecking - order Negative Performance affect debt
Free cash flow Positive Performance affect debt
Agency Negative Debt affect performance
Table 2.2 Summary of capital structure theories
2.3Capital structure and corporate performance
The issue concerning the relationship between capital structure and corporate performance is an
issue that has been considered as very important to both academics and experts in the business
world San and Heng,(2011). While there is a scarcity of statically evidence about the impact of
capital structure on corporate performance in advanced and developing economics, majority of
the past research on capital structure have always been from the determinants on corporate
leverage.
The capital structure has always been considered as one of the major components that could
have an impact on corporate performance.In explaining what the concept of performance entail
Tian and Zeitun, (2007) write that the concept is a disputatious one in finance mainly because of
its multi-dimensional meanings. They also describe performance measures as measures that
include either financial or organizational or operational.
According to study made by Tia &Zeitun(2007),financial performance measures like
maximizing the profit on assets, as well as maximizing the benefits that accrue to shareholders
are at the centre of effectiveness of the firm. While the studyHoffer and Sandberg (1987) write
that measure like the growth in sales and market share were operational performance measures
that give a wide explanation of performance as they emphasize the variables that eventually lead
to financial performance.
Study made by San and Heng,(2011),the use of financial measurement help to indicate a firm‘s
financial strengths, weaknesses, opportunities and threatsand they listed the return on
investment (ROI),residual income (RI),dividend yield, earning per share(EPS),price earnings
ratio, growth in sales,etc as tool that help in this measurement.
In connection this, Raviv (1991) argued that there is a suitable capital structure for firms, and
that going beyond this capital structure could create increases in the cost of bankruptcy, which

23
would exceed the extra-tax-sheltering advantages connected with an increasing substitution of
debt for equity. Therefore, most firms are ready to maximize their performance and reduce their
cost of financing by balancing the debt and equity mix.
The study conducted by Harris &Raviv,(1991) also argued that underrating the joint interest of
both managers and shareholders as well as the bankruptcy costs of liquidation and
reorganization had a tendency to make firms have additional debt in their capital structure thus
affecting the firm‘s performance.
In addition of those, different studies have been carried out to examine the impact, which capital
firm debt level can have on corporate performance.
Abor (2005) carried out a study to examine the influence which capital structure had on the
profitability of quoted companies on stock exchange of Ghana over a five year period and
discovered that there exists a significant positive relationship between short term debt to assets
and Return on equity (ROE).This suggests that most firms in the country that earned high
profits also use more short-term debt to finance the running of the firm. However the study
showed a negative relationship between long term debt to asset and return to equity (ROE). The
overall result of the study showed a positive relationship between debt to asset and ROE, which
shows the relationship between total debt and profitability, thus indicating that firms that earn
high profits also depend on debt as a major funding option Sanand Heng, (2011).
Another research by Gleason et al.(2000) on the interrelationship between culture, capital
structure and performance based on data collected from 14 European retailers, showed that there
exists a significant negative relationship between the capital structures of these retailers and
their return on assets (ROA), growth in sales (Gsales), and pre-tax income (ptax). The study
also showed that while capital structure varied by the cultural classification of retailers, the
performance of these retailers was in no way dependent on cultural influence overall, the
corporate performance.
The study conducted by Wessel (1988) and Barton et al. (1989) agree that firms with high profit
rates would maintain relatively lower debt ratios since they can generate such funds from
internal sources.
2.4 Empirical studies capital structure determinants and performance
In addition to above, empirically literature there is no comprehensive study between
determinants of capital structure and financial performance according to the knowledge
24
researcher. However, size- performance and risk –performance are well investigated in previous
studies. Few studies have highlighted the relationship between firm's characteristics and its
profitability of the firm. The following section summarizes all available studies in this concern.
Firms Leverage
The pecking theory of capital structure shows that if a firm is profitable, then it is more likely
that financing would be from internal sources rather than external sources. In other words, firms
tend to use internally generated funds first and then resort to external financing. This implies
that profitable firms will have less amount of leverage (Myers and Majluf, 1984). By this,
profitable firms that have access to retained profits can rely on them as opposed to depending on
outside sources (debt). Murindeet al. (2004) observes that retentions are a principal source of
finance. Titman and Wessel‘s (1988) and Barton et al. (1989) agree that firms with high profit
rates would maintain relatively lower debt ratios since they can generate such funds from
internal sources.
Empirical evidence from previous studies seems to be consistent with the pecking order theory.
Most studies found a negative relationship between profitability and capital structure Friend and
Lang, (1988); Barton et al., (1989); Van der Wijst and Thurik, (1993); Chittenden et al., 1996;
Jordan et al., (1998); Shyam-Sunder and Myers, (1999); Mishra and McConaughy, (1999);.
Cassar and Holmes (2003), and Hall et al. (2004) also suggest negative relationships between
profitability and both long-term debt and short-term debt ratios.
Petersen and Rajan (1994), however, found a significantly positive association between
profitability and debt ratio. Therefore, propose based on the pecking order theory that a negative
relationship exist between profitability and leverage.
Growth opportunities
According to Brush, Bromiley, &Hendricks, (2000) in the light of free cash flow hypothesis,
they conducted in Maryland-USA found a strong positive relationship between sales growth and
a firm‘s financial performance in terms of stockholders' returns and return on assets.
Additionally, for the top 500 Australian companies.
In addition of this Hutchinson and Gul, (2006) they found that firms with high investment
opportunities are associated with lower agency costs and better return on equity.
According to Amidu,(2007), using return on equity and return on assets for Ghana, finds
support for the fact that growing firms have a prospect of generating more returns for the
owners.

25
Firm's size
Many studies investigate the relationship between size and firmperformance.
According to the studies(Orser, Hogarth-Scott, & Riding 2000), using Canadian firms using
changes in gross revenue to reflect performance. Theyfind a positive effect for a firm's size
support the arguments that size reflects greater diversification, economies of scale production,
greater access to new technology and cheaper sources of funds.Besides, of
those,(Shergill&Sarkaria 1999) using data of Indian firmalso confirm a positive relationship
between a firm's size and financial performance.
However, according to the study, Moen, (1999) for a Norwegian company finds that export
performance is not subject to thefirm's size (employment). He finds that small firms are just as
successful as largefirms and the main competitive advantages are their products and technology.
Asset structure (tangibility)
According to shergill and sarkaria, (1999) investigates the impacts industry and firm
characteristics on the firm- level financial performance for the period 1980-1990 and cover 171
Indian firms in twenty-one industry the groups.They are using the difference between the firm's
performance rates and the market average, ROE, ROA and others. They find that capital
intensity is positively related to the financial performance. They use two sets of measures to
reflect the financial performance: Return on equity and return on assets as indicators for a
firm's profitability on one hand, and growth in sales, growth in dividends, and growth in net
total assets as measures for growth on the other hand.
Firm's liquidity
According to the researcher knowledge apart from (Wang, 2002) there is no studies address this
relationship. But, (Wang, 2002)and, who addresses the liquidity management. He investigates
the liquiditymanagement and its relationship with performance and corporate value using data
ofTaiwan and Japan. Furthermore, he observes that the cash conversion cycle (CCC)has a
negative relationship with the financial performance measured by returns onassets (ROA) or
returns on equity (ROE) and this relationship is sensitive to industryfactors. Furthermore, he
finds that aggressive liquidity management enhancesoperating performance.
Firm's business risk

26
Many studies investigate the relationship between risk and profitability. Among others
(Shergill&Sarkaria 1999) using the data of Indian firms, they confirm the positive relationship
between a firm's risk and financial Performance,(Dewan, Shi, &Gurbaxani 2007) using the
Fortune 1000 and the total firm value toreflect performance,( Loudon 2006) for 15 markets,
comprisinga mix of developedand emerging markets using equity returns.
2.5 Review of empirical studies
This study will not be complete without taking a critical look at some past empirical studies in
terms of the purpose of the studies, the methodology that was adopted and the findings of the
studies as are related to this current study. This is necessary in order to enable the researcherto
see the gaps that might have been left or to get a brief view of some recommendations for
further studies that might have been reported in these previous studies.
After introduction by Modigliani and Miller on their seminal paper on capital structure, there
are quite a number of researches directed towards finding the determinants of capital structure
choice. According to the literature, the empirical studies on the determinants of capitals
structure are largely focused on the United States and other developed nations with similar
institutions. One of the classical researches was carried out by Titman and Wessel‘s (1988)
where they studied the theoretical determinants of capital structure by examining them
empirically. The theoretical attributes namely: Asset structure, on-debt tax shields, growth,
uniqueness, industry classification, firm size, earnings volatility and profitability were tested to
see how they affect the firm‘s debt- equity choice. In their research, Titman and Wessel‘sused
four measures of financial that includes, long-term, short-term and convertible debt divided by
market and by book values equity.The accounting and financial data form a total of 469 large
firms in the United States were collected over the period from 1974 through1982 from the
annual compute industrial files and U.S department of labor, Bureau of statistics, ―Employment
and earning publication.‖ In this study, the scholars used a factor- analytical technique to
mitigate the measurement problems encountered when dealing with proxy variables. The results
indicated consistencies with theory for the factors affecting capital structure choices of firms.
One of the few interesting conclusiondrawn from the studies include the negativelevels of debt
to ―uniqueness‖ of a firm‘s line of business. The short term debt ratio was negatively related to
firm size. Besides that, a strong negative relationship was noted between debt ratios and past
profitability. This study however, did not provide strong empirical support on variables like
non- debt tax shields, volatility, collateral value and future growth.

27
The objectives of Homaifar et al. (1994) examined theeffect of profitability, firm size, and
future growth, non-debt tax shield, operating risk, dividend policy and uniqueness on the firm‘s
leverage ratios. Their results showed a positive effect of firm size and future growth of earnings
on the capital structure decision. The capital structure study revealed both consistent and
contradictory results of the factors affecting capital structure choice of US firms.
Some studies on capital structure were carried out on Multinational firms operatingin the
developed nations (Lee, 1986). Comparative studies between MNCs and domestic firms
pertaining to the capital structure decision were also carried out in the developed nations
(Fatemi1988,Burg man and Todd, 1996).
According, Gropp and Heider, (2010) analyzed the factors determining the financial structure of
U.S and European banks by collecting data for 14 years from 1991 to 2004 on 200 U.S and
European banks. The main intention of this research was to identify the effect of variables such
as collateral, profitability, market-to-book ratio, size, risk and dividend on banks. The empirical
estimation of fixed effects regression model indicates that risk, profitability and dividend have
negative impact on leverage of the bank while collateral and size have direct a relation with debt
ratio and the separate analysis of US and European banks also reports the same results.
Furthermore, they suggested that regulatory capital requirements are of second order
importance.
According to Krenusz (2004) conducted empirical studies on the determinants of capital
structure in the United States, Germany and Hungary. Among the ratio examined was liquidity
ratio, which is given by the ratio of current over current liabilities. The result indicated a strong
negative relation between leverage and liquidity.
However, in another study done on US, UK and Belgium, Anderson et al. (2002) provided a
positive relation between leverage and liquidity of the firms in the UK and Belgium. Only firms
in the US experienced the ―predicted‖ negative results.
The issues of determinants of capital structure in developing countries, however, received little
attention.
Lately, there were only few studies on the determinants of capital structure conducted in the
developing countries. Singh and Hamid (1992) and Singh (1995) pioneered research into
corporate capital structure in developing countries.
28
Singh (1995) observes that firms in developing countries finance their activities differently,
which is attributable to the differences in their financial environment. The researcher examines
financing patterns of top 100 corporations in ten developing countries in the 1980s. The basic
conclusions are that first, the determinants of capital structure of corporations in developing
countries follow an inverse pecking order theorem as the corporations rely heavily on external
financing, bulk of which is short term finance. Secondly, top corporations in developing
countries rely more heavily on equity issues than corporations in developed economies. In most
developed economies, large issues of stocks by corporations are only done in periods of high
takeover activity, while the developing corporations use the proceeds from equity to finance
their regular investments. The study further revealed that government play substantial role in
stock market formation and development in developing countries. The government pursues pro-
equity financing policies and limit debt and equity of firms. In addition, according to the study,
existence of global international markets gives a boost to stock market in less developed
countries (LDCs).
The objectives study made by Omet andMashharawe (2002) examined the nature and
determinants of capital structure choice of quoted non-financial firms in Jordan, Kuwait, Omani
and Saudi from the period 1996 to 2001. The results show that firms in these countries have
quite low leverage ratios. The authors therefore conclude that the empirical results indicate that
the financing decision of the firms studied can be explainedby the determinants suggested by
the mainstream corporate finance models.One of the recent empirical studies on determining the
factors affecting capital structure in developing countries havebeen attempted by Booth et al.
(2001). In their studies, a sample consisting of 10 developing countries wereanalyzed. From
their analysis, the authors have concluded that the variablesthat explain the capital structures in
developed nations are also relevant in the developing countries irrespective of differences in
institutional factors across these developing nations.
According to the studies, Rajan and Zingales was focused to explaining thecross-sectional
differences within countries. Four factors; tangibility of assets, the market tobook ratio (as
proxy of growth), firm size and profitability were tested to see its influences on leverage. A
cross–sectional basic regression model of leverage was developed with four of the factors
mentioned above as independent variables. The analysis showed that a one standard deviation
increase in tangibility, the market to book ratio, log of sales and profitability changed book
leverage by 23%, -37%, 23% and –11% respectively.They are noted as follows the across the

29
countries, the asset tangibility was positively correlated with leverage for all the countries as
theory supported the notion that firms having more fixed assets in their assets mix will use that
as collateral to get more loans or debt. The market to book ratio seemed to be negatively
correlated with leverage except for Italy. Having high market value of the stocks would enable
firms to issue more stocks and not seeking debt. Size of firm was positively correlated while
profitability was negatively correlated with leverage in all countries except Germany.
According to Liu (1999) conducted a study on determinants of corporate capital structure
fromlisted companies in China between the period 1992 and 1997. He Using the OLS
regression, the long-term debt ratio wasexamined to see whether there were any relationship
with industry classifications, firm size, proportion of tangible assets, profitability, growth rate of
assets and ownership concentration. The results indicated that debt ratio are positively related to
firmsize, asset tangibility and growth rate and negatively related to ownership structure.
The study conducted by Huang and Song (2006) examined the determinants of capital structure
in Chinese listed companies in order to investigate whether firms in the largest developing and
transition economy of the world entertain any unique characteristics in their capital structure
choice. The paper employed a new database containing both market and accounting data of
1216 Chinese quoted companies from 1994 to 2003. Six measures of leverage are were used in
the study such as book long term debt (LD) ratio, book total debt (TD) ratio, book total
liabilities (TL) ratio, market long term debt (MLD) ratio, market total debt (MTD) ratio and
market total liabilities (MTL) ratio together with expressed capital structure determinants such
as ROA, Size, tangibility, tax, growth, ownership structure and volatility. The data were
analyzed using the Ordinary Least Square (OLS) regression method and the Tobit model. The
empirical results showed that as in other countries, leverage in Chinese listed firms increase
with firm size and fixed assets and decreases with profitability, non debt tax shields, and growth
opportunity managers shareholdings. The study also revealed that state ownership or
institutional ownership has no significant impact on capital structure of Chinese companies.
However, Chinese firms tend to have much lower long-term debt as compared to those in
developed economies.
A study conducted by Naveed Ahmed et.al... (2011) investigates the impact of firm level
characteristics on performance of the life insurance sector of Pakistan over the period of seven
years. For this purpose, size, profitability, age, risk, growth and tangibility are selected as
explanatory variables while ROA is taken as dependent variable. The results of Ordinary Least
Square (OLS) regression analysis revealed that leverage, size and risk are most important
30
determinant of performance of life insurance sector whereas ROA has statistically more of
insignificant relationship with, tangibility of assets.
Salawu (2007) examine an empirical an empirical analysis of the capital structure of 50 selected
non-financial quoted companies in Nigeria between the period 1990 and 2004. The study
investigates the main determinants of the capital structure of the selected quoted firms in
Nigeria. The study employed two different analytical techniques namely the descriptive
statistics and the inferential statistics (panel data econometrics techniques) in analyzing 47
secondary data obtained from the annual reports of the selected companies and reports of the
Nigerian Stock Exchange. The descriptive analysis used inevaluating the selected variables
were the mean, mode, median, range and standard deviation. The pooled ordinary least square
(OLS) model, Fixed Effects model and Random Effects model were used in the analysis of data.
The study also excluded the financial quoted companies. The empirical results show that debt
financing for listed companies in Nigeria for the period studied corresponds mainly to a short-
term debt nature. Leverage was found to be negatively correlated with profitability. The size of
the firms was however found to be positivelycorrelated with total debts, which according to the
author, suggests that large firms can better support higher debt ratios than small firms can.
According to the study of VelnampyandNiresh (2012) examines the Relationship between
capital structure and profitability of ten (10) listed Srilank banks for the period (2002 -
2009).The results showed that there is a negative association between capital structure and
profitability. Furthermore, the results also suggest that 89% of the total assets in banking sector
of srilank are represented by debt, confirming the fact that banks are highly geared institutions.
The findings are similarfrom the previously conducted studies.
The study conducted by Eriotis et al (2002) investigated the association between debt to equity
ratio and entity‘s profitability. They also discovered that those entities that prefer to finance
their investment activities using equity capital are more profitable than firms who finance by
using borrowed funds.
The study conducted by Adaramola, Suleiman and Fapetu (2005) aimed at establishing a
realistic relationship between the capital structure and corporate performance of selected quoted
firms in Nigeria. The study used panel data from fifty quoted firms for the year 2002. The data
arefurther built into three different panels. Panel one comprised of data from both banking and
non-banking firms, panel two has data from 25 non-banking firms while panel three has data
from 25 banking firms. The study employed the ordinary least square (OLS) regression method

31
of estimation to analyze the variables used i.e. Earnings per share (EPS) on leverage ratio,
weighted average cost of capital and business risk. The study revealed that capital structure has
no significant impact on the value of non-banking firms as all explanatory variables used in the
panel for non-banking firms were not statistically significant from zero. On the other hand, the
result showed that the value of the banking firms was positively affected by its capital structure.
According to the authors, this result suggests that the concept of optimal capital structure is not
applicable to the Nigerian banking institutions.
A study conducted by Pratomo& Ismail(2006) investigating the performance and capital
structure of 15 Malaysian Islamic banks in the period(1997 to 2004) found out that the higher
leverage or a lower equity capital ratio is associated with higher profit efficiency. Their findings
were consistent with the hypothesis which proposes that, a high leverage tends to have an
optimal capital structureand therefore it leads to producing a good performance.Siddiqui and
shoaib (2011) came up with the same results after analyzing capital structure and performance
in Pakistani banks.
According to study conducted by Saeed, (2013) which assessed the impact of capital structure
on the performance of banks in Pakistani for the period 2007 to 2011 found a positive
relationship between determinants of capital structure and performance of banking industry. The
performance was measured by Return on assets (ROA), Returnon equity (ROE) and earnings
per share (EPS). Determinants of capital structure included long term debt to capital ratio, short
term debt to capital ratio and total debt to capital ratio.
When come to Ethiopia, very few studies are conducted pertaining to capital structure according
to the researcher knowledge, such as:
Bayeh(2011) this study is to investigate important firm-level determinants of capital structure
on Ethiopian insurance companies. The study employs panel regression model. The results
show that growth, profitability and age of the firm were found to have significant influence on
Ethiopian insurance companies‘ capital structure. Liquidity and business risk were also
significant for long term debt and total debt ratio respectively. However, among the
hypothesized capital structure determinants asset tangibility and size of the firm werefound to
have statistically insignificant contribution on capital structure of Ethiopian insurance
companies.
32
Amanuel(2011) study is examining the determinants of capital structure evidence from
manufacturing share companies. The researcher used seven explanatory variables; tangibility,
non-tax shields, growth, earning volatility, profitability, age and size of the firm were regressed
against the dependent variables of total debt ratio, short term ratio and long term debt ratio. In
connection of this, a sample of 12 companies were taken and secondary data was collected from
audited financial statements of selected companies for the period of five years (1996- 2002EC).
Stratified sampling design was employed and companies were selected based on simple random
to represent differentindustry sectors (strata) within manufacturing share companies. Data was
thenanalyzed on quantitative basis using multivariate OLS regression.The results show that
tangibility, non debt tax shields, earning volatility, profitability, and size of the firm variables
are the significant determinants of capital structure of Addis Ababamanufacturing share
companies at least one out of the three models for capital structureemployed in the study. While
no clear and statistical proved relation are obtained for thevariables growth of the firm and age
of the firm in any of the capital structure models.
Yuvarajsambasivam and Abate Gashaw (2013) the study examine the performance of insurance
companies in Ethiopia. This paper examined the effects of firm specific factors (age of
company, size of company, volume of capital, leverage ratio, liquidity ratio, growth and
tangibility of assets) on profitability proxies by Return on Assets. Profitability is dependent
variable while age of company, size of company, volume of capital, leverage, liquidity ratio,
growth and tangibility of assets are independent variables. The sample in this study includes
nine of the listed insurance companies for nine years (2003-2011). Secondary data obtained
from the financial statements (Balance sheet and Profit/Loss account) of insurance companies,
financial publications of National Bank of Ethiopia are analyzed. Fromthe regression results;
growth, leverage, volume of capital, size, and liquidity are identified as most important
determinant factors of profitability hence growth, size, and volume of capita are positively
related. In contrast, liquidity ratio and leverage ratio are negatively but significantly related with
profitability. The age of companies and tangibility of assets are notsignificantly related with
profitability.
Shibru (2012) who is investigates the relationship between leverage and firm specific
(profitability, tangibility, growth, risk, size and liquidity) determinants of capital structure
decision, and the theories of capital structure that can explain the capital structure of banks in
Ethiopia. In order to investigate these issues a mixed method research approach (quantitative
and qualitative) is utilized, bycombining documentary analysis and in-depth interviews. More

33
specifically, the study uses twelve years (2000 - 2011) data for eight banks in Ethiopia. The
findings show that profitability, size, tangibility and liquidity of the banks are important
determinants of capital structure of banks in Ethiopia. However, growth and risk of banks are
found to have no statistically significant impact on the capital structure of banks in Ethiopia. In
addition, the results of the analysis indicate that pecking order theory is relevant theory in
Ethiopian banking industry, whereas there are little evidence to support static trade-off theory
and the agency cost theory. Therefore, banks should consider profitability, size, liquidity and
tangibility when they determine their optimum capital structure.
Those the above researches were focus capital structure determinants on leverage. However, the
relationship betweencapital structure and profitability has not been extensively tested in
research in Ethiopian insurance companies.Furthermore, in developed and developing countries
were conducted thecapital structure and the impact on performance havebeen investigated for
many years, but researchers have found different results with different contexts. Accordingly,
there is no specific result, which can be generalized on the extent of the relationship between
capital structure and firm performance, thus, there is a constant for new research in different
context for achieving a more complete understanding for the dynamics of the capital structure
and firm performance interplay. Therefore, it is very interesting to see the impactsof capital
structure on profitability of Ethiopian insurance companies.
2.6 Conclusion and knowledge gap
The modern capital structure theory was later developed since the publication of capital
structure irrelevance framework by Modigliani and Miller, (1958).They argued that a firm
couldn‘t change the value of its outstanding securities by changing the proportions of its capital
structure. Modigliani and Miller concluded that in a world without taxes, the value of the firm
and also its overall costs of capital wereindependent of its choice of capital structure. A later
study in 1963 by M&M concluded that by incorporating corporate tax, the market value of the
firm is increased and the overall cost of capital is reduced to the point of interest being tax
deductible. Those studies were conducted under different assumptions, which fit into the
particularsituation. Trade-off theory, pecking-order theory, agency-theory and some other
theories areempirical evidences that challenge Modigliani and Miller‘ capital structure studies
(M &M).There were many empirical researches undertaken by scholars on capital structure
choices in the developed nations. One of the classical researches was carried out by Titman and
Wessel‘s (1988) where they studied the theoretical determinants of capital structure by
examining them empirically. However, there were not many research directed towards

34
developing countries that saw the applicability of the theories of capital structure generated
from the developed nations. Most researchers concluded that the factors affecting the developed
countries also explain the capital structure decisions in the developing nations except for Mayer.
Since Mayer uses the aggregate flow of funds data instead of individual firm data, he concluded
that the capital structure decisions in the developing nations were different from the developed
nations. According to Mayer, two major drawbacks found in most research, which includes poor
cross-sectional variation in samples, and sample selection bias.
Besides this, as researcher‘s knowledge, there is still few study conducted empirically on this
specific area in the context of Ethiopia especially in insurance companies. Most of studies
conducted in Ethiopia were determinants of capital structure on leverage.The researcher was
seen little study that investigates the impact capital structure determinants on the firm
performance, particularly in Ethiopian insurance industries which is motivated the researcher to
conduct on that area. The study importance emerges from the fact that insurance sector plays a
significant role inenhancing the country economy, and providing critical services for people in
Ethiopia, thecurrent study will empirically implement a comprehensive analytical framework of
the impacts of capital structure determinantson theperformance (profitability) in the context of
Ethiopian insurance industry.
In Ethiopia, a few researches have been investigated determinants of capitalstructure in the
context ofEthiopian insurance companies. Therefore, the current study will be a base for other
studies in the same field, and it will help in adding value to this subject.
Another importance of this study would identified the effect of Leverage, liquidity, Size,
tangibility of assets, Growth opportunities and business risk on performance of Ethiopian
insurance companies. Finally, the current study has beenidentifying the most determinants of
capital structure and its impacts on the performance of Ethiopian insurance industry during the
period 2004-2013.
2.7 Overview of the Ethiopian insurance industry’s
The emergence of insurance business in Ethiopia was closely linked to expatriates and foreign
insurance companies. In addition, expatriates and foreign companies operating in Ethiopia
participated actively in the establishment of the first domestic insurance companies.
According to various sources, the emergence of modern insurance in Ethiopia is traced to the
Bank of Abyssinia, which was established in 1905 as the first Ethiopian Bank. According to
Schaefer (1992:364,368),the bank, which was established under a fifty-year concession granted

35
by Emperor Menelik II(1889-1913) to the national bank of Egypt in march 1905, was
inaugurated in February 1906. According to some sources, Haile Michael kumsa
(1992:30);society of insurance professional (2004:6); and belaiGiday (1987:100),the bank had
been acting as an agent for a foreign insurance company to underwrite fire and marine policies.
However, evidence regarding the exact date the bank became an agent to a foreign insurance
company, the name of this foreign company and its country of origin, and the nature of fire and
marine insurance transactions handled by the bank is lacking and need to be ascertained in the
future.
According to Haile Michael kumsa (1992:30), an Austrian called weinsinger came to Ethiopia
in 1923 to serve as an agent for a Swiss company called La Baloise fire insurance company. A
source indicates that Baloise paid the first fire loss on a warehouse and a shop in 1929.however
,evidence regarding the identity of the policyholder to whomthe claim was paid (an individual
or a company and the amount of claim paid is still lacking and hence needs to be ascertained in
the future.12
2.7.1 Present status and the challenges facing the Ethiopian insurance
industry
The total number of insurance companies in Ethiopia was nine (one public and eight private
insurance companies) by the end of June 2007, two applications for license to establish new
private insurance companies were submitted to the supervisory body in 2007. One of the
companies under formation was lion insurance company, which is a sister company of the lion
international bank which was established in January 2007 with a paid up capital of birr 108
million. The new lion insurance company submitted application for license to NBE in may 2007
to engage in general insurance business with initial paid up capital of about birr 16 million.
The second insurance company under formation is Ethio-life insurance company in the country
remains small compared to some African countries. For example, leaving asideSouth Africa,
Nigeria, Egypt and Kenya that relatively have well developed insurance sectors, there are 17
insurance companies in Tanzania and 20 companies in Uganda.
See also MEDIN,30
th Anniversary publication of the Ethiopian insurance corporation, January 2006,p. 7
Other sources cited the name of the agent as "Muzinger" (see AyaleBezabeh, insurance:Meaning,Historical Development & Economic significance", paper presented at the EIC principal clients seminar, August 1980;FAIR Guide book,25 years anniversary published by the Federation of Afro-Asian insurers and Reinsurers, September 1989,p,86; and BelaiGiday.currency&banking-Ethiopia,September 1987,p.100.
36
2.2.2 The regulatory framework of the Ethiopian insurance industry
Insurance regulation refers to the legal framework (environment) and statutes within which
insurance companies operate in the country. Insurance regulation lays the legal framework for
several key functions of insurance business such as licensing, product regulation (policy terms,
conditions, provisions, etc), market conduct, financial regulation, etc.
Through both domestic and foreign insurance companies had been undertaking insurance
business in Ethiopia prior to 1960,there were no insurance laws put in place until the issuance of
the commercial code and the maritime code in 1960.
Moreover, there was no insurance supervisory body despite the increase in the number of
domestic insurance companies in the 1960s.In1970, the first insurance proclamation
(proclamation No.281/1970) was issued. Afterwards, legal notice No.393/1971 (insurance
regulations) was issued in 1971.the issuance of proclamation 281/1970 led to the formation of
insurance council and an office of insurance controller, which were then responsible for
regulating and supervising the insurance business in the country.
The National Bank of Ethiopia (NBE) was formed in 1963 (under order No,30/1963) when it
was found necessary to separate commercial banking and central banking functions. Thus, NBE
and the commercial bank of Ethiopia (CBE) were created as two independent entities. CBE took
over the commercial banking activities of the former state bank of Ethiopia. In the same year,
monetary and banking proclamation (proclamation No, 206/1963) was issued to provide for the
regulation of the monetary and banking systems of the country.
Accordingly, NBE, among other things, was given the power the license and supervise banks.
NBE started its operation in January 1964 and since the it has remained to be the central bank of
Ethiopia and the supervisory body of the banking sector.
In the 1976, the provisional military administrative council (PMAC) issued another monetary
and banking proclamation, proclamation No.99/1976. Under the provisions of this
proclamation, one of the functions of NBE was to supervise, regulate and control the operations
of the banks and other financial institutions. Thus, the bank became responsible for the
regulation and supervision of not only banks but other financial institutions as well, which
included the insurance industry. Accordingly, following proclamation 99/1976, the bank set-up
and organized" insurance inspection division" to discharge its supervisoryresponsibilities. Thus,
it is after the issuance of proclamation No.99/1976 that the national bank of Ethiopia started
supervising the insurance sector.

37
Following the downfall of the Marxist Regime in 1991, the transitional Government of Ethiopia
(TGE) issued in 1994 proclamation No, 83/1994-monetary and banking proclamation-(repealing
the earlier monetary and banking proclamation,99/1976) to reorganize the bank according to the
market- based economic policy. Consequently, the powers and duties of the bank, as stated in
proclamation No, 83/1994, including the following:
License, supervise and regulate banks, insurances and other financial institutions.
Promote and encourage the dissemination of banking and insurance services throughout
the country.
Prepare periodic economic studies, together with forecasts of the balances of payments,
money supply, prices and other relevant statistical indicators of the formulation and
determination by the bank of monetary, saving and exchange policies.
Make short and long term refinancing facilities available to banks and 3their financial
institution.
3HailuZeleke, ( 2007), insurance in Ethiopia historical development, present status and future challenges.

38
Chapter Three
3 Research Methodology
This Chapter discusses the methodology that provides a detailed direction about the methods
that the author uses to conduct the research. This is to enable good understanding of what
methodology is all about. Jankowicz (1991), defines methodology in respect to research as ‘the
analysis of, and rational for, the particular method or methods used in general”. Given the
above definition, we can simply say methodology of the study is all about the procedures
employed in carrying out the research. This chapter explains the research design, source and
methods of data collection, methods of data analysis, model specification and definition
variable and measurement.
3.1 Research design
Research design is the program that guides the researchers in the process of collecting,
analyzing and interpreting the data. Therefore, the nature of problem and objective of any study
usually determine the type of research design adopted by researcher. A choice of research
design reflects the priority of a researcher about the dimensions of the research process and
methods. The objectives of this research were to investigate the determinants capital structure
and its impacts onthe performanceof Ethiopian insurance companies. To analyze in this study,
the researcher adopted descriptive research method analysis.
The purpose of this paper is to determine the relationshipbetween determinants capital structure
factors as independent variablesand performance (ROA) as dependent variable. Therefore, the
quantitative research method is the well suited method for this study. This study aims to develop
hypothesis and theoretical framework, which can only be examined by quantitative measures.
The other reason for selecting this method was the support of numerous literatures on the
relevant studies, where they employ quantitative methods to investigate their research problems
and verify their hypothesis.
3.2 Sources data
According to Ghauri and Grönhaug, (2005), ―research design provides a plan or a framework
for data collection and its analysis, which contains the research method and the priorities of the
researcher‖.The data for this study was gathered from the audited annual financial report
published by the listed nine (9) insurance companies. The annual data for the all listed
companies during 2004 to 2013 are used in order to assess the determinants capital structure and
its impact on theperformance of Ethiopian insurance companies. Besides this other sources like

39
annual report, magazines, brochures, journals, newspapers, websites, etc. have also been chosen
whenever found necessary. This paper is based on secondary data collection.The sources of data
for this study are Balance sheets and Income Statements of companies over 10 years period
from 2004 still 2013, which are mainly extracted from National Bank of Ethiopia, which can
provide comprehensive database for all insurance companies.
3.3 Study population and sampling technique
The population of this study consist all Ethiopian insurance companies. Currently, seventeen
insurance companies were working in Ethiopia and the researcher believe that, for meaningful
analysis, there was no need to sample from the seventeen insurance companies as they are
already few in number to collect information over the period of 2004- 2013. The length of time
in this study was10 years from 2004-2013 due to the researcher intention to provide the
reliableand most up-to-date result. However, the remaining insurance companies did not have
the required period information. Due to this reason, the year service below 10 years is not
included in sample frame to make panel data model structured.
Therefore, those insurance companies, which were established after 2005 and started to provide
financial statement in the succeeding fiscal year were not included in this study because this
study incorporated only insurances that have financial statements for the year, 2004, and
onwards.Therefore, only nine insurance companies information were used in this study to examine
the impacts of capital structure on performance of Ethiopian insurance companies.
No Name of the insurance company Date of Establishments
1 Ethiopian insurance company 1975
2 National insurance company 1994
3 Awash insurance company 1994
4 Nile insurance company 1995
5 Africa insurance company 1995
6 Nyala insurance company 1995
7 Global insurance company 1997
8 The united insurance company 1997
9 Nib insurance company 2002
Table 3.1 sample of Ethiopian insurance companies

40
3.4 Method of data analysis and Presentation
Panel data is the combinations of cross-sectional and times series data. It is common in
economics since it provides massive source of information about economy. Panel data is also
called pooled data, micro panel data, longitudinal data, event history analysis and cohort
analysis (Gujarati, 2003).Analysis of panel data is the subject of the one of most active bodies in
econometrics. Besides, other benefits of panel data, researchers have been able to use time
series and cross-sectional data to examine issues that could not be studied in either time series
or cross-sectional settings alone (Greene, 2007).According to Baltagi (2005), by combining
time-series of cross section observations, panel data give more informative data, more
variability; less collinearity among the variables and more efficiency.
After the data were collect, the researcher to used Stata version 12 software to analyze the raw
data. In this study the researcher employed like, descriptive statics,the Pearson correlation
matrix, classical linear assumption and the regression analysis.
3.5 Model Specification
In the first relationship, leveragelevel represents as dependent variable, and the determinants of
capital structure are the independent variables. Namely, growth opportunities, firm's size, firm's
risk, liquidity and business risk.The secondstudy implies six independent variables to identify
what were determinant capitalstructure and its impacton firm performance (ROA) that includes
firm leverage, growth, firm‘s size,tangibility of fixed assets,liquidity and business risk as
independent variables and performance (ROA) the firm as dependent variable.
The model is specified on an empirical framework using the determinants mentioned for this
study to investigate the impacts capital structure on performance of Ethiopian insurance
companies. The researcher base models take the following form:
Yit = α + βXit + μit
Where:
Yit - is dependent variable.
α - is the intercept (constant variable).
Xit- is independent variable.
μit- are the error terms.
i - The number of firms and
t - The number of time period
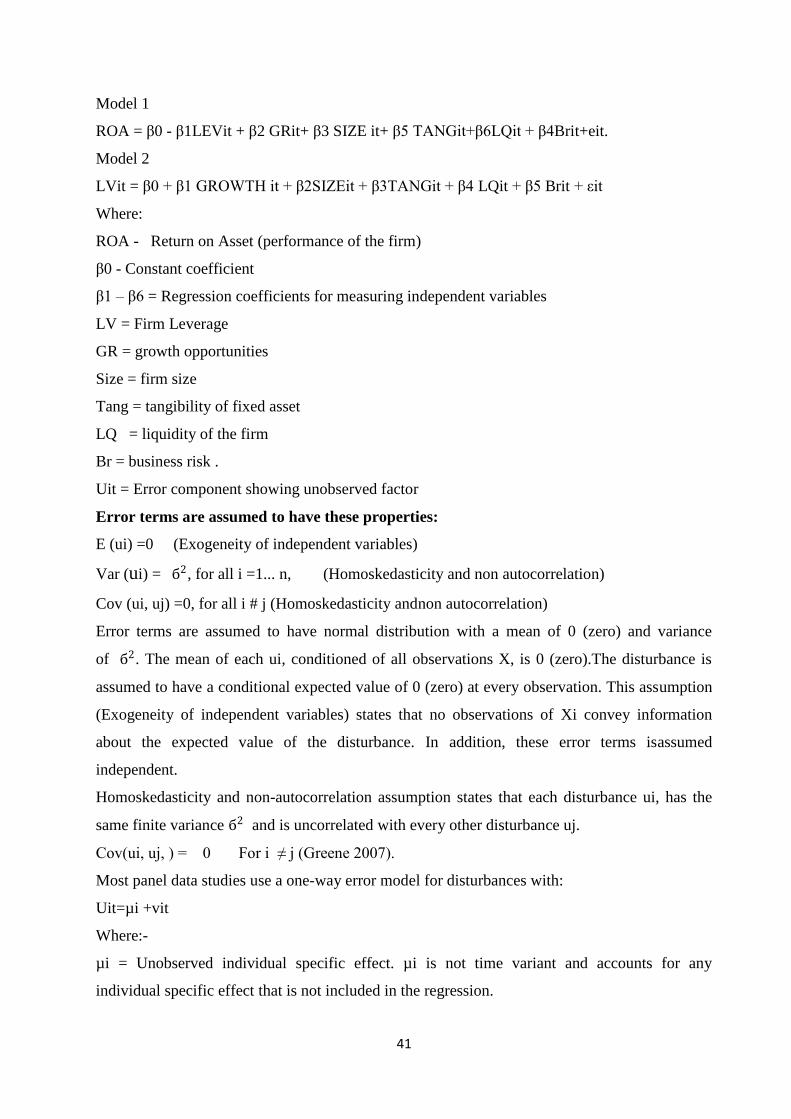
41
Model 1
ROA = β0 - β1LEVit + β2 GRit+ β3 SIZE it+ β5 TANGit+β6LQit + β4Brit+eit.
Model 2
LVit = β0 + β1 GROWTH it + β2SIZEit + β3TANGit + β4 LQit + β5 Brit + εit
Where:
ROA - Return on Asset (performance of the firm)
β0 - Constant coefficient
β1 – β6 = Regression coefficients for measuring independent variables
LV = Firm Leverage
GR = growth opportunities
Size = firm size
Tang = tangibility of fixed asset
LQ = liquidity of the firm
Br = business risk .
Uit = Error component showing unobserved factor
Error terms are assumed to have these properties:
E (ui) =0 (Exogeneity of independent variables)
Var (ui) = б2, for all i =1... n, (Homoskedasticity and non autocorrelation)
Cov (ui, uj) =0, for all i # j (Homoskedasticity andnon autocorrelation)
Error terms are assumed to have normal distribution with a mean of 0 (zero) and variance
of б2. The mean of each ui, conditioned of all observations X, is 0 (zero).The disturbance is
assumed to have a conditional expected value of 0 (zero) at every observation. This assumption
(Exogeneity of independent variables) states that no observations of Xi convey information
about the expected value of the disturbance. In addition, these error terms isassumed
independent.
Homoskedasticity and non-autocorrelation assumption states that each disturbance ui, has the
same finite variance б2 and is uncorrelated with every other disturbance uj.
Cov(ui, uj, ) = 0 For i ≠ j (Greene 2007).
Most panel data studies use a one-way error model for disturbances with:
Uit=µi +vit
Where:-
µi = Unobserved individual specific effect. µi is not time variant and accounts for any
individual specific effect that is not included in the regression.

42
Vit: -Remainder disturbance; it varies with individual and time and is considered the usual
disturbance in the regression.
The linear model in panel data could be identified as in the following relationship:
Yit =βit xit + uit, i=1 ......, N; t =1... T
The coefficient parameter βit in, the previous relationship reflects the effects of Xit in period t
for the unit i. Ideally, many empirical studies assume that the βit is constant for all units and
periods, except the intercept term.
Yit = α + βit + uit ; i=1......, N; t=1... T
The relationship above shows that the intercept is constant for all units and periods.
3.5 Definition of variable and measurements
The aim of this thesis was to empirically investigate the determinants of capital structure and its
impacton the performance Ethiopian insurance companies during the period 2004 - 2013. Since,
the researcher wants to find relationships between determinants capital structure and it‘simpact
on the performance of the insurance companies of the firms, the best choice is to do regression
analysis. Therefore, the researcher divides the variables into two groups, which are dependent
and independent of the variable.
According to researcher research question, and objective, researcher decided that measurements
of firm performance (ROA)are dependent variables; firm's leverage, growth opportunities, size
of the firm, tangibility of fixed asset, liquidity and business risk are independent variables.
3.5.1 Dependent Variables
The first hypothesis describes the determinants of capital structure in Ethiopian insurance
companies. Leverage (LEV) was as dependent variable while growth opportunities,
size,tangibility, liquidity and business risk are as independent variables.
Lev =Total liabilities
Total assets
To see the impacts of capital structure determinants on the firm performance the researcher uses
one accounting based measurements of financial performance as dependent variables, which is
Return on Asset (ROA) to determine the firm specific factors on profitability of the firm.
‗‗ROA is good internal management ratio because it measures profit against the entire assets a
division uses to make those earnings. Due this reason, it a way to evaluate the division‘sof
profitability and effectiveness. It also more appropriate here because division managers seldom
43
get involved in raising money or in deciding the mix between debt and equity‖(Kristy & Susan,
1984).
ROA provides good information about a firm‘s financial performance in the terms of using
assets to create income. It indicates the percentage of profit that a corporation earns in relation
to its overall resources. Consequently, it is considered as a measure of efficiency. A firm with
high ROA means that it is good at translating assets into profits. So, it is also called a
profitability or productivity ratio (Casteuble, 1997).
This is also the most commonly used performance measure proxies. These accounting measures
represent the financial ratios from balance sheets and income statements. In the literature, a
number of researchers used these accounting based measurements of financial performance such
as Majumdar and Chhibber (1999), Abor (2005), Demstz and Lehn (1985), Gorton and Rosen
(1995), Mehran (1995), Ang, Cole and Line (2000). Furthermore, the researcher chose one
proxy for profitability in this thesis because the researcher wants to investigate whether the
independent variables explained the profitability of the firm measures at the same level or not.
ROA = Net profit after tax
Total assets
This shows how profitable a company‘s assets are in generating revenue.
3.5.2 Independent Variables
The purpose of this study is to examine the impact of capital structure on the performance of
Ethiopian insurance industry the following independent variables are discussed in this section.
Firm’s leverage: - Firm leverage defined as long term-solvency ratio that address the firm‘s
long run ability to meet its obligation (Hillier et.al, 2010). The variable considers the main
variable to express the capital structure which measure by dividing the total liabilities to the of
total assets (king and santor, 2008), Ghosh, 2007), and Weill (2007).
Growth opportunities
Many studies proved that growth opportunities play important role in determining the capital
structure and therefore effect on firm profitability. Myer(1977) discussed that the role of growth
opportunity in effect of the nature and the composition of capital structure, whichhigh growth
opportunities firms most likely will suffer from appearing the debt problem and this will lead to
arise risks accompanying with debt of which the firm gives up the profitable investment
opportunities. In addition, the firm will be relying on the equity sources more than debt a source

44
to face that‘s risks and to finance expectedgrowth opportunities, thus it will reflect positively on
firm performance (Hovakimian, Opler and Titman, 2001).
It is measured assets growth is used by many scholars in their studies and for the purpose of this
research; it is calculated by the following formula.
Assets growth = (Assets of current year – Assets of previous year)
Assets of previous year
Firm size: It is control variable which measure by natural logarithm of total assets (Onaolapo
and Kajola(2010) and King and Santor(2008)). In most previous studies, firm size is expressed
by the logarithm of total assets. This indicator is the most suitable measure of a firm's size.
Total assets aredefined as the sum of net fixed assets, total intangibles, total investments, net
current assets, and other assets. ('Titman &Wessels 1988), state that there is a high correlation
between the logarithm of total assets and the logarithm of sales (about 0.98), and therefore
choosing any of them is a substitute to the other.
Tangible assets: It considers independent variable and measure by dividing the total fixed
assets to total assets Weill (2007) and Margrates and Psillaki(2010).Most previous empirical
studies use a ratio of fixed assets to total assets to measure the tangibility of a firm's assets.
Tangibility assets are considered as collateral and guarantee for creditors when the firm needs
external financing. Tangibility is definedas total fixed assets to total assets. Gross fixed assets
are defined as the sum of total lands and buildings, plant machinery and equipment, and other
fixed assets (Fattouh, Scaramozzino, & Harris 2005).
Liquidity: - Liquidity (short-term solvency) is usually defined as the ability of a firm to pay its
obligations when they become due Laitinen 2002. It is vital for the firm's survival to hold liquid
resources to meet its obligations.In this research, the ratio of current assets to current liabilities,
which is the most suitable measure, willbe uses to reflect the firm's liquidity. It is a widely used
ratio to reflect the firm's solvency.Ozkan 2001 for UK firms and Panno 2003 for UK and Italian
firms use this ratio to assess the firm's liquidity.
Business risk
Standard deviation operating income is considered the strongest factor in measuring business
risk since it determines the ability of the firm to meet its interest charges (Brails ford, Oliver and
Pua,2002) (Ferris & Jones 1979). Also, it is not directly affected by the firm‘s debt level
(Titman & Wessel‘s 1988). It can be measured by the standard deviation of operating income
before interest and taxes divided by total assets. Other studies using this measure include Wald

45
(1999),Kim&Limpaphayom,(1998) and Allen&Mizunot,(1989) for japans firms. Also, in this
study business risk is measuredstandard deviation of operating income before interest and taxes
divided by total assets.
Summary of variable and measurements
The description of each variable and their expected signs are given below in the following
tables.
Variables
Variable
Measurements
Some References Expected
Signs
Firm's leverage Total liabilities
Total assets
Kyereboah-Coleman (2007), Abor
(2005), Titman and Wessels (1988),
king and santor,2008
(-)
Growth opportunities Change in the of total
assets
(Degryse, Goeij, &Kappert, 2010),
Hovakimian, Opler and Titman, 2001
( +)
Business risk Standard deviation of
operating income/Total
Asset
Wald (1999),Kim
&Limpaphayom,(1998)and
Allen&Mizunot,(1989)
( +)
Size Natural logarithm of
total assets
Holmes, 2003; Panno, 2003;
Deesomsak 2004; King and Santor
(2008)).
( +)
Tangibility of fixed
asset
Total fixed assets
Total assets
Titman &Wessels 1988;
Gaud et al.,2005, Fattouh,
Scaramozzino, & Harris 2005
( +)
Liquidity Current assets
Current liabilities
Kila and Mansoor (2009), Ozkan
2001, Laitinen 200
( +)
Dependent variable Measurement
Firm's leverage Total liabilities
Total assets
Return on Asset Profit after tax
Total assets
(Bistrova, Lace, &Peleckienė, 2011
Mehran (1995), Ang, Cole and Line
(2000
Table 3.2 Summary of variable and measurements
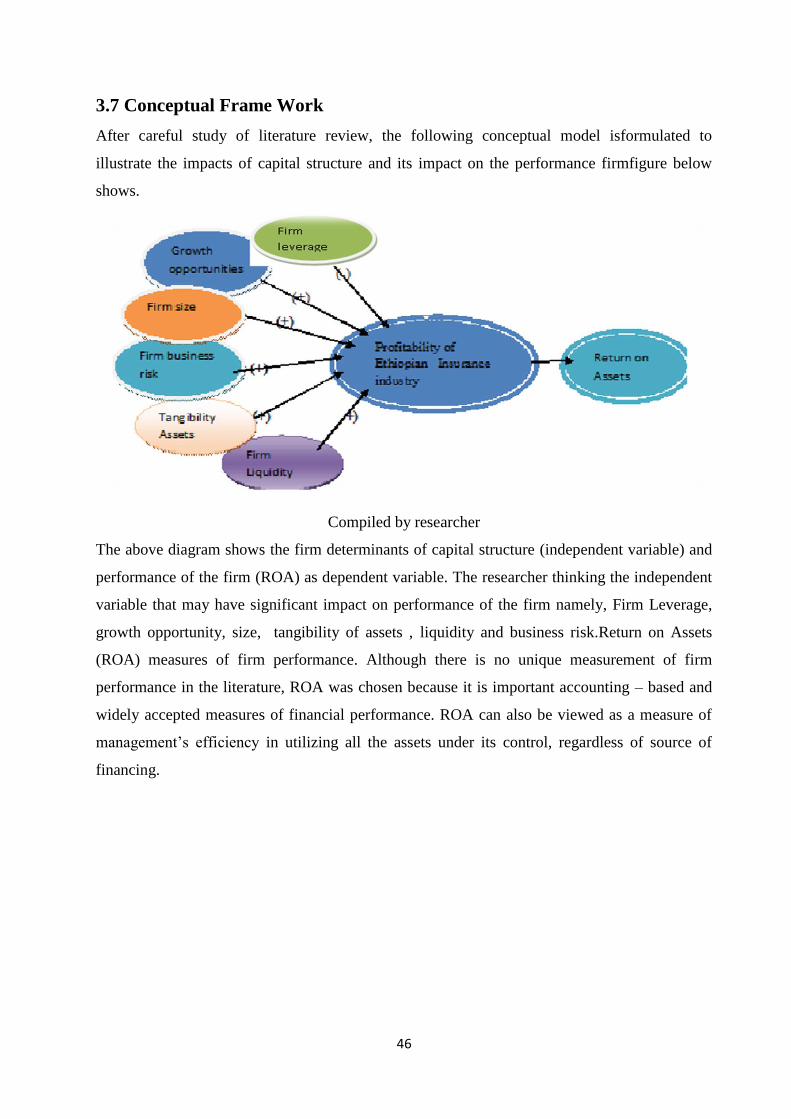
46
3.7 Conceptual Frame Work
After careful study of literature review, the following conceptual model isformulated to
illustrate the impacts of capital structure and its impact on the performance firmfigure below
shows.
Compiled by researcher
The above diagram shows the firm determinants of capital structure (independent variable) and
performance of the firm (ROA) as dependent variable. The researcher thinking the independent
variable that may have significant impact on performance of the firm namely, Firm Leverage,
growth opportunity, size, tangibility of assets , liquidity and business risk.Return on Assets
(ROA) measures of firm performance. Although there is no unique measurement of firm
performance in the literature, ROA was chosen because it is important accounting – based and
widely accepted measures of financial performance. ROA can also be viewed as a measure of
management‘s efficiency in utilizing all the assets under its control, regardless of source of
financing.
47
Chapter Four
4.Data Analysis and Interpretation
This section presents researcher main findings of the determinants of capital structure andits
impact on the performance in the context of Ethiopian insurance industry as well as this chapter
analysis and discussion of the results in comparison to the theories and earlier empirical results
discussed and presented in previous chapters by using specification and misspecifications
classical linear assumption and model specifications. The stated hypotheses will be thoroughly
addressed in this section as to gain insight into the different aspects of capital structure and
firm performance (profitability).The researcher start by looking at the main firm specific factors
over study period and investigates by the determinants of capital structure as independent
variables and the performance level as a dependent variable. It also presents the results of
panel data regression analysis results,data taken from balance sheets and income statements in
Ethiopian insurance industry.
This study used Return on asset (ROA) as dependent variable for measuring firm‘s performance
while independent variables includes firm leverage, growth, firm size, tangibility of fixed assets,
liquidity and business risk.
In order to achieve the research question and objectives of the study,the following hypotheses
are developed.
H01: Leverage has a negative impact on performance of Ethiopian insurance companies.
H02: Growth has a positive impact on performance of Ethiopian insurance companies.
H03: Firm’s size has a positive impact on performance of Ethiopian insurance companies.
H04: A Tangibility asset has a positive relationship with performance of Ethiopian insurance
companies.
H05: Liquidity has a positive relationship with performance of Ethiopian insurance
companies.
H06: There isbeing a positive relationship between business risk and performance of
Ethiopian insurance companies.

48
4.1 Specificationand misspecification classical linear assumption
4.1.1 Descriptive statistics
The researcher used Stataversion 12, software for the analysis method in this study. The
dependent variable was performance (ROA) of the firm while the independent variables
includes; Firm leverage, Growth opportunities, firm size, tangibility of assets, liquidity and
business risk during the period 2004-2013 for Ethiopian insurance companies. Descriptive
statistics showing mean, standard deviation, minimum and maximum values of Ethiopian
insurance companies indicated below.
Variable Obs Mean Std. Dev. Min Max
ROA 90 .0783043 .123769 -.10886 .921629
Lev 90 .520138 .1843834 .02007 .902047
Grow 90 .352805 1.418099 -.9800652 13.16158
Size 90 18.95876 1.090104 16.30014 21.22304
Ta 90 .1410642 .0998923 .000258 .465749
Lq 90 2.633622 1.829073 .103773 11.24678
Br 90 .1602669 .183787 .019253 1.48693
Table 4.1descriptive statistics
* Source: computed from financial statement of Ethiopian insurance companies
As presented in table 4.1, the average value of the performance ratios measured by ROA,
sample Ethiopian insurance industry is 7.8 percent (0.0783043), this implies sample Ethiopian
insurance companies on average earned a net income of 7.8 percent of total asset with a
maximum and minimum value of 0.921629 and -.10886. The standard deviation is 12.4 percent
from theaverage value, which reflects the presence of moderate variation among across the
sampled insurance companies.
On the other hand, the average value of the sample insurance companies leverage is 52 percent
(mean=0.520138) which measured by total debt over total asset this reflects this companies
operates with significant level of leverage and the maximum and minimum value of 9 and 2
percent respectively. It deviates by 18.4 percent from the mean value of the sample of Ethiopian
insurance companies. The growth opportunities of the sample Ethiopian insurance companies
on average 35.2 percent (mean=0.352805) as measured by annual change of total asset. The
maximum value of annualchange of total asset among the sample Ethiopian insurance
companies is 13.16158 maximum and the minimum value is -.9800652.
It shows a standard deviation of 1.418099 from the mean value.

49
The table 4.1 above shows that the average size of the sample Ethiopian insurance companies
191 percent (mean =18.95876) which implies control variable measured by natural log of total
asset which indicates very important for a company to be large in order to have superior
performance. Amaximum and a minimum value of size is 21.22304 and 16.30014 respectively.
The standard deviation indicates that for the sample of Ethiopian insurance companies1.090104
suggests that there is moderate dispersion in the mean value of sample Ethiopian insurance
companies. The amount of mean and standard deviation of tangibility of asset of Ethiopian
insurance companies has the value of 0.1410642 and .0998923 respectively. This implies the
sample period of Ethiopian insurance companies generate revenue from fixed asset 14.1% while
the variation among across the sampled insurance companies low. The mean value of liquidity
is 2.633622 which indicate the amount of cash generated from current assets is 2.633622 with
maximum and minimum value 11.24678 and103773 respectively. It deviates by 1.829073 from
the mean value of the sample of across Ethiopian insurance companies. The amount of mean
and standard deviation of business risk is 0.1602669 and 0.183787 respectively with maximum
value 1.48693 and minimum value 0.019253 of Ethiopian insurance companies. This implies
low deviation from the mean value.
4.1.2 Pearson correlation matrix:
Correlation test is common carrying out in research that relate with regression was determine
whether collinearity exist among the independent variable employed in the work or not,
because it is capable of distorting the true picture of the relationship of dependent variable and
independent variable.The most widely-used type of correlation coefficient is Pearson r, also
called linear or product moment correlation.
According to Brooks (2008), if it is stated that y and x are correlated, it means that y and x are
being treated in completely symmetrical way. Thus, it is not implied that changes in x cause
changes in y or indeed that changes in y cause change in x rather, it is simply stated that there
is evidence for a linear relationship between the two variables, and that movements in the two
are on average related to an extent given by the correlation coefficient. Correlation coefficient
between two variables ranges from +1, (i.e. perfect positive relationship) to (i.e. perfect
negative relationship).It also defined as dependence of one variable upon another. Based on the
Pearson correlation independent variables; firm leverage, growth opportunities, size of the firm,
tangibility of fixed assets, liquidity of the firm as independent variable while the performance
as measured Return on asset(ROA) as dependent variable. The significance calculated for each

50
for correlation is a primary source of information about the reliability of the correlation.
Therefore, the table below presents the correlations among the variables, which data taken
from balance sheet and income statement of Ethiopian insurance companies during the period
2004-2013.
Pearson correlation matrix for insurance company
ROA LV Grow SIZE Ta Lq Br
ROA 1.0000
LV -0.2033 1.0000
Grow 0.0012 -0.0205 1.0000
Size 0.2467 -0.0889 -0.4108 1.0000
Ta -0.1616 0.0428 0.0442 -0.1428 1.0000
Lq -0.1093 0.2134 0.0964 -0.4047 0.0125 1.0000
Br 0.3373 -0.1060 0.1905 -0.3312 -0.0939 0.2550 1.0000
Table 4.2:correlation matrix for insurance company Pearson
*Source: Financial statement of sampled Ethiopian insurance industry and own computation.
ROA was negatively correlated with leverage, tangibility of asset and liquidity for the
coefficient estimates of correlation -0.2033, -0.1616 and -0.1093 respectivelyWhilegrow
opportunities, size and business risk having positive correlation with the firm‘s performance
(ROA) of Ethiopian insurance companies for the coefficient, 0.0012,0.2467 and 0.3373
respectively. As we can see from the table 4.2, when leverage, tangibility of asset and liquidity
are increases, the performance of Ethiopian insurance industry decreases while increase in
growth opportunities, size and business risk were the performance of the sampled Ethiopian
insurance industry also increase.
The highest correlation is indicated between business risk and Return on asset as 0.34
approximately according to above table 4.2.
4.1.3 Unit root test
The study employed a panel research approach in testing the two hypotheses. The approach
combines the attributes of time series and cross-sectional. Therefore,the researcher firstly tested
the data and variables to a unit root test. Therefore, this is necessary in order to ascertain from
the beginning, the researcher is dealing the nature of data and secondly, to know whether or not
the result and invariably the findings can hold in the long run.
Specifically, Augmented Dickey Fuller (ADF) unit root testing was conducted for this purpose
through Stata version 12, software.Given the test results, it indicates that all the variables

51
werestationary at level (See the appendix table 4. 3). Also, they are significant at
1%.Therefore,the results indicatethat, whatever outcome the researcher gets from the
hypotheses testing, the findings can hold in a long-run perspective.
4.1.4 Test normality Data
The most fundamental assumption in data analysis is normality, which considers the benchmark
for statistical methods. Normality refers to the shape of data distribution for an individual metric
variable. Normality is tested using graphical and statistical tests. The simplest test for normality
is a visual check of the histogram that compares the observed data values with distribution
approximating the distribution. This method is problematic for small‘s samples where the
construction of the histogram can disfigure the visual portrayal to such an extent that the
analysis is useless.The main statistical tests for normality which are available in most of the
statistical programs are Shapiro-Wilk test (Hair J.et al.2006). A non –significant result (P-value
of more than 0.05) indicates that the distribution is normal. Mean while, a significant result (P-
value of less than 0.05) indicates that the distribution violates the assumption of normality
which is common in large samples (Pallant, 2005). In this paper the normality test data result
shows the P-value most variable less than 0.05 (see appendix table4.4). Therefore, this model
is violates by normal distributions. This model used large sample size and, therefore, there is no
serious departures from the assumption of normality of the error terms were detected.
4.1.5 Heteroskedasticity Test:
It states that the variance of the error term is constant in regression results (Gujrati, 2004).
E[ϵ/ X] = 0
Heteroskedasticity is to be present in a model if the variances of the error- term of the different
observation are not the same ((Gujrati, 2004). The Breusch-pagan test is considered to identify
any linear form ofheteroskedasticity. This test is an option built into stata. This paper analyze
Breusch-pagan test to check if there is any problem ofheteroskedasticity.
The Breusch-pagan tests of the null hypothesis that the error variances are all equal versus the
alternative that the error variance are a multiplicative function of one or more variables.
The paper made the following hypothesis:
H0:Heteroskedasticity is not present.
H1:Heteroskedasticity is present
After heteroskedasticity test, the result is found P-value is 0.5489(see Appendix table4: 5)
which is more than 5% of level of significance. As a result the researcher does not reject

52
heteroskedasticity. Therefore, this model does not face anyheteroskedasticityproblem, because
the correlation coefficients between independent variable are fairly small.
4.1.6Testing for multicollinearity
Multicollinearity exists when the independent variables are highly correlated. Usually the
multicollinearity is exist if the correlation between two independent variables is more than
0.9(r=0.9 or above) (pallant, 2005).As it appears in the correlation matrix table below, there is
no such high correlation between independent variables.Variance inflation factor VIF is widely
used method to test for multicollinearity; it measures the increasing in the variance of a
coefficient as result of collinearity. Also tolerance (TOL) is a commonly used measure of
collinearity and multicollinearity. It is represented by 1-R*, where R* is the coefficient of the
determination for the prediction of a variable by other independent variables. As a tolerance
value smaller, the variable is more highly predicted by other independent variables.
Variable inflation factor is directly related to the tolerance value (VIF=1/TOL). More than10 for
VIF values or TOL less than 10 indicates high degrees of collinearity or multicollinearity
among the independent variables (Hair j.,Babin B, Anderson and Talham 2006).
Having guidance from the correlation matrix, variables are tested for multicollinearity using
stata software for each relationship testing the values of variance inflation factor (VIF) and
tolerance (TOL).As result, VIF and tolerance results are acceptable and prove that the data is
free of multicollinearity.
Variable VIF 1/VIF
size 1.33 0.749717
lq 1.33 0.753135
br 1.21 0.826004
lv 1.09 0.920186
ta 1.06 0.945698
gr 1.05 0.955023
Mean VIF 1.18
Table4.6
*source: Financial statement of sampled Ethiopian insurance industry and own computation.
As we can see from the above table: 6all VIF and TOL are acceptable and prove that there is no
multicollinearity problem.

53
4.2 Random Effect versus Fixed Effect Models
The question which model is more appropriate FEM or REM is very difficult to answer.
According to Judge et al, (1980) recommend a few suggestions which are related to the context
of the data, and its environment beside the correlation between error component and
regressions. If it is assumed to be uncorrelated, random effects may be appropriate, whereas if
correlated, fixed effects are unbiased and then are more appropriate.
The Hausman (1978) specification test can be used to determine the appropriate method i.e.
fixed or random effects models. However, econometricians seem to be united generally that the
random effects model is more appropriate to be used if individual are drawn randomly from a
large population. By contrast, the FEM is more appropriate in the case of focusing on specific
sets of the firms.
An important test for model specifications is to decide whether the FEM or REM is more
appropriate Maddala, (2001). The null hypothesis is that the residuals in the random effects
(REM) are uncorrelated with the regressions and that the model is correctly specified.
Consequently, the estimated coefficients by the REM or FEM should be statically equal.
Otherwise, the REM estimatoris inconsistent. If the null hypothesis is rejected, then the units
specific effects are correlated with the Regressors or the models are not correctly specified
(Baltagi 2005). In other words, the null hypothesis states that individual effects are not
correlated with the other Regressors in the model. If correlated (Ho is rejected) a randomeffects
model produces biased estimators, so the fixed effects model is preferred (Hun Myoung park
2005).
To put it more simply, the idea behind this test is that if Ui is uncorrelated with xit then there is
no difference between estimates from both fixed effects (within the group‘s estimator) or
random effects (GLS estimators) models.
Ho:ui are not correlated with xit
H1: ui are correlated with xit
Under the null hypothesis, random effects would be consistent and efficient (i.e.Ho is true), but
under the alternative hypothesis, random effects would be inconsistent. The FEM is consistent
whether the null hypothesis is true or not, this means if the hausman test is significant then we
accept the alternative hypothesis that there is a correlation between individual effects and
xit(Baltagi, 2005).
The Hausman test tests the null hypothesis that the coefficients which are estimated by the
efficient random effects estimator are the same as the ones estimated by the consistent fixed

54
effects estimator. Therefore, this includes insignificant P-value, Prob>chi2 larger than 0.05, then
it is more suitable to use random effects. However, in this study have a significant P-value, then
researcher should use fixed effects models.
var (b)
fixed
(B)
random
(b-B)
Difference
S.E.
Lev -.1673747 -.0884367 -.078938 .0334373
Grow .0038993 .002613 .0012863 .0008566
Size .0886285 .0464443 .0421841 .0157781
Tang -.3100963 -.1414094 -.1686869 .0288326
Lq -.0160876 -.0054207 -.0106668 .0094598
Br .3995292 .3139315 .0855977 .0238584
Table 4. 7Hausman specification test
b = consistent under Ho and Ha; obtained from xtreg
B = inconsistent under Ha, efficient under Ho; obtained from xtreg
Test: Ho: difference in coefficients not systematic
chi2 (6) = (b-B)'[(V_b-V_B)^(-1)](b-B)
= 62.20
Prob>chi2 = 0.0000
(V_b-V_B is not positive definite)
According to above table shows Hausman specification test the model has the value of p=
0.0000 for the regression model of dependent and independent variables. This shows fixed
effect model is more appropriate, because the null hypothesis is not accepted.Therefore, this
includes insignificant P-value, Prob>chi2 larger than 0.05, then it is more suitable to use
random effects.. However, if we have a significant P-value, then we should use fixed effects
models.

55
4.3Regression result
Regression analysis is a statistical technique used to test the relationship between one dependent
variable and one or several independent (predictor) variables. Overall, the result derived from
this study show signs that are consistent with theoretical predictions. The regression proved to
be statistically significant at 0.05 percent for each of the performance ratios measured by Return
on asset used in this model.
The researcher accepts the alternative hypothesis for all relationships which indicates that there
is a relationship between the individual effects and regressions (xit). In this case, the Haussman
specification test confirms the superiority of fixed effect models over the random effects model
as we can see above table 4.7.
This regression starts with discussion and testing of the first part hypotheses denoted by (H0);
thisrepresents the relationship between determinants of capital structure and leverage level.
lv Coef. Std. Err. t P>|t| [95% Conf. Interval]
gr .2789283 .0187919 14.84 0.000 .241501 .3163556
size .1477863 .0471603 3.13 0.002 .0538584 .2417141
ta .148796 .339127 3.39 0.001 .4706692 .826923
lq -.036638 .024525 -1.49 0.139 -.0854837 .0122078
br .5063508 .2248668 2.25 0.027 .0584898 .9542118
_cons -2.265744 .9262361 -2.45 0.017 -4.110503 -.4209852
sigma_u .22067866
sigma_e .20678328
rho .53247239 fraction of variance due to u_i)
R= 0.8902
Table 4.8 Regression Result: Fixed effect regression model
Note * Significant at 1% level, ** significant at 5% level.
Source: financial statements of Ethiopian insurance industry.
LVit =-β0 + β1 GROWTH it + β2SIZEit + β3TANGit - β4 LQit + β5 Brit + εit
LVit =-2.266+ 0.279 GROWTH it+0.148 SIZEit+0.149 TANGit-0.0367 LQit+0.056 Brit+εit.
(.9262361) (.0187919) (.0471603) (.339127) (.024525)(.2248668)
The panel fixed effect estimation regression result shows a significant positive relationship
between growth opportunity of the insurance companies and their leverage ratio. This study was
consistent with this finding Ronny and Clairette (2003), Paulo and Zelia (2007).
As we can see from table 4.8 Size is positively associated with leverage. Larger firms are
usually more diversified and have more stable cash flow. So the probability of bankruptcy is
smaller for large firms compared with smaller ones. Furthermore, many studies suggest that

56
large firms prefer to issue long-term debt while small firms choose short-term debt to finance
their projects. And because of the advantage of economies of scale and bargaining power with
creditors, large firms bear lowercosts in issuing debt and equity compared with small firms,
Michaela‘s et al. (1999).
Tangibility of asset was panel data results for the analysis method of fixed effects model results
show a negative and significant impact on profitability of Ethiopian insurance industry.
The effect of tangibility on capital structure according to both trade off theory and pecking order
theory suggests a positive relationship between tangibility and leverage. The result of our
findings also indicates a positive significant relationship between tangibility of assets and
leverage of Ethiopian listed insurance firms. This is line with the findings of Murindet (2003)
and Suto (2003) who find a positively significant relationship for Malaysian firms.
Fixed effects models reveal a negative and insignificant relationship between liquidity and a
firm's performance (ROA).Liquidity As suggested by pecking-order theory, firms prefers
internal financing to external financing. Therefore, firms arelikely to create liquid reserves from
retained earnings. If liquid assets are sufficient to finance the investments, firmswill have no
need to raise external funds.
The regression result of this study shows that there is significant positive relationship between
business risk and leverage ratio of insurance companies.
If a firm‘s operating risk is more volatile than the firm‘s earnings stream, the chance of the firm
defaulting and being exposed to bankruptcy and agency costs is high. Other studies suggest a
positive relationship Jordan et al., 1998; Michaelaset al.,(1999) and Esperancaet al., (2003)
Found a positive relationship between firm risk and both long-term and short-term debt.
Thus, growth, size, tangibility and business risk are determinants of capital structure of the
Ethiopian insurance industry.

57
This section tests the proposed hypotheses for the relationship between determinants of capital
structure as independent variables and a firm‘s performance (ROA) as dependent variable.
Relationship firm determinants of capital structure and firm performance
ROA Coef. Std. Err. t P>|t| [95% Conf. Interval]
Lev -.1673747 .0758574 -2.21 0.030* -.3184903 -.016259
Grow .0038993 .0082162 0.47 0.636 -.0124683 .0202669
Size .0886285 .0211508 4.19 0.000** .0464938 .1307631
Tan -.3100963 .1231772 -2.52 0.014* -.5554778 -.0647148
Lq -.0160876 .0126096 -1.28 0.206 -.0412072 .0090321
Br .3995292 .0728456 5.48 0.000** .2544132 .5446451
_cons -1.494222 .4170297 -3.58 0.001** -2.324988 -.6634563
Sigma u .09529538
Sigma e .0989344
rho .48127097 (fraction of variance due to u_i)
R2 0.3720
No.obs 90
Table 4.9Regression Result: Fixed effect regression model
Note * Significantat 1% level, ** significant at 5% level.
*source: Researcher Data
ROA = β0 -β1 LEVit + β2 GRit+ β3 SIZEit+β4Brit + β5 TANGit+β6LQit + eit.
ROA=-1.494-0.167LVit+0.0039Grit+0.089SIZE it-0.31TANGit-0.016LQit+0.40Briteit.
(0.759) (0.0082) (0.211) (0.073) (0.0123) (0.126)
R2 from the table 4.8, 37.2% variations in the dependent variable can be accounted for by the
independent variables. This means 37.2% of variations in the performance of selected Ethiopian
insurance companies are explained by independent variable. This showed that the independent
variable values have at least 37% significant influence on performance of the Ethiopian
insurance companies. This also indicates that there are other variables that influence the
variations in the level of performance of the firms.

58
ROA=-1.494-0.167LVit+0.0039Grit+0.089SIZE it -0.31TANGit-0.016LQit+0.40Briteit.
This model can be explained as: an increase in leverage by 1% can reduce the performance ratio
of Ethiopian insurance companies by 16.7%. Similarly,tangibility of asset and liquidity can
reduce the performance ratios of Ethiopian insurance companies by 31% and 1.6% respectively.
On the other hand, an increase growth opportunity, size of the firm and business risk by 1% will
respectively leads to the performance ratio increased by 0.4%, 8.9% and 40%.
As presented in table 4.8 hypothesis formulated for this studyresults from fixed effects
regression models as follows; it indicates that firm leverage was significant at 5% (P>|t|=0.030)
level in Ethiopian insurance companies and showing negative impact with firm performance
and accepts the 1st hypothesis. It indicates that performance ofEthiopian insurance companies
was significantly influenced by firm leverage. Growth opportunities was insignificant(P>|t|
=0.636) and positive relationship which the researcher rejects the 2nd
hypothesis. Firm size was
highly significant (P>|t|=000) in Ethiopian insurance companies and positive relationship with
the performance of the firm and the researcher accepts the previous hypothesis. It indicates that
firm‘s size increases firm‘s performance in Ethiopian insurance companies. Tangibility of assets
is significant at 5% (P>|t|=0.014) and negative relationship with the performance of Ethiopian
insurance companies and the researcher accepts the alternative hypothesis. It means that
tangibility does not play a significant rolefor the performance of Ethiopian insurance
companies. Liquidity is insignificant (P>|t| =0.206) and negative relationship with performance
of the firm and researcher reject the 5th
hypothesis. Business risk is highly significant (P>|t|=
0.001) and positive relationship with performance of Ethiopian insurance industry and the
researcher accepts the previous hypothesis.
4.4 Discussion ofthe Result
In this section the effect of each variable tested under this study is discussed and analyzed based
on the theoretical predictions, prior empirical studies and hypothesis formulated for this study.
Firm leverage
As presented in table 4.8, panel data results for the analysis method of fixed effects model
results show a negative and significant impact on profitability of Ethiopian insurance industry
with a regression coefficient of -0.1673747, t-statistic -2.21, P-value of 0.030. This result can be
interpreted in this way that increase high leverages in Ethiopian insurance companies would
lead to low performance. In other words, debt level is over then optimized level and in

59
comparison to advantages of tax shield, incensement of financial distress costs has more
significance. Therefore, this study confirms a negative relationship and then accepts the
previous hypothesis that there is a negative relationship between firm leverage and performance
of the firm.
Theoretical prediction yields no conclusion for the relationship between leverage and
performance. Trade off models argues that profitable firms have great needs to shield income
from corporate tax and should borrow more than less than profitable firms. While pecking order
models theory suggests an inverse relationship between leverage and profitability of the firm.
Firms are assumed to prefer internal financing to external financing in a pecking order frame
work. This preference leads firms to use retained earning first as investment funds and move to
external financing only when retaining earnings are insufficient. This results has been consistent
with Jensen (1986) that if firm leverage acts as a bonding device in terms of forcing managers
to commit free cash flows to service debt, then higher debt will lead to lower funds available for
managers in profitable investments and then lower performance (Singh &Faircloth 2005).
Also Shegill&sarkaria (1999) suggest that the negative relationship between firm leverage and
profitability might be due to the large interest expenses related to debt, stating that if a firm is
highly levered and its rate of return on the company's assets is lower than the cost of debt
capital, this will lead to lower profitability. However, most of empirical studies confirm the
negative relationship between leverage and profitability of the firm such as: Titman & Wessel‘s
(1988),Rajan and Zingales(1999), Wald (1999) etc. in this thesis, researcher use return on assets
( measures as income after interest and tax over total assets) as a proxy for profitability of the
firm. This negative relationship suggests that the agency conflicts between managers and
shareholders are the main reason for such relationship. Possibly Ethiopian insurance firms are
employing a more than appropriate level of leverage in their capital structures thus negatively
influencing performance.Higher leverage ratios lead to higher debt burden, which might then
limit the ability of the firm to take on more risky projects which may also be profitable,Chang,
and Aikleng (2004).
Thestudy results are consistent with the cross-sectional study of (Gleason&Mathur, 2000), who
confirm a negative relationship for financial and operational performance measures for 14
European countries including the UK, France and Germany. They use total debt, ROA, pre-tax
profit margin and growth in sales, justifying this relationship by the agency conflict earlier. The
results also support those in the cross-sectional study by Singh & Faircloth (2005) for US
manufacturing firms which indicate a strong negative relationship between leverage (total debt

60
to total assets) and level of R&D expenditure, which then inversely affects the performance.
Higher leverage leads to lower long term capital investments and that in turn leads to lower
corporate performance.
In addition, researcher results are consistentwith the panel study of (changAikLeng 2004), who
finds that gearing ratio (total debt to total capital) has a negative effect on earnings performance
(return on equity and dividend payout) for Malaysian listed companies. He states that highly
geared firms have statically significant lower financial returns and asserts that debt limits the
ability of the firm to take on more risky projects which may be profitable.
Finally, besidesthis in previous chapter confirms the researcher study, in developing countries.
Growth opportunities
As we have seen from fixed effects analysis method this study confirms that growth opportunity
has positive impact on performance of Ethiopian insurance companies. The panel fixed effect
estimation regression result shows insignificanta positive relationship between growths of
sampled Ethiopian insurance companies and their performance ratio with a regression
coefficient of 0.0038993, t-statistic of 0.47, and p-value of 0.636.
Trade-off theory considers growth opportunities as an indicator for the firm success; these firms
are stronger to face financial distress.Firms with good opportunities have a good reputation in
getting funds, easier access to the finance markets and reflected in better performance for these
firms.According to the agency theory perspective, firms with high growth opportunities have
lower agency costs. These firms might have lower debt ratios due to the fear of debt holders
those firms may forgo valuable investment opportunities and expropriate wealth to their benefit,
and this outcome would be reflected in lower agency costs (Hutchinson &Gul 2006).
Another reason according to the agency theory is that the growth opportunities enlarge
manager‘s use power. This can be treated as an advantage for the company in that these
managers use this power to enlarge the firm‘s performance, although they increase their own
wealth at the same time. Additionally, high-growth firms have easier access to the finance
market, and this can be translated in higher performance, because companies are more likely to
lend to companies presenting a superior growth rate or having future valuable growth
opportunities (Chen, 2004).
Firm size
The result from fixed effect model shows firm size a positive and significant relationship for
performance of Ethiopian insurance industry. Therefore, the researcher accepts the previous

61
hypothesis that there is such a relationship. A possible reason for such relationship in this study
for Ethiopian insurance companies, it is very important for a company to be large in order to
have superior performance. The panel fixed effect estimation result reveals there is significant
positive relationship between size and performance of sampled Ethiopian insurance companies
with a regression coefficient of .0886285, t-statistic of4.19, and P-value of 0.000. The
significance of firm size on firm performance indicates that large firms can earn higher returns
compared to smaller firms, most probably as a result of diversification of investment and
economies of scale.
This result is consistent with previous findings such as Tian and Zeitun(2007) and Gleason
et.al(2000). Earlier studies supports that firm‘s size may have an effect on its performance.
Large firms enjoy number of capabilities such as economies of scale which may influence
financial performance such as Frank andGoyal, (2003). Size is calculated by taking log of total
assets and incorporated in the model to the effects of firm size on profitability of the firms. The
result shows that greater value of total assets enhances the firm performance and is also evident
from earlier researches.
Those who find a positive relationship between firm‘s size and profitability support the
arguments of trade-off theory that size reflects greater diversification, economics of scale
production, greater access to new technology and cheaper sources of funds.
These studies includes Orser, Hogarth-Scott, &Riding (2000),who use the number of
employees and growth revenues changes for Canadian firms to find that less than one quarter of
sampled business reported revenue increases. Also, those who find a positive relationship
supporting the suggestion that investors believe that large companies are less risky include
(Wing &Yiu 1997), who investigate the effect of size (employment) on performance (technical
efficiency) for Chinese firms, and (Tsai &wang 2005), who do similar research for the Taiwan
stock exchange using R&D performance, the total assets and employment.
Asset tangibility
Hypothesis (H5-6): There is a relationship between asset tangibility and performance of
Ethiopian insurance companies.The panel fixed effect estimation result, in this study, shows a
statistical significant negative relationship between tangibility of assets and performance of
Ethiopian insurance companies with a regression coefficient of -.3100963, t-statistic-2.52 and p-
value of 0.014.This means that a sampled Ethiopian insurance company with high ratio of fixed
assets to total asset leads lower performance of the companies, because in Ethiopia lending
62
financial institutions not require fixed assets as collateral to provide debt to those of insurance
companies. The other reasonis the fixed asset of Ethiopian insurance companies not able to
generate revenue.
Therefore, the researcher rejects the null previous hypothesis and accepts the alternative
hypothesis,because against theoretical expectations, the relationship between firm‘s asset
tangibilityis negative and significant at 1% level. This shows that firms with high ratio of
tangibility have a lower performance ratio.However, the negative relationship between firm‘s
asset tangibility and performance is consistent with similar findings of previous
researchersOsuji&Odita, A (2012). According to the researcher knowledge there is no extensive
literature that investigates the relationship between firm‘s asset tangibility and profitability of
the firm. Another possible reason is that the majority Ethiopian insurance companies which are
not considered a capital intensive, i.e., those companies who they not rely mainly on their fixed
assets to make their products and services.
Firm Liquidity
Hypothesis (H5-6): There is a relationship between liquidity and performance of Ethiopian
insurance companies.
A result from fixed effects models shows a negative and insignificant relationship between firm
liquidity and performance of Ethiopian insurance industries. Specifically, fixed effect estimation
with a coefficient of -0.0160876, t- statistic -1.28 and p-value of 0.206 confirmed a negative
relationship between liquidity and performance ratio. The coefficient indicates that an
increasing liquidity leads to lower performance of in Ethiopian insurance companies.
However,pecking order theory suggesting that the more liquid firm would use external
financing due to their ability of paying back liabilities while trade of theory suggesting that high
liquidity position for the firm indicates that this firm is strong enough to face any short or long-
term financial problems and this strong firm can perform better than a weak firm which has
weak liquidity position in its financial statements. From this argument we understand that
Ethiopian insurance companies not depend on short term liabilities, as result the sampled
Ethiopian insurance companies no need of have excess liquidity.Therefore, the researcher
rejects the hypothesis, because it against the prediction theory. This study is consistent with
other researchers such as Ali .A &Zahida.B(2013).

63
Business risk
. The panel fixed effect estimation result, in this study, shows a statistical significant positive
relationship between business risk and performance ratio with a regression coefficient
0.3995292,t-statistic-3.58 and p-value of 0.001, which statistical significant positive on
performance of Ethiopian insurance companies.
The reason for such relationship in the Ethiopian insurance companies is due the theoretical
prediction of the agency theory; the required rate return from investors should be suitable to
their risk in the firm. Shareholders will require high return in order to hold the risk related to the
bankruptcy and financial distress since the debt holders have the priority in the case of
bankruptcy. Also, the debt holders will require such return to hold the risk of agency conflicts
with shareholders and management.Among others some of them, (Ser-Haung and Tylor 1992)
for the UK stock market report a positive relationship, (loudon 2006) for 15 markets,
comprising a mix of developed and emerging markets, (Assaf, 2005) for the Canadian stock
exchange and besides of this the previous chapter confirms their relationship.
Table 4.9 Results summary of relationship between capital structure determinants as
independent variable while performance (ROA) of Ethiopian insurance companies as dependent
variable.
Variable Research results hypothesis Hypothesis
prediction
Approved
Panel analysis
Firm leverage H-1 - YES
Growth
opportunities
H-2
+
NO
Firm size H-3 + YES
Business risk H-4 + YES
Tangibility asset H-5 +
YES(alternative)
liquidity H-6 + NO
The result provides evidence that the four variables i.e. leverage, size, liquidity and business
risk are influence the performance of the firm measure ROA.The result proves that high level of
firm leverage leads to lower ROA. The result supports the intention that because of agency
conflict companies over-leveraged themselves, thus affecting their performance negatively.Also
the result is in line with the argument of pecking order theory that performance of Ethiopian
insurance companies should finance their investment opportunities with retained earnings.
Therefore, a negative relationship could be developed between leverage level and performance
measure. Also the results showing the firm size has a positive significant on performance of

64
Ethiopian insurance companies. Pensrose(1959) argue that larger firms benefit from economies
of scale, which can also have a positive impact on performance. Tangibility of fixed assets in
this study, against the theoretical expectation, the results indicates a negative and significant
relationship between asset tangibility and performance of the firm. This implication that the
sampled of Ethiopian insurance companies were not able to utilize the fixed asset compositions
of their total asset wisely to impact positively on their profitability. The relationship between
business risk and performance (ROA) is significant and positive. The study also confirms this
result. The reason for such relationship in the Ethiopian insurance companies is due the
theoretical prediction of the agency theory; the required rate return from investors should be
suitable to their risk in the firm. On the other hand, the study could not provide evidence that
growthopportunities and liquidity of the firms are determinants of performance in the proxies of
Return on asset (ROA).

65
Chapter Five
5.Conclusion and Recommendation
This chapter concludes thesis by presenting the major findings as well as providing a discussion
and empirical conclusions drawn from the research study. Finally this section finishes by
providing recommendation for future research in this area.
5.1Conclusion
Capital structure has been a much debated topic in the finance field since the Modigliani&
Miller proposition in 1958. Capital structure theories, such as the pecking order and the trade-
off theory emerged into the finance field and many have tried to analyze the implications of
these theories for firms in the market. Capital structure decision have been the most significant
decisions to be taken any business organization for maximization of shareholders wealth and
sustained growth.The objective of this study was limited to the impact of capital structure on the
performance in the context of Ethiopian insurance industries. This paper has applied the panel
data regressions for nine insurance companies in Ethiopia during the period 2004 to 2013. All
insurance companies included in the study if they had the specified period of time, audited
financial statements of ten years. This thesis examined empirically the implication of theory of
capital structure in Ethiopian insurance companies. The results of regression analysis disclose
that firm leverage, growth opportunities, size,business risk, tangibility of assets and liquidity as
independent variable while the profitability the firm (ROA)is dependent variable. The finding of
the research is support pecking order theory, trade-off theory and agency cost theory. The study
shows that the expected sign for is confirmed by actual relation for the model under the study
by performance of the firm (ROA) measures in regression model result.
Firm leverage for the sample study effects negatively and statistically significant at 5%
on firm performance(ROA) of Ethiopian insurance companies. Therefore, this study
confirms a negative relationship between firm leverage and performance of the firm.
This result can be interpreted in this way that high leverage companies would have less
performance. In other words, debt level is over than optimized level and in comparison
to tax shield, incensement of financial distress costs has more significance. There are
other reason may be Informational asymmetry and high costs of external resources and
lack efficient financial market of the market.

66
The outcome provides evidence in support pecking order theory. Pecking order theory
states that higher profitability should enable the company to retain more earnings which
is the preferable source of funding, and as such, the amount of leverage needed by the
company should decrease. This negative relationship indicates that the Ethiopian
insurance companies do not use debt to maximize their performance.
Growth opportunities: The regression result shows positive relationship between a
firm‘s growth opportunities and performance of the firm. But, insignificant. Although
the expected sign positive is confirmed, the hypothesis is rejected on the practical of its
non-significance. The positive relationship might be one of the most alternatives for the
firm, because the investors and shareholders, investing in profitable projects.
Firm size: The result from fixed effect model shows firm size a positive and highly
significant relationship for performance of Ethiopian insurance industry. The
significance of firm size on performance indicates the large firms can earn high return
compared to smaller firms, most likely as results of diversification of investment and
economic scale. Therefore, it is very important for a company to be large in order to
have superior performance. This study supported by trade-off theory, it stated that size
reflects greater diversification, economics of scale production, greater access to new
technology and cheaper sources of funds.
Tangibility assets: the study against the theoretical expectation, because the results
shows a negative and significant relationship between assets tangibility and performance
(ROA) of the firm. This implication that the sampled of Ethiopian insurance companies
were not able to utilizethe fixed asset composition of their total assets sensiblyto impact
positively on their performance.
Liquidity:A result from fixed effects models shows against the theoretical expectation,
because a negative and insignificant relationship between firm liquidity and performance
of Ethiopian insurance industries. Therefore, the researcher rejects the hypothesis due to
insignificant and inverse relationship.
Business risk: This study confirms panel data results for the analysis method of fixed
effects model results show a positive and significant impact on performance of
Ethiopian insurance industry. Therefore, the researcher accepts the previous hypothesis
and Ethiopian insurance industries may reduce their risk by increasing and diversified its
operation. This study is supported by agency theory; it states that the required rate
return from investors should be suitable to their risk in their risk in the firm.

67
5.2 Recommendation
According to the above results which are confirmed by this study and discussed in detail the
previous chapters, the following recommendation can be stated.
In addition of this study, most empirical studies on capital structure they reveal a negative
correlation between leverage and performance of the firm. Possibly sampled Ethiopian
insurance industry is employing a more than appropriate level of debt in their capital structures
thus negatively influencing their performance. This may due to high costs of external resources,
financial distress cost more thantax shield.
The result proves that with the increase in leverage negatively affects the performance
Ethiopian insurance industry. Therefore, the researcher recommends that managers shall
not use excessive amount of leverage in their capital structure, they must try to finance
their projects with retained earnings and use leverage as a last option. Managers must
work to achieve the optimal capital structure level to maximize the firm‘s performance
and try to maintain it as much as possible.
Firm leverage negative relationship suggests that more efforts should be taken
regarding legislative rules and policies to help firms in reducing the dependence on debt
in their capital structure.
The panel fixed effect estimation result, size is a positive significant impact on performance of
sampled Ethiopian insurance industry.
The positive relationship between firm size and performance of the firm suggests
that firm size is positively related to the borrowing capacity because potential
bankruptcy costs make up a smaller portion for large firms.
The positive relationship between business risk and profitability the firm
suggests that Ethiopian insurance industries may reduce their risk by increasing and
diversified its operation.
In generally, the variable that significant direct relationship between the impacts
of capital structure on performance of the firm, the managers should devote their time
and efforts on those variables in order to minimize the weighted average cost of capital
and consequently maximize the welfare of shareholders.

68
5.3 Future research directions
There is no extensive literature in Ethiopia regarding capital structure and financial
performance. Future studies can use other indicators for these determinants and re-
investigates their relationships.
The study has laid some ground work to explore the impact of capital structure on
performance of Ethiopian insurance industries. Further work is required to develop new
hypotheses and design new variables to reflect the firm specific factors to influence on
firm performance related with theory of capital structure.

69
Reference
Abor, J. (2005). The effect of capital structure on profitability: an empirical analysis ofListed
firms in Ghana. Journal of Risk Finance, 6, 438-447.
Abor, J. (2007). Debt policy and performance of SMEs: evidence from Ghanaian and South
Africa firms. Journal of Risk Finance, 8, 364-379.
Akintoye, 1.R (2008): ―Effect of capital structure on firms‘ performance: the Nigerian
Experience.‖ European Journal of Economics, Finance and Administrative
Sciences, 10, pp 233- 243.
Ali Abbas &zahida Bashir (2013), Determinants of Firm‘s Financial Performance: An
Empirical Study on Textile Sector of Pakistan, business and economics journal,
ISSN 2162-4860 2013, Vol. 3, No. 2
Allen, D. E. &Mizunot, H. 1989, "The determinants of corporate capital structures:
Japanese vidence", AppliedEconomics, volol. 21, no. 5, p. 569.
Al-Sakran, S.( 2001). Leverage Determinants in the absence of Corporate Tax System:
The Case of Non-financial Publicly traded Corporation in Saudi Arabia,
Managerial Finance 27, 58-86. Review of Financial Studies 9, 37—68.
Amanuel, M 2011, ‘the determinants of capital structure evidence from manufacturing
share companies of Addis Ababa city‘, Master‘s thesis, Addis Ababa University.
Amidu, M. 2007, "How does dividend policy affect performance of the firm on Ghana stock
exchange", Investment Management & Financial Innovations, vol. 4, no. 2
Anderson. (2002). Capital structure, firm liquidity and growth. NBB working paper No.27
Ang, J.S, Cole, R.A and Lin, J.W (2000): ―Agency costs and ownership structure.‖ Journal of
Finance, 55, pp 81- 106.
Antoniou, A., Guney, Y., and Paudyal, K.( 2002). Determinants of Corporate Capital
Structure: Evidence from European Countries, Working paper, University of
Durham.
Arbabiyan, Ali-Akbar, Safari, & Mehdi. (2009). The effects of capital structure and
profitability in the listed firms in Tehran Stock Exchange. Journal of
Management Perspective.
Assaf, A, 2005, "Automation, Stock Market Volatility and Risk-Return Relationship:
Evidence from "CATS"", Investment Management & Financial Innovations, vol.
2, no. 3,pp. 136-145.

70
Baltagi, Badi, H., (2005), ―Econometric analysis of Panel data, 3rd edition‖, John wiley and
sons Ltd.
Barton, S.L., Hill, N.C. and Sundaram, S. (1989). An empirical test of stakeholder theory
predictions of capital structure. Financial Management, 18, 1, 36-44.
Bayeh, A 2011, ‗Capital structure determinants: an empirical study on insurance industry in
Ethiopia‘, Master‘s thesis, Addis Ababa University
Bevan, A. and Danbolt, J.( 2002). Capital structure and its determinants in the UK- a
decomposition analysis, Applied Financial Economics 12, 159-170.
Bhaduri, S. (2002). Determinants of corporate borrowing: Some evidence from the Indian
Corporate structure.Journal of Economics and Finance.
Bistrova, J., Lace, N., &Peleckienė, V. (2011). The influence of capital structure on Baltic
corporate performance. Journal of Business Economics and Management, 12(4),
655-669.
Booth, L., V. Aivazian, A. Demirguc-Kunt, and V. Maksimovic. 2001. Capital structures in
developing countries. The Journal of Finance 27(4), (December): 539 -60.
Bradley, M., Gregg, A., Jarrel and Han Kim. (1984). On the existence of an optimal capital
structure: Theory and evidence. The Journal of Finance.39. 857-880.
Brails ford, T. J., Oliver, B. R., &Pua, S. L. H. 2002, "On the relation between ownership
structure and capital structure", Accounting & Finance, vol. 42, no. 1, pp. 1-26.
Brealey, R.A., & Myers, S.C., 2003.Principles of Corporate Finance.7th
edition. Publisher:
McGraw-Hill.
Brigham, E. F. &Ehrhardt, M. C. 1999, "Financial management: theory andpractice",1Ith
ed., International student ed. edn, South-WesternM, ason, Ohio.
Brigham, E. F., Foster, E., & Houston, J. F. 2004, "Fundamental of Financial
Management",10th ed., edn
Brush, T. H., Bromiley, P., &Hendrickx, M. 2000, "The free cash flow hypothesis for sales
growth and firm performance", Strategic Management Journal, vol. 21, no. 4, p. 455.
Bryman, A., & Bell, E. (2007).Business Research Methods (2nd Edition ed.). New
York:Oxford University Press Inc.
Brooks, C. (2008). Introductory Econometrics for Finance (2nd ed.). United Kingdom:
Cambridge University press.
Buferna, F., Bangassa, K. &Hodgkinson, L. (2005). Determinants of Capital Structure:
Evidence from Libya.ResearchPaper Series.

71
Burgman and Todd, A. (1996).An empirical examination of multinational corporate capital
structure, Journal of International Business Studies.Vol. 27.Issue 3.553-570.
Capon, N., Farley, J., &Hoenig, S. (1990). Determinants of financial performance: a meta-
analysis. Management Science.
Cassar, G. & Holmes, S. 2003, "Capital structure and financing of SMEs: Australian
evidence", Accounting & Finance, vol. 43, no. 2, pp. 123-147
Casteuble, T. (1997). What today‘s association executives earn. Association Management,49
(4), 53-61.
Chen J. J. (2003) Determinants of capital structure of Chinese-listed companies. Journal of
Business Research 57 (2004) 1341– 1351
Chittenden F, Hall G. and Hutchinson P.(1996). Small Firm Growth, Access to Capital
Markets and Financial Structure: Review of Issues and an Empirical
Investigation. Small Business Economics 8, 59-67.
Copeland, T. E. & Weston, J. F., 1992, "Financial Theory and Corporate Policy", 3rd edition
edn, Addison-Wesley Publishing Company, Reading, Massachusetts
Cowling M. Jagger N. & Murray G. (2008), ―Study of the Impact of the enterprise investment
scheme and venture capital trust on company performance‖, Institute for
Employment Studies revenue and custom research report 44.
Damodaran, A. 1997, "Corporate Finance: Theory and Practice"; 2nd edition edn, John
Wiley & Sons Inc. New York.
Dansetz, H and Lehn, K (1985): ―The structure of corporate ownership: causes and
consequences.‖Journal of Political Economy, 93, pp 1155- 1177.
De-Angelo, H and Masulis, R. W (1980). Optimal capital structures under corporate and
personal taxation. The Journal of Financial Economics.3-29.
Degryse, H., Goeij, P., &Kappert, P. (2010). The impact of firm and industry characteristics
on small firms‘ capital structure. Small Business Economics, 38, 431-447.
Dessi, R., & Robertson, D. (2003). Debt, Incentives and Performance: Evidence from UK
Panel Data. Economic Journal, 113, 903-919.
Dogra, B., and S. Gupta. 2009. An empirical study on capital structure of SMEs in Punjab.
The Journal of Applied Finance 15(3), (March): 60-80.
Ebaid, I. E. (2009). The impact of capital-structure choice on firm performance: empirical
evidence from Egypt. Journal of Risk Finance Incorporating Balance Sheet,
10(5), 477-487.
Eritotis N.P., Frangouli Z. and Neokosmides V.Z. (2002). ―Profit Margin and Capital
72
Structure: An Empirical Relationship‖, Journal of Applied Business Research Vol.
18, No. 2, pp. 85-88.
Fama, E. and French, K. R. (1998), ―Value versus Growth: The International Evidence‖,
Journal of Finance, 53,1975-1999.
Fama, E., &Fench, K. (2002). Testing trade-off theory and pecking order predictions about
dividends and debt. Review of Financial Studies.
Faris AL- Shubiri 2010, ‗Determinants of capital structure choice: A case study of Jordanian
Industrial Companies, An-Najah Univ. J. of Res, vol. 24, pp. 2457-94
Fatemi, Ali M. (1988). The effect of international diversification on corporate financing
policy. Journal of Business Research 16 (No.1) 17-30.
Fattouh, B., Harris, L., &Scaramozzino, P. (2005). Capital Structure in South Korea:A
Quantile Regression Approach. Journal of Development Economics, 76(1), 231-
250.
Ferri, M. G. & Jones, W. H. 1979, "Determinants of Financial Structure: a New
Methodological Approach", Journal of Finance, vol. 34, no. 3, p. 631.
Fischer, E. O, Heinkel, R. and Zechner, J. (1989). Dynamic capital structure choice: Theory
and test.The Journal of Finance.44.19-40.
Frank, M. Z., &Goyal, V. K. (2003). Testing the Pecking order Theory of Capital
Structure.Journal of Financial Economics, 67, 217-248.
Friend, I., & Lang, L. (1988). An Empirical Test of the Impact of Managerial Self-Interest on
Corporate Capital Structure.Journal of Finance, 43, 271-281.
Ghauri, P., Gronhaug, K., (2005), Research Methods in Business Studies.3rded.UK: Prentice
Hall.
Ghosh, C., Nag, R. and Sirmans, C. (2000), ―The pricing of seasoned equity offerings:
evidence from REITs‖, Real-estate Economics, 28, 363-84.
Ghosh, S.2007. Leverage, Managerial Monitoring and Firm Valuation:
Glass, G. V., & Hopkins, K. D. (1984).Test Bank for Statistical Methods in Education &
Psychology (2nd ed.) Englewood Cliffs, N.J.: Prentice-Hall. Smith.
Gleason, K.C., Mathur, L.K. &Mathur, I. (2000). The inter-relationship between Culture,
Capital Structure and performance: Evidence from European Retailers. Journal
of Business Research, 50(2), 185-191.
Gorton, G and Rosen, R (1995): ―Corporate control, portfolio choice and the decline of
banking.‖Journal of Finance, 50, pp 1377- 1420.
Greene, W. 2007, "Econometric Analysis", 6th edn, Prentice Hall.

73
Gropp, R., &Heider, F. (2010).The Determinants of Bank Capital Structure*.Review of
Finance, 14(4), 587-622.
Gujarati, D N 2004, Basic Econometrics, 4th ed., McGraw Hill, Boston
Gujarati, D., 2003, "Basic Econometrics", 4th edn, McGraw-Hill/Irwin.
Hadlock, C., and James, C. (2002), ―Do Banks Provide Financial Slack?‖,Journal of Finance,
57 (3), 1383-1419.
Hair J., Black W., Babin B., Anderson, R., &Talham, R. 2006, "Multivariate Data Analysis".
6th edn, Person Printice Hall, New Jersey.
Hall, G., Hutchinson, P., and Michaelas, N.( 2004). Determinants of the Capital Structures of
European SMEs, Journal of Business Finance & Accounting 31,711-728.
Hamada, R. S. (1969). Portfolio Analysis, Market Equilibrium and Corporation Finance.
Journal of Finance.
Harris, M. &Raviv, A. (1991).The theory of capital structure. Journal of Finance, 46(1),
297-355.
Hatfield, G. B., Cheng, L., & Davidson, W. (1994). The Determination of Optimal Capital
Structure: The Effect of Firm and Industry Debt ratios on Market value. Journal
of Financial And Strategic Decisions
Hausman, J. A. 1978, "Specification tests in econometrics", Econometrical, vol. 46, no. 6, pp.
1251-1271
Heng, T.B., &Tze-San.O. (2011). Capital Structure and Corporate performance of
Malaysian Construction Sector. International Journal of Humanities and Social
Science, 1(2), 28-36
Hillier, D., Ross, S., R. W. Westerfield, J. Jaffe, and B. Jordan (2010). "Corporate Finance:
European Edition", McGraw-Hill.
Hoffer, C.W., & Sandberg, W.R. (1987). Improving new venture performance: some
guidelines for success. American Journal of Small Business, 12, 11-25.
Homaifar, G, Ziets, J and Benkato, O. (1994). An empirical model of capital structure :Some
new evidence.Journal of Business Finance and Accounting.Vol. 21 Issue 1.1-14.
Hovakimian, Hovakimian, G and Tehranian (2004). Determinants of target capital structure:
The case of dual debt and equity issues.Journal of Financial Economics.71.517-54.
Hovakimian.Opler.and Titman,S.2001, The Debt-Equity Choice, Journal of Financial and
Quantitative Analysis, 36( 1):PP.1-24.
Hun Myoung Park 2005, "Linear Regression Models for Panel Data Using SAS, STATA,
LIMDEP, and SPSS"1The Trustees of Indiana University.

74
Hutchinson, M. &Gul, A. 2006, "The effects of executive share options and investment
opportunities on firms accounting performance: Some Australian evidence",
British Accounting Review, vol. 38, no. 3, pp. 277-297.
Insurance companies 2004 to 2013, ‗Annual report‘, Ethiopian insurance companies, Addis
Ababa.
Jensen, M. &Meckling, W., 1976. Theory of the Firm: Managerial Behavior, Agency Costs
and Ownership Structure. Journal of Financial Economics, 3, p.305-60.
JMacide- Mason, J (1990): ―Do taxes affect corporate financing decisions?‖ Journal of
Finance, 45,pp 1471- 1494ordan.‖ Australasian Accounting, Business &
Finance Journal, 1(4), pp 40-61
Johnson, S. A. 1998. The effect of bank debt on optimal capital structure. Financial
Management 27(1) (Spring): 47-56.
Jordan J., Lowe J. and Taylor P. (1998).Strategy and Financial Policy in UK Small firms.
Journal of Business Finance and Accounting 25 (1), 1-27.
Judge, G., Griffiths, W., Hill, C., Lütkepohl, W., & Lee, T. 1980, "The theory and practiceof
econometrics" Wiley, New York; Chichester.
Kebede, D. (2011) the Determinants of Capital Structure in Ethiopian Small Scale
Manufacturing Cooperatives.Master‘s thesis, Addis Ababa University.
Kester, C. W. 1986. Capital and ownership structure: A comparison of United States and
Japanese manufacturing corporations. Financial Management 15(1): 5-16.
Kim, K. A. &Limpaphayom, P. 1998, "A test of two-tier corporate governance structure: the
case of Japanese eiretsu", Journal of Financial Research ol. 21, no. 1, p. 37.
King,M. and Santor,E.2008.Family Values: Ownership Structure, Performance and Capital
Structure of Canadian Firms, Journal of Banking and Finance,32:2423-2432.
Krenusz, A. (2004). Determinants of capital structure: A comparison between the United
States, Germany and East-Europe. 4th Europe Doctoral Seminar, Faculty of
Economics, Sarajevo.
Kristy, J. E., & Susan Z. D. (1984).Finance without Fear. New York: American
ManagementAssociation.
Kyereboah-Coleman, A. (2007). The impact of capital structure on the performance of
microfinance institutions. Journal of Risk Finance, 8, 56-71.
L.,Aivazian, V., Demirguc-Kunt, A. and Maksimovic, V. (2001). Capital Structure in
developing Countries. The Journal of Finance, 56, 87-130.

75
Laitinen, E. 2002, ""A dynamic PerformanceManagementSystem:Evidence from small
Finnish Technology Companies"".,Scandinavian Journal of Management,vol.
18, no. 1,pp. 65-99
Liu, T. (1999). The determinants of corporate capital structure: Evidence from Listed
companies in China. Working paper.
Loudon, G. F. 2006, "Is the risk return relation positive? Further evidence from a stochastic
volatility in mean approach", Applied Financial Economics, vol. 16, no. 13, pp.
981-992.
Maddala, G. 2001, "Introduction to econometrics"3,r d ed.edn,Chichester:Wiley
MacKie-Mason&smart, 2006. Do taxes affect corporate financing decisions? Journalof
Finance, 45, p.1471-93.
Majumdar, S.K and Chhibber, P (1999): ―Capital structure and performance: evidence from a
transition economy on an aspect of corporate governance.‖ Public Choice, 98,
pp 287- 305.
Margaritis ,D and Psillaki, M.2010. Capital Structure, Equity Ownership and Firm
Performance, Journal of Banking and Finance, 34:621-632.
Mat Kila, S., and Wan Mansoor, W.M. (2009). Capital Structure and Firm Characteristics:
Some Evidence from Malaysian Companies.Munich Personal Re PEe Archive,
No.14616, pp.1-15.
Mehran, H (1995): ―Executive compensation structure, ownership and firm performance.‖
Journal of Financial Economics, 38, pp 163- 184.
Michaelas, N. Chittenden, F. &Poutziouris, P. (1999). ―Financial policy and capital structure
choice in UK SMEs: Empirical evidence from company panel data‖. Small
Business Economics. 12: 113–30.
Minton, B., &Wruck, K. (2001). Financial Conservatism: Evidence on Capital Structure
from low leverage firms.
Modigliani, F. F. & Miller, M. H., 1963.―Corporation income taxes and the cost of capital: a
correction‖, American Economic Review, 53(3), 433–443.
Modigliani, F., and Miller, M. H. (1958,), ―The Cost of Capital, Corporate Finance and the
Theory of Investment‖, American Economic Review, 48, 261-97.
Moen, (1999), "The Relationship Between Firm Size, Competitive Advantages and Export
Performance Revisited", International Small Business Journal, vol. 18, no. 1, p. 53
Murinde, V., J. Agung and A.W. Mullineux.(2004). ―Patterns of corporate financing and

76
financial system convergence in Europe‖. Review of International Economics,
12(4): 693–705.
Muritala, T. (2012). An Empirical Analysis of Capital Structure on Firms‘ Performance in
Nigeria. International Journal of Advances in Management andEconomics, 115-
124.
Myers and Majluf N.S. (1984). Corporate financing and investment decisions when firms
have information those investors do not have. The Journal of Financial
Economics.
Myers, S. C. 1984. The capital structure puzzle. The Journal of Finance 39(3), (December):
575-92.
Myers, S.1977.Determinants of Corporate Borrowing, Journal of Financial Economics, 5:
147-176.
Naveed Ahmed, Zulfqar Ahmed, Ahmad Usman (2011), Determinants of Performance: A
Case Of Life Insurance Sector of Pakistan, International Research Journal of
Finance and Economics, Euro journals Publishing, Inc. 2011
Onaolapoand Kajola, O.2010. Capital Structure and Firm Performance: Evidence from
Nigeria, European Journal of Economics, Finance and Administrative Sciences,
25:70-82.
Orser, B. J., Hogarth-Scott, S., & Riding, A. L. 2000, "Performance, Firm Size, and
Management Problem Solving", Journal of Small Business Management, vol. 38,
no. 4, pp. 42-58.
Osuji&Odita Anthony (2012),Arabian Journal of Business and Management Review, Vol.
1, No.12; July 2012
Ozkan, A. 2001, "Determinants of Capital Structure and Adjustment to Long Run Target:
Evidence from UK Company Panel Data", Journal of Business Finance &
Accounting, vol.28, no. 1/2, pp. 175-198.
Pallant, J. 2005, "SPSS survival manual: a step by-step guide to data analysis using SPSS for
Windows (Version 10 and 11)", 2ed ed. edn, Open University Press,
Buckingham
Pandey, M., (2001). Capital structure and the firm characteristics: evidence from an emerging
market, working paper, Indian Institute of Management Ahmed abad.
Panno, A. (2003). "An empirical investigation on the determinants of capital structure: the
UK and Italian experience". Applied Financial Economics. 13. 97-112.
Paulo J. MaçãsNunes&Zélia M. Serrasqueiro (2007), ‗Capital Structure of Portuguese

77
Service Industries: A Panel Data Analysis‘, The Service Industries Journal,
27:5, 549-562
Penrose, E. (1959). The Theory of the Growth of the Firm.
Petersen, M. A. and Rajan, R. G. (1994). The benefits of lending relationships: Evidence
from small business dat. Journal of Finance, 49, 1, 3-37.
Petersen, M.A. &Rajan, R.G. (1994). ―The benefits of lending relationships: Evidence from
small business data‖
Phillips, P. A. &Sipahioglu, M. A. 2004, "Performance implications of capital structure:
evidence from quoted UK organizations with hotel interests", Service
Industries Journal, vol. 24, no. 5, pp. 31-51.
Pratomo WA and Ismail AG., (2006). ―Islamic Bank Performance and Capital Structure
University Library of Munich, Germany‖, MPRA, 6012.
Rajan, R. and Zingales.L. (1995). what do we know about capital structure? Some evidence
from international data. Journal of Finance.50.1421-1460.
Roden, D., &Lewellen, W. (1995). Corporate capital structure decisions: evidence from
leveraged buyouts. Financial Management.
Ronny Manos &Clairette Ah-Hen (2003), ‗Evidence on the Determinants of Capital
Structure of Non-Financial Corporates in Mauritius‘, Journal of African
Business, 4:2, 129-154
Ross, S.A. (1977). The determination of financial structure: The Incentive-signaling approach
bell. Journal of Economics.8.Spring. 2340.
Saad, N. M. (2010). Corporate Governance Compliance and the Effects to capital Structure.
International Journal of Economics and Financial, 2(1),105-114.
Saeed, M, Gull, A, Rasheed, M (2013). ―Impact of Capital Structure on Banking Performance
(A Case Study of Pakistan)‖, Interdisciplinary Journal of Contemporary
Research in Business, vol 4, no. 10, pp 5-10
Saunders, M., Lewis, P., &Thornhill, A. (2009).Research methods for business students (5th
Edition ed.). Harlow: Pearson Professional Ltd.
Ser-Huang, P. & Taylor, S. J. 1992, "Stock returns and volatility: An empirical study of the
UK stock market", Journal of Banking & Finance, vol. 16, no. 1, pp. 37-59.
Scarbrough, E., &Tanenbaum, E. (1998).Research strategies in the social sciences: a guide
to new approaches: New York: Oxford University Press Inc.
Scott, Jr. 1976, "A Theory of Optimal Capital Structure", the Bell Journal of Economics, vol.
7, no. 1, pp. 33-54.
78
Shergill, J. &Sarkaria,M . 1999," Impact of Industry Type and Firm Characteristics on Firm-
Financial Performance-- Evidence from Indian Industry level"", Journal of
Entrepreneurship, vol. 8, no. 1.
Shibru, W. (2012) Determinants of Capital Structure of Commercial Banks in Ethiopia.
Master‘s thesis, Addis Ababa University.
Shyam-Sanders, L. and Myers, S.C. (1999).‖Testing Static trade-off against pecking order
Models of Capital structure”, Journal of Financial Economics, (51): pp.1421-
1460.
Siddiqui M. &Shoaib A., (2011) ―Measuring performance through capital structure: Evidence
from banking sector of Pakistan‖, African Journal of Business Management,
5(5),1871-1879.
Simerly, R. L., and Li, M. (2000), ―Environmental dynamism, capital structure and
performance: a theoretical integration and an empirical test‖, Strategic
Management Journal, 21, 31-50.
Tian, G.G., &Zeitun, R. (2007). Capital Structure and Corporate performance: evidence from
Jordan. Australian Accounting, Business and Finance Journal, 1(4), 40-61.
Titman, S. &Wessels, R. 1988, "The Determinants of Capital Structure Choice", Journal of
Finance, vol. 43, no. 1, p. 1.
Tsai, K. & Wang, J. 2005, "Does R&D performance decline with firm size?- A reexamination
in terms of elasticity", Research Policy, vol. 34, pp. 966-976.
Umar, M., Tanveer, Z., Aslam, S., &Sajid, M. (2012). Impact of Capital Structure on Firms‘
Financial Performance: Evidence from Pakistan. Research Journal of Finance
and Accounting.
Van der Wijst N. and Thurik R.( 1993). Determinants of Small Firm Debt Ratios: An analysis
of Retail Panel Data, Small Business Economics 5, 55-65.
Velnampy, T. and Niresh, A. (2012), ―The Relationship between Capital Structure &
Profitability‖ Sri Lanka, Global Journal of Management and Business Research
Volume 12, pp 4-8.
Wald, J. (1999). How firm characteristics affect capital structure: an international
comparison. Journal of Financial Research, 22, 161-87.
Weill, L.2008. Leverage and Corporate Performance: Does Institutional Environment
Matter?, Small Business Economics
Wing, C. C. K. &Yiu, M. F. K. 1997, "Firm size and performance of manufacturing

79
enterprisesin P.R. China: The case of Shanghai's.", Small Businesses
conomics,vol. 9, no, 3, p. 287.
Wippern, R. (1996). Financial Structure and the Value of the Firm.The Journal of Finance.
Wiwattanakantang, Y. (1999). An empirical study on the determinants of capital structure of
Thailand firm. Pacific-Basin Finance J.7, 371–403.
Yaregal, B. (2011) Ownership and Organizational Performance: A Comparative Analysis of
Private and State Owned Banks.Master‘s thesis, Addis Ababa University.
Yuvaraj.S&Abate.G (2013):The performance of insurance companies in Ethiopia:
International Journal of Marketing, Financial Services & Management Research,
Vol.2, No. 7.
Zeitun, R and Tian, G.G (2007): ―Capital structure and corporate performance: evidence from

80
Appendix Appendix:1 for Pearson correlation
| roa lv gr size ta lqbr
-------------+---------------------------------------------------------------------------------
roa 1.0000
lv | -0.2033 1.0000
gr | 0.0012 -0.0205 1.0000
size | 0.2467 -0.0889 -0.0004 1.0000
ta | -0.1616 0.0428 0.1003 -0.1428 1.0000
lq | -0.1093 0.2134 0.1486 -0.4047 0.0125 1.0000
br | 0.3373 -0.1060 -0.0361 -0.3312 -0.0939 0.2550 1.0000
Appendix:2Unit root test
Levin-Lin-Chu unit-root test for leverage
-----------------------------------
Ho: Panels contain unit roots Number of panels = 9
Ha: Panels are stationary Number of periods = 10
ADF regressions: 1 lag
LR variance: Bartlett kernel, 6.00 lags average (chosen by LLC)
------------------------------------------------------------------------------
Statistic p-value
------------------------------------------------------------------------------
Unadjusted t -12.6782
Adjusted t* -11.8400 0.0000
------------------------------------------------------------------------------
Levin-Lin-Chu unit-root test for grow
------------------------------------
Ho: Panels contain unit roots Number of panels = 9
Ha: Panels are stationary Number of periods = 10
ADF regressions: 1 lag
LR variance: Bartlett kernel, 6.00 lags average (chosen by LLC)
------------------------------------------------------------------------------
Statistic p-value
------------------------------------------------------------------------------
Unadjusted t -9.0820
Adjusted t* -4.7569 0.0000
------------------------------------------------------------------------------
Levin-Lin-Chu unit-root test for size
-----------------------------------
Ho: Panels contain unit roots Number of panels = 9
Ha: Panels are stationary Number of periods = 10

81
ADF regressions: 1 lag
LR variance: Bartlett kernel, 6.00 lags average (chosen by LLC)
------------------------------------------------------------------------------
Statistic p-value
------------------------------------------------------------------------------
Unadjusted t -7.8531
Adjusted t* -7.8272 0.0000
------------------------------------------------------------------------------
Levin-Lin-Chu unit-root test for tangibility asset
-----------------------------------
Ho: Panels contain unit roots Number of panels = 9
Ha: Panels are stationary Number of periods = 10
ADF regressions: 1 lag
LR variance: Bartlett kernel, 6.00 lags average (chosen by LLC)
------------------------------------------------------------------------------
Statistic p-value
------------------------------------------------------------------------------
Unadjusted t -3.3848
Adjusted t* -2.4443 0.0073
------------------------------------------------------------------------------
Levin-Lin-Chu unit-root test for liquidity
-----------------------------------
Ho: Panels contain unit roots Number of panels = 9
Ha: Panels are stationary Number of periods = 10
ADF regressions: 1 lag
LR variance: Bartlett kernel, 6.00 lags average (chosen by LLC)
------------------------------------------------------------------------------
Statistic p-value
------------------------------------------------------------------------------
Unadjusted t -7.3340
Adjusted t* -4.5816 0.0000
------------------------------------------------------------------------------
Levin-Lin-Chu unit-root test for business risk
-----------------------------------
Ho: Panels contain unit roots Number of panels = 9
Ha: Panels are stationary Number of periods = 10
ADF regressions: 1 lag
LR variance: Bartlett kernel, 6.00 lags average (chosen by LLC)
------------------------------------------------------------------------------
Statistic p-value
------------------------------------------------------------------------------
Unadjusted t -6.8647
Adjusted t* -6.1576 0.0000
------------------------------------------------------------------------------

82
Appendix:3 Normality test
Shapiro-Wilk W test for normal data
Variable | Obs W V z Prob>z
-------------+--------------------------------------------------
roa | 90 0.47682 39.573 8.112 0.00000
Shapiro-Wilk W test for normal data
Variable | Obs W V z Prob>z
-------------+--------------------------------------------------
lv | 90 0.95974 3.045 2.456 0.00702
Shapiro-Wilk W test for normal data
Variable | Obs W V z Prob>z
-------------+--------------------------------------------------
gr | 90 0.26558 55.551 8.860 0.00000
.Shapiro-Wilk W test for normal data
Variable | Obs W V z Prob>z
-------------+--------------------------------------------------
size | 90 0.99001 0.755 -0.619 0.73201
Shapiro-Wilk W test for normal data
Variable | Obs W V z Prob>z
-------------+--------------------------------------------------
ta | 90 0.90230 7.390 4.411 0.00001
Shapiro-Wilk W test for normal data
Variable | Obs W V z Prob>z
-------------+--------------------------------------------------
lq | 90 0.74102 19.589 6.561 0.00000
Shapiro-Wilk W test for normal data
Variable | Obs W V z Prob>z
-------------+--------------------------------------------------
br | 90 0.58753 31.199 7.588 0.0000
Appendix:4Heteroskedasticity test table
Breusch-Pagan / Cook-Weisberg test for heteroskedasticity
Ho: Constant variance
Variables: fitted values of ROA
chi2 (1) = 0.36
Prob>chi2 = 0.5489

83
Appendix:5Hausman test
---- Coefficients ----
| (b) (B) (b-B) sqrt(diag(V_b-V_B))
| fixed random Difference S.E.
-------------+----------------------------------------------------------------
lv | -.1673747 -.0884367 -.078938 .0334373
gr | .0038993 .002613 .0012863 .0008566
size | .0886285 .0464443 .0421841 .0157781
ta | -.3100963 -.1414094 -.1686869 .0288326
lq | -.0160876 -.0054207 -.0106668 .0094598
br | .3995292 .3139315 .0855977 .0238584
------------------------------------------------------------------------------
b = consistent under Ho and Ha; obtained from xtreg
B = inconsistent under Ha, efficient under Ho; obtained from xtreg
Test: Ho: difference in coefficients not systematic
chi2 (6) = (b-B)'[(V_b-V_B)^(-1)](b-B)
= 62.20
Prob>chi2 = 0.0000
(V_b-V_B is not positive definite)
Appendix: 6 fixed effects regression analysis
Fixed-effects (within) regression Number of Obs = 90
Group variable: company Number of groups = 9
R-sq: within = 0.3720 Obs per group: min = 10
Between = 0.3310 avg = 10.0
Overall = 0.2383 max = 10
Date: 08 /05/14 Time: 9:25
Sample2004 to 2010 F (6, 75) = 7.40
corr(u_i, Xb) = -0.7622 Prob> F = 0.0000
------------------------------------------------------------------------------
roa | Coef. Std. Err. tP>|t| [95% Conf. Interval]
-----------------------------------------------------------------------------
lv | -.1673747 .0758574 -2.21 0.030**-.3184903 -.016259
gr | .0038993 .0082162 0.47 0.636 -.0124683 .0202669
Size | .0886285 .0211508 4.19 0.000*.0464938 .1307631
ta | -.3100963 .1231772 -2.52 0.014*-.5554778 -.0647148
lq | -.0160876 .0126096 -1.28 0.206 -.0412072 .0090321
br | .3995292 .0728456 5.48 0.000** .2544132 .5446451
_cons | -1.494222 .4170297 -3.58 0.001** -2.324988 -.6634563
-----------------------------------------------------------------------------
sigma_u| .09529538
sigma_e | .0989344
rho | .48127097 (fraction of variance due to u_i)
------------------------------------------------------------------------------
F test that all u_i=0: F(8, 75) = 3.17 Prob> F = 0.0038
* Significant at 1% level, ** significant at 5% level.

84
Appendix:7Summaries of raw data
Year company ROA Lev Grow Size Tang Lq Br
2004 EIC 0.055172
0.418847
0.071974
20.43477
0.096666
1.845086
0.129119
2005 EIC 0.061455
0.344515
0.144305
20.50427
0.08443
2.31583
0.12045
2006 EIC 0.729491
0.347666
0.037041
20.63907
0.026291
2.370981
1.48693
2007 EIC 0.056164
0.317008
0.130484
20.67544
0.065693
2.539502
0.1015
2008 EIC 0.058505
0.295798
-0.00088
20.79808
0.058636
2.797497
0.089785
2009 EIC 0.066084
0.663019
0.295416
20.79721
0.062935
2.96597
0.089864
2010 EIC 0.071875
0.264375
0.181752
21.05604
0.055905
3.428795
0.069371
2011 EIC 0.068035
0.267901
0.375567
21.22304
0.068426
3.238553
0.058701
2012 EIC 0.162279
0.716927
0.191439
20.75213
0.101416
1.872566
0.094008
2013 EIC 0.11937
0.696444
-0.98007
20.92729
0.116951
1.943235
0.078903
2004 NIC 0.024431
0.649146
0.04643
17.012
0.298791
7.764578
0.428671
2005 NIC -0.04715
0.709919
0.232029
17.05739
0.295979
11.24678
0.409651
2006 NIC 0.058873
0.683433
0.257266
17.26605
0.236809
5.682308
0.332501
2007 NIC 0.063672
0.68159
0.107081
17.49499
0.203464
6.884765
0.264464
2008 NIC 0.046234
0.66624
0.165463
17.59671
0.182881
7.013198
0.238884
2009 NIC 0.038296
0.680229
0.232783
17.74983
0.158847
7.700223
0.204969
2010 NIC 0.047476
0.702859
0.372641
17.95911
0.126754
5.871897
0.166265
2011 NIC 0.002835
0.786909
0.670072
18.27584
0.089755
6.309078
0.121128
2012 NIC 0.124385
0.751103
0.359217
18.78871
0.064109
4.620953
0.072529
2013 NIC 0.110723 0.691901 0.539067 19.09562 0.049813 6.236347 0.053361
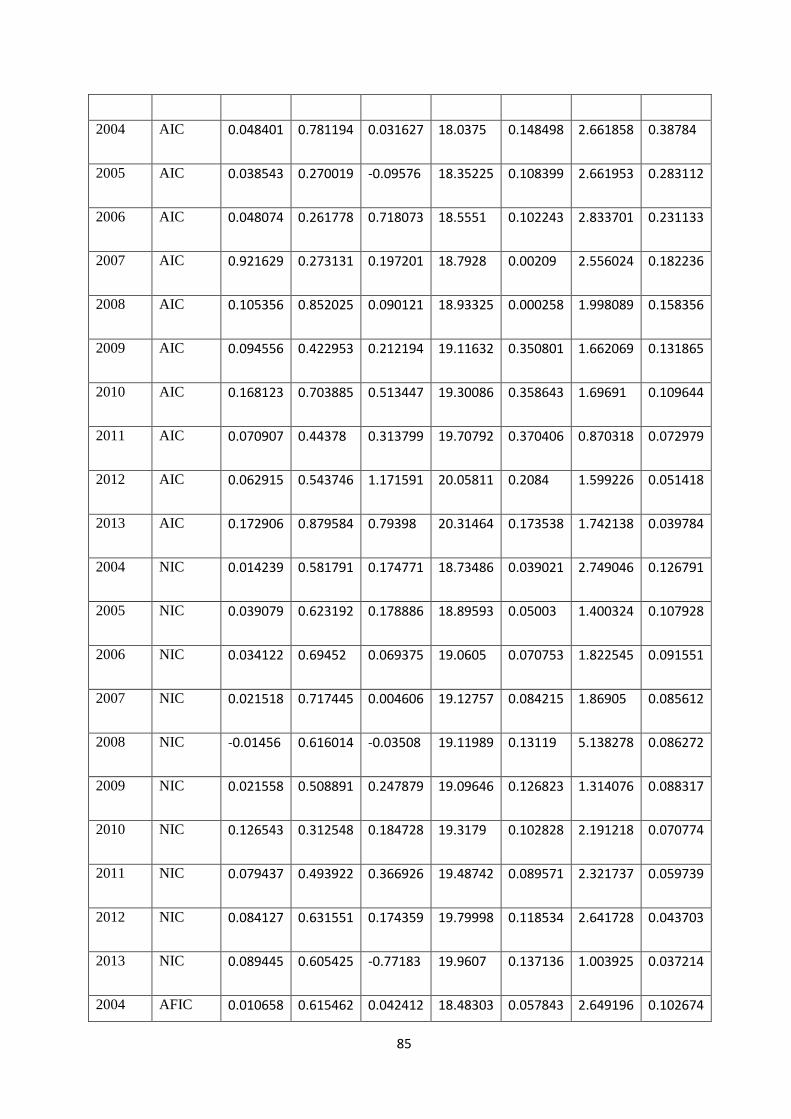
85
2004 AIC 0.048401
0.781194
0.031627
18.0375
0.148498
2.661858
0.38784
2005 AIC 0.038543
0.270019
-0.09576
18.35225
0.108399
2.661953
0.283112
2006 AIC 0.048074
0.261778
0.718073
18.5551
0.102243
2.833701
0.231133
2007 AIC 0.921629
0.273131
0.197201
18.7928
0.00209
2.556024
0.182236
2008 AIC 0.105356
0.852025
0.090121
18.93325
0.000258
1.998089
0.158356
2009 AIC 0.094556
0.422953
0.212194
19.11632
0.350801
1.662069
0.131865
2010 AIC 0.168123
0.703885
0.513447
19.30086
0.358643
1.69691
0.109644
2011 AIC 0.070907
0.44378
0.313799
19.70792
0.370406
0.870318
0.072979
2012 AIC 0.062915
0.543746
1.171591
20.05811
0.2084
1.599226
0.051418
2013 AIC 0.172906
0.879584
0.79398
20.31464
0.173538
1.742138
0.039784
2004 NIC 0.014239
0.581791
0.174771
18.73486
0.039021
2.749046
0.126791
2005 NIC 0.039079
0.623192
0.178886
18.89593
0.05003
1.400324
0.107928
2006 NIC 0.034122
0.69452
0.069375
19.0605
0.070753
1.822545
0.091551
2007 NIC 0.021518
0.717445
0.004606
19.12757
0.084215
1.86905
0.085612
2008 NIC -0.01456
0.616014
-0.03508
19.11989
0.13119
5.138278
0.086272
2009 NIC 0.021558
0.508891
0.247879
19.09646
0.126823
1.314076
0.088317
2010 NIC 0.126543
0.312548
0.184728
19.3179
0.102828
2.191218
0.070774
2011 NIC 0.079437
0.493922
0.366926
19.48742
0.089571
2.321737
0.059739
2012 NIC 0.084127
0.631551
0.174359
19.79998
0.118534
2.641728
0.043703
2013 NIC 0.089445
0.605425 -0.77183
19.9607
0.137136
1.003925
0.037214
2004 AFIC 0.010658 0.615462 0.042412 18.48303 0.057843 2.649196 0.102674
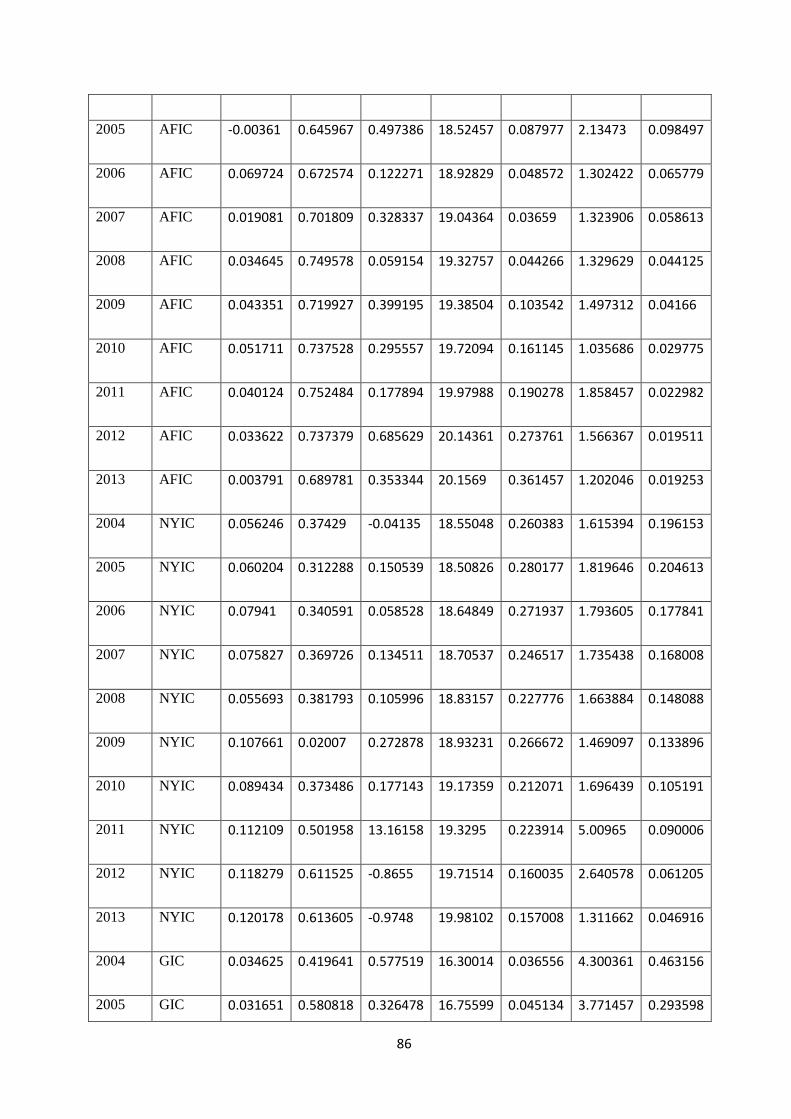
86
2005 AFIC -0.00361
0.645967
0.497386
18.52457
0.087977
2.13473
0.098497
2006 AFIC 0.069724
0.672574
0.122271
18.92829
0.048572
1.302422
0.065779
2007 AFIC 0.019081
0.701809
0.328337
19.04364
0.03659
1.323906
0.058613
2008 AFIC 0.034645
0.749578
0.059154
19.32757
0.044266
1.329629
0.044125
2009 AFIC 0.043351
0.719927
0.399195
19.38504
0.103542
1.497312
0.04166
2010 AFIC 0.051711
0.737528
0.295557
19.72094
0.161145
1.035686
0.029775
2011 AFIC 0.040124
0.752484
0.177894
19.97988
0.190278
1.858457
0.022982
2012 AFIC 0.033622
0.737379
0.685629
20.14361
0.273761
1.566367
0.019511
2013 AFIC 0.003791
0.689781
0.353344
20.1569
0.361457
1.202046
0.019253
2004 NYIC 0.056246
0.37429
-0.04135
18.55048
0.260383
1.615394
0.196153
2005 NYIC 0.060204
0.312288
0.150539
18.50826
0.280177
1.819646
0.204613
2006 NYIC 0.07941
0.340591
0.058528
18.64849
0.271937
1.793605
0.177841
2007 NYIC 0.075827
0.369726
0.134511
18.70537
0.246517
1.735438
0.168008
2008 NYIC 0.055693
0.381793
0.105996
18.83157
0.227776
1.663884
0.148088
2009 NYIC 0.107661
0.02007
0.272878
18.93231
0.266672
1.469097
0.133896
2010 NYIC 0.089434
0.373486
0.177143
19.17359
0.212071
1.696439
0.105191
2011 NYIC 0.112109
0.501958
13.16158
19.3295
0.223914
5.00965
0.090006
2012 NYIC 0.118279 0.611525
-0.8655
19.71514
0.160035
2.640578
0.061205
2013 NYIC 0.120178 0.613605
-0.9748
19.98102
0.157008
1.311662
0.046916
2004 GIC 0.034625
0.419641
0.577519
16.30014
0.036556
4.300361
0.463156
2005 GIC 0.031651 0.580818 0.326478 16.75599 0.045134 3.771457 0.293598

87
2006 GIC 0.034064
0.547959
0.128337
17.03852
0.037233
4.255008
0.221336
2007 GIC 0.043447
0.436348
0.060624
17.15926
0.044499
2.507791
0.196161
2008 GIC 0.006668
0.407258
0.091015
17.60576
0.041384
1.234059
0.125517
2009 GIC 0.036544
0.902047
0.123002
17.80441
0.368079
1.249265
0.102903
2010 GIC 0.058372
0.449545
0.197476
17.92265
0.339998
1.149461
0.091428
2011 GIC 0.043224
0.553922
0.303469
17.60145
0.465749
1.485895
0.126059
2012 GIC 0.014486 0.417233
1.161872
18.3545
0.249916
1.542743
0.059365
2013 GIC 0.112964 0.455195
-0.60982
18.63745
0.174445
1.662257
0.044735
2004 UIC -0.07393
0.746452
0.056205
17.69632
0.036551
1.792895
0.481225
2005 UIC -0.021
0.771586
0.48083
17.63847
0.036354
1.661518
0.509883
2006 UIC 0.099155 0.440357
0.243265
18.03107
0.141433
2.116273
0.344322
2007 UIC 0.11509
0.498586
0.279739
18.24881
0.145287
1.957395
0.27695
2008 UIC 0.124368
0.36114
0.076644
18.93034
0.09321
1.868295
0.140094
2009 UIC 0.070289
0.420274
0.342094
19.10291
0.154648
1.677984
0.117888
2010 UIC 0.166171
0.360132
0.225034
19.30189
0.11573
2.040636
0.096618
2011 UIC 0.06977
0.435751
1.131095
19.50266
0.063897
2.151099
0.079043
2012 UIC 0.08022
0.360994
0.20878
19.82316
0.052402
2.081432
0.057369
2013 UIC 0.109657
0.370187
-0.92323
20.01277
0.076439
2.120729
0.04746
2004 NBIC -0.10886
0.191615
0.636466
17.44583
0.185299
4.084859
0.490866
2005 NBIC 0.091934
0.300052 0.568698
17.93837
0.125775
2.148336
0.299955
2006 NBIC 0.035104 0.268366 0.019345 18.10344 0.073126 2.465895 0.254311

88
2007 NBIC 0.072219
0.297095
0.385962
18.40777
0.066034
2.348986
0.187584
2008 NBIC 0.08785
0.294553
0.511213
18.73417
0.144551
0.103773
0.135345
2009 NBIC 0.083585
0.378733
0.290925
19.14708
0.112116
1.861156
0.089561
2010 NBIC 0.078998
0.393868
0.218659
19.40244
0.110001
1.886523
0.069377
2011 NBIC 0.072337
0.403611
0.46088
19.60019
0.113784
1.852733
0.056929
2012 NBIC 0.066458
0.440742
0.149186
19.97923
0.083048
1.781246
0.038969
2013 NBIC 0.088663 0.433312
1
20.11828
0.073251
1.828396
0.03391
Abbreviation of Ethiopian insurance companies
1. EIC- Ethiopian Insurance Corporation
2. NIC- National Insurance Corporation
3. AIC- Awash Insurance Corporation
4. NIC- Nile Insurance Corporation
5. AFIC-African Insurance Corporation
6. NYIC-Nyala Insurance Corporation
7. GIC- Global Insurance Corporation
8. UIC- united Insurance Corporation
9. NBIC- Nib insurance companies