Embed Size (px)
Citation preview
European Research Studies, pp. 98-119
Vol. XVI, Issue (2), 2013
The Determinants of Capital Structure in
Emerging Capital Markets: Evidence from Serbia
Dejan Malinić1, Ksenija Denčić-Mihajlov2
, Ema Ljubenović3
Abstract:
This paper explores the determinants of the capital structure of Serbian firms listed on the
regulated market using panel data. We model the leverage ratio as a function of firm-specific
characteristics. The findings indicate the emerging character of Serbian corporate
environment. We document that Serbian firms tend to have much lower debt ratio and that
they rely more heavily on short-term than long-term debt compared to firms coming from
other transitional economies. The study shows that there is a significant negative impact of
liquidity, tangibility, profitability and cash gap on the two debt ratios. Leverage level is
significantly positively affected by the income volatility and growth opportunities of Serbian
firms. Our results are consistent with the findings of previous empirical studies realized in
emerging and transition economies, indicating that Serbian companies follow the modified
pecking order theory.
Key Words:
Capital structure, leverage, transition economies, emerging market, liquidity, tangibility,
profitability, volatility, growth, cash gap
JEL Classification: G15, G30, G32
1 Full Professo, Department of Accounting and Corporate Finance at the Faculty of Economics,
University of Belgrade, e-mail: [email protected] 2 Associate Professor, Department of Accounting and Corporate Finance at the Faculty of Economics,
University of Nis, Serbia, e-mail: [email protected] 3 PhD student, Faculty of Economics, University of Nis, Serbia, e-mail: [email protected]
99 The Determinants of Capital Structure in Emerging Capital Markets:
Evidence from Serbia
1. Introduction
Study of the capital structure and the effects of financial leverage in the so-called
transition economies is still a matter of current interest. This problem is differently
manifested in every country, depending on numerous factors (Thalassinos and
Kiriazidis 2003; Thalassinos, Kiriazidis and Thalassinos 2006). The most important
ones are the completeness of privatization process, the level of progress in capital
market development, availability of various financing sources, the level of investor
protection, legal stability and management quality. Each of these factors could affect
certain firms with different intensity, depending on the country. The differences
between developed and developing markets are significant (Thalassinos 2007;
2008). In contrast to developed markets, undeveloped markets are characterized by
insufficient information transparency, poor functioning of primary market, low
liquidity of secondary market and slow adjustment of prices to new information
signals (Thalassinos et al., 2010). Under such circumstances, company management
is often faced with inflexible capital structure, dominantly composed of capital and
credit sources. Therefore, it is logical that usual capital structure determinants are
differently manifested.
The importance of studying the peculiarities of capital structure choices of
companies operating in emerging and transition economies was highlighted for the
first time by Cornelli, Portes and Schaffer (1998). In the last decade, a significant
number of studies emerged aiming to explore the unique features of capital structure
choices in Central and Eastern European (CEE) countries. However, to the best of
the authors' knowledge, no empirical research concerning the impact of various
firm-specific factors on capital structure choices of listed firms has been conducted
in case of Serbia. Although Serbia, as one of European transition economies, shares
many geographic and historical characteristics with other transitional European
countries, the Serbian economy shows unique characteristics in terms of regulatory
and infrastructure environment, development of financial market as well as the
economic structure. The aim of this paper is to fill this gap in the literature by
exploring the case of capital structure determinants in the Republic of Serbia. This
study explores the factors determining capital structure choice of Serbian firms
listed on the regulated market fragment of the Belgrade Stock Exchange in the
period 2008-2011. More specifically, we try to answer whether firm-specific
determinants that have been recognized in Central and Eastern European corporate
settings are similarly leverage-correlated among Serbian companies. The
contribution of the paper is two-fold and is reflected in extending the existing
empirical literature to financial policy determinants in emerging and transitional
economies and broadening the possibilities for cross-country comparison in the field
of capital structure determinants.
100 European Research Studies, Vol. XVI, Issue (2), 2013
D. Malinić – K. Denčić-Mihajlov – E. Ljubenović
The structure of the paper is as follows. In Section 1 we give an overview of
relevant theoretical and empirical evidence concerning capital structure determinants
in European transitional economies. The data collection and research method are
presented in Section 2. In Section 3 we discuss the empirical results of our study.
Final Section provides conclusions, emphasize some limitations of the study and
propose the objectives of future research.
2. Capital Structure Research in European Transition Economies
Capital structure determines how a firm finances its operations and growth by using
different sources of funds – debt and equity. Since the appearance of the seminal
paper by Modigliani and Miller (1958), economic literature has recognized two
important competitive theoretical models that aim to explain the capital structure
decisions: the pecking order hypothesis and the static trade-off model. The first one
finds its corner-stone in asymmetric information, while the second one is based on
the existence of tax benefits associated with debt use, bankruptcy cost and agency
cost. In the pecking order framework (Myers & Majluf, 1984; Myers, 1984), firms
will prefer internal financing to issuing securities. Concerning external financing,
firms prefer debt to equity. The relative costs of finance vary among different
sources of finance due to the existence of information asymmetries between the firm
(managers) and investors. According to the static trade-off model, there is an
optimal capital structure. It is a result of trade-offs between tax advantages from
interest and costs of financial distress. The tax-based models, along with agency-
cost based models (Bradley et al., 1984; Chang, 1999; Grossman & Hart, 1982;
Harris & Raviv, 1990; Jensen & Meckling, 1976; Miller, 1977; Modigliani & Miller,
1958; Modigliani & Miller, 1963), belong to the static trade-off models.
A large body of empirical studies has been realized to test which hypothesis, the
trade-off or the pecking order, is more efficient in clarifying firms’ financing
decisions. Knowledge about capital structure choices mostly originates from
empirical data found in developed economies. De Jong, Kabir & Nguyen (2008)
provide a survey of theoretical and empirical literature on the capital structure and
systematize exogenous and endogenous factors influencing the capital structure.
Empirical research on capital structure policies started emerging in the eighties
(Marsh, 1982; Jalilvand & Harris, 1984; Titman & Wessels, 1988). Later studies
emphasize the importance of institutional setting in identifying fundamental
determinants of the capital structure (Rajan & Zingales, 1995; La Porta et al., 1998;
Demirguc-Kunt & Maksimovic, 2002; Beck et al., 2005). Capital structure
determinants were studied by Rajan and Zingales (1995) based on data from G-7
countries and Bevan and Danbolt (2002) who relied on data from the United
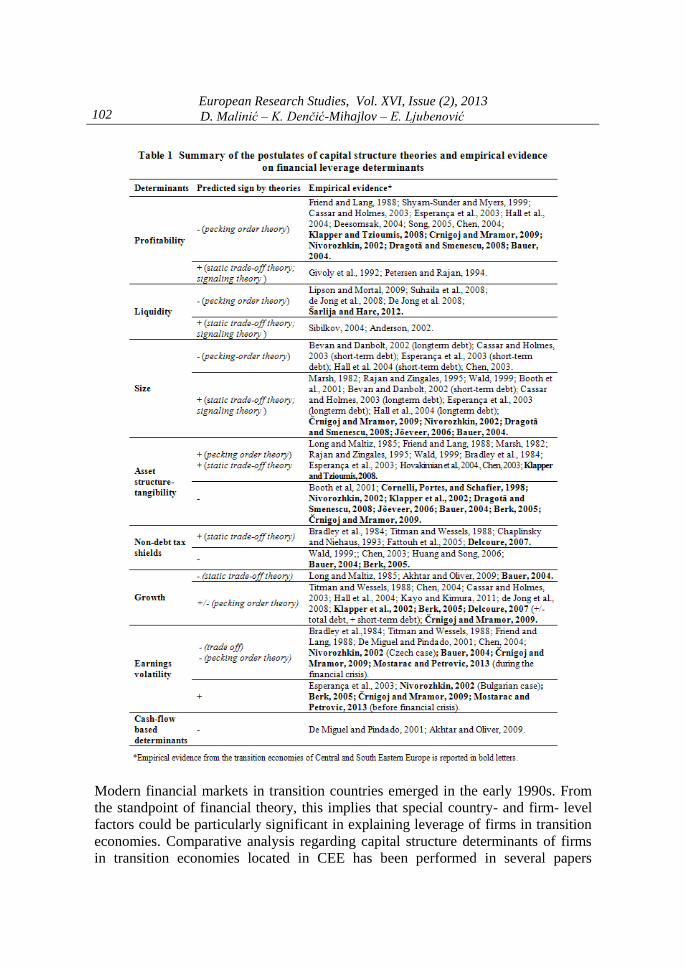
Kingdom. Booth et al. (2001) consider data from ten developing countries (Brazil,
Mexico, India, South Korea, Jordan, Malaysia, Pakistan, Thailand, Turkey and
Zimbabwe), while Chen (2004) and Guihai and Song (2006) use data from China

101 The Determinants of Capital Structure in Emerging Capital Markets:
Evidence from Serbia
(Table 1). The results of these studies generally indicate that financial leverage
increases with share of fixed assets in total assets, non-debt tax shields, growth
opportunities and firm size. On the other hand, financial leverage is negatively
correlated with earnings profitability, volatility and bankruptcy probability. Yet, as it
can be seen from Table 1, the results of these empirical studies are not always
unequivocal.
102 European Research Studies, Vol. XVI, Issue (2), 2013
D. Malinić – K. Denčić-Mihajlov – E. Ljubenović
Modern financial markets in transition countries emerged in the early 1990s. From
the standpoint of financial theory, this implies that special country- and firm- level
factors could be particularly significant in explaining leverage of firms in transition
economies. Comparative analysis regarding capital structure determinants of firms
in transition economies located in CEE has been performed in several papers
103 The Determinants of Capital Structure in Emerging Capital Markets:
Evidence from Serbia
(Cornelli., 1998; Nivorozhkin, 2002; Klaper et al., 2002; De Haas & Peeters, 2006;
Jõeveer, 2006; Delcoure, 2007; Triandafil & Brezeanu, 2010). The authors mostly
report that, with respect to firm-level characteristics, firms’ capital structure in CEE
economies follows different pattern compared to Western European structure.
Using data from the early 1990s on firms from Hungary and Poland, Cornelli,
Portes, & Schafier (1998) point out that Eastern European firms’ capital structure
behaves differently from Western European structure since the level of financial
leverage is lower than in Western firms, and there is a negative correlation between
tangibility of assets and leverage. Klapper, Sarria-Allende and Sulla (2002)
contribute to economic literature with their study on the key relations between
different debt ratios and leverage determinants in small and medium-sized firms in
15 CEE countries in 1999. By studying capital structure dynamics, their target
leverage and adjustment speed, De Haas and Peeters (2006) emphasize that during
the transition process CEE firms increased their leverage and mitigated the
difference between target and existing leverage. Jõeveer (2006) explores the
significance of firm-, institutional-, and country-level factors in explaining
variations in leverage by using a sample of firms from nine CEE countries over the
period 1995-2002. He finds that in comparison to small and unlisted companies, in
which capital structure choices are mainly determined by country-specific factors,
the decisions on firms’ leverage in listed and large unlisted companies are
predominantly driven by firm-specific factors. Delcoure (2007) indicates special
factors influencing firms' leverage decisions in CEE countries, such as financial
constraints of banking systems, disparity in legal systems governing firms'
operations, shareholders and bondholders rights protection, sophistication of equity
and bond markets and corporate governance.
Other authors contributed to economic literature by examining capital structure
determinants within national frameworks. For the purpose of this research, the
results of the studies conducted in Slovenia and Croatia were the most valuable, due
to shared historical and cultural background with the Republic of Serbia (along with
Bosnia and Herzegovina, Montenegro and Macedonia, as federal units, they formed
the Socialist Federal Republic of Yugoslavia until early 1990s). Studies conducted
by Mramor & Valentinčič (2001), Črnigoj & Mramor (2009), and Berk (2006)
determine the factors driving capital structure choice in Slovenian firms. Berk
(2006), as well as Črnigoj & Mramor (2009), conclude that the pecking order
hypothesis explains capital structure choice in Slovenian firms better than the trade-
off theory. Empirical tests on capital structure policies in Croatia are carried out by
Mosnja-Skare & Skare (2002), Klapper & Tzioumis (2008), Deari & Deari (2010),
and Sarlija & Harc (2012). Mosnja-Skare & Skare (2002), and Deari & Deari (2010)
confirm that tangibility, profitability and size, are relevant determinants of leverage.
Klapper & Tzioumis (2008) find a significant positive correlation between corporate
104 European Research Studies, Vol. XVI, Issue (2), 2013
D. Malinić – K. Denčić-Mihajlov – E. Ljubenović
taxation and capital structure. Thalassinos and Liapis (2013) have analysed
employed benefits under the IAS.
3. Empirical Analysis
3.1 Sample and data description
We tested the regression model of the capital structure on a sample consisting of
real-sector publicly traded companies whose shares are quoted on the regulated
market of the Belgrade Stock Exchange. We compiled the database of financial
statements (Serbian Business Registers Agency) of those publicly-listed companies
that were quoted on all segments of the regulated stock exchange market (Prime
Listing, Standard Listing and Open Market segments), that met the size criterion in
all analyzed years (big or medium-sized company)4 and operated in real sector
(financial firms were excluded from the sample). We excluded from the sample
companies with consolidated financial statements in any of the analyzed years, as
well as those companies whose loss was over the amount of capital so that they were
practically financed only from borrowed sources, and whose value of financial
leverage equaled one. The sample contained the financial data for 4 years in
sequence, covering the period from 2008 to 2011. The final sample comprised the
total of 108 big and medium-sized non-financial companies, whose shares were
quoted on the regulated segment of the Belgrade Stock Exchange. These companies
were mostly the result of mass corporatization in Serbia at the beginning of the 21st
century, as a part of transition process to market economy and private property.
Financial statements of these companies were prepared according to the
International Accounting Standards / International Financial Reporting Standards.
The total number of observations for each variable was 432 (108*4). When the four-
year value average or the value for one year only was considered, the total number
of observations was 108.
4 According to the Law on Aaccounting and Auditing, legal entities in Serbia are classified as small,
medium and big ones, depending on the average number of employees, annual turnover and assets
value. According to the Law, the category of medium entities includes all legal entities that meet at
least two of the following three criteria: 1) the average number of employees in the year of annual
statement from 50 to 250, 2) the annual turnover from 2,500,000 EUR to 10,000,000 EUR in dinars
equivalent, and 3) the average value of assets (at the beginning and at the end of the financial year) from 1,000,000 EUR to 5,000,000 EUR in dinars equivalent. Legal entities with lower than the lowest
index amounts for at least two of the specified criteria are classified as small, while legal entities with
higher than the highest index amounts for at least two of the criteria are classified as big legal entities.
105 The Determinants of Capital Structure in Emerging Capital Markets:
Evidence from Serbia
3.2 Descriptive statistics of the determinants and leverage
Empirical studies on capital structure determinants mainly use two measures of
leverage – book and market leverage. In this study, we use book instead of market
values5, and employ two measures. Total liabilities ratio, TL, is defined as total
liabilities divided by total book value of assets. Book short-term debt ratio, STL, is
defined as short-term debt divided by total book value of assets. As Huang & Song
(2006) point out, total liabilities ratio represents more appropriate measure for
capital structure for three reasons. Firstly, the creditor, while concerning credit
worthiness, will consider both firm’s long-term debt and how big the firm’s current
debt and total liabilities are. Secondly, current liabilities seem to be quite enduring
part of total assets (Gibson, 2001) in case of Serbian companies, too. Finally,
companies in Serbia use intensive trade credit as a means of financing, so accounts
payable should also be included in measures of leverage.
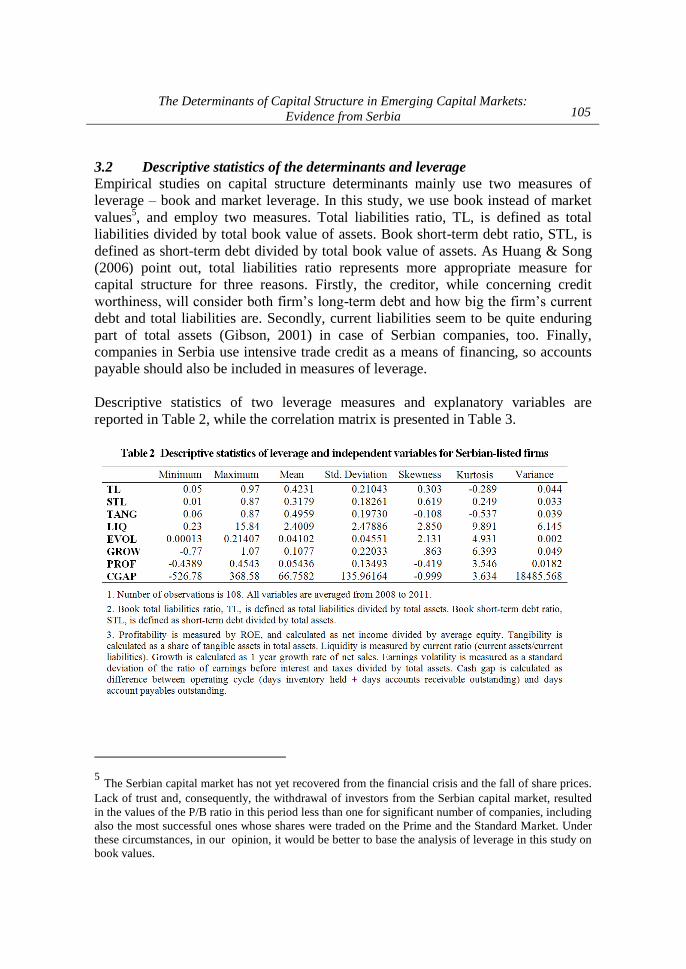
Descriptive statistics of two leverage measures and explanatory variables are
reported in Table 2, while the correlation matrix is presented in Table 3.
5 The Serbian capital market has not yet recovered from the financial crisis and the fall of share prices.
Lack of trust and, consequently, the withdrawal of investors from the Serbian capital market, resulted
in the values of the P/B ratio in this period less than one for significant number of companies, including
also the most successful ones whose shares were traded on the Prime and the Standard Market. Under
these circumstances, in our opinion, it would be better to base the analysis of leverage in this study on
book values.
106 European Research Studies, Vol. XVI, Issue (2), 2013
D. Malinić – K. Denčić-Mihajlov – E. Ljubenović
The measures of leverage, as well as the explanatory variables, were observed
during the period 2008-2011. Profitability is measured by ROE, and calculated as
net income divided by average equity. Tangibility is calculated as a share of tangible
assets in total assets. Liquidity is measured by current ratio (current assets/current
liabilities), while growth is calculated as 1 year growth rate of net sales. As a risk
measure in this study we use the standard deviation of the ratio of earnings before
interest and taxes divided by total assets. The cash gap is calculated as difference
between operating cycle (days inventory held + days accounts receivable
outstanding) and days account payables outstanding.
The results of dependent variables, reflected in Total Debt Ratio (TL) and Short-
term Debt Ratio (STL), exhibit that the mean of TL (STL) of all firms analyzed is
0.42 (0.32). The distributions of TL and STL show that they are positively skewed
and with kurtosis of -0.289 and 0.249 respectively, which represents the flatter tails
of debt ratios' population. The independent variables denoted by TANG, LIQ,
EVOL, GROW, PROF and CGAP have mean values of 0.496, 2.401, 0.041, 0.108,
0.054, and 66.758 respectively.
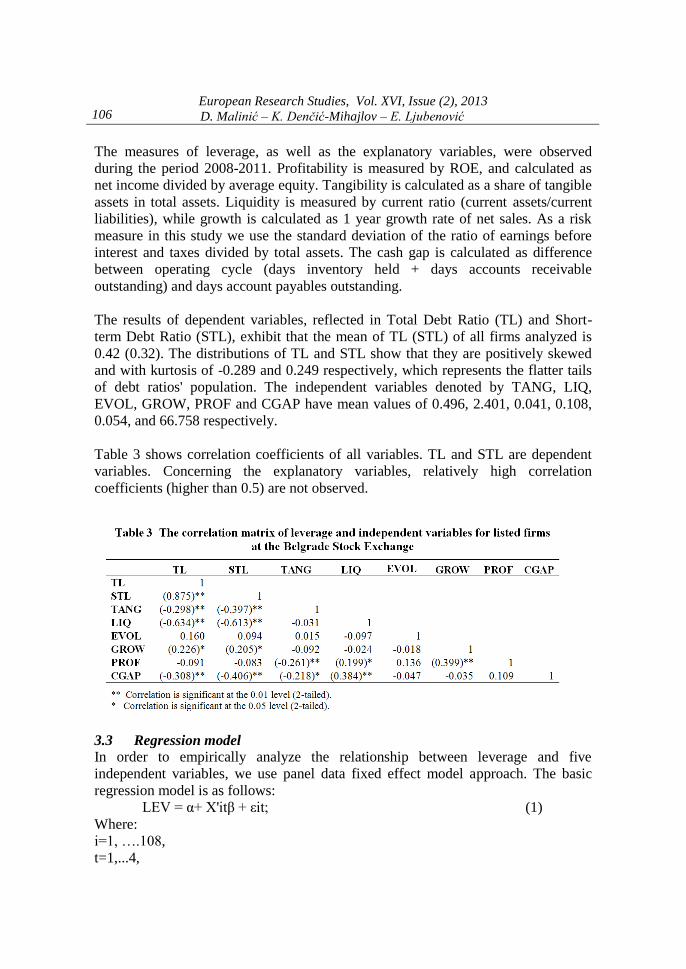
Table 3 shows correlation coefficients of all variables. TL and STL are dependent
variables. Concerning the explanatory variables, relatively high correlation
coefficients (higher than 0.5) are not observed.
3.3 Regression model
In order to empirically analyze the relationship between leverage and five
independent variables, we use panel data fixed effect model approach. The basic
regression model is as follows:
LEV = α+ X'itβ + εit; (1)
Where:
i=1, ….108,
t=1,...4,
107 The Determinants of Capital Structure in Emerging Capital Markets:
Evidence from Serbia
LEV is the one of two debt ratios (explained below) for the ith firm at the time t, α is
the intercept,
Xit′ is a 1×k vector of observations on k explanatory variables for the ith firm in the
tth period,
β is a k×1 vector of parameters,
εit is a disturbance term.
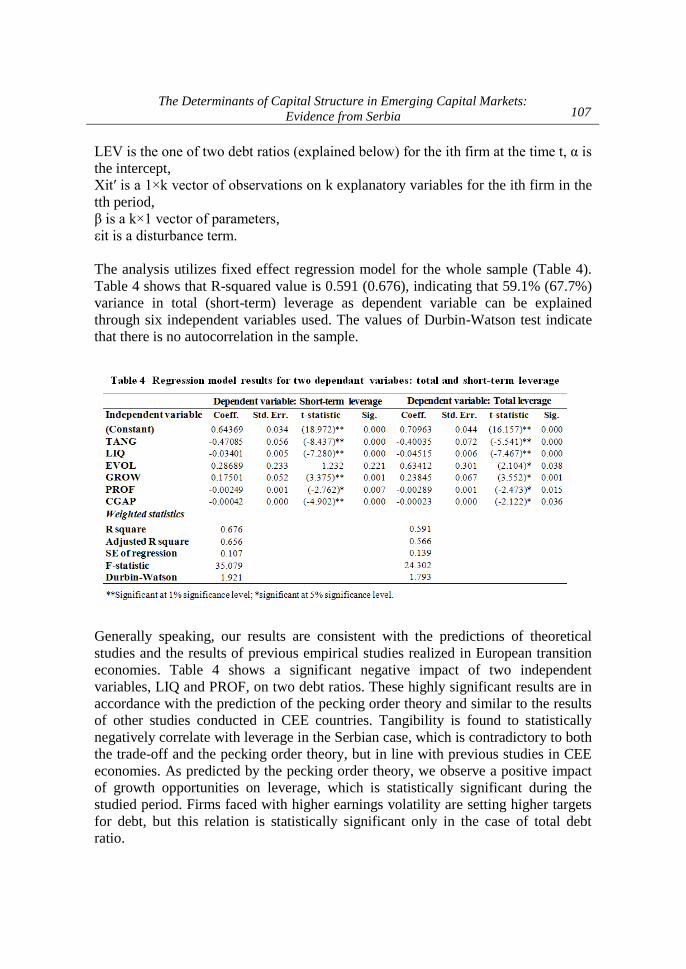
The analysis utilizes fixed effect regression model for the whole sample (Table 4).
Table 4 shows that R-squared value is 0.591 (0.676), indicating that 59.1% (67.7%)
variance in total (short-term) leverage as dependent variable can be explained
through six independent variables used. The values of Durbin-Watson test indicate
that there is no autocorrelation in the sample.
Generally speaking, our results are consistent with the predictions of theoretical
studies and the results of previous empirical studies realized in European transition
economies. Table 4 shows a significant negative impact of two independent
variables, LIQ and PROF, on two debt ratios. These highly significant results are in
accordance with the prediction of the pecking order theory and similar to the results
of other studies conducted in CEE countries. Tangibility is found to statistically
negatively correlate with leverage in the Serbian case, which is contradictory to both
the trade-off and the pecking order theory, but in line with previous studies in CEE
economies. As predicted by the pecking order theory, we observe a positive impact
of growth opportunities on leverage, which is statistically significant during the
studied period. Firms faced with higher earnings volatility are setting higher targets
for debt, but this relation is statistically significant only in the case of total debt
ratio.
108 European Research Studies, Vol. XVI, Issue (2), 2013
D. Malinić – K. Denčić-Mihajlov – E. Ljubenović
4. Results and Discussion
4.1 Descriptive statistics: total and short-term leverage
Research conducted in this paper shows that the companies whose shares are traded
on the regulated segment of the Belgrade Stock Exchange are specific in many
aspects. Within the scope of this paper, special attention must be given to the level
of indebtedness and profitability. Debt financing should contribute to the growth of
ROE, but at the same time it increases financial risk. The measure of indebtedness
effect (capital structure) on owners’ returns finds its quantitative expression in
financial leverage.
The examination of the capital structure of companies whose shares are traded on
the stock exchange shows that, in the analyzed period, the average relation between
debt and equity was 42 to 58%. The dominant share of equity compared to debt
indicates that the financial structure of these firms is quite strong, which speaks in
favor of their long-term stability. However, comparing capital structure of
companies listed on the regulated market to the average capital structure in the
Serbian economy reveals an interesting situation. Namely, the Serbian economy is
characterized by debt share of 61% and equity share of 39% (Malinić & Milićević,
2012). At first sight, it might be concluded that the Serbian economy uses financial
leverage in a better way. However, the fact that profitability of the entire economy is
worse compared to profitability of companies whose shares are traded on the
regulated market implies that such a conclusion would be wrong.
In order to obtain the notion of capital structure in Serbian companies, a comparison
of the extent of leverage for Serbia and European transitional economies would be
valuable. In the study of nine CEE countries, Joeveer (2006) reports total leverage
ratio in 2000 in the range from 53% (Lithvania) to 76% (Romania). Crnigoj &
Mramor (2009) find that the average total leverage ratio in Slovenia in the period
1999-2006 reaches 60%, while Sarlija & Harc (2012) report that average leverage of
Croatian firms is 63% in 2009. Even though these studies cover different periods,
they could be conditionally comparable with the Serbian case. According to
macroeconomic indicators, at the end of the first decade of XXI century, due to the
civil war and economic isolation, Serbia goes through the same stage of economic
and market development which the Central and Eastern Europen countries - present
EU member states, passed in the early 2000s. Data show that, Serbian companies
whose shares are traded on a regulated market have lower leverage than all the
transition economies of CEE countries, which indicate that country-specific factors
(such as capital market development, financial system, GDP growth) have a marked
influence on capital structure.
109 The Determinants of Capital Structure in Emerging Capital Markets:
Evidence from Serbia
Why is the share of debt in the capital structure of companies whose shares are
traded on the regulated market relatively small? Do these companies miss the
opportunity to make better use of the effects of financial leverage? More intensive
reliance on companies’ own internal sources than on debt could be explained by
several key motives.
Firstly, although the profitability of companies whose shares are traded on the
regulated market is not at substantial level, they still operate in profit zone. That
enables them to finance their growth with retained earnings. Financial analysis of
these companies’ performances shows that they retain, on average, about 45% of
reported income during the analyzed period. Positive cash flows from operations
cover about 83% of capital investments on average. On the other hand, the growth of
these companies is quite modest (on average, operating assets grows at the rate of
3% in 2009 and 2011 and at the rate of 12% in 2010). It is partly the result of
economic crisis, while modest return growth indicates insufficient competitiveness.
Thereby, equity rose by 21.4% in the periods when the growth of assets of all
companies whose shares were traded on the regulated market was the highest (in
2010), which resulted in the reduction of debt share in the same year. Under such
conditions, companies manage to maintain a stable relation between equity and debt.
Secondly, undeveloped capital market in Serbia causes mostly inflexible capital
structure composed of companies’ own (internal and external) and credit financing
sources. Financial sources are undiversified, not allowing the creation of more
flexible capital structure. The lack of confidence in the capital market, high issuance
costs and non-stimulating business environment resulted in the shortage of corporate
bonds. We believe that wider range of financial sources would contribute to the
reduction of cost of capital and raising the quality of managing capital structure.
Thirdly, undiversified financial sources are main determinant of high costs of credit
financing. It is well known that high financing expenses raise the financial risk.
Additional problems for Serbian companies are reflected in the fact that financial
expenses are fluctuating, which further raises the financial risk. Namely, there are
three components in financial expenses’ structure: interest rate, exchange differences
and the effects of incorporated currency clause on synchronizing credit liabilities
with the exchange rate fluctuations or rise in retail prices. Under the conditions of
monetary instability, such a structure of financing costs affects their high value
(Malinić & Milićević, 2012a). Our calculation shows that average costs of debt
financing (calculated as the ratio between financial expenses and average long-term
and short-term financial liabilities) reaches incredible 20% in the analyzed period.
The burden of such high financial expenses is quite unbearable and further
borrowing at such terms could lead companies into losses and jeopardize their
survival.
110 European Research Studies, Vol. XVI, Issue (2), 2013
D. Malinić – K. Denčić-Mihajlov – E. Ljubenović
The above-stated limitations clarify the reason why companies whose shares are
traded on the regulated market restrain from higher debt share. Apart from the
indebtedness level, other potential problem is related to the debt structure. The share
of total liabilities in total assets equals about 42%, and the share of short-term
liabilities equals approximately 32%. This leads to a conclusion that the maturity
structure of total liabilities is not favorable. The share of long-term debt in total
assets is about twice as lower compared to the share of short-term liabilities. In that
sense, there are no significant differences compared to the pattern of the same
measures in the whole Serbian economy.
In our opinion, there are three key reasons for the dominance of short-term liabilities
over long-term ones. The first one is related to chronic problems of illiquidity
present in the Serbian economy, whereby the companies whose shares are traded on
the regulated market are not the exception. Under such circumstances, management
is often forced to use short-term loans. The other reason is related to the attitude of
the banking sector towards the credit risk. Due to higher exposure to systematic and
unsystematic risk, banks used to prefer the approval of expensive, short-term loans,
without taking into account the need to synchronize loan maturity structure with the
structure of financed assets of the company. The third reason comes from the fact
that a part of financing burden is transferred to the suppliers. Prolongation of
liabilities to the suppliers results in the fact that their share in financial structure
grows. In this particular case, average time of settling liabilities to the suppliers is
almost 100 days. In this way, companies mostly provide non-interest financing. The
problem is that neglecting the suppliers’ interest is not sustainable on a long term
basis.
4.2 Liquidity
Regarding the relationship between liquidity and the capital structure, theories
generally state that liquidity is positively related to the ratio of long-term debt to
assets since firms with higher liquidity have easier access to debt. Morallec (2001)
points out that the relevance of liquid assets depends on the way it is measured – by
the liquidation value of a firm’s assets or by the selling price of assets over the entire
life of the firm. In her study based on a sample of American firms, Sibilkov (2007)
shows that more liquid assets increase leverage.
On the other hand, according to the pecking order theory, accumulated cash and
other liquid assets could serve as an internal financing source and would be
preferably used to debt. This type of relationship is confirmed both by Lipson &
Mortal (2009), and Suhaila, Wan & Wan (2008), who show that more liquid firms
are less leveraged. De Jong et al. (2008) indicate that the relation between leverage
and liquidity in cases of Croatia, Hungary and Poland is negative, but not
statistically significant. The negative relation between liquidity and leverage in the
Croatian case has been confirmed by Sarlija & Harc (2012).
111 The Determinants of Capital Structure in Emerging Capital Markets:
Evidence from Serbia
Statistically relevant negative correlation between financial leverage and liquidity
implies that the share of debt in assets rises when liquidity falls. Such a correlation is
understandable in conditions under which Serbian listed companies operate. It has
already been pointed out that, in the analyzed period, the Serbian economy was
characterized by chronic illiquidity. Under such circumstances, illiquidity problems
also burden companies whose shares are traded on the regulated market, although to
a lesser extent compared to the rest of the economy since they have slightly stronger
financial structure. When profitability is not satisfactory and available cash flows are
not sufficient to cover capital investments, service credit liabilities and pay current
operating liabilities, it is clear that management, in the absence of other sources,
uses bank loans, mostly short-term ones. Therefore, liquidity problems imply more
intensive borrowing, when financial leverage rises. Since short-term debt is mostly
used to resolve liquidity problems, the increase of total financial leverage is the
result of the increased short-term financial leverage, which also explains statistically
relevant negative correlation between financial leverage and liquidity. Having in
mind that this relation is stochastic, individual cases may show departure from the
usual tendency. In addition, statistically significant relation between these variables
speaks nothing about the effects of financial leverage, i.e. whether they are positive
or negative. The increase of financial leverage certainly increases the financial risk,
but the borrowing capacity will be determined by the equivalence of ROA and the
cost of capital.
4.3 Tangibility
The asset structure has a significant role in determining the capital structure of a
firm. Firms with high levels of tangible assets have higher liquidation value and will
be in a position to provide collateral for debts. The agency theory indicates the same
nature of relationship. In a situation when debt is secured by tangible assets, agency
costs of equity are reduced. The asset structure is particularly important as a
criterion for long-term loans. A positive relationship between tangibility and
leverage is anticipated in both the trade-off model and the pecking order hypothesis.
Indeed, studies from the developed countries indicate a significant positive
relationship between tangibility and total debt (Rajan & Zingales, 1995; Esperanca
et al., 2003). On the other hand, conclusions from developing countries are mixed.
Booth et al. (2001) find a negative relationship in the case of developing countries.
The findings of Nivorozhkin (2002), Dragota and Semenescu (2008), Jõeveer
(2006), Berk (2006), and Bauer (2004) also indicate negative and statistically
relevant correlation between tangibility and leverage in firms operating in European
transition countries, confirming the results of previous study by Cornelli, Portes, and
Schafier (1998). A positive relationship between these two variables is reported by
Klapper and Tzioumis (2008), and Mosnja-Skare & Skare (2002) in the Croatian
case.
112 European Research Studies, Vol. XVI, Issue (2), 2013
D. Malinić – K. Denčić-Mihajlov – E. Ljubenović
In this paper, the mean (median) of tangibility indicators equals 49.6% (50.2%).
Such information leads to a conclusion that analyzed companies are on average quite
inflexible and that their orientation towards some other activities is not so simple.
There are two possible explanations of the negative relationship between leverage
and tangibility. The first one is more theoretical and related to the view that fixed
assets (as long-term-related assets and consequently the riskiest part of assets)
should be financed from sources of funds of the highest quality, i.e. from internal
sources or share issuance. In that sense, the increase of fixed assets share should be
followed by the increase of equity, which leads to the decrease of debt share. The
other explanation is closer to the real corporate environment in Serbia. It has already
been mentioned that borrowed sources of funding were quite limited and practically
reduced to very expensive bank loans. Under such circumstances, many companies
have no choice but to rely on their own sources in the process of growth financing.
4.4 Profitability
The type of correlation between profitability and leverage of a company is
theoretically unclear. According to the pecking order theory, there is a negative
relationship between firm’s profitability and its capital structure: firms prefer
internal financing to external financing sources. Profitable firms can rely on retained
profits and oppose to dependence on debt as an outside source. However, authors
like Ross (1977) or Leland & Pyle (1977) claim that the capital structure is used as a
signaling instrument of firm's performances and perspectives, and thus, a positive
value of the correlation coefficient between leverage and profitability is expected.
Givoly et al. (1992) and Petersen & Rajan (1994) find a significantly positive
association between profitability and debt ratio.
Most studies realized in European transition economies (Nivorozhkin, 2002; Bauer,
2004; Jõeveer, 2006; Klapper & Tzioumis, 2008; Črnigoj & Mramor, 2009)
consistent with the pecking order theory, find a negative relationship between
profitability and capital structure.
As we previously pointed out, Return on Equity (ROE) chosen as a profitability
measure, is calculated as the ratio of net income after tax and average equity. Such a
measure comprises the effects of indebtedness (Total asset/Equity), profitability of
sales (EBIT/Sales), efficiency of asset management (Sales/Total Assets) and the
interest burden (Net income/EBIT). In other words, ROE summarizes the effects of
decisions concerning operating, investing and financing activities (Stickney et al.,
2007).
Our study shows that there is a weak negative correlation between profitability and
leverage (total and short-term). Regression analysis indicates a negative relationship
at 5% statistical significance. There are several possible explanations of such a
relationship between these variables. In the first place, our study covers the period in
113 The Determinants of Capital Structure in Emerging Capital Markets:
Evidence from Serbia
which the effects of the financial crisis came to the fore. The average return on
equity (5.44%) is not at a satisfactory level. In this period, even 21% of the total
number of analyzed companies (23 companies) operated at a loss. Second, it is
especially important to emphasize that, in the analyzed period, the average return on
assets (6.66%) was higher than the average ROE (5.44%), indicating a negative
effect of financial leverage. This suggests that the cost of financing was higher than
the return on assets, which affected the decline of ROE. There is, therefore, an
absurd situation where lenders earn more than the shareholders who bear a higher
risk. Third, high rates of financial costs, which incorporate high risk premiums,
forced profitable companies to rely on internal sources of financing, rather than on
expensive bank loans. For example, in the most profitable telecommunications
sector, the average rate of financial costs in the period 2008-2011 was 14.26%
(Malinić & Milićević, 2013). During the same period, the average rate of financial
costs at the level of the whole economy was 16.94%. Fourth, the tax shield effect
was not significant since one part of the companies recognized losses, and in such
situation there were no tax savings. Besides that, profitable companies did not gain
much benefit from tax savings, since the rate of income tax in Serbia was 10%, and
such savings in most companies could not offset the negative effects of expensive
borrowing. Fifth, such a relationship between profitability and leverage could also
be supported by the fact that, in addition to expensive bank loans, debt market was
not developed, and borrowing opportunities were quite modest.
Serbian companies are in a very difficult situation. Generally, the lack of primary
issue of shares (especially during the crisis period) and unsatisfactory profitability
indicate higher borrowing. On the other hand, underdeveloped debt market and
expensive bank loans prevent differentiation and higher proportion of debt. Under
these circumstances, companies often rely on suppliers as a (free) financing source
to which they shift the burden of financing. The problem is that this situation is not
sustainable. The lack of quality sources of financing significantly reduces the
opportunities for growth. Under these circumstances, it seems that the results of the
relationship between profitability and leverage fairly reflect the situation in Serbian
companies and are in line with the pecking order theory.
4.5 Growth
According to the pecking order theory, it is expected that fast-growing firms would
need to increase their long-term operating assets, and since internal sources of
financing are not likely to meet their needs, they would borrow more intensively. On
the other hand, as reported by the trade-off theory, firms characterized by higher
growth opportunities are inclined to use less debt since growth opportunities are
intangible and cannot be used as collateral. The standpoint of the agency theory is
that firms with great growth opportunities have a tendency to expropriate wealth
from debt holders, and, thus, have lower debt.
114 European Research Studies, Vol. XVI, Issue (2), 2013
D. Malinić – K. Denčić-Mihajlov – E. Ljubenović
There is no clear empirical evidence on the relationship between leverage and
growth. Some researchers find positive relationships between sales growth and debt
ratios (e.g. Titman & Wessels, 1988; Cassar & Holmes 2003, and Hall et al. 2004).
The evidence presented by Rajan & Zingales (1995), Long & Maltiz (1985), and
Akhtar & Oliver (2009) suggests that higher growth firms use less debt. Conclusions
from CEE countries are also mixed. While Bauer (2004) shows negatively and
statistically significant relationship between growth opportunities and leverage in
the case of Czech companies, evidence given by Klapper et al. (2002), Berk (2005),
and Črnigoj & Mramor (2009) point out that growth opportunities increase leverage
in the analyzed transition economies. Finally, in her study of companies in the CEE
countries, Delcoure (2007) find a positive relation between growth and short-term
debt for the whole sample, while the relation between growth opportunities and total
debt ratio is mixed.
As for the Serbian large and medium firms quoted on the regulated market, the
growth variable is significantly and positively related to both total and short-term
leverage. The profitability level of the analyzed Serbian companies is relatively low
in comparison to firms from developed countries and other European transitional
economies. The analyzed time framework coincides with the crisis period, the
capital market is undeveloped, and the short-term debt is the prevailing method of
debt financing. Therefore, it is not surprising that a higher rate of sales growth of the
Serbian companies, which predicts stronger revenue generation in future period, is
associated with more debt financing.
4.6 Risk
Both the pecking order theory and the trade-off theory argue that higher earnings
volatility is connected with more conservative use of debt financing. In line with the
trade-off theory, higher earnings volatility increases the probability of financial
distress and bankruptcy costs and decreases firms' leverage. The standpoint of the
pecking order theory is that companies with higher exposure to risk would retain
spare debt capacity in order to avoid financing using more costly debt in the future
period.
However, in spite of the general theoretical consensus about the inverse relation
between firm risk and leverage degree, empirical studies show contradictory results.
A number of studies point to an inverse relationship between risk and debt ratio
(Bradley et al., 1984; Titman & Wessels, 1988; Friend & Lang, 1988; De Miguel &
Pindado, 2001; Chen, 2004), while other researches indicate a positive relationship
(Huang & Song, 2002; Esperanca et al., 2003). Judging by available empirical
evidence from emerging and transitional economies, earnings volatility is an
important determinant of firm leverage, but the nature of the relationship between
these two variables is not unique. It differs across countries, periods and leverage
measures (Table 1).
115 The Determinants of Capital Structure in Emerging Capital Markets:
Evidence from Serbia
This study presents evidence on the relationship between risk and leverage which
contradicts both the trade-off theory and the pecking order theory. At first sight, the
conclusion that earnings volatility positively correlates with leverage, and that this
relationship is statistically significant only in the case of total debt ratio, is
surprising. However, one should have in mind that the most profitable Serbian
companies from the sample experienced high income volatility in the analyzed
period primarily due to the financial crisis. They are faced with inflexible capital
structure and long-term debts inherited from the pre-crisis period. In such a
situation, a higher variability of a firm’s income leads to a lower risk-aversion of the
managers and corresponding higher debt targets. On the other hand, as it is
presented in Section 2, the main feature of the Serbian economic and institutional
environment is undeveloped capital market – the absence of corporate bond market
and the fact that equity market is shallow and not liquid. Banks, even though in a
monopolistic position, are bound with real sector and financially support companies
to which they approved (long-term) loans in the pre-crisis period in spite of the high
risk exposure of these companies.
4.7 Cash gap
The cash gap is the difference between the total number of days for which the
company is to provide financing of its working capital and the number of days for
which it provided funding from the suppliers. The cash gap indicates how long a
company has to finance current assets from additional sources. Thereby, companies
often opt for short-term borrowing. Shortening the cash gap should logically imply
reduction in requests for additional funding sources. Small cash gap generally refers
to efficient operating and effective cash management. Conversely, increasing the
cash gap indicates cash shortfalls and increases financing cost. Therefore, it is
reasonable to expect that there is a positive correlation between the cash gap and
leverage, which means that shortening of the cash gap follows the decline of
indebtedness, and vice versa. Our regression model shows the opposite, there is a
negative relationship between the cash gap and leverage (both total and short-term).
The uniqueness of companies doing business in Serbia is that cash gap shortening is
neither the consequence of inventory holding reducing nor speeding up the
collection of receivables, but the result of slowing down the payments to the
suppliers (Malinić, 2013). In this regard, the situation is so serious that even 27.8%
of the companies from the sample operate with the negative cash gap as the
consequence of increasing days payable outstanding. In other words, the inability of
additional borrowing causes the abuse of the suppliers by shifting the burden of the
cash cycle finance. In our case, 30 companies (27.8%) had the negative cash gap,
while 60 firms (55.6%) had smaller cash gap in the last than in the first year
analyzed. Among 60 companies with reported cash gap reduction, in 49 companies
(81.7%) the increasing of payables is found.
116 European Research Studies, Vol. XVI, Issue (2), 2013
D. Malinić – K. Denčić-Mihajlov – E. Ljubenović
Higher statistical significance of the impact of such processes on the short-term
compared to the total leverage is understandable, since the increase of days payable
outstanding results in the fact that their share in short-term debt rises faster than in
long-term liabilities. Under such circumstances, when companies shift the financing
burden to the suppliers, the suppliers do the same with their suppliers, and that
causes many companies to slide towards bankruptcy. It is known that the increase in
accounts payable over an accepted level produces not sustainable long-term cash
flow (Wild et al., 2004). The conclusion is that the increase in current liabilities is a
very serious warning signal about the chronic lack of liquidity of the Serbian
economy and an indication of serious financial failures.
5. Conclusions
This study explores the determinants of capital structure decisions of companies
listed on the regulated market in the Republic of Serbia in the period 2008-2011.
The results suggest that firm-specific factors affecting firms’ capital structure in
other emerging and transitional countries work in a similar way in Serbia. More
precisely, leverage, measured either by total debt ratio or short-term debt ratio,
decreases with profitability, liquidity, tangibility and cash gap, and increases with
growth opportunities. These findings indicate that Serbian companies follow the
“new pecking order“(Chen, 2004) – retained profit, then equity, and lastly debt.
This research has pointed to some specific features of the capital structure of Serbian
companies listed on the regulated market. First, since the capital market in Serbia is
undeveloped and financial sources are undiversified, the capital structure of Serbian
firms is mostly inflexible. Second, Serbian firms prefer short-term finance and have
less total liabilities and higher shareholders’ equity compared to their matches in
both developed and some developing countries. Third, in the absence of primary
issues and differentiated sources of borrowing, particularly during the financial
crisis, companies shift the financial burden to their suppliers. Prolongation of trade
payables has contagious effect and pulls healthy companies into insolvency as well.
This situation, which is partly the result of a weak enforcement of the law on
bankruptcy, is not sustainable and bears serious risks for the successful functioning
of the national economy. The findings of the study imply that the specific attributes
of the Serbian corporate environment, such as the ownership concentration and the
corporate governance structure of the listed firms, the concentration and financial
constraints in the banking sector, poor functioning of the primary market and low
liquidity and depth of the secondary capital market, are all factors influencing the
debt structure and the impact of firm-specific factors on firms’ leverage decision.
This study is featured by at least two main limitations. In the first place, it is based
on the data obtained from Serbian non-financial firms listed on the regulated market.
Secondly, the correlation and regression analysis is conducted using the total and
117 The Determinants of Capital Structure in Emerging Capital Markets:
Evidence from Serbia
short-term book leverage as dependent variables, and six explanatory variables. In
this respect, future research should comprise the market leverage measures and other
set of explanatory variables (such as cash-flow based indicators) and should be
based on a larger and comprehensive database (public and private companies).
References
Akhtar, S. and Oliver, B. (2009), “Determinants of Capital Structure for Japanese
Multinational and Domestic Corporations”, International Review of Finance, 9(1-2), pp.
1-26.
Antoniou, A., Guney, Y. and Paudyal, K. (2008), “The determinants of corporate debt
ownership structure: Evidence from market-based and bank-based economies”,
Managerial Finance, 34(12), p. 821– 847.
Bancel, F. and Mittoo, R. (2004), “Cross-country determinants of capital structure choice: A
survey of European firms”, Financial Management, Vol. 33, pp. 103-132.
Bauer, P. (2004), “Determinants of Capital Structure: Empirical Evidence from the Czech
Republic”, Czech Journal of Economics and Finance, pp. 1-2.
Beck, T., Demirgüç-Kunt, A. and Maksimovic, V. (2005), “Financial and Legal Constraints
to Firm Growth: Does Size Matter?”, Journal of Finance, pp. 137-177.
Beck, T., Demirguc-Kunt, A. and Maksimovic, V. (2008), “Financing patterns around the
world: Are small firms different?”, Journal of Financial Economics, Vol. 89, pp. 467-
487.
Berk, A. (2006), “Drivers of Leverage in Slovenian Blue-Chip Firms and Stock Performance
Following Substantial Debt Increases” Post Communist Economies, 18(4), p. 479–494.
Bevan, A. and Danbolt, J. “2002”, “Capital structure and its determinants in the United
Kingdom – a decompositional analysis”,.. Applied Financial Economics, 20(3), pp. 159-
170.
Booth, L., Aivazian, V., Demirguc-Kunt, A. and Maksimovic, V. (2001), “Capital Structures
in Developing Countries”, Journal of Finance, 56(1), pp. 87-130.
Bradley, M., Jarrell, G. and Kim, E. (1984), “On the existence of an optimal capital structure:
Theory and evidence”, Journal of Finance, Vol. 39, p. 857– 880.
Cassar, G. and Holmes, S. (2003), “Capital Structure and Financing of SMEs: Australian
evidence”, Accounting and Finance, Vol. 43, pp. 123-147.
Castanias, R. (1983), “Bankruptcy Risk and the Optimal Capital Structure”, Journal of
Finance, pp. 1617-638.
Chang, C. (1999), “Capital structure as optimal contracts”, North American Journal of
Economics and Finance, Vol. 10, p. 363– 385.
Chaplinsky, S. and Niehaus, G. (1993), “Do inside ownership and leverage share common
determinants?”, Quarterly Journal of Business and Economics, 32(4), p. 51– 65.
Chen, J. (2004), “Determinants of Capital Structure of Chinese-Listed Firms”, Journal of
Business Research, 57(12), p. 1341–1351.
Cornelli, F., Portes, R. and Schaffer, M. (1998), “The Capital Structure of Firms in Central
and Eastern Europe, in: Different Paths to a Market Economy: China and European
Economies in Transition, s.l.:CEPR/CEPII/OECD.
118 European Research Studies, Vol. XVI, Issue (2), 2013
D. Malinić – K. Denčić-Mihajlov – E. Ljubenović
Črnigoj, M. and Mramor, D. (2009), “Determinants of Capital Structure in Emerging
European Economies: Evidence from Slovenian Firms”, Emerging Markets Finance and
Trade, 45(1), pp. 72-89.
De Haas, R. and Peeters, M. (2006), “The Dynamic Adjustment towards Target Capital
Structures of Firms in Transition Economies”, 14, no. 1:. Economics of Transition,
14(1), p. 133–169.
De Jong, A., Kabir, R. and Nguyen, T.T. (2008), “Capital structure around the world: The
roles of firm- and country – specific determinants”, Journal of Banking and Finance,
Vol. 32, pp. 1954-1969.
De Miguel, A. and Pindado, J. (2001), “Determinants of capital structure: new evidence from
Spanish panel danaJournal of Corporate Finance”, Journal of Corporate Finance, Issue
7, p. 77–99.
DeAngelo, H. and Masulis, R. (1980), “Optimal capital structure under corporate and
personal taxation”, Journal of Financial Economics, Issue 8, p. 3 –29.
Deari, F. and Deari, M. (2009), “The determinants of capital structure: evidence from
Macedonian listed and unlisted companies”, Analele stiintifice ale Universitatii
„Alexandru Ioan Cuza” Din Iasi, Vol. LVI, pp. 91-102.
Deari, F. and Deari, M. (2010), “Determinants of Capital Structure: Case of Companies
Listed on Zagreb Stock Exchange”, International Review of Economics and Business,
May, XIII(1), pp. 65-82.
Delcoure, N. (2007), “The Determinants of Capital Structure in Transitional Economies”,
International Review of Economics and Finance, 16(2), p. 400–415.
Demirguc-Kunt, A. and Maksimovic, V. (2002), “Funding growth in bank-based and market-
based financial systems: evidence from firm-level data”, Journal of Financial
Economics, 65(3), pp. 337-363.
Dragota, I. and Semenescu, A. (2008), “A Dynamic Analysis of Capital Structure
Determinants Empirical Results for Romanian Capital Market”, Empirical Results for
Romanian Capital Market, Issue 4, pp. 65-80.
Esperanca, J. P., Gama, A. and Gulamhussen, M. (2003), “Corporate Debt Policy of Small
Firms: An Empirical (Re) Examination”, Journal of Small Business and Enterprise
Development, Vol. 10, pp. 62-80.
Friend, I. and Lang, L. (1988), “An Empirical Test of the Impact of Managerial Self-Interest
on Corporate Capital Structure”, Journal of Finance, June.pp. 271-281.
Gibson, H. (2001), Financial Reporting and Analysis: Using Financial Accounting
Information, South-Western College Publishing, Cincinnati(Ohio).
Givoly, D., Hayn, C., Ofer, A. and Sarig, S. (1992), “Taxes and capital structure: Evidence
from firms’ response to The Tax Reform Act of 1986, 5”, Review of Financial Studies,
Vol. 5, pp. 331-355.
Grossman, S. J. and Hart, O. (1982), “Corporate financial structure and managerial
incentives”, in: The Economics of Information and Uncertainty, University of Chicago
Press, Chicago.
Hall, G., Hutchinson, P. and Michaelas, N. (2004), “Determinants of the capital structures of
European SMEs”, Journal of Business Finance and Accounting, Vol. 31, p. 711–728.
Harris, M. and Raviv, A. (1990), “Capital structure and the information role of debt”,
Journal of Finance, Issue 45, p. 321–349.
Huang, G. and Song, F. (2006), “The determinants of capital structure: Evidence from
China”, China Economic Review, Vol. 17, p. 14– 36.
119 The Determinants of Capital Structure in Emerging Capital Markets:
Evidence from Serbia
Huang, S. G. and Song, F.M. (2002), The Determinants of Capital Structure: Evidence from
China, s.l.: Hong Kong Institute of Economics and Business Strategy.
Jalilvand, A. and Harris, R. (1984), “Corporate Behavior in Adjusting to Capital Structure
and Dividend Targets: An Econometric Study”, The Journal of Finance, 39(1), pp. 127-
145.
Jensen, M. and Meckling, W., (1976), “Theory of the firms: Managerial behavior, agency
costs and ownership structure”, Journal of Financial Economics, Vol. 3, p. 305–360.
Jõeveer, K., 2006. Sources of Capital Structure: Evidence from Transition Countries,
Prague: The Center for Economic Research and Graduate Education-Economic Institute.
Kayo, E.K. and Kimura, H. (2011), “Hierarchical determinants of capital structure”, Journal
of Banking & Finance, Vol. 35, p. 358–371.
Klaper, L.F., Sarria-Allende, V. and Sulla, V. (2002), Small- and Medium-Size Enterprise
Financing in Eastern Europe, s.l.: World Bank.
Klapper, L. and Tzioumis, K. (2008), Taxation and capital structure: evidence from a
transition economy, The Hellenic Observatory, London.
La Porta, R., Lopez-De-Silanes, F., Shleifer, A. and Vishny, R. (1998), “Law and finance”,
Journal of Political Economy, Vol. 106, p. 1113–1155.
Leland, H. and Pyle, H. (1977), “Informational Asymmetries, Financial Structure, and
Financial Intermediation”, Journal of Finance, May, 32(2), pp. 371-387.
Lipson, M. L. and Mortal, S. (2009), “Liquidity and capital structure”, Journal of Financial
Markets, 12(4), pp. 611-644.
Malinić, D. (2013), “Insufficiency of Serbian Economy’s Operating Performances:
Manifestations, Causes and Main Guidelines of Recovery”, Ekonomika preduzeća,
January-February.pp. 41-62.
Malinić, D. and Milićević, V. (2012a), “The Financial and Structural Capabilities of Key
Infrastructure Sectors in Serbia”, Economic Annals, October-Decembe, LVII(195), pp.
7-42.
Malinić, D. and Milićević, V. (2012), Finansijsko–strukturno nasleđe kao ograničenje za
izlazak privrede iz krize (Financial-Structural Legacy as a Limitation of Overcoming
Crisis in Economy), Banja Vrućica, Savez računovoĎa i revizora Republike Srpske, pp.
119-149.
Malinić, D. and Milićević, V. (2013), “Profitability and Growth of Telecommunications
Sectors - The Case of the Republic of Serbia”, European International Journal of
Science and Technology, 2(1), pp. 33-45.
Marsh, P. (1982), “The choice between equity and debt: An empirical study”, Journal of
Finance, Vol. 37, p. 121– 144.
Miller, M. (1977), “Debt and Taxes”, Journal of Finance, Vol. 32, p. 261–275.
Modigliani, F. and Miller, M. (1958), “The cost of capital, corporation finance and the theory
of investment”, American Economic Review, Vol. 48, p. 261– 275.
Modigliani, F. and Miller, M. (1963), “Corporate income taxes and the cost of capital”,
American Economic Review, Vol. 53, p. 433–443.
Morallec, E. (2001), “Asset liquidity, capital structure, and secured debt.”, Journal of
Financial Economics, 61(2), pp. 173-206.
Mosnja-Skare, L. and Skare, M. (2002), “Strategic accounting problem of capital gearing in
Croatia”, Zagreb international review of economics & business, 5(2), pp. 23-37.
Mramor, D. and Valetinčič, A. (2001), “When Maximizing Shareholders’ Wealth Is Not the
Only Choice”, Eastern European Economics, 39(6), p. 64–93.
120 European Research Studies, Vol. XVI, Issue (2), 2013
D. Malinić – K. Denčić-Mihajlov – E. Ljubenović
Myers, S. C. (1984), “The Capital Structure Puzzle”, Journal of Finance, 39(3), p. 575–592.
Myers, S. C. and Majluf, N. S. (1984), “Corporate Financing and Investment Decisions
When Firms Have Information That Investors Do Not Have”, Journal of Financial
Economics, 13(2), p. 187–221.
Nivorozhkin, E. (2002), “Capital Structures in Emerging Stock Markets: The Case of
Hungary”, The Developing Economies, 40(2), p. 166–187.
Petersen, M. and Rajan, R. (1994), “The benefits of lending relationships: Evidence from
small business data”, Journal of Finance, Vol. 49, p. 1367–1400.
Rajan, R. and Zingales, L. (1995), “What Do We Know about Optimal Capital Structure?
Some Evidence from International Data”, Journal of Finance, 50(5), p. 1421–1460.
Ross, S. (1977), “The determination of financial structure: The incentive-signaling
approach”, Bell Journal of Economics, Vol. 8, p. 23−40.
Sarlija, N. and Harc, M. (2012), “The impact of liquidity on the capital structure: a case
study of Croatian firms”, Business Systems Research, 3(1), pp. 30-36.
Sibilkov, V. (2007), Asset liquidity and capital structure, [Online] available at:
https://pantherfile.uwm.edu/sibilkov/www/liquidity.pdf [accessed 1 February 2012].
Stickney, C., Brown, P. and Wahlen, J. (2007), Financial Reporting, Financial Statement
Analysis, and Valuation – A Strategic Perspective, Thomson, Mason.
Suhaila, M., Wan, M. and Wan, M. (2008), Capital Structure and Firm Characteristics:
Some Evidence from Malaysian Companies, University Library of Munich,Germany.
Titman, S. and Wessels, R. (1988), “The determinants of capital structure choice”, Journal of
Finance, Vol. 43, p. 1 –19.
Thalassinos, E. and Liapis, K. (2013), “A Comparative Analysis for the Accounting
Reporting of “Employee benefits” between IFRS and other Accounting Standards: A
Case Study for the Biggest Listed Entities in Greece”, International Journal of
Economics and Business Administration, Vol. I (1), pp. 91-116.
Thalassinos, E. and Kiriazidis, Th. (2003), “Degrees of Integration in International Portfolio
Diversification: Effective Systemic Risk”, European Research Studies Journal Vol. VI,
Issue 1-2, pp. 111-122.
Thalassinos, E. (2008), “Trends and Developments in the European Financial Sector”,
European Financial and Accounting Journal, Vol. 3, No. 3, pp. 51-68.
Thalassinos, E. (2007), “Trade Regionalization, Exchange Rate Policies and EU-US
Economic Cooperation,” European Research Studies Journal Vol. X, Issue 1-2,
pp. 111-118.
Thalassinos, I.E., L. Deceanu, Pintea, M. and Zampeta, V. (2010), “New Dimensions of
Country Risk in the Context of the Current Crisis: A Case Study for Romania and
Greece”, European Research Studies Journal, Vol. XIII, (3), pp. 225-236.
Thalassinos, E. Kyriazidis, Th. and Thalassinos, J. (2006), “The Greek Capital Market:
Caught in Between Poor Corporate Governance and Market Inefficiency”, European
Research Studies Journal, Vol. IX, Issue 1-2, pp. 3-24.
Triandafil, C. and Brezeanu, M. P. (2010), “CEE Corporate Finance Peculiarities:
Comparative Approach in Relation with Developed Countries”, Management &
Marketing Challenges for Knowledge Society, 5(2), pp. 77-92.
Wald, J. K. (1999), “How firm characteristics affect capital structure: An international
comparison”, Journal of Financial Research, Vol. 22, p. 161−187.
Wild, J., Subramanyam, K. and Hasley, R. (2004), Financial Statement Analysis, Mc Graw –
Hill/Irwin, New York.

121 The Determinants of Capital Structure in Emerging Capital Markets:
Evidence from Serbia