Embed Size (px)
Citation preview

1
Determinants of Bank Capital Structure in Developing Countries: Regulatory
Capital Requirement versus the Standard Determinants of Capital Structure
Monica Octavia Rayna Brown*
Department of Finance
The University of Melbourne Victoria 3010 AUSTRALIA
Abstract
In the finance literature regulatory capital requirements have typically been considered the main factor influencing the choice of capital structure by banks. However, recent evidence (Gropp and Heider, 2007) suggests this may not be the case. In this study we investigate further whether the standard determinants of capital structure apply to banks. Whereas Gropp and Heider examine banks from the USA and Europe we examine banks from developing countries. Our preliminary results suggest that the standard determinants of capital structure do have power in explaining both book capital and market leverage. However, the direction of influence is not always as expected. Collectively, the buffer theory of excess capital seems to explain the level of excess book capital that banks hold while the excess market capital held by banks seems to be determined more by market pressures. While Gropp and Heider (2007) find no evidence to justify the stark distinction between book and market leverage for banks in developed countries, our results provides support to do so for banks in developing countries. Keywords: banks, capital structure, regulation,
JEL codes: G21, G28
Acknowledgments: We thank Rob Brown, Kim Sawyer and Harald Scheule for helpful
advice in preparing this draft.
January 14, 2008
NB: First draft. Please do not quote.
*Corresponding author Ph: 61 3 8344 7661 Fax: 61 3 8344 6914 e-mail: [email protected]

2
1. Introduction
Since the famous proposition of Modigliani and Miller (1958) that, in perfect capital
markets, capital structure choice is irrelevant to firm value, considerable research has
been undertaken to identify the nature of market frictions likely to affect firm value.
However, such research is typically restricted to non-banks. The special nature of the
deposit contract, the degree of leverage in banking and the regulatory constraints
imposed on banks have meant that banks (and financial institutions in general) have
been excluded in previous empirical studies on standard capital structure choice.
Nevertheless, understanding the determinants of capital structure is as important for
banks as for non-banks firms. Diamond and Rajan (2000) found that a bank’s capital
structure affects its stability as well as ability to provide liquidity and credits effectively.
Given that a well-functioning and well-developing banking system plays a crucial role
in promoting growth of an economy (Levine, 1997), and the predominant role of capital
ratios in prudential regulation, it is imperative to understand the factors which drive the
capital structure decision of banks.1
For non-financial firms the empirical literature has generally converged on particular
variables that have been found to be consistently correlated with leverage: size,
profitability, market-to-book ratio, collateral value and dividend policy. Size has been
found to be positively related to leverage (Titman and Wessels (1988), Rajan and
Zingales (1995), Booth et al. (2001), Aggarwal and Jamdee (2003), and Frank and
Goyal (2005)). Larger firms tend to have higher leverage as they are less prone to
bankruptcy due to higher diversification and hence fail less often.2 Firms with higher
profitability tend to have lower leverage (Rajan and Zingales, 1995; Booth et al, 2001;
Aggarwal and Jamdee, 2003 and Frank and Goyal, 2005).3
The market-to-book ratio has been found to be negatively related to leverage (Rajan
and Zingales,1995; Aggarwal and Jamdee, 2003 and Frank and Goyal, 2005). Some
studies use the ratio of market value to book value of equity whilst others use the ratio
of market value to book value of assets. A high market-to-book ratio suggests high
1 Following the convention in banking literature, bank capital is defined as the ratio of equity to assets. 2 This is consistent with the static trade-off theory outlined in Section 2. 3 This finding is consistent with the pecking-order theory outlined in Section 2 as more profitable firms will prefer using the internal funds generated to finance their investments to debt.

3
growth opportunities giving shareholders a wider choice of future investments.
However, firms with high growth opportunities have higher bankruptcy costs and
therefore, according the static trade-off theory, firms with high market-to-book ratio
tend to be less levered.
It is also possible the negative relation between market-to-book ratio and leverage
indicates overpricing. According to the market timing theory, firms with high market-
to-book ratio will therefore issue more equity in order to exploit the arbitrage
opportunity present in the equity market. Consequently, high market-to-book ratio
lowers the level of leverage.
Finally, tangibility of assets has been found to affect leverage positively where
tangibility is measured by the proportion of tangible assets relative to book value of
total assets (Titman and Wessels, 1988; Rajan and Zingales, 1995; Aggarwal and
Jamdee, 2003 and Frank and Goyal, 2005). High tangibility implies that more assets can
be used as collateral which limits the ability of shareholders to engage in risk-taking
behaviour. This will significantly reduce debt-holders’ exposure to the “asset
substitution effect” and hence increase leverage (Jensen and Meckling, 1976). The
positive relation between tangibility and leverage is also consistent with the pecking-
order theory. A high proportion of tangible assets suggests that firms can issue more
debt secured by assets with less disputable values.
Industry leverage is also recognized as a predictor of individual firm leverage.
Frank and Goyal (2005) suggest industry leverage should not be expected to have a
precise interpretation since industry leverage serves as proxies for several attributes, not
just one. They find industry leverage has in fact subsumed a large number of
individually minor factors such as intangibles, stock market volatility, and
macroeconomic profits. Frank and Goyal also found that firms which pay dividends
have, on average, a lower level of leverage. The pecking-order theory suggests that as
dividends provide good signals about a firm’s future prospects, the firm will issue more
equity as there is less information asymmetry in the equity market. Consequently,
leverage is lower. Furthermore, they considered macroeconomic indicators such as GDP
growth, stock market volatility, and the term structure spread although they concluded
that these factors are relatively less reliable in determining firms’ capital structure.

4
Perhaps for financial firms the answer is much simpler. Regulatory capital
requirements may be the main driver of capital structure (Mishkin, 2000). Based on a
traditional notion of capital as a buffer against losses and financial distress, banks hold
sufficient capital to minimise the probability of failure as required by the Basel capital
accords. However, this proposition is not observed in practice. Gropp and Heider (2007)
find that the standard determinants of capital structure for non-bank firms are also
significant in determining the capital structure of banks. Based on a sample of 200
largest publicly traded banks from the US and fifteen EU countries from 1991 to 2004,
they found that the average level of book capital ratios is 7.4%.4 This figure is nearly
twice the minimum capital ratio required by the Basel Committee of 4%, implying that
there are other factors explaining bank capital structure choice.5 They proposed that
these other factors could be the standard capital structure determinants of non-bank
firms which have been found relevant in previous empirical work.
To the extent that institutional characteristics affect the banking system, it is
essential to test whether their findings can be generalised to banks in countries with
fundamentally different institutional traits. The objective of this study is to expand the
literature on bank capital structure by analysing banks operating in developing
countries.
The study first investigates whether regulatory capital requirements are the main
factor which determines bank book capital or whether the standard determinants of
capital structure can also explain variation in bank book leverage.6 Our preliminary
results suggest the standard determinants of capital structure do have power in
explaining the capital structure of banks in developing countries. This result holds for
both book and market capital. However, the relevance of the standard variables is more
appropriately interpreted in terms of the buffer theory of excess capital. The relevance
4 The 15 EU countries are Austria, Belgium, Germany, Denmark, Spain, Finland, France, United Kingdom, Greece, Ireland, Italy, Luxembourg, Netherlands, Portugal, and Sweden. Together with the US, Gropp and Heider (2007) sample can be classified as developed countries. 5 Gropp and Heider (2007) only considered the required minimum Tier-1 capital ratio of 4% since Tier-2 capital is not regarded as capital in the standard capital structure theories as it includes hybrid and long-term debt instruments. Moreover, under the Basel I, the risk-weighted assets, which are used in the denominator to compute the regulatory capital ratio, are always below the book value of assets. Thus, the average of 7.4% is understated as this figure is based on the ratio of book value of equity to book value of assets. 6 Book leverage is defined as one minus the book capital ratio. The details for variable definition are provided in the methods and data description section.

5
of asset risk on bank capital appears to represent factors pertaining to the standard
capital structure theories as opposed to the effect of risk adjustments on the minimum
capital required.
The remainder of this paper is structured as follows. A brief discussion of vapital
structure theories is presented in Section 2. In Sections 3 and 4 the model and data are
explained. The results are presented in Section 5 and Section 6 contains concluding
remarks.
2. Capital Structure Theory
In an extensive survey of capital structure theories Harris and Raviv (1991)
classified the theories based on four driving forces; agency costs, information
asymmetry, the nature of product or input markets, and corporate control considerations.
Agency theory (Jensen and Meckling, 1976), predicts capital structure choice based
on the existence of agency costs, i.e. costs due to conflicts of interest. According to
there are essentially two sources of conflicts. Conflicts between shareholders and
managers arise since managers have an incentive to consume on perquisites while
putting less effort on maximising profit for the firm. This is because managers bear the
entire costs of pursuing profit maximisation while they do not receive the entire gain.
By increasing the level of debt, this agency cost of managerial discretion can be
mitigated.
However, increasing debt level may give rise to another type of agency cost, namely
conflicts between shareholders and debt-holders. The conflicts arise due to
shareholders’ incentive to invest in suboptimal projects. Returns to debt-holders are
fixed. If an investment earns a return well above the face value of debt, shareholders
would receive most of the gain, but if the investment fails debt-holders will bear all the
cost because the maximum amount that shareholders can lose is the amount of their
investments (limited liability). Consequently, shareholders will have preference for
investing in highly risky projects even though they are value-decreasing. This agency
cost of debt financing is referred to as “asset substitution effect”. Accordingly, the
optimal capital structure choice involves balancing the trade-off between the benefit of

6
debt arising from mitigating the agency cost of managerial discretion against the agency
cost of debt arising from “asset substitution effect”.
The pecking-order theory (Myers, 1984 and Myers and Majluf, 1984) suggests that
capital structure choice is driven by the magnitude of information asymmetry present
between the firm insiders and the outside investors. The more severe the information
asymmetry, the more risk the outside investors are facing and hence the more discount
they demand on the price of issued securities. Consequently, firms will prefer financing
through internal funds and if they do need to raise outside capital, they will firstly issue
risk-free debt then followed by low-risk debt. Equity is only issued as a last resort.
As stated in Myers (1984), the static trade-off theory assumes that firms set an
optimal debt ratio and they move gradually towards it. The theory proposes that the
optimal debt ratio is set by balancing the trade off between the benefit and cost of debt.
The benefit of debt arises from the tax deductibility of interest payments on debt and the
cost of debt comes in the form of higher probability of bankruptcy and the loss suffered
in the event of bankruptcy.
Following Baker and Wurgler (2002), who relate capital structure to past market-to-
book ratios, market timing theory has challenged both the static tradeoff and pecking
order theories. Market timing suggests that firms are more likely to issue equity when
they believe that their shares are relatively overvalued and repurchase equity when the
shares are relatively undervalued. Baker and Wurgler suggest firms do not rebalance
their capital structures after timing the market. Proponents of market timing see capital
structure as the cumulative outcome of past attempts to time the equity market.
To date the majority of the empirical work has been US-centred. Rajan and Zingales
(1995) and Booth et al. (2001) are the only studies which considered international
samples of developed and developing countries respectively.7 Second, these studies
have excluded banks on the premise (perhaps unwittingly) that MM did not apply to
banks.
Miller (1995) argued that in relation to the nature of demand deposits issued by
banks, that in a perfect capital market, there are no reasons to say that demand deposits
7 Aggarwal and Jamdee (2003) also considered a sample of firms from developed countries as their objective is to extend and update the work of Rajan and Zingales (1995).

7
are fundamentally different from other corporate securities. Demand deposits are
characterised with high liquidity, low risk, and easy transferability which make demand
deposits a relatively low-cost source of financing. Accordingly, non-bank firms would
certainly have incentive to finance their business by issuing such securities. In a perfect
capital market non-bank firms would have done so. Hence, under such conditions, MM
propositions would have been conveniently applicable to banks. We argue that bank
regulation should be viewed as a ‘friction’ which may cause departure from the MM
irrelevance proposition but may not be the driving force in determining the capital
structure of banks.
Previous empirical work has centred on market discipline and the role of
subordinated debenture holders in controlling risk-taking by banks. The focus has been
the extent to which spreads on bank bond issues correlate with proxy measures of bank
risk and performance.8 However, none of the research has provided robust evidence that
market discipline actually “influences” bank risk taking since the proxies mostly
measure ex-post performance (Bliss and Flannery, 2000). Morgan and Stiroh (2001)
resolved this issue by conducting an asset test on the market discipline hypothesis and
found that debenture holders do price ex-ante credit and other risks implicit in banks’
current asset portfolio.
Gropp and Heider (2007) approached the issue from a different perspective. Using a
sample of banks from developed countries, they specifically tested the significance of
size, profitability, market-to-book ratio, asset tangibility, and dividend paying status in
determining bank leverage. In the process, they made a stark distinction between bank
book and market leverage as well as controlled for asset risk and macroeconomic
factors. They further examined whether asset risk captures the effect of risk adjustments
on the minimum capital required or it rather represents factors pertaining to the standard
capital structure theories. Overall, their results provided strong support for the relevance
of standard determinants of capital structure on bank capital.
We extend the existing literature by analysing banks from developing countries. It is
unreasonable to conclude that the limited existing evidence may be generalised to
developing economies. Capital markets in developing countries are relatively less-
8 See Avery et al. (1988), Flannery and Sorescu (1996), and Jagtiani et al. (2000).

8
developed and it is reasonable to posit that the private sectors in these countries are less
able to assist regulators in monitoring and disciplining risk-taking behaviour of banks.
3. Model Development
The basic premise is that bank capital structure is completely determined by
regulatory capital requirement requirements and not related to the standard determinants
of capital structure. There are five determinants to be tested; size (Size), profitability
(Prof), market-to-book ratio (MTB), collateral value (Coll), and dividend paying status
(Div). These variables are tested against bank book leverage. A statistically significant
result in any one of these variables will reject the first hypothesis and therefore conclude
that capital requirement does not completely determine bank book capital.
H1: The standard determinants of capital structure have no explanatory power for
bank book capital .
While most empirical work on capital structure found no stark distinction between
the book capital and market capital, the difference is of particular interest for banks
because the minimum capital requirement is imposed on book capital.
H2: The standard determinants of capital structure have significant explanatory
power for bank market capital
The determinants considered are the same as the first hypothesis which comprise
size, profitability, market-to-book ratio, collateral value, and dividend paying status.
This time, however, they are tested against bank market leverage. A statistically
significant result in any one of these variables will make it unable to reject the second
hypothesis and therefore conclude that the standard determinants of capital structure are
relevant in explaining variation in bank market capital.
Hypotheses 1 and 2 are tested by estimating Equation (1):
( ), , 1 , 1 , 1 , 1 ,, , , ,i t i t i t i t i t i tL f Size Prof MTB Coll Div− − − −= (1)
where Li,t is the book and market leverage of individual i in period t in the first and
second hypotheses respectively.

9
Regulators require banks to have a minimum level of capital to mitigate downside
risks which include credit, market, and operational risks. Therefore, if risk is the main
driver of bank capital structure, it can be inferred that capital regulation predominantly
determines banks capital structure and the combine impact of the standard determinants
of capital structure will be insignificant:
H3: Asset risk has significant explanatory power for bank capital structure and the
combine impact of the standard determinants of capital structure is insignificant
To test the third hypothesis, a variable to proxy asset risk variable is included and
tested against both book and market leverage. Asset risks reflect the credit, market, and
operational risks faced by the individual banks and are intended to capture the effect of
risk adjustments on the minimum bank capital required. In addition, adding the asset
risk variable as a proxy measure for capital requirement is expected to completely
diminish the overall explanatory power of the standard determinants of capital structure
for bank capital. Therefore, a significant result for asset risk accompanied with an
insignificant overall impact of the standard determinants of capital structure will be
consistent with the third hypothesis and conclude that capital requirement
predominantly determines bank capital structure.
To test Hypothesis 3 equation (2) is estimated:
( ), , 1 , 1 , 1 , 1 , , 1, , , , ,i t i t i t i t i t i t i tL f Size Prof MTB Coll Div Risk− − − − −= (2)
where Riski,t-1 is asset risk.9
To this point, the investigation has focused on the relative roles of regulatory capital
requirement and the standard determinants of capital structure on bank capital that are
specific to banks. There are, however, other additional factors that could potentially
explain bank capital structure such as industry leverage and macroeconomic factors. As
our sample only includes banks industry leverage is not a confounding factor. As for the
macroeconomic factors, they could reflect the environment in which banks operate
considering the crucial role that they play in an economy’s financial and economic
system. In addition, bank capital requirement is subject the effect of procyclicality to
9 Asset risk is defined as the annualised unlevered standard deviation of daily equity returns. Variable constructin is explained in detail in Section 4.

10
macroeconomic indicators.10 Consequently, banks are particularly prone to systematic
risks and it is expected that macroeconomic factors will have significant impact on bank
capital structure decision.
H4: The macroeconomic factors have significant explanatory power for bank capital
structure
The macroeconomic factors to be tested consist of GDP growth and stock market
risk.11 These variables are tested against both book and market leverage. A significant
result in any one of the macroeconomic factor will correspond to the fourth hypothesis
and hence conclude that macroeconomic factors play a role in influencing bank capital
structure decision.
To test the fourth hypothesis the equation (3) is estimated:
, , 1 , 1 , 1 , 1 , , 1 , ,( , , , , , , .... )i t i t i t i t i t i t i t i t i tL f Size Prof MTB Coll Div Risk GDPGrowth StockMktRisk− − − − −= (3)
where GDPGrowthi,t is the real GDP growth and StockMktRiski,t is the volatility of the
stock market.
Finally, the relation between asset risk and bank capital structure is further explored.
In the development of third hypothesis, asset risk is used as a proxy for capital
requirement where it captures the effect of risk adjustments on the minimum capital
required. However, asset risk can alternatively be interpreted in terms of the standard
capital structure theories. It can reflect the effect of “asset substitution” by shareholders,
implying higher agency cost of debt financing. High asset risk can also lead to high
probability of bankruptcy which indicates that the cost of debt will be high.
To identify what asset risk really captures, additional variables are included to the
model to control for the interaction between asset risk and capital requirement. This
analysis utilises an international survey conducted by the World Bank regarding bank
regulation and supervision. Specifically, it uses a question of whether the regulation
explicitly states that the minimum capital requirement imposed on individual banks
10 Procyclicality of bank capital suggests that banks will have to have more capital during an economic downturn. This is caused by the increased ‘probability of default’ and ‘loss given default’ that banks face in this condition which considerably raise the riskiness of the banks. Procyclicality could have the effect of reducing the provision of credits which would worsen the bank performance. 11 Lack of data for some constraints prevented the inclusion of a variable for term structure spread in this draft. This will be addressed in future drafts.

11
varies according to the individual banks’ specific risk. The answer to this question is
reflected in a dummy variable which will have a value of 1 if the answer to the question
is yes and 0 otherwise. Moreover, this dummy variable is interacted with asset risk. If
asset risk serves as a proxy measure for capital requirement, it is therefore expected that
this interaction term has significant impact on bank capital.
H5: Asset risk reflects the effect of risk adjustments on the minimum capital required
and the interaction term between regulatory capital requirement and asset risk has
significant explanatory power for bank capital
A significant result for the interaction term will support the fifth hypothesis and
complements the third hypothesis. It will conclude that asset risk actually captures the
effect of risk adjustments on the minimum capital required as opposed to representing
factors that pertains to the standard capital structure theories.
To test hypothesis 5 Equation (4) is estimated:
, , 1 , 1 , 1 , 1 , , 1 , , , 1( , , , , , , , )i t i t i t i t i t i t i t i t i t i tL f Size Prof MTB Coll Div Risk Reg Reg Risk− − − − − −= ∗ (4)
where Regi,t is a dummy variable whose value is 1 if the regulation imposed on an
individual bank explicitly states that the minimum capital requirement varies according
to the bank’s specific risk, and 0 otherwise.
4. Method and Data Description
4.1 Method
All equations estimated in the study have statistically significant bank and year fixed
effects. Moreover, the null of no correlation between the unobserved bank random
effects with the other regressors in the Hausman (1978)12 test is rejected in all
regressions. For this reason, the fixed-effects estimation method will be used for the
entire analysis.13
12 The test involves testing the hypothesis that the unobserved cross-section random effects are uncorrelated with the other regressors in the model. If there is no such correlation, then a random-effects model should be used over fixed-effects and vice versa. 13 The results apply to both book and market leverage in all equations estmated. The test for the fixed effects is a Likelihood Ratio (LR) test and they all show statistical significance for both bank and year fixed effects at 1% level. An exception is for the regression on book leverage in the first hypothesis where

12
4.1.2 Model Specification and Variable Construction
The study applies two variations of the fixed-effects method where the general
empirical model is specified as follows:
( ) ∑=
− +++=n
jtitijjtiti XaaL
1,1,,, εβ (5)
The first model specifies i and t as bank and year respectively. In the second, the
cross-section identifier i is specified as CAP. Variable CAP consists of the minimum
capital ratios imposed on banks across countries in the sample. This effectively means
that banks are identified from the minimum capital ratio required by their regulator.
Banks from different countries but with the same minimum capital ratio are therefore
considered coming from the same group. Accordingly, Li,t is defined as the level of
leverage for ith individual in year t; Xj,i,t-1 is the jth explanatory variable for the ith
individual in year t-1, ti ,ε is the random error term for individual i in year t, and a is the
intercept.
The following equation is estimated to analyse the first and second hypothesis:
( ) tiittitititititi DivbCollbMTBbprofbSizebaaL ,41,31,21,11,0, ln ε+++++++= −−−− (6)
Li,t is book and market leverage in testing the first and second hypothesis
respectively. Leverage is equal to one minus capital ratio and capital ratio is expressed
as the ratio of equity to asset. Hence, leverage is effectively articulated as the ratio of
non-equity liabilities to assets. Despite the drawbacks of this measure as pointed out in
Rajan and Zingales (1995), the ratio of non-equity liabilities to assets is appropriate for
the purpose of this study in order to correctly analyse the impact of the standard
determinants of capital structure on bank capital ratio.
Market value of equity is obtained from multiplying number of shares by the price
per share. If there are changes in the number of shares outstanding by more than 10
percent within any particular year, the market value of equity for that year is the
weighted average value where the weights are the period of time in which a particular
the fixed effects are significant at 5% level. The Hausman test for the bank random effects shows statistical insignificance at 1% level for all equations.

13
number of shares outstanding holds. Otherwise, end-of-year number of shares and
closing price are used. Market value of assets is defined as the sum of market value of
equity and book value of liabilities.
Regarding the explanatory variables, Ln(Sizei,t-1) is defined as the natural log of
book value of assets where the assets are measured in millions of US dollar. Profi,t-1
represents the return on book value of assets and the total return is equal to the EBIT,
i.e. the sum of pre-tax profit and interest expenses. MTBi,t-1 is the market-to-book ratio
which is equal to the ratio of market to book value of assets. Colli,t-1 reflects the
collateral value which is defined as the total value of tangible assets as a proportion of
book value of assets. The total value of tangible assets include total securities,
investments in derivative securities, investments in other entities, cash and due from
banks, and land and buildings. The study defines cash and due from banks as the sum of
cash, interest and non-interest bearing interbank deposits, and interest and non-interest
bearing balances with the central bank. However, the definition of cash and due from
banks varies across countries. Hence, adjustments have to be made in order to generate
a consistent definition of cash and due from banks. Divi,t is the dividend dummy
variable whose value in a particular year is 1 if the bank pays a dividend within that year
and 0 otherwise.
The third hypothesis involves estimating the following equation:
( ), 0 , 1 1 , 1 2 , 1 3 , 1 4 ,lni t c t i t i t i t i t i tL a a b Size b prof b MTB bColl b Div− − − −= + + + + + +
( ) titiRiskb ,1,5 ln ε++ − (7)
where Li,t represents both book and market leverage. All explanatory variables have
the same definitions as equation (6) except for one additional variable of ln(Riski,t-1)
which is the natural log of asset risk. Asset risk is defined as the annualised unlevered
standard deviation of daily equity return and this is generated by multiplying the
annualised standard deviation of daily stock price return by the ratio of market value of
equity to market value of assets.
Furthermore, the fourth hypothesis is analysed by estimating the following equation:

14
( ) ( ), 0 , 1 1 , 1 2 , 1 3 , 1 4 , 5 , 1ln lni t c t i t i t i t i t i t i tL a a b Size b prof b MTB bColl b Div b Risk− − − − −= + + + + + + +
( ) tititi skStockMktRibGDPGrowthb ,,7,6 ln ε+++ (8)
The two variables added to the equation are GDPGrowthi,t and ln(StockMktRiski,t).
GDPGrowthi,t reflects the real GDP growth which is defined as the annual percentage
change of real GDP for a particular country. Meanwhile, ln(StockMktRiski,t) is the
natural log of stock market risk which is equal to the annualised standard deviation of
daily market index return in a specific country. All other explanatory variables are
defined similarly to those in equation (7).14
Finally, the following equation is estimated to test the fifth hypothesis:
( ) ( ), 0 , 1 1 , 1 2 , 1 3 , 1 4 , 5 , 1ln lni t c i t i t i t i t i t i tL a b Size b prof b MTB b Coll b Div b Risk− − − − −= + + + + + +
( )[ ] titi YearbYearbRiskbb ,981,ti,7ti,6 20052001lnRegReg ε+++×++ − (9)
Li,t depicts book leverage. Regi,t is a dummy variable whose value is equal to 1 if a
bank’s minimum capital ratio varies as a function of the individual banks’ specific risk,
and 0 otherwise. Moreover, the data in this regression only consists of cross-section of
banks in 1997, 2001, and 2005 in which the information about the state of capital
regulation is available. Therefore, the year fixed effect is replaced with year dummy
variables.15
In estimating the above equations, the standard determinants of capital structure
included as explanatory variables are lagged by one year in order to account for possible
time-lagged temporal effects. This includes asset risk. Meanwhile, the dividend dummy
and the macroeconomic explanatory variables which include real GDP growth and stock
market risk are contemporaneous. Bank- and/or year-wise heteroskedasticity can be
reasonably expected to exist in the estimation process. Therefore, the White
heteroskedasticity-consistent covariance estimator for OLS estimation is used to yield a
robust panel fixed-effects model. As the data frequency used in the sample is annual
14 Following Gropp and Heider (2007), the study intended to include the term structure spread
between 3-month deposit rates and 10-year lending rates as a macroeconomic explanatory variable. The purpose of this is to analyse the impact of intermediation role that banks perform on bank capital. However, short-term and long-term interest rates data that are consistent across countries are not available and hence, cannot be collected. Consequently, the term structure spread is not included in the regression. 15 Year 1997 is the dummy reference year.

15
data, period heteroskedasticity can be reasonably ignored. Accordingly, the White cross-
section heteroskedasticity-consistent covariance estimator is used so as to generate
estimates of standard errors that are robust to cross-section heteroskedasticity as well as
potential serial correlations among banks.
4.2 Data
The data comes from several sources. A list of publicly listed banks for each country
was initially collected for each year starting from 1996 until 2005 from OSIRIS Banks
(Financial) of Bureau Van Dijk. The sample only includes banks which are classified as
commercial banks according to Bureau Van Dijk’s Bankscope. All financial statement
data is from BankScope.16 Four categories of banks based on the existence of
subsidiaries and the type of financial statements reported were identified. The group of
banks which have subsidiaries but do not report consolidated statements for the entire
sample period are excluded.17 As a result, a total of 121 banks from the ten developing
countries are collected from 1996-2005.
All market data for the banks which comprise daily closing prices, number of shares
outstanding, and cash dividends are obtained from Compustat Global and Emerging
Market Database (EMDB) Daily Stock. From this, a further 65 banks are eliminated due
to unavailable data so that the final sample consists of 56 banks. Table 1 shows the
details of the sample for each country.
Table 1
Number of Banks across Countries18
Country Banks Brazil 4 India 9
Jordan 6 Korea 7
Malaysia 8
16 From here onwards, commercial banks and bank holding companies will be referred to as banks. 17 The other three categories are described as follows. One group consists of banks which have subsidiaries and report consolidated statements throughout the sample period. Another group includes those banks without subsidiaries in the early stage of the sample period and then become consolidated and report financial statements accordingly. The final group comprises banks which have no subsidiaries throughout the sample period and do not report consolidated statements. 18 This a preliminary sample. The next draft will draw on a sample of banks from Eastern Europe, South East Asia and South America.

16
Mexico 2 Pakistan 4 Thailand 8 Turkey 5
Zimbabwe 3 Total 56
Apart from bank-level data, a number of country-level data was collected.
Compustat Global and EMDB Daily Index database provides data for the daily closing
price of S&P/IFCG Index in local currency. S&P/IFCG (S&P Global) Index is the S&P
Index that represents stock market performance in a particular country without taking
into account restrictions on foreign investors. The use of this index enables comparison
that is consistent across countries as it eliminates inconsistencies arising from differing
methodologies in constructing local market indices.
The Global Market Information Database (GMID) provides information regarding
historical real GDP growth for each country. GMID gather this data from Euromonitor
International, International Monetary Fund (IMF), International Financial Statistics, and
World Economic Outlook/UN/National Statistics. Details on country specific capital
requirements were obtained from the World Bank Data and Research database. This
survey contains information about the minimum capital requirement for each country as
well as about whether the minimum capital ratio imposed on individual banks varies as
a function of the individual banks’ specific risk.
4.3 Descriptive Statistics
Table 2 provides descriptive statistics for the primary independent variables as well
as the book and market capital ratios. The study compares the figures with those of
Gropp and Heider (2007). There is an extremely large variation of bank size in the
sample of developing countries where the largest bank is more than 4,000 times as large
as the smallest bank. Yet, the size of the typical bank in developing countries is only
33.81% of the typical bank in developed countries. Moreover, 43.5% of book value of
assets of the typical bank in developing countries comprises tangible assets whereas for
the typical bank in developed countries it is 26.6%. Other characteristics that show stark
distinction are dividends and asset risk. While more than 94% of listed banks in

17
developed countries pay dividends, only 58% do in developing countries. In addition,
the assets of listed banks in developing countries are typically only one ninth as volatile
as the assets of listed banks in developed countries. In contrast, the profitability and
market-to-book ratio of the typical bank in developing countries are relatively similar to
that in developed countries.
Table 2 Descriptive Statistics
Size is the book value of assets in millions of US dollars. Profits are the return on assets where the return is the sum of pre-tax profits and interest expense. Market-to-book ratio is the ratio of market value of assets to book value of assets. Collateral is the total tangible assets as a proportion of book value of assets. Dividends is a dummy variable whose value is equal to 1 if a bank pays dividends. Asset risk is the annualised unlevered standard deviation of daily equity return. Book capital ratio is book value of equity divided by the book value of assets and market capital ratio is market value of equity divided by market value of assets. Market value of equity is number of shares multiplied by price per share. If there are changes in the number of shares outstanding of more than 10% within a particular year, that year’s market value of equity is a weighted average value. Otherwise, end-of-year value is generated. The mean values are generated by taking the average of banks in all countries over the entire sample period of 1996 to 2005. Financial statement data is taken from Bankscope and market data is obtained from Compustat Global and Emerging Market Database. The mean values from Gropp and Heider (1997) are also provided.
Mean Median Standard
Deviation Max Min
Gropp and Heider (2007), Mean
Size
21,673.5
9
11,679.58
30,395.85
180,805.40
41.28
64,100.00
Profits 0.067 0.059 0.058 0.492 -0.204 0.051 Market-to-book ratio 1.025 1.004 0.119 2.214 0.648 1.065
Collateral 0.435 0.447 0.131 0.761 0.100 0.266
Dividends 0.583 1.000 0.494 1.000 0.000 0.944
Asset risk 0.004 0.002 0.006 0.054 0.000 0.036
Book capital ratio 0.083 0.073 0.075 0.672 -0.314 0.074
Market capital ratio 0.100 0.077 0.090 0.587 0.009 0.127
Given that both book and market capital ratios between the typical listed bank in
developing and developed countries are fairly similar, the significant differences in the
characteristics of the explanatory variables seem to indicate that the standard
determinants of capital structure cannot explain bank capital structure in developing
countries to the same extent as bank capital structure in developed countries.

18
Table 3 shows the correlation matrix among the primary variables. Larger banks
tend to have lower profits, lower growth opportunities, lower collateral value, as well as
lower asset risk. More profitable banks tend to have more growth opportunities, more
collateral value, and the assets are more risky. Banks with high growth opportunities
tend to be less collateralised and the assets are more risky.
Table 3 Correlations among Primary Variables
The correlations are constructed using common sample
Size Profits
Market-to-
book ratio Collateral
Asset risk
Book capital ratio
Market capital ratio
Size 1.000
Profits -0.087 1.000 Market-to-book
ratio -0.092 0.033 1.000
Collateral -0.161 0.241 -0.156 1.000
Asset risk -0.024 0.253 0.329 0.093 1.000 Book capital
ratio -0.113 0.244 -0.179 0.158 0.336 1.000 Market capital
ratio -0.163 0.153 0.662 -0.007 0.532 0.575 1.000
Furthermore, the negative correlation between size and both the book and market
capital ratios implies that larger banks tend to have higher leverage. More profitable
banks tend to have lower leverage. Market-to-book ratio is negatively correlated with
book capital ratio but positively correlated with market capital ratio, implying that banks
with high market-to-book ratio tend have high book leverage but low market leverage.
Tangibility is positively correlated with book capital, suggesting that banks with high
proportion of collateral assets tend to have lower leverage. In general, the majority of
the correlations show consistency with the typical findings in standard capital structure
literature. A number of exceptions include the positive correlation resulted between
market-to-book ratio and book leverage and the negative correlation between tangibility
and leverage.

19
It is interesting to note that asset risk is positively correlated with book capital. Since
asset risk could reflect the significance of regulatory capital requirement in determining
bank capital, the positive correlation therefore gives a preliminary support for the third
hypothesis. It appears that riskier banks hold more book capital because the minimum
capital required by them becomes higher.
5. Results
The results are presented in the following manner. Table 4 presents the regression
results for equation (6) corresponding to the first and second hypothesis. Table 5 shows
the estimation results for equation (7) while Table 6 shows the results for regression of
equation (8). These two tables correspond to hypotheses three and four respectively.
Lastly, Table 7 shows results for estimation of equation (9) related to the fifth
hypothesis.
Considering Table 4, when the dependent variable is book leverage and the cross-
section identifier is bank (Table 4 Column 1), all coefficients are statistically significant.
Collateral and dividends show statistical significance at 1% level, size and market-to-
book ratio are significant at 5%, and profits is the only variable which shows statistical
significance at 10%. While our results indicate the standard capital structure variables
are significant only size and profits have the expected sign. Larger banks in developing
countries are associated with having more leverage while more profitable banks are less
levered. In contrast, market-to-book ratio, collateral, and dividend have contradicting
signs. Banks with high market-to-book ratios are highly levered while banks with high
tangibility are associated with having lower book leverage.
One possible explanation for the positive relation between market-to-book ratio and
bank book leverage is that high market-to-book ratio reflects overpricing in the capital
market. As suggested by the pecking-order theory, the high degree of information
asymmetry between the bank insiders and the market therefore results in banks issuing
more debt.
It is worth noting that the estimated magnitude of collateral coefficient is very small.
This may be explained by the fact that banks in developing countries have on average
43.5 percent of their assets as collateral which is much higher than the average for banks
in developed countries of 26.6 percent. Consequently, the marginal benefits of having

20
one extra dollar of collateral to secure debt could be greatly reduced. The negative
relation between collateral and bank book leverage further suggests that having more
collateral is in fact value-decreasing for banks in issuing new debt.

21
Table 4
Standard Cross-sectional Determinants of Bank Book and Market Leverage The table presents the regression results for equation (6) of bank book and market leverage using the standard determinants of capital structure as explanatory variables. For each book and market leverage, results from the two variations of fixed-effects model are provided. The first variation includes bank and year fixed effects, while the second includes CAP and year fixed effects. Variable CAP comprises the minimum capital ratios imposed on banks so that banks from different countries but with the same minimum capital ratio are considered coming from the same group. All explanatory variables are lagged by one year except dividend dummy. Size is defined as the natural log of book value of assets in millions of US dollar. Profits are the return on book value of assets where the return is the sum of pre-tax profits and interest expense. Market-to-book ratio is the ratio of market value of assets to book value of assets. Collateral is the total tangible assets as a proportion of book value of assets. Dividends is a dummy variable whose value is equal to 1 if a bank pays dividends, and 0 otherwise. Book capital ratio is book value of equity divided by book value of assets and book leverage is defined as one minus book capital ratio. Market capital ratio is market value of equity divided by market value of assets and market leverage is equal to one minus market capital ratio. Market value of equity is number of shares multiplied by price per share. Market value of assets is equal to the sum of market value of equity and book value of liabilities. Financial statement data are obtained from Bankscope and market data are taken from Compustat Global and EMDB. t-statistics are adjusted for cross-section heteroskedasticity and are reported in brackets. p-values are reported in square brackets. Results of corresponding regressions from Gropp and Heider (2007) are provided. The R2 reported in Gropp and Heider (2007) are not the adjusted R2.
Regression (6)
Gropp and Heider (2007)
Table 4, Column 1 (1991-2004)
Book Leverage Market Leverage
Cross-section Identifier Bank CAP Bank
CAP
Book Leverage
Market Leverage
Size 0.020 ** 0.015 *** 0.030 ** 0.007 0.006 0.006
(2.36) (2.73) (2.35) (1.62) (17.65) (9.80)
[0.019] [0.007] [0.019] [0.107]
Profits -0.156 * -0.190 -0.041 -0.115 -0.210 -0.298
(-1.84) (-1.26) (-0.42) (-0.51) (-5.65) (-3.84)
[0.067] [0.211] [0.677] [0.610]
Market-to-book ratio 0.084 ** 0.080 * -0.301 *** -0.478 *** -0.066 -0.560
(2.59) (1.80) (-5.53) (-8.92) (-8.44) (-21.12)
[0.010] [0.075] [0.000] [0.000]
Collateral -0.000 *** -0.000 0.000 -0.000 0.032 0.020
(-3.95) (-1.47) (0.06) (-0.54) (7.37) (2.50)
[0.000] [0.146] [0.950] [0.591]
Dividends 0.008 *** 0.004 -0.008 -0.019 -0.009 -0.019
(2.95) (0.35) (-1.30) (-1.37) (-4.13) (-3.51)
[0.003] [0.730] [0.194] [0.173]
Observations 318 319 318 319 2415 2415
F-test (p-value) 0 0 0 0
Adjusted R2 0.772 0.248 0.757 0.403 0.32 0.71 *, **, and *** reflect significance at 10%, 5%, and 1% respectively. The estimates for bank and year fixed effects are not reported.
The positive relation between dividends and bank book leverage indicates the
relatively higher cost of having equity. Banks which commit to paying out dividends to
their shareholders prefer to finance their operations with debt. This view of regarding
dividends as a cost of having equity is supported by the fact that only 58.3 percent of

22
banks in developing countries do pay dividends as opposed to 94.4 percent for banks in
developed countries.
The explanatory variables considered show statistical significance which is
consistent with Gropp and Heider (2007) and standard capital structure literature.
However, the signs of three variables differ; market-to-book ratio, collateral and
dividends. The results suggest that the standard determinants of capital structure can
explain variations in bank book capital across banks in developing countries. This
conclusion is further confirmed with an F-test on the combined significance of all the
explanatory variables on book leverage which generates statistical significance at 1%
level. In addition, the adjusted R2 is 77.2%, much higher than that reported by Gropp
and Heider of 32%.
The results using the second variation of the model where CAP is specified as the
cross-section identifier are entirely different (Table 4 column 2), particularly with
regard to the statistical significance of the variables. Only size and market-to-book ratio
are statistically significant at 1% and 10% levels respectively. Meanwhile, the signs of
the coefficients are very similar to those using the first variation of the model. The
adjusted R2 is significantly lower at 24.8% although the overall significance of the
explanatory variables still shows a 1% statistical significance. This implies that the
general conclusion that regulatory capital requirement does not completely determines
bank book capital and the standard determinants of capital structure have power in
determining bank book capital still holds. Hence, the first hypothesis that the standard
determinants of capital structure have no explanatory power for bank book capital is
rejected.
Table 4 Column 3 details the regression results for equation (6) when the dependent
variable is bank market leverage and the cross-section identifier is bank. All of the
explanatory variables now have signs that are consistent with both Gropp and Heider
(2007) and the typical findings in standard capital structure literature. However, size and
market-to-book ratio are now the only variables which are statistically significant at 5%
and 1% levels respectively despite the fact the combined impact of the explanatory
variables are still significant at 1%. This is in contrast with Gropp and Heider (2007)
who found virtually no change in both sign and statistical significance of the individual
explanatory variables between book and market leverage.

23
Another noticeable difference relative to bank book leverage is the fact that, in
absolute value, the coefficient of market-to-book ratio becomes more than 3.5 higher.
This could reflect the spurious correlation arising from having market values on both
sides of the equation. Alternatively, it could be that growth opportunities reflected by
market-to-book ratio matter a lot for a forward looking measure of liabilities which is
what market leverage essentially reflects. Moreover, the coefficients of size and profits
have changed in absolute value by 50% and -73.7% respectively. These changes are
consistent with the changes in the corresponding correlations of the two variables with
book and market capital ratios generated in the preceding descriptive statistics section.
Table 4 Column 4 details the regression results for equation (6) when the dependent
variable is bank market leverage and the cross-section identifier is CAP. The market-to-
book ratio is the only significant variable. Moreover, the majority of the coefficient
magnitudes have changed significantly in absolute value except for collateral (which
however, has changed sign). The most noticeable change is the coefficient of market-to-
book ratio whose magnitude becomes almost 6 times higher. The results indicate that
the standard determinants of capital structure do not have as strong explanatory power
for bank market leverage as they do for bank book leverage.
Table 5 contains the regression results for Equation (7) using the two variations of
fixed-effect model. Panel A presents the estimation results on book and market leverage
using the first variation of the model where bank is the cross-section identifier. The
variable asset risk is statistically significant in both regressions on book and market
leverage at 5% and 1% respectively. In addition, the coefficients have the same sign and
very similar magnitudes in both regressions. Consistent with Gropp and Heider’s (2007)
finding, banks with more volatile assets tend to have lower leverage (or equivalently,
higher capital). On one hand, this is consistent with the argument that asset risk captures
the effect of risk adjustments on the minimum capital required by banks. Regulators
impose higher minimum capital requirement on riskier banks in order to mitigate
downside risks and these banks are consequently less levered. On the other hand, the
negative relation between asset risk and leverage could be interpreted in terms of the
standard capital structure theories. Riskier assets could reflect the effect of “asset
substitution” by shareholders (the agency cost theory). Alternatively, banks with more

24
risky assets could be associated with a higher probability of bankruptcy (the static trade-
off theory). Both arguments lead banks to having a lower level of leverage.
When we control for asset there is virtually no change observed in terms of both the
statistical significance and sign for the standard capital structure variables. Slight
changes, however, are observed for several coefficient magnitudes in both regressions.
In addition, the combined impact of the standard determinants of capital structure is still
significant in explaining both bank book and market leverage at 1%.
The results when equation (7) is estimated using the cross-section identifier CAP
generates similar results (Table 5 Panel B). This is particularly so for the statistical
significance and the sign of the estimated coefficient for asset risk in both regressions
on book and market leverage. As for the explanatory variables other than asset risk,
there are no changes in terms of both the statistical significance and sign except for the
fact that collateral is now significant at 1% for the regression on book leverage.
Moreover, the overall impact of the standard determinants of capital structure remains
significant at 1% in explaining both bank book and market leverage which corresponds
to the first specification of the model.

25
Table 5
Standard Cross-sectional Determinants of Bank Book and Market Leverage after Controlling for Asset Risk
The table presents the regression results for equation (7) of bank book and market leverage using the standard determinants of capital structure as explanatory variables while controlling for asset risk. Panel A provides the results using the first variation of fixed-effect model where it includes bank and year fixed effects. Panel B provides the results using the second variation where it includes CAP and year fixed effects. Variable CAP comprises the minimum capital ratios imposed on banks so that banks from different countries but with the same minimum capital ratio are considered coming from the same group. All explanatory variables are lagged by one year except dividend dummy. Size is defined as the natural log of book value of assets in millions of US dollar. Profits are the return on assets where the return is the sum of pre-tax profits and interest expense. Market-to-book ratio is the ratio of market value of assets to book value of assets. Collateral is the total tangible assets as a proportion of book value of assets. Dividends is a dummy variable whose value is equal to 1 if a bank pays dividends, and 0 otherwise. Asset risk is the annualised unlevered standard deviation of daily equity return. Book capital ratio is book value of equity divided by book value of assets and book leverage is defined as one minus book capital ratio. Market capital ratio is market value of equity divided by market value of assets and market leverage is equal to one minus market capital ratio. Market value of equity is number of shares multiplied by price per share. Market value of assets is equal to the sum of market value of equity and book value of liabilities. Financial statement data are obtained from Bankscope and market data are taken from Compustat Global and EMDB. t-statistics are adjusted for cross-section heteroskedasticity and are reported in brackets. p-values are reported in square brackets.
Panel A: Cross-section Identifier is Bank
Book Leverage Market Leverage
Table 4 Regression (7) Table 4 Regression (7)
Size 0.020 ** 0.019 ** 0.030 ** 0.030 ** (2.36) (2.40) (2.35) (2.32) [0.019] [0.017] [0.019] [0.021] Profits -0.156 * -0.153 * -0.041 -0.039 (-1.84) (-1.76) (-0.42) (-0.38) [0.067] [0.080] [0.677] [0.701] Market-to-book ratio 0.084 ** 0.118 *** -0.301 *** -0.266 *** (2.59) (3.37) (-5.53) (-4.79) [0.010] [0.001] [0.000] [0.000] Collateral -0.000 *** -0.000 *** 0.000 -0.000 (-3.95) (-3.29) (0.06) (-1.23) [0.000] [0.001] [0.950] [0.221] Dividends 0.008 *** 0.008 *** -0.008 -0.008 (2.95) (3.15) (-1.30) (-1.27) [0.003] [0.002] [0.194] [0.205] Asset risk -0.007 ** -0.008 *** (-2.21) (-3.63) [0.028] [0.000] Observations 318 318 318 318
Adjusted R2 0.772 0.778 0.757 0.758 F-test (p-value)† 0.000 0.000

26
Panel B: Cross-section Identifier is CAP
Size 0.015 *** 0.010 * 0.007 0.002 (2.73) (1.78) (1.62) (0.37) [0.007] [0.078] [0.107] [0.710] Profits -0.190 -0.181 -0.115 -0.107 (-1.26) (-1.44) (-0.51) (-0.54) [0.211] [0.152] [0.610] [0.589] Market-to-book ratio 0.080 * 0.203 *** -0.478 *** -0.365 *** (1.80) (5.21) (-8.92) (-6.12) [0.075] [0.000] [0.000] [0.000] Collateral -0.000 -0.000 *** -0.000 -0.000 (-1.47) (-3.82) (-0.54) (-1.10) [0.146] [0.000] [0.591] [0.273] Dividends 0.004 0.014 -0.019 -0.010 (0.35) (1.55) (-1.37) (-0.84) [0.730] [0.125] [0.173] [0.405] Asset risk -0.029 *** -0.027 ** (-6.16) (-2.29) [0.000] [0.024] Observations 319 319 319 319
Adjusted R2 0.248 0.415 0.403 0.455 F-test (p-value) † 0.000 0.000 *, **, and *** reflect significance at 10%, 5%, and 1% respectively. † The null is all coefficients other than asset risk are insignificant.
Table 6 provides the results for Equation (8) using the two variations of fixed-effects
model. Panel A presents the estimation results on book and market leverage using
specification 1 where bank is the cross-section identifier. For both regressions on book
and market leverage, real GDP growth and stock market risk are not statistically
significant in explaining bank leverage both individually and collectively. Moreover,
adding the two macroeconomic factors virtually does not change the statistical
significance as well as the sign of the coefficients of the standard determinants of capital
structure. There are, however, slight changes in the magnitude of the coefficients but
they are trivial. These results are generally in line with those found by Gropp and
Heider (2007) except for the fact that they found 5% significance for stock market risk.
27
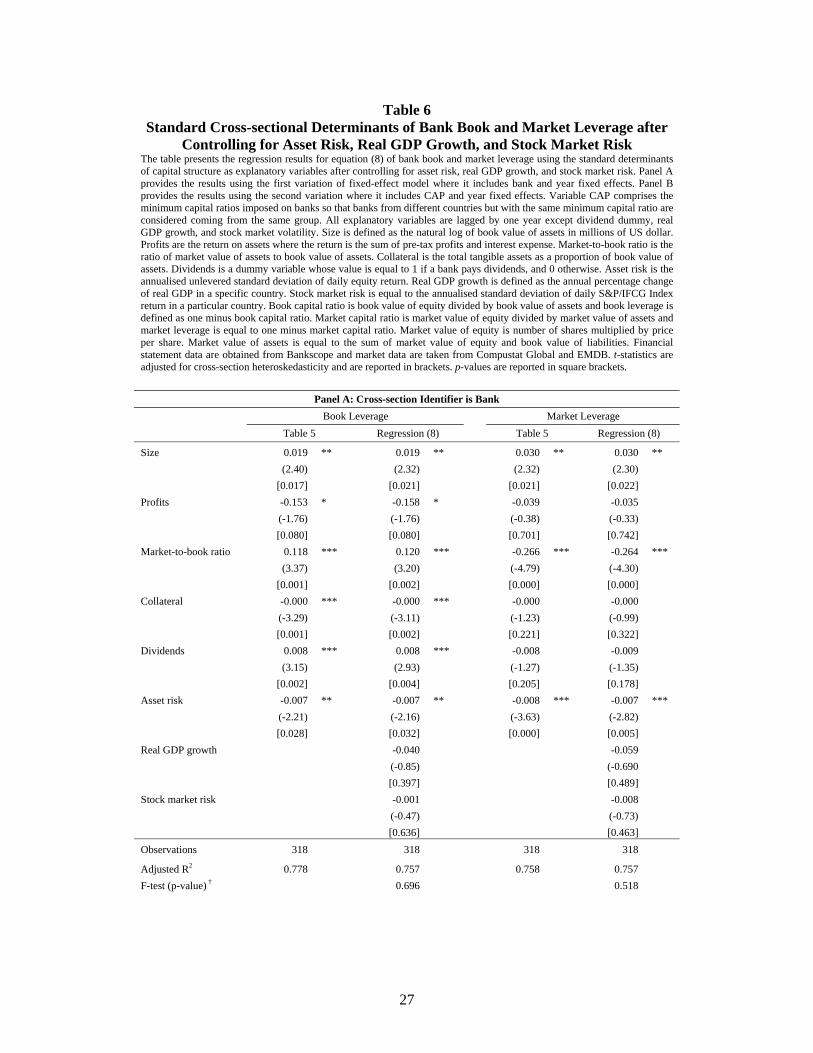
Table 6 Standard Cross-sectional Determinants of Bank Book and Market Leverage after
Controlling for Asset Risk, Real GDP Growth, and Stock Market Risk The table presents the regression results for equation (8) of bank book and market leverage using the standard determinants of capital structure as explanatory variables after controlling for asset risk, real GDP growth, and stock market risk. Panel A provides the results using the first variation of fixed-effect model where it includes bank and year fixed effects. Panel B provides the results using the second variation where it includes CAP and year fixed effects. Variable CAP comprises the minimum capital ratios imposed on banks so that banks from different countries but with the same minimum capital ratio are considered coming from the same group. All explanatory variables are lagged by one year except dividend dummy, real GDP growth, and stock market volatility. Size is defined as the natural log of book value of assets in millions of US dollar. Profits are the return on assets where the return is the sum of pre-tax profits and interest expense. Market-to-book ratio is the ratio of market value of assets to book value of assets. Collateral is the total tangible assets as a proportion of book value of assets. Dividends is a dummy variable whose value is equal to 1 if a bank pays dividends, and 0 otherwise. Asset risk is the annualised unlevered standard deviation of daily equity return. Real GDP growth is defined as the annual percentage change of real GDP in a specific country. Stock market risk is equal to the annualised standard deviation of daily S&P/IFCG Index return in a particular country. Book capital ratio is book value of equity divided by book value of assets and book leverage is defined as one minus book capital ratio. Market capital ratio is market value of equity divided by market value of assets and market leverage is equal to one minus market capital ratio. Market value of equity is number of shares multiplied by price per share. Market value of assets is equal to the sum of market value of equity and book value of liabilities. Financial statement data are obtained from Bankscope and market data are taken from Compustat Global and EMDB. t-statistics are adjusted for cross-section heteroskedasticity and are reported in brackets. p-values are reported in square brackets.
Panel A: Cross-section Identifier is Bank Book Leverage Market Leverage Table 5 Regression (8) Table 5 Regression (8)
Size 0.019 ** 0.019 ** 0.030 ** 0.030 ** (2.40) (2.32) (2.32) (2.30) [0.017] [0.021] [0.021] [0.022] Profits -0.153 * -0.158 * -0.039 -0.035 (-1.76) (-1.76) (-0.38) (-0.33) [0.080] [0.080] [0.701] [0.742] Market-to-book ratio 0.118 *** 0.120 *** -0.266 *** -0.264 *** (3.37) (3.20) (-4.79) (-4.30) [0.001] [0.002] [0.000] [0.000] Collateral -0.000 *** -0.000 *** -0.000 -0.000 (-3.29) (-3.11) (-1.23) (-0.99) [0.001] [0.002] [0.221] [0.322] Dividends 0.008 *** 0.008 *** -0.008 -0.009 (3.15) (2.93) (-1.27) (-1.35) [0.002] [0.004] [0.205] [0.178] Asset risk -0.007 ** -0.007 ** -0.008 *** -0.007 *** (-2.21) (-2.16) (-3.63) (-2.82) [0.028] [0.032] [0.000] [0.005] Real GDP growth -0.040 -0.059 (-0.85) (-0.690 [0.397] [0.489] Stock market risk -0.001 -0.008 (-0.47) (-0.73) [0.636] [0.463] Observations 318 318 318 318
Adjusted R2 0.778 0.757 0.758 0.757 F-test (p-value) † 0.696 0.518

28
Panel B: Cross-section Identifier is CAP
Size 0.010 * 0.010 * 0.002 0.004 (1.78) (1.67) (0.37) (0.86) [0.078] [0.099] [0.710] [0.392] Profits -0.181 -0.207 * -0.107 -0.120 (-1.44) (-1.69) (-0.54) (-0.64) [0.152] [0.094] [0.589] [0.524] Market-to-book ratio 0.203 *** 0.216 *** -0.365 *** -0.349 *** (5.21) (6.33) (-6.12) (-5.47) [0.000] [0.000] [0.000] [0.000] Collateral 0.000 *** 0.000 *** 0.000 0.000 (-3.82) (-4.96) (-1.10) (-1.47) [0.000] [0.000] [0.273] [0.146] Dividends 0.014 0.014 -0.010 -0.013 (1.55) (1.590 (-0.84) (-1.14) [0.125] [0.115] [0.405] [0.259] Asset risk -0.029 *** -0.030 *** -0.027 ** -0.024 *** (-6.16) (-8.09) (-2.29) (-2.65) [0.000] [0.000] [0.024] [0.009] Real GDP growth -0.159 *** -0.393 * (-2.71) (-1.86) [0.008] [0.065] Stock market risk -0.002 -0.030 (-0.19) (-1.48) [0.851] [0.141] Observations 319 319 319 319
Adjusted R2 0.415 0.413 0.455 0.470 F-test (p-value) † 0.000 0.173 *, **, and *** reflect significance at 10%, 5%, and 1% respectively. † The null is Real GDP growth and Stock market risk are insignificant.
The insignificance of both real GDP growth and stock market risk may be due to the
presence of bank and year fixed effects which show significant impact in explaining
bank book and market leverage. If both fixed effects are not included, stock market risk
becomes significant at 1% and 5% on book and market leverage respectively.
In Panel B of Table 6, the results for specification 2 in which CAP is the cross-
section identifier are provided. In contrast to specification 1, real GDP growth is
statistically significant in explaining bank book and market leverage at 1% and 10%
respectively. However, while the two macroeconomic factors are collectively significant
at 1% when the dependent variable is book leverage, this is not the case when the
dependent variable is market leverage. With the exception of profits, no significant
changes are observed in terms of statistical significance, coefficient signs or magnitudes
for the standard capital structure variables. The mixed results generated between the two

29
variations of the model suggest that there is no strong evidence to suggest that
macroeconomic factors significantly affect bank capital structure. However, the results
should be treated with caution as the term structure spread is omitted.
Table 7 provides details of the regression results for equation (9) on bank book
leverage using the two variations of fixed-effects model. Where the cross-section
identifier is bank, the interaction term between regulatory capital requirement and asset
risk is not statistically significant. Furthermore, the coefficients for asset risk alone and
for each of the standard determinants of capital structure are significant except for
dividend. This implies that asset risk in fact represents factors that pertain to the
standard capital structure theories such as the “asset substitution effect” or the
probability of bankruptcy as opposed to capturing the effect of risk adjustments on the
minimum capital required.
Meanwhile, the estimation using the second variation of the model where CAP is the
cross-section identifier yields a different result. While the interaction term between
regulatory capital requirement and asset risk is insignificant, the individual asset risk
and regulatory capital requirement variables do have statistically significant coefficients
at 5%. In addition, all of the explanatory variables representing the standard
determinants of capital structure are insignificant. This finding seems to suggest that
regulatory capital requirement plays a predominant role in determining bank capital
structure after taking into account the varying minimum capital ratio imposed on banks
across countries as well as the fact that the minimum requirement can vary according to
the individual banks’ specific risks. It further suggests that asset risk captures the effect
of risk adjustments on the minimum capital required rather than representing factors that
pertain to the standard capital structure theories.
The mixed results generated between the two variations of the model do not provide
strong evidence to support one of the two interpretations considered for asset risk.
Therefore, the fifth hypothesis that asset risk reflects the effect of risk adjustments on
the minimum capital required and the interaction term between regulatory capital
requirement and asset risk has significant explanatory power for bank capital cannot be
soundly rejected. As a result, the implication indicated in the third hypothesis that asset
risk should be interpreted more appropriately in terms of the standard capital structure

30
theories as opposed to as capturing the effect of risk adjustments on the minimum
capital required by banks cannot be confirmed.
The preceding analysis provides evidence of the relevance of standard determinants
of capital structure in explaining variation in bank capital in ten developing countries.
This prompts the question as to whether banks hold excess capital due to factors
determined by the market or only in order to hold a buffer capital. In order to analyse
this, the findings are re-examined by considering whether the explanatory variables can
be interpreted in a way that suggests banks hold excess capital just to insure against
having to raise new equity in short notice at less favourable prices.
Gropp and Heider (2007) argued that banks which face higher risk of underpricing
should hold more excess capital to avoid having to raise new equity in short notice at
cheaper prices. They suggested that larger banks face less risk of underpricing and the
positive relation found between size and bank leverage (or equivalently, negative
relation with capital) is therefore consistent with the idea of excess capital as a buffer.
However, they did not find such supporting evidence for the buffer theory of excess
capital with market-to-book ratio, profitability, and dividend paying status of banks.
Essentially, the relations estimated for the three explanatory variables suggest that banks
hold more excess capital unnecessarily since they can raise new equity capital more
easily due to higher growth opportunities, more stability in generating profits, and more
frequent dividend payout. In addition, the upward trend in market capital ratios of their
sample provides further evidence against the buffer theory. Accordingly, Gropp and
Heider (2007) concluded that their findings tend to support the argument that, in
developed countries, regulation does not completely determine bank capital holding and
market plays a role in influencing the level of capital banks hold in excess of the
required minimum capital.

31
Table 7 Does Leverage Depend More on Risk when Capital Regulation Explicitly States the
Minimum Capital Ratios Vary with Individual Banks’ Specific Risk? The table presents the regression results for equation (9) on bank book leverage to disentangle the effect of regulatory capital requirement from the standard determinants of capital structure inherent in asset risk. The results from the two variations of fixed-effects model are provided. The first variation includes bank fixed effect, while the second includes CAP fixed effect. Variable CAP comprises the minimum capital ratios imposed on banks so that banks from different countries but with the same minimum capital ratio are considered coming from the same group. All explanatory variables are lagged by one year except dividend dummy, regulation dummy, and the two year dummies. Size is defined as the natural log of book value of assets in millions of US dollar. Profits are the return on assets where the return is the sum of pre-tax profits and interest expense. Market-to-book ratio is the ratio of market value of assets to book value of assets. Collateral is the total tangible assets as a proportion of book value of assets. Dividends is a dummy variable whose value is equal to 1 if a bank pays dividends, and 0 otherwise. Asset risk is the annualised unlevered standard deviation of daily equity return. Reg is a dummy variable whose value is equal to 1 if banks’ minimum capital ratio varies as a function of the individual banks’ specific risk, and 0 otherwise. Book capital ratio is book value of equity divided by book value of assets and book leverage is defined as one minus book capital ratio. Market capital ratio is market value of equity divided by market value of assets and market leverage is equal to one minus market capital ratio. Market value of equity is number of shares multiplied by price per share. Market value of assets is equal to the sum of market value of equity and book value of liabilities. Financial statement data are obtained from Bankscope and market data are taken from Compustat Global and EMDB. t-statistics are adjusted for cross-section heteroskedasticity and are reported in brackets. p-values are reported in square brackets. Both regressions only include the cross-section of banks in 1997, 2001, and 2005.
Book Leverage, Regression (9)
Cross-section Identifier Bank CAP
Size 0.016 *** 0.003
(67.98) (1.11)
[0.000] [0.270]
Profits 0.278 *** -0.413
(6.32) (-1.55)
[0.000] [0.125]
Market-to-book ratio 0.243 *** 0.106
(4.98) (0.95)
[0.000] [0.347]
Collateral -0.046 ** -0.013
(-2.33) (-0.63)
[0.025] [0.530]
Dividends 0.003 0.002
(0.67) (0.35)
[0.504] [0.730]
Asset risk -0.021 ** -0.027 **
(-2.08) (-2.21)
[0.045] [0.030]
Reg 0.017 0.133 **
(0.37) (2.00)
[0.711] [0.048]
Reg*Asset risk 0.004 0.016
(0.52) (1.48)
[0.609] [0.144]
Year2001 0.022 *** 0.002
(4.36) (0.19)
[0.000] [0.852]
Year2005 0.008 -0.014 ***
(0.83) (-2.88)
[0.414] [0.005]
Observations 98 97
Adjusted R2 0.626 0.399 *, **, and *** reflect significance at 10%, 5%, and 1% respectively.

32
With regard to banks in developing countries, the study finds a positive relation
between size and both book and market leverage. This suggests that larger banks tend to
hold less excess capital for buffer as they are less subject to underpricing so they can
raise new equity in short notice at relatively fair prices. Moreover, further evidence
supporting the buffer theory is found in the relations estimated for market-to-book ratio
and the dividend paying status of banks on book leverage. Banks with higher market-to-
book ratio or with more frequent dividend payout tend to have less excess book capital
since they can raise new equity more easily at fair prices due to higher growth
opportunities and less information asymmetry regarding the banks’ future prospects
which is signalled by the dividends. However, the opposite is found in the relations
estimated for the two variables on market leverage and the study finds a negative
relation estimated between profitability and both book and market leverage. This
provides evidence against the buffer capital theory
Collectively, the buffer theory of excess capital seems to explain the level of excess
book capital that banks hold while the excess market capital held by banks seems to be
determined more by market pressures. This observation provides a new insight
regarding the factors affecting the bank capital structure decision between developed
and developing countries. While Gropp and Heider (2007) find no evidence to justify
stark distinction between book and market leverage for banks in developed countries,
the study provides support to do so for banks in developing countries.
6. Conclusion
In this study we examined whether the standard determinants of capital structure are
significant factors in determining the level of bank capital in developing countries.
Using a sample of 56 publicly listed commercial banks from ten developing countries
we find the standard determinants of capital structure do have explanatory power in
explaining variation in bank capital above the minimum requirement. This result holds
for both bank book and market capital.
When we control for asset risk the overall significance of the standard determinants
of capital structure in bank capital structure choice does not change. While this implies
that asset risk more appropriately represents factors that pertain to the standard capital
structure theories rather than capturing the effect of risk adjustments on the minimum

33
capital required, this cannot be confirmed due to the mixed outcome resulted when
analysing asset risk in more detail. Moreover, there seems to be some evidence
supporting the significance of macroeconomic factors in determining bank capital
structure although it is statistically significant.
The results for book capital support the buffer theory of excess capital. Conversely,
no such evidence found for bank market capital. When compared to developed
countries, the private sector in developing countries does seem to play a significant role
in affecting the choice of bank capital structure. For market capital, the private sector is
considered as functioning relatively well to assist the regulators in limiting the risk-
taking behaviour by banks.

34
References
Aggarwal, Raj, and Sutthisit Jamdee, 2003, Determinants of capital structure: evidence from the G-7 countries, in Presentation at Financial Management Association meeting (Denver, Colorado).
Avery, Robert B., Terrence M. Belton, and Michael A. Goldberg, 1988, Market discipline in regulating bank risk: new evidence from the capital markets, Journal of Money, Credit, and Banking, 597-619.
Baker, Malcolm, and Jeffrey Wurgler, 2002, Market timing and capital structure, Journal of Finance 57, 1-32.
Barth, James R., Gerard Caprio Jr., and Ross Levine, 2004, Bank regulation and supervision: what works best? Journal of Financial Intermediation 13, 205-248.
Basel Committee on Banking Supervision, 2006, International Convergence of Capital Measurement and Capital Standard: A Revised Framework, Comprehensive Version, Switzerland.
Besanko, David, and George Kanatas, 1996, The regulation of bank capital: do capital standards promote bank safety? Journal of Financial Intermediation 5, 160-183.
Bliss, Robert, and Mark Flannery, 2000, Market discipline in the governance of U.S. bank holding companies: monitoring vs. influencing, Working paper, Federal Reserve Bank of Chicago.
Blum, Jurg, 1999, Do capital adequacy requirements reduce risks in banking? Journal of Banking & Finance 23, 755-771.
Booth, Laurence, Varouj Aivazian, Asli Demirgüc-Kunt, and Vojislav Maksimovic, 2001, Capital structures in developing countries, Journal of Finance 56, 87-130.
Caprio Jr., Gerard, and Daniela Klingebiel, 1999, Episodes of systemic and borderline financial crises, Mimeo, World Bank.
Demirgüc-Kunt, Asli, and Enrica Detragiache, 1998, The determinants of banking crises in developing and developed countries, IMF Staff Papers 45, 81-109.
Dewatripont, Mathias, and Jean Tirole, 1994, The Prudential Regulation of Banks, (MIT Press, Cambridge).
Diamond, Douglas W., and Raghuram G. Rajan, 2000, A theory of bank capital, Journal of Finance 55, 2431-2465.
Flannery, Mark J., and Sorin M. Sorescu, 1996, Evidence of bank market discipline in subordinated debenture yields: 1983-1991, Journal of Finance 51, 1347-1377.
Frank, Murray Z., and Vidhan K. Goyal, 2005, Capital structure decisions: which factors are reliably important? Working paper, University of British Columbia.
Gorton, Gary B., and Andrew Winton, 2000, Liquidity provision, bank capital, and the macroeconomy, Mimeo, University of Minnesota.
Greene, William H., 2000, Econometric Analysis, International ed., (Prentice Hall International, Inc., New Jersey).
Gropp. Reint, and Florian Heider, 2007, What can corporate finance say about banks’ capital structures? Working paper, SSRN.
Harris, Milton, and Artur Raviv, 1991, The theory of capital structure, Journal of Finance 46, 297-355.
Hausman, Jerry, 1978, Specification tests in econometrics, Econometrica 46, 1251-1272.
Hsiao, Cheng, 1986, Analysis of Panel Data, (Cambridge University Press, Cambridge, England).

35
Jagtiani, Julapa, George Kaufman, and Catharine Lemieux, 2000, Do markets discipline banks and bank holding companies? Evidence from debt pricing, Federal Reserve Bank of Chicago, Supervision and Regulation Department.
Jensen, Michael C., 1986, Agency costs of free cash flow, corporate finance and takeovers, American Economic Review 76, 323-339.
Jensen, Michael C., and William Meckling, 1976, Theory of the firm: managerial behavior, agency costs and capital structure, Journal of Financial Economics 3, 305-360.
Kim, Daesik, and Anthony M. Santomero, 1988, Risk in banking and capital regulation, Journal of Finance 35, 1219-1233.
Koehn, Michael, and Anthony M. Santomero, 1980, Regulation of bank capital and portfolio risk, Journal of Finance 35, 1235-1250.
Levine, Ross, 1997, Financial development and economic growth: views and agenda, Journal of Economic Literature 35, 688-726.
Miller, Merton H., 1995, Do the M&M propositions apply to banks? Journal of Banking & Finance 19, 483-489.
Mishkin, Frederic S., 2000, The Economics of Money, Banking and Financial Markets, 6th ed., (Addison Wesley, New York).
Modigliani, Franco, and Merton H. Miller, 1958, The cost of capital, corporation finance, and the theory of investment, American Economic Review 48, 261-297.
Morgan, Donald P., and Kevin J. Stiroh, 2001, Market discipline of banks: the asset test, Journal of Financial Services Research 20, 195-208.
Myers, Stewart, 1984, The capital structure puzzle, Journal of Finance 39, 575-592. Myers, Stewart, and Nicholas Majluf, 1984, Corporate financing and investment
decisions when firms have information that investors do not have, Journal of Financial Economics 13, 187-221.
Rajan, Raghuram G., and Luigi Zingales, 1995, What do we know about capital structure? Some evidence from international data, Journal of Finance 50, 1421-1460.
Thakor, Anjan V., 1996, Capital requirements, monetary policy, and aggregate bank lending: theory and evidence, Journal of Finance 51, 279-324.
Titman, Sheridan, and Roberto Wessels, 1988, The determinants of capital structure choice, Journal of Finance 43, 1-19.