Embed Size (px)
Citation preview
Journal of VLSI Signal Processing 18, 251–262 (1998)c© 1998 Kluwer Academic Publishers. Manufactured in The Netherlands.
Detection of Clustered Microcalcifications on Mammograms UsingSurrounding Region Dependence Method and Artificial Neural Network
JONG KOOK KIMDepartment of Information and Communication Engineering, Korea Advanced Institute of Science
and Technology, 207-43, Cheongryangri, Dongdaemungu, Seoul 130-012, Korea
JEONG MI PARK AND KOUN SIK SONGDepartment of Diagnostic Radiology, Asan Medical Center, University of Ulsan College of Medicine, 388-1,
Poongnap-Dong, Songpagu, Seoul 138-040, Korea
HYUN WOOK PARKDepartment of Information and Communication Engineering, Korea Advanced Institute of Science
and Technology, 207-43, Cheongryangri, Dongdaemungu, Seoul 130-012, Korea
Received September 21, 1996; Revised April 15, 1997
Abstract. Clustered microcalcifications on X-ray mammograms are an important sign in the detection of breastcancer. A statistical texture analysis method, called the surrounding region dependence method (SRDM), is proposedfor the detection of clustered microcalcifications on digitized mammograms. The SRDM is based on the second-order histogram in two surrounding regions. This method defines four textural features to classify region of interests(ROIs) into positive ROIs containing clustered microcalcifications and negative ROIs of normal tissues. The databaseis composed of 64 positive and 76 negative ROI images, which are selected from digitized mammograms witha pixel size of 100× 100 µm2 and 12 bits per pixel. An ROI is selected as an area of 128× 128 pixels onthe digitized mammograms. In order to classify ROIs into the two types, a three-layer backpropagation neuralnetwork is employed as a classifier. A segmentation of individual microcalcifications is also proposed to show theirmorphologies. The classification performance of the proposed method is evaluated by using the round-robin methodand a free-response receiver operating-characteristics (FROC) analysis. A receiver operating-characteristics (ROC)analysis is employed to present the results of the round-robin testing for the case of several hidden neurons. Thearea under the ROC curve,Az, is 0.997, which is achieved in the case of 4 hidden neurons. The FROC analysisis performed on 20 cropped images. A cropped image is selected as an area of 512× 512 pixels on the digitizedmammograms. In terms of the FROC, a sensitivity of more than 90% is obtained with a low false-positive (FP)detection rate of 0.67 per cropped image.
1. Introduction
Breast cancer is one of the major causes of death amongall cancers for middle-aged and older women, espe-cially in developed countries [1]. The early detection ofbreast cancer is the most important factor for reducingbreast cancer mortality. X-ray mammography is themost effective method for early detection of breast
cancer [2]. However, it is very difficult to interpretX-ray mammograms because of the small differencesin the image densities of various breast tissues, in par-ticular, for dense breasts [3].
Microcalcifications, which are early signatures fordiscriminating between normal and cancerous tis-sues, are dot-like deposits of calcium. One of theimportant indicators for breast cancer is clustered
252 Kim et al.
microcalcifications with individual microcalcificationsof up to about 0.7 mm in diameter and with an aver-age diameter of 0.3 mm [4]. Because the classificationof clustered microcalcifications into benign and malig-nant tissues requires more information, such as size andmorphology of the individual microcalcifications, clus-tered microcalcifications that may herald early-stagecancer should be carefully evaluated [3]. However, itis very difficult to detect the individual microcalcifica-tions because they are variable in shape, as well as insize, and may be embedded in areas of dense parency-mal tissues.
Accurate detection of the clustered microcalcifica-tions would improve diagnosis sensitivity as well asreduce the number of unnecessary biopsies. The im-proper diagnosis of radiologists can be attributed toseveral factors, including poor image quality and hu-man oversight. Computer-aided diagnosis (CAD) hasbeen of interest to many researchers for the detection ofmicrocalcifications on digitized mammograms [5–14].CAD can be used to alert radiologists to locations ofsuspicious lesions and to serve as a second opinion thatthe radiologists can take into consideration in makingthe final interpretation.
In this paper, a CAD method is proposed for thedetection of clustered microcalcifications on digitizedmammograms. The proposed method consists of thesurrounding region dependence method (SRDM), fea-ture extraction, a classifier, and segmentation of the mi-crocalcifications. The proposed SRDM is a statisticaltexture analysis based on a second-order histogram intwo surrounding regions. Four textural features, whichare defined in this paper, are used as inputs to the clas-sifier. Feature extraction is of key significance for theoverall system performance. In order to classify re-gions of interest (ROIs), a three-layer backpropaga-tion neural network [15] is employed as a classifier.ROIs classified as positive are segmented into bina-rized images to show the morphologies of the indivi-dual microcalcifications.
In Section 2 of this paper, the proposed method ispresented in detail. The evaluation results from theround-robin method and FROC analysis are presentedand discussed in Section 3, followed by the conclusionsin Section 4.
2. Proposed Method
This section presents the details of the proposed methodwhich consists of the SRDM, feature extraction, aclassifier, and segmentation of the microcalcifications.
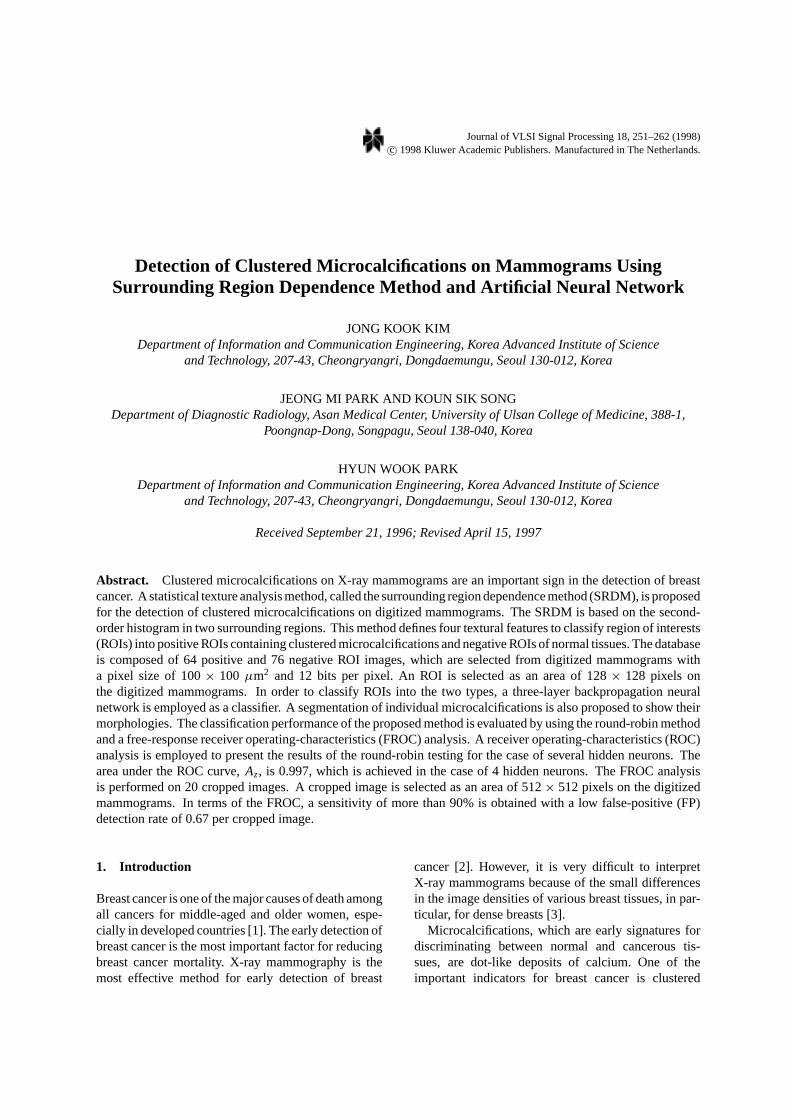
Figure 1. Block diagram of the proposed method for the detectionof clustered microcalcifications on digitized mammograms.
Figure 1 shows a block diagram of the proposed methodfor the detection of clustered microcalcifications ondigitized mammograms.
A. Surrounding Region DependenceMethod (SRDM)
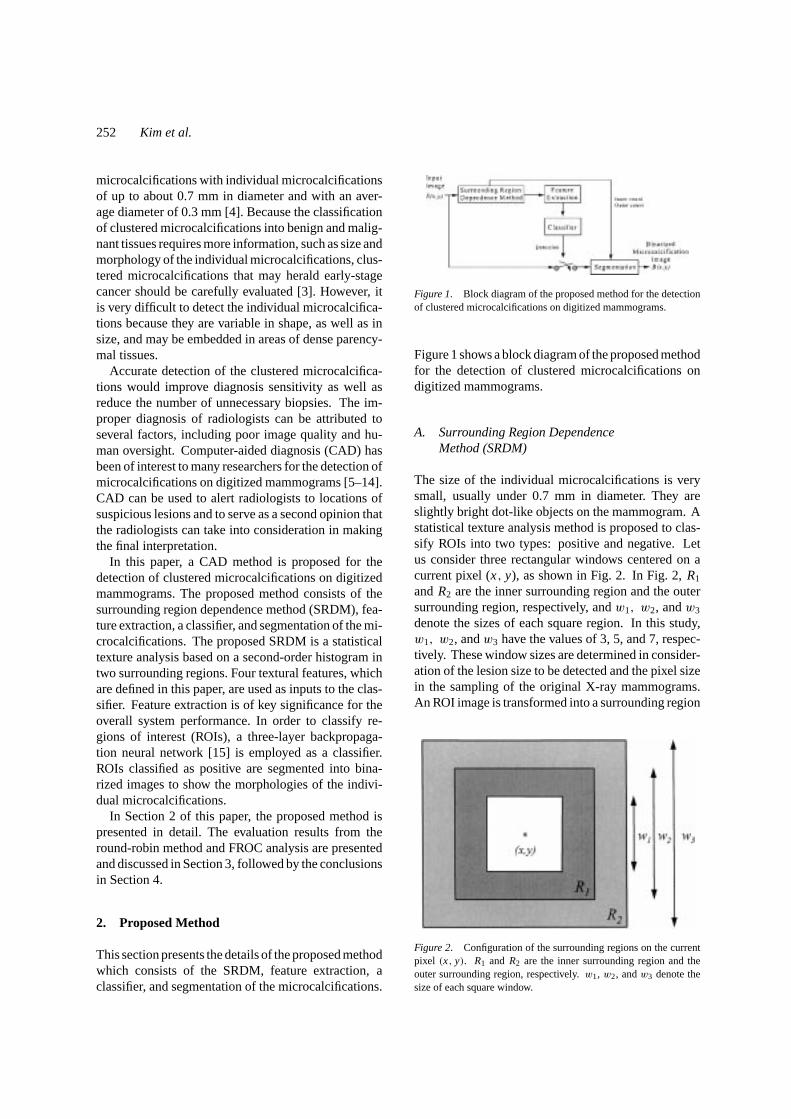
The size of the individual microcalcifications is verysmall, usually under 0.7 mm in diameter. They areslightly bright dot-like objects on the mammogram. Astatistical texture analysis method is proposed to clas-sify ROIs into two types: positive and negative. Letus consider three rectangular windows centered on acurrent pixel (x, y), as shown in Fig. 2. In Fig. 2,R1
andR2 are the inner surrounding region and the outersurrounding region, respectively, andw1, w2, andw3
denote the sizes of each square region. In this study,w1, w2, andw3 have the values of 3, 5, and 7, respec-tively. These window sizes are determined in consider-ation of the lesion size to be detected and the pixel sizein the sampling of the original X-ray mammograms.An ROI image is transformed into a surrounding region
Figure 2. Configuration of the surrounding regions on the currentpixel (x, y). R1 and R2 are the inner surrounding region and theouter surrounding region, respectively.w1, w2, andw3 denote thesize of each square window.
Detection of Microcalcifications on Mammograms 253
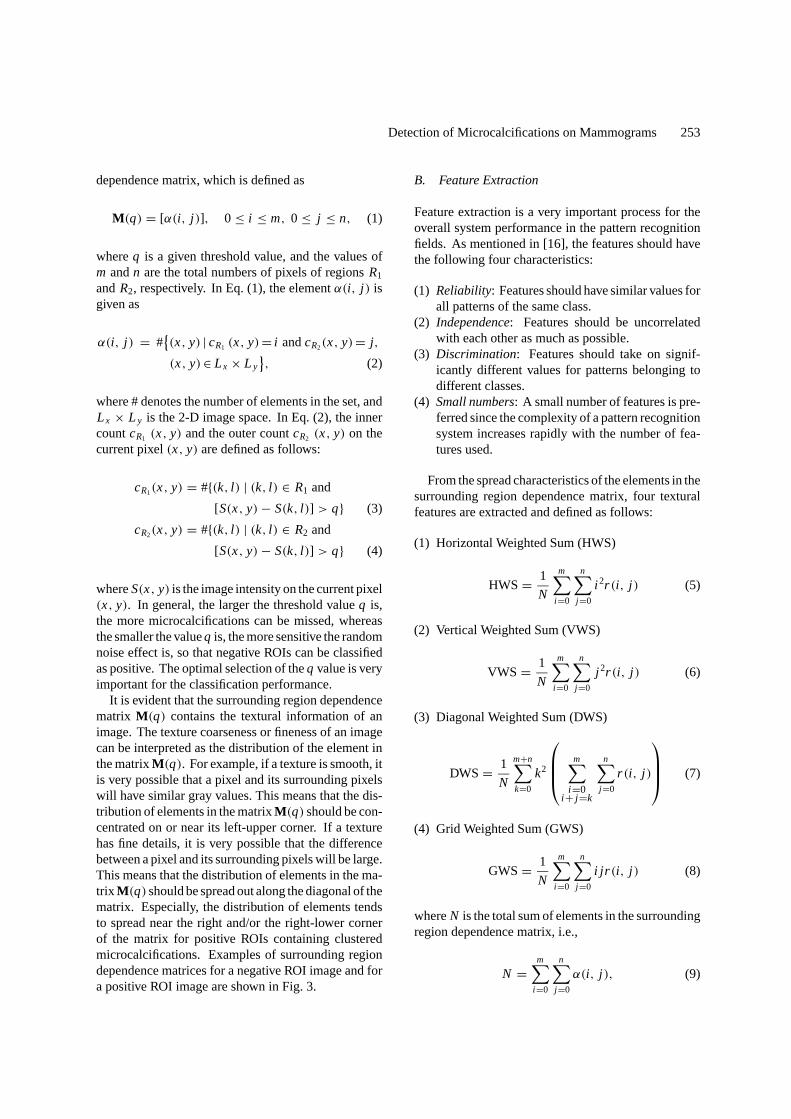
dependence matrix, which is defined as
M(q) = [α(i, j )], 0 ≤ i ≤ m, 0 ≤ j ≤ n, (1)
whereq is a given threshold value, and the values ofm andn are the total numbers of pixels of regionsR1
andR2, respectively. In Eq. (1), the elementα(i, j ) isgiven as
α(i, j ) = #{(x, y) | cR1 (x, y) = i andcR2(x, y) = j,
(x, y) ∈ Lx × L y}, (2)
where # denotes the number of elements in the set, andLx × L y is the 2-D image space. In Eq. (2), the innercountcR1 (x, y) and the outer countcR2 (x, y) on thecurrent pixel(x, y) are defined as follows:
cR1(x, y) = #{(k, l ) | (k, l ) ∈ R1 and
[S(x, y) − S(k, l )] > q} (3)
cR2(x, y) = #{(k, l ) | (k, l ) ∈ R2 and
[S(x, y) − S(k, l )] > q} (4)
whereS(x, y) is the image intensity on the current pixel(x, y). In general, the larger the threshold valueq is,the more microcalcifications can be missed, whereasthe smaller the valueq is, the more sensitive the randomnoise effect is, so that negative ROIs can be classifiedas positive. The optimal selection of theq value is veryimportant for the classification performance.
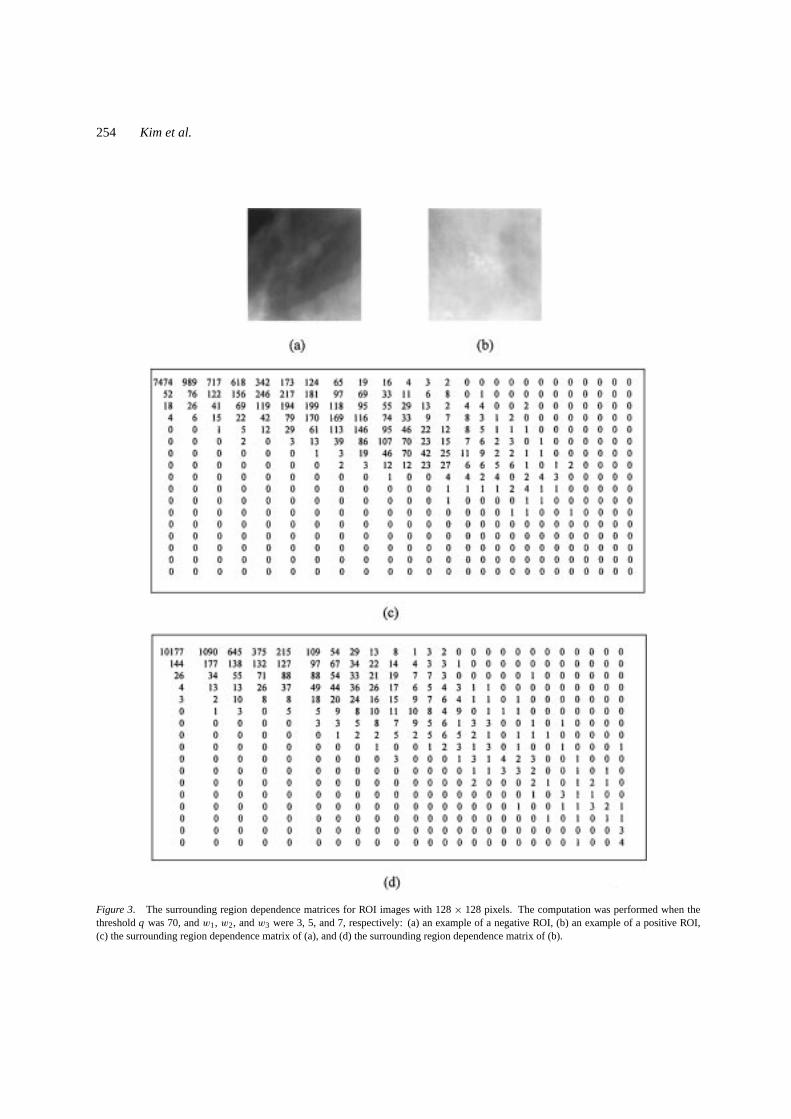
It is evident that the surrounding region dependencematrix M(q) contains the textural information of animage. The texture coarseness or fineness of an imagecan be interpreted as the distribution of the element inthe matrixM(q). For example, if a texture is smooth, itis very possible that a pixel and its surrounding pixelswill have similar gray values. This means that the dis-tribution of elements in the matrixM(q) should be con-centrated on or near its left-upper corner. If a texturehas fine details, it is very possible that the differencebetween a pixel and its surrounding pixels will be large.This means that the distribution of elements in the ma-trix M(q) should be spread out along the diagonal of thematrix. Especially, the distribution of elements tendsto spread near the right and/or the right-lower cornerof the matrix for positive ROIs containing clusteredmicrocalcifications. Examples of surrounding regiondependence matrices for a negative ROI image and fora positive ROI image are shown in Fig. 3.
B. Feature Extraction
Feature extraction is a very important process for theoverall system performance in the pattern recognitionfields. As mentioned in [16], the features should havethe following four characteristics:
(1) Reliability: Features should have similar values forall patterns of the same class.
(2) Independence: Features should be uncorrelatedwith each other as much as possible.
(3) Discrimination: Features should take on signif-icantly different values for patterns belonging todifferent classes.
(4) Small numbers: A small number of features is pre-ferred since the complexity of a pattern recognitionsystem increases rapidly with the number of fea-tures used.
From the spread characteristics of the elements in thesurrounding region dependence matrix, four texturalfeatures are extracted and defined as follows:
(1) Horizontal Weighted Sum (HWS)
HWS = 1
N
m∑i =0
n∑j =0
i 2r (i, j ) (5)
(2) Vertical Weighted Sum (VWS)
VWS = 1
N
m∑i =0
n∑j =0
j 2r (i, j ) (6)
(3) Diagonal Weighted Sum (DWS)
DWS = 1
N
m+n∑k=0
k2
m∑i =0
i + j =k
n∑j =0
r (i, j )
(7)
(4) Grid Weighted Sum (GWS)
GWS= 1
N
m∑i =0
n∑j =0
i jr (i, j ) (8)
whereN is the total sum of elements in the surroundingregion dependence matrix, i.e.,
N =m∑
i =0
n∑j =0
α(i, j ), (9)
254 Kim et al.
Figure 3. The surrounding region dependence matrices for ROI images with 128× 128 pixels. The computation was performed when thethresholdq was 70, andw1, w2, andw3 were 3, 5, and 7, respectively: (a) an example of a negative ROI, (b) an example of a positive ROI,(c) the surrounding region dependence matrix of (a), and (d) the surrounding region dependence matrix of (b).
Detection of Microcalcifications on Mammograms 255
andr (i, j ) is the reciprocal of the element, which isdefined as
r (i, j ) =
1
α(i, j ), if α(i, j ) > 0,
0, otherwise.(10)
In order to emphasize the contribution of the matrixelements around the right and the right-lower corner,the reciprocal operation of the matrix elements and thesquare operation of the location index (i , j , or k) areapplied in Eqs. (5)–(8).
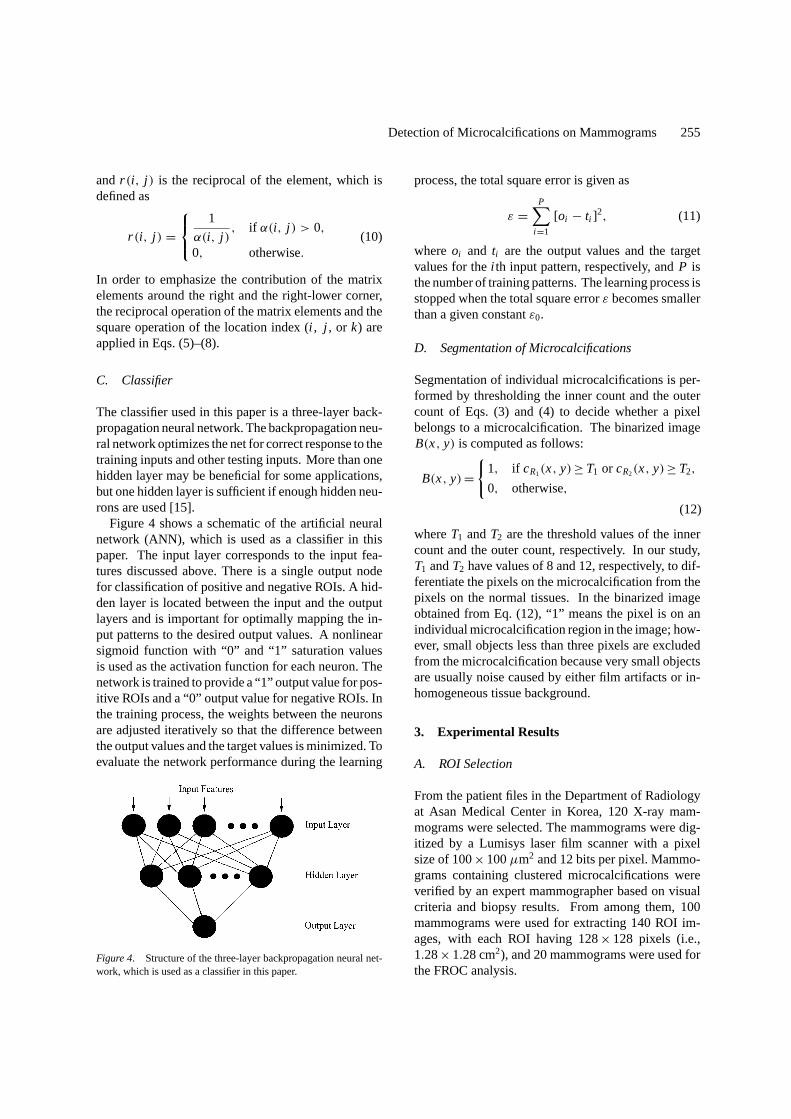
C. Classifier
The classifier used in this paper is a three-layer back-propagation neural network. The backpropagation neu-ral network optimizes the net for correct response to thetraining inputs and other testing inputs. More than onehidden layer may be beneficial for some applications,but one hidden layer is sufficient if enough hidden neu-rons are used [15].
Figure 4 shows a schematic of the artificial neuralnetwork (ANN), which is used as a classifier in thispaper. The input layer corresponds to the input fea-tures discussed above. There is a single output nodefor classification of positive and negative ROIs. A hid-den layer is located between the input and the outputlayers and is important for optimally mapping the in-put patterns to the desired output values. A nonlinearsigmoid function with “0” and “1” saturation valuesis used as the activation function for each neuron. Thenetwork is trained to provide a “1” output value for pos-itive ROIs and a “0” output value for negative ROIs. Inthe training process, the weights between the neuronsare adjusted iteratively so that the difference betweenthe output values and the target values is minimized. Toevaluate the network performance during the learning
Figure 4. Structure of the three-layer backpropagation neural net-work, which is used as a classifier in this paper.
process, the total square error is given as
ε =P∑
i =1
[oi − ti ]2, (11)
whereoi and ti are the output values and the targetvalues for thei th input pattern, respectively, andP isthe number of training patterns. The learning process isstopped when the total square errorε becomes smallerthan a given constantε0.
D. Segmentation of Microcalcifications
Segmentation of individual microcalcifications is per-formed by thresholding the inner count and the outercount of Eqs. (3) and (4) to decide whether a pixelbelongs to a microcalcification. The binarized imageB(x, y) is computed as follows:
B(x, y) ={
1, if cR1(x, y) ≥ T1 or cR2(x, y) ≥ T2,
0, otherwise,
(12)
whereT1 andT2 are the threshold values of the innercount and the outer count, respectively. In our study,T1 andT2 have values of 8 and 12, respectively, to dif-ferentiate the pixels on the microcalcification from thepixels on the normal tissues. In the binarized imageobtained from Eq. (12), “1” means the pixel is on anindividual microcalcification region in the image; how-ever, small objects less than three pixels are excludedfrom the microcalcification because very small objectsare usually noise caused by either film artifacts or in-homogeneous tissue background.
3. Experimental Results
A. ROI Selection
From the patient files in the Department of Radiologyat Asan Medical Center in Korea, 120 X-ray mam-mograms were selected. The mammograms were dig-itized by a Lumisys laser film scanner with a pixelsize of 100× 100µm2 and 12 bits per pixel. Mammo-grams containing clustered microcalcifications wereverified by an expert mammographer based on visualcriteria and biopsy results. From among them, 100mammograms were used for extracting 140 ROI im-ages, with each ROI having 128× 128 pixels (i.e.,1.28× 1.28 cm2), and 20 mammograms were used forthe FROC analysis.
256 Kim et al.
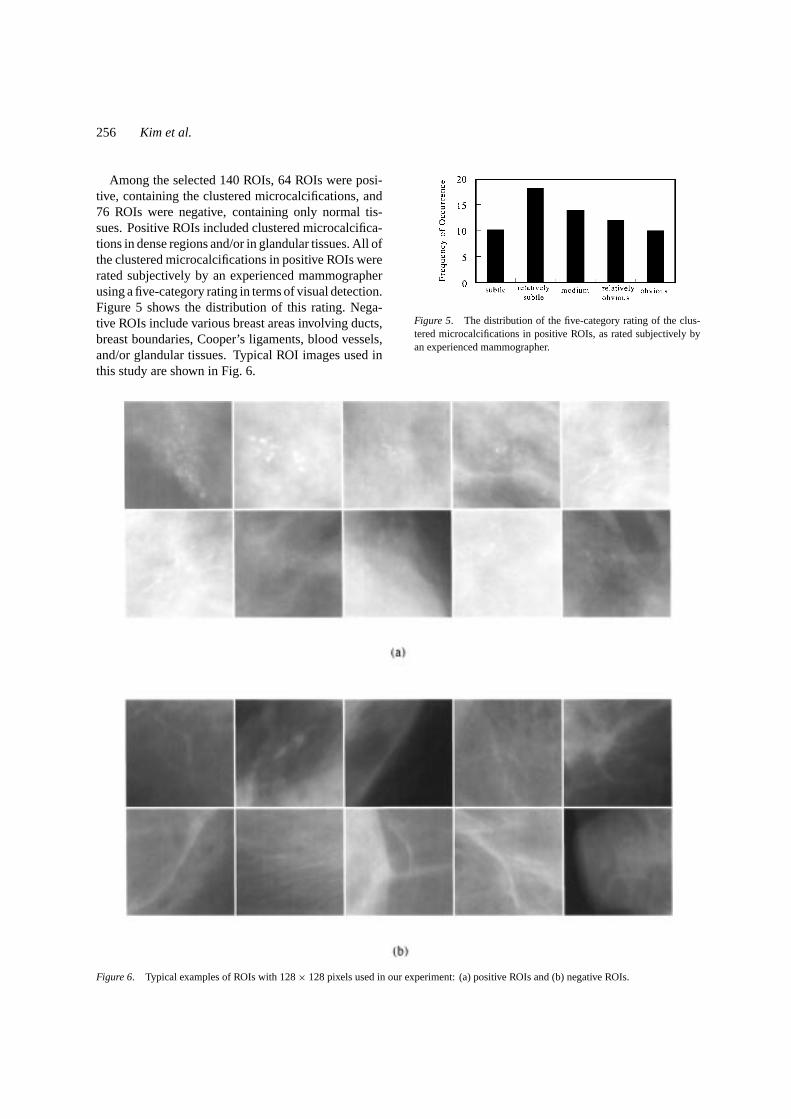
Among the selected 140 ROIs, 64 ROIs were posi-tive, containing the clustered microcalcifications, and76 ROIs were negative, containing only normal tis-sues. Positive ROIs included clustered microcalcifica-tions in dense regions and/or in glandular tissues. All ofthe clustered microcalcifications in positive ROIs wererated subjectively by an experienced mammographerusing a five-category rating in terms of visual detection.Figure 5 shows the distribution of this rating. Nega-tive ROIs include various breast areas involving ducts,breast boundaries, Cooper’s ligaments, blood vessels,and/or glandular tissues. Typical ROI images used inthis study are shown in Fig. 6.
Figure 6. Typical examples of ROIs with 128× 128 pixels used in our experiment: (a) positive ROIs and (b) negative ROIs.
Figure 5. The distribution of the five-category rating of the clus-tered microcalcifications in positive ROIs, as rated subjectively byan experienced mammographer.
Detection of Microcalcifications on Mammograms 257
B. Selection of Optimal q
Four features with respect to variousq are extractedfrom Eqs. (5)–(8) for 140 ROI images. In order toselect the optimalq, the self-organizing map devel-oped by Kohonen [15] which groups the input datainto clusters, is applied in this paper. During the self-organization process, the cluster unit, whose weightvector matches the input vector most closely, is chosenas the winner. The winning unit updates its weight un-til the stopping condition is satisfied. After Kohonenlearning is completed, each output unit denotes an av-erage for each cluster. For this clustering, 140 ROIimages of the data set are used. The dimension of theinput vectors is four, and the number of clusters to beformed is two. The mean values of the features for eachclass are used as the initial weights of the Kohonen self-organizing map. The measure to select the optimalq isthe sum of the distances of the average vectors (SDA),which is defined as
SDA =G∑
g=1
D∑d=1
|agd − a′gd| (13)
whereagd is the mean of thedth feature within thegthclass in the truth file anda′
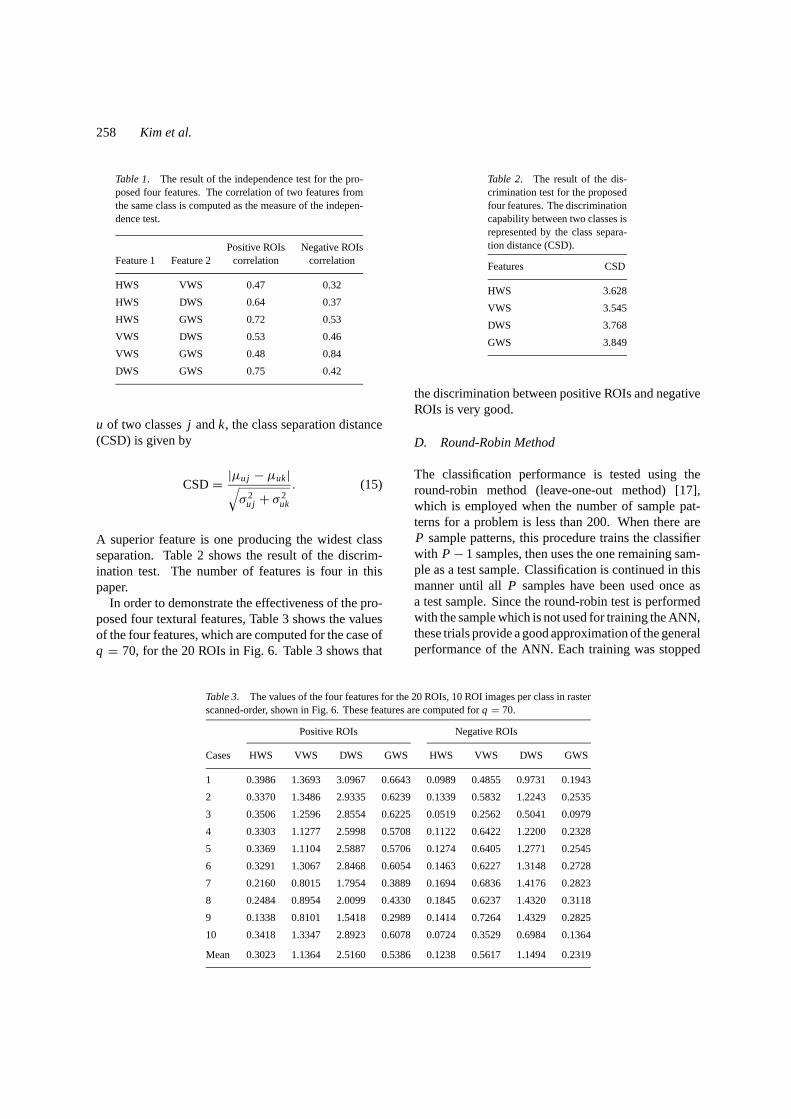
gd is the value of thedthfeature within thegth class after Kohonen learning.GandD are the number of classes and the dimension ofthe input vectors, respectively. In our study,G andDhave values of 2 and 4, respectively. Figure 7 showsthe SDA values for values ofq in the range from 50to 120 in increments of 10. As shown in Fig. 7, theoptimal performance was achieved whenq was 70.
C. Effectiveness of Four Textural Features
Good features should have the four characteristics ofreliability, independence, discrimination, and small
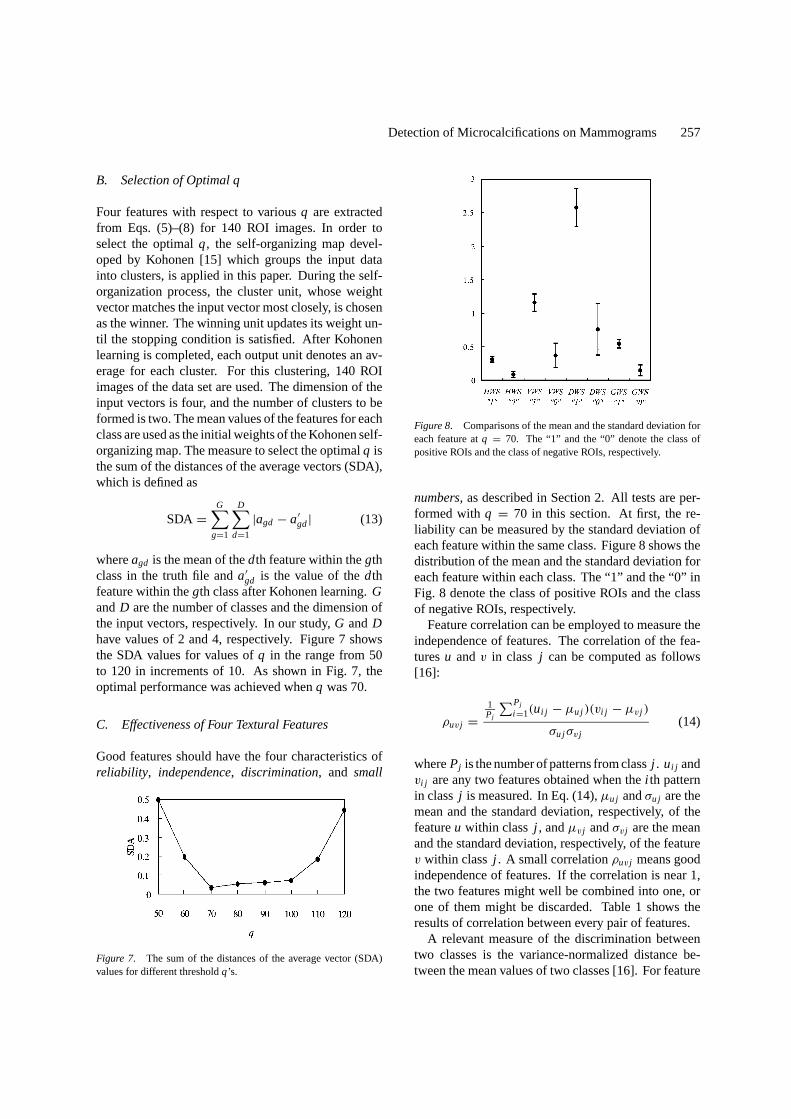
Figure 7. The sum of the distances of the average vector (SDA)values for different thresholdq’s.
Figure 8. Comparisons of the mean and the standard deviation foreach feature atq = 70. The “1” and the “0” denote the class ofpositive ROIs and the class of negative ROIs, respectively.
numbers, as described in Section 2. All tests are per-formed withq = 70 in this section. At first, the re-liability can be measured by the standard deviation ofeach feature within the same class. Figure 8 shows thedistribution of the mean and the standard deviation foreach feature within each class. The “1” and the “0” inFig. 8 denote the class of positive ROIs and the classof negative ROIs, respectively.
Feature correlation can be employed to measure theindependence of features. The correlation of the fea-turesu andv in class j can be computed as follows[16]:
ρuv j =1Pj
∑Pj
i =1(ui j − µu j )(vi j − µv j )
σu jσv j(14)
wherePj is the number of patterns from classj . ui j andvi j are any two features obtained when thei th patternin classj is measured. In Eq. (14),µu j andσu j are themean and the standard deviation, respectively, of thefeatureu within class j , andµv j andσv j are the meanand the standard deviation, respectively, of the featurev within class j . A small correlationρuv j means goodindependence of features. If the correlation is near 1,the two features might well be combined into one, orone of them might be discarded. Table 1 shows theresults of correlation between every pair of features.
A relevant measure of the discrimination betweentwo classes is the variance-normalized distance be-tween the mean values of two classes [16]. For feature
258 Kim et al.
Table 1. The result of the independence test for the pro-posed four features. The correlation of two features fromthe same class is computed as the measure of the indepen-dence test.
Positive ROIs Negative ROIsFeature 1 Feature 2 correlation correlation
HWS VWS 0.47 0.32
HWS DWS 0.64 0.37
HWS GWS 0.72 0.53
VWS DWS 0.53 0.46
VWS GWS 0.48 0.84
DWS GWS 0.75 0.42
u of two classesj andk, the class separation distance(CSD) is given by
CSD= |µu j − µuk|√σ 2
u j + σ 2uk
. (15)
A superior feature is one producing the widest classseparation. Table 2 shows the result of the discrim-ination test. The number of features is four in thispaper.
In order to demonstrate the effectiveness of the pro-posed four textural features, Table 3 shows the valuesof the four features, which are computed for the case ofq = 70, for the 20 ROIs in Fig. 6. Table 3 shows that
Table 3. The values of the four features for the 20 ROIs, 10 ROI images per class in rasterscanned-order, shown in Fig. 6. These features are computed forq = 70.
Positive ROIs Negative ROIs
Cases HWS VWS DWS GWS HWS VWS DWS GWS
1 0.3986 1.3693 3.0967 0.6643 0.0989 0.4855 0.9731 0.1943
2 0.3370 1.3486 2.9335 0.6239 0.1339 0.5832 1.2243 0.2535
3 0.3506 1.2596 2.8554 0.6225 0.0519 0.2562 0.5041 0.0979
4 0.3303 1.1277 2.5998 0.5708 0.1122 0.6422 1.2200 0.2328
5 0.3369 1.1104 2.5887 0.5706 0.1274 0.6405 1.2771 0.2545
6 0.3291 1.3067 2.8468 0.6054 0.1463 0.6227 1.3148 0.2728
7 0.2160 0.8015 1.7954 0.3889 0.1694 0.6836 1.4176 0.2823
8 0.2484 0.8954 2.0099 0.4330 0.1845 0.6237 1.4320 0.3118
9 0.1338 0.8101 1.5418 0.2989 0.1414 0.7264 1.4329 0.2825
10 0.3418 1.3347 2.8923 0.6078 0.0724 0.3529 0.6984 0.1364
Mean 0.3023 1.1364 2.5160 0.5386 0.1238 0.5617 1.1494 0.2319
Table 2. The result of the dis-crimination test for the proposedfour features. The discriminationcapability between two classes isrepresented by the class separa-tion distance (CSD).
Features CSD
HWS 3.628
VWS 3.545
DWS 3.768
GWS 3.849
the discrimination between positive ROIs and negativeROIs is very good.
D. Round-Robin Method
The classification performance is tested using theround-robin method (leave-one-out method) [17],which is employed when the number of sample pat-terns for a problem is less than 200. When there areP sample patterns, this procedure trains the classifierwith P − 1 samples, then uses the one remaining sam-ple as a test sample. Classification is continued in thismanner until allP samples have been used once asa test sample. Since the round-robin test is performedwith the sample which is not used for training the ANN,these trials provide a good approximation of the generalperformance of the ANN. Each training was stopped
Detection of Microcalcifications on Mammograms 259
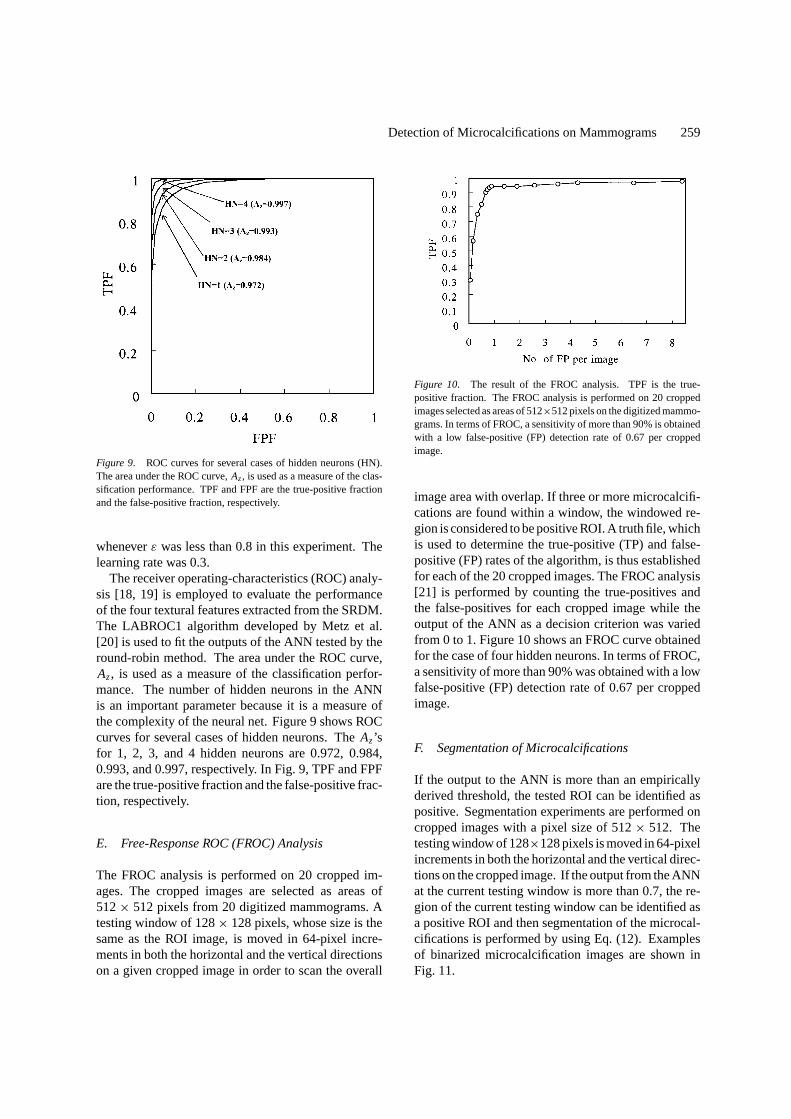
Figure 9. ROC curves for several cases of hidden neurons (HN).The area under the ROC curve,Az, is used as a measure of the clas-sification performance. TPF and FPF are the true-positive fractionand the false-positive fraction, respectively.
wheneverε was less than 0.8 in this experiment. Thelearning rate was 0.3.
The receiver operating-characteristics (ROC) analy-sis [18, 19] is employed to evaluate the performanceof the four textural features extracted from the SRDM.The LABROC1 algorithm developed by Metz et al.[20] is used to fit the outputs of the ANN tested by theround-robin method. The area under the ROC curve,Az, is used as a measure of the classification perfor-mance. The number of hidden neurons in the ANNis an important parameter because it is a measure ofthe complexity of the neural net. Figure 9 shows ROCcurves for several cases of hidden neurons. TheAz’sfor 1, 2, 3, and 4 hidden neurons are 0.972, 0.984,0.993, and 0.997, respectively. In Fig. 9, TPF and FPFare the true-positive fraction and the false-positive frac-tion, respectively.
E. Free-Response ROC (FROC) Analysis
The FROC analysis is performed on 20 cropped im-ages. The cropped images are selected as areas of512× 512 pixels from 20 digitized mammograms. Atesting window of 128× 128 pixels, whose size is thesame as the ROI image, is moved in 64-pixel incre-ments in both the horizontal and the vertical directionson a given cropped image in order to scan the overall
Figure 10. The result of the FROC analysis. TPF is the true-positive fraction. The FROC analysis is performed on 20 croppedimages selected as areas of 512×512 pixels on the digitized mammo-grams. In terms of FROC, a sensitivity of more than 90% is obtainedwith a low false-positive (FP) detection rate of 0.67 per croppedimage.
image area with overlap. If three or more microcalcifi-cations are found within a window, the windowed re-gion is considered to be positive ROI. A truth file, whichis used to determine the true-positive (TP) and false-positive (FP) rates of the algorithm, is thus establishedfor each of the 20 cropped images. The FROC analysis[21] is performed by counting the true-positives andthe false-positives for each cropped image while theoutput of the ANN as a decision criterion was variedfrom 0 to 1. Figure 10 shows an FROC curve obtainedfor the case of four hidden neurons. In terms of FROC,a sensitivity of more than 90% was obtained with a lowfalse-positive (FP) detection rate of 0.67 per croppedimage.
F. Segmentation of Microcalcifications
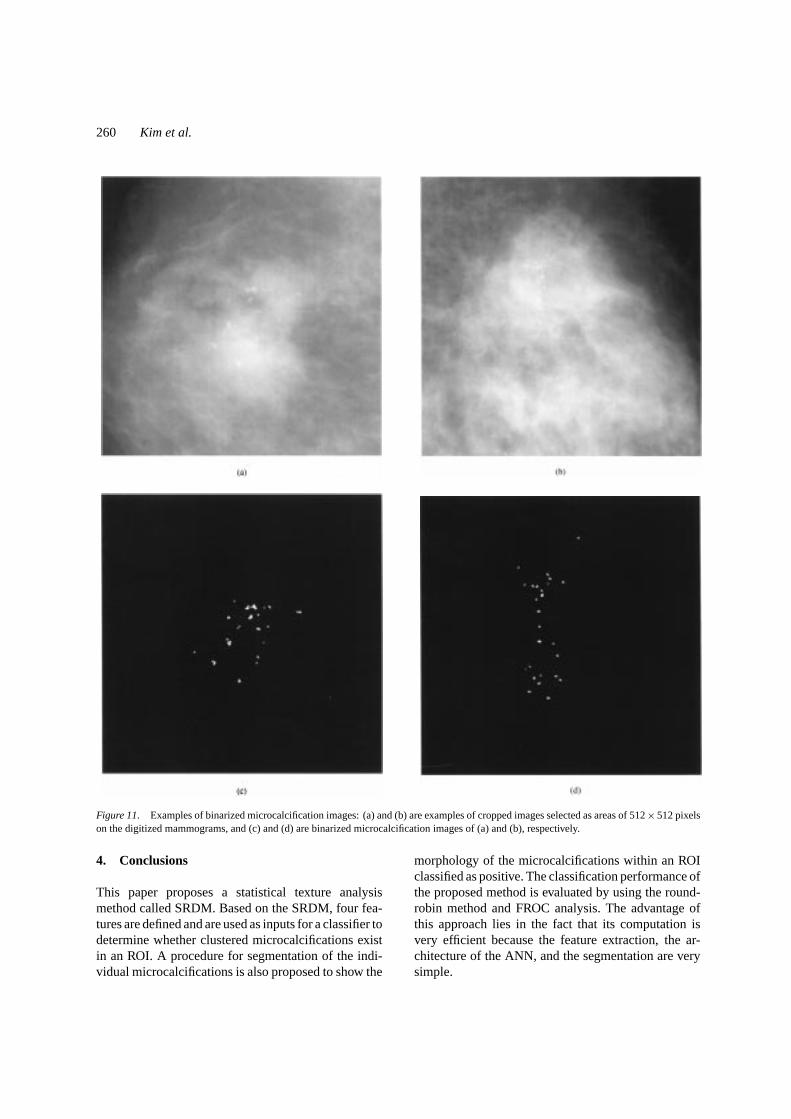
If the output to the ANN is more than an empiricallyderived threshold, the tested ROI can be identified aspositive. Segmentation experiments are performed oncropped images with a pixel size of 512× 512. Thetesting window of 128×128 pixels is moved in 64-pixelincrements in both the horizontal and the vertical direc-tions on the cropped image. If the output from the ANNat the current testing window is more than 0.7, the re-gion of the current testing window can be identified asa positive ROI and then segmentation of the microcal-cifications is performed by using Eq. (12). Examplesof binarized microcalcification images are shown inFig. 11.
260 Kim et al.
Figure 11. Examples of binarized microcalcification images: (a) and (b) are examples of cropped images selected as areas of 512× 512 pixelson the digitized mammograms, and (c) and (d) are binarized microcalcification images of (a) and (b), respectively.
4. Conclusions
This paper proposes a statistical texture analysismethod called SRDM. Based on the SRDM, four fea-tures are defined and are used as inputs for a classifier todetermine whether clustered microcalcifications existin an ROI. A procedure for segmentation of the indi-vidual microcalcifications is also proposed to show the
morphology of the microcalcifications within an ROIclassified as positive. The classification performance ofthe proposed method is evaluated by using the round-robin method and FROC analysis. The advantage ofthis approach lies in the fact that its computation isvery efficient because the feature extraction, the ar-chitecture of the ANN, and the segmentation are verysimple.
Detection of Microcalcifications on Mammograms 261
In spite of the limited number of cases tested, theexperimental results are very promising. Further in-vestigation of the effectiveness of the SRDM will beconducted with a large database in order to evaluatethe proposed diagnosis technique for real clinical usein detecting clustered microcalcifications on mammo-grams.
References
1. R.G. Bird, R.G. Wallace, and B.C. Yankaskas, “Analysis of can-cers missed at screening mammography,”Radiology, Vol. 184,pp. 613–617, 1992.
2. P.C. Johns and M.J. Yaffe, “X-ray characterization of normaland neoplastic breast tissues,”Phys. in Med. and Biol., Vol. 32,No. 6, pp. 675–695, 1987.
3. D.B. Kopans, Breast Imaging, J.B. Lippincoff Company,Philadelphia, 1989.
4. M. Lanyi, Diagnosis and Differential Diagnosis of Breast Cal-cifications, Springer-Verlag, Berlin, 1988.
5. J. Dengler, S. Behrens, and J.F. Desaga, “Segmentation of mi-crocalcifications in mammograms,”IEEE Trans. Med. Imag.,Vol. 12, No. 4, pp. 634–642, 1993.
6. R.N. Strickland and H.I. Hahn, “Wavelet transform for detect-ing microcalcifications in mammograms,”IEEE Trans. Imag.,Vol. 15, No. 2, pp. 218–229, 1996.
7. L. Shen, R.M. Rangayyan, and J.E.L. Desautels, “Applicationof shape analysis to mammographic calcifications,”IEEE Trans.Med. Imag., Vol. 13, No. 2, pp. 263–274, 1994.
8. H.P. Chan, K. Doi, C.J. Vyborny, R.A. Schmidt, C.E. Metz et al.,“Improvement in radiologists’ detection of clustered microcal-cifications on mammograms. The potential of computer-aideddiagnosis,” Invest. Radiol., Vol. 25, No. 10, pp. 1102–1110,1990.
9. H.P. Chan, K. Doi, S. Galhotra, C.J. Vyborny, H. MacMahon,and P.M. Jokich, “Image feature analysis and computer-aideddiagnosis in digital radiography. 1. Automated detection of mi-crocalcifications in mammography,”Med. Phys., Vol. 14, No. 4,pp. 538–548, 1987.
10. H.P. Chan, K. Doi, C. Vyborny, K.L. Lam, and R.A. Schmidt,“Computer-aided detection of microcalcifications in mammo-grams: Methodology and preliminary clinical study,”Invest.Radiol., Vol. 23, pp. 664–671, 1988.
11. Y. Wu, K. Doi, M.L. Giger, and R.M. Nishikawa, “Computerizeddetection of clustered microcalcifications in digital mammo-grams: Application of artificial neural networks,”Med. Phys.,Vol. 19, No. 3, pp. 555–560, 1992.
12. W. Zhang, K. Doi, M.L. Giger, Y. Wu, R.M. Nishikawa, andR.A. Schmidt, “Computerized detection of clustered microcal-cifications in digital mammograms using a shift-invariant artifi-cial neural network,”Med. Phys., Vol. 21, No. 4, pp. 517–524,1994.
13. B.W. Fam, S.L. Olson, P.F. Winter, and F.J. Scholz, “Algorithmfor the detection of fine clustered calcifications on film mammo-grams,”Radiology, Vol. 169, pp. 333–337, 1988.
14. D.H. Davies and D.R. Dance, “Automatic computer detectionof clustered calcifications in digital mammograms,”Phys. Med.Biol., Vol. 35, No. 8, pp. 1111–1118, 1990.
15. L. Fausett,Fundamentals of Neural Networks, Prentice-Hall,Englewood Cliffs, NJ, 1994.
16. K.R. Castleman,Digital Image Processing, Prentice-Hall,Englewood Cliffs, NJ, 1996.
17. M. Nadler and E.P. Smith,Pattern Recognition Engineering,Wiley, New York, NY, 1993.
18. C.E. Metz, “ROC methodology in radiologic imaging,”Inves-tigative Radiology, Vol. 21, No. 9, pp. 720–733, 1986.
19. C.E. Metz, “Some practical issues of experimental design anddata analysis in radiological ROC studies,”Investigative Radi-ology, Vol. 24, No. 3, pp. 234–245, 1989.
20. C.E. Metz, J.H. Shen, and B.A. Herman, “New methods for esti-mating a binormal ROC curve from continuously-distributed testresults,” Presented at the1990 Annual Meeting of the AmericanStatistical Association, Anaheim, CA, Aug. 7, 1990.
21. P.C. Bunch, J.F. Hamilton, G.K. Sanderson, and A.H. Simmons,“A free response approach to measurement and characterizationof radiographic observer performance,”Proc. SPIE, Vol. 127,pp. 124–135, 1977.
Jong Kook Kim received the B.S. and M.S. degrees in ElectronicsEngineering from Kyungpook National University, Taegu, Korea in1983 and 1985, respectively, and the Ph.D. degree in Information andCommunication Engineering from Korea Advanced Institute of Sci-ence and Technology (KAIST), Seoul, Korea in 1997. Since 1985,he has been a research engineer at the R&D center of Samsung Elec-tronics Co., Ltd., Suwon, Korea. He is now with the Multimedia Di-vision of Samsung Electronics Co., Ltd., Suwon, Korea. His currentresearch interests are in digital image processing, pattern recognition,and computer-aided diagnosis (CAD) for medical images.
Jeong Mi Park received the M.D. degree in a College of Medicinefrom Seoul National University, Seoul, Korea. She is now with the
262 Kim et al.
Department of Diagnostic Radiology, Asan Medical Center, Seoul,Korea and is an assistant professor of University of Ulsan Collegeof Medicine, Seoul, Korea. Her research interest is in breast radio-logy.
Koun Sik Songreceived the M.D. degree in a College of Medicinefrom Seoul National University, Seoul, Korea. He is now with theDepartment of Diagnostic Radiology, Asan Medical Center, Seoul,Korea and is an associate professor of University of Ulsan Collegeof Medicine, Seoul, Korea. His research interests are in chest ra-diology, picture archiving and communication systems (PACS), andcomputer-aided diagnostic system.
Hyun Wook Park received the B.S. degree in Electrical Engineer-ing from Seoul National University, Seoul, Korea in 1981, and theM.S. and Ph.D. degrees in Electrical Engineering from Korea Ad-vanced Institute of Science and Technology (KAIST), Seoul, Koreain 1983 and 1988, respectively. He has been an associate professor ofInformation and Communication Engineering Department, KAIST,Seoul, Korea since 1993. He was a research associate at the Univer-sity of Washington from 1989 to 1992 and was a senior executiveresearcher at the Samsung Electronics, Co., Ltd., from 1992 to 1993.His current research interests include image computing system, im-age processing, medical imaging, and multimedia [email protected]