Embed Size (px)
Citation preview
Detection and Monitoring of HAB:
Remote Sensing Component & in situ efforts
Aneesh A. Lotliker, Raghavendra S. Mupparthy, Anil Kumar Vijayan and T. Srinivasa Kumar
Ocean Color Applciations Team
Advisory Services and Satellite Oceanography Group
Email: aneesh, raghu, anilkumarv, and [email protected]
Introduction
The proliferation of plankton algae (so-called “algal blooms”; up to millions of cells per
litre) is beneficial for aquaculture and wild fisheries operations as they are critical food
source for filter-feeding bivalve shellfish (oysters, mussels, scallops, clams) as well as the
larvae of commercially important crustaceans and finfish. However, in some situations
algal blooms can have a negative effect (Harmful algal blooms or HAB’s), causing severe
economic losses to aquaculture, fisheries and tourism operations and having major
environmental and human health impacts. Among the 5000 species of extant marine
phytoplankton (Sournia et al., 1991), some 300 species can at times occur in such high
numbers that they obviously discolour the surface of the sea (so-called “red tides”), while
only 40 or so species have the capacity to produce potent toxins that can find their way
through fish and shellfish to humans.
Major coastlines along the Northern Indian Ocean in recent decades have undergone a
remarkable transformation to more mesotrophic and eutrophic conditions by which there
is appearance, persistence and epidemic of blooms of micro algae causing severe
ecological impacts. Ocean Color Remote Sensing has long been the synoptic tool to
detect and monitor the blooms, however there is no bloom-specific algorithm to
discriminate between blooms of dinoflagellates and diatoms. In this regard, INCOIS has
modified and operationally adapted the Red Tide Indices (Ahn and Shanmugam, 2006) as
Bloom Index (BI) for Indian Waters. In addition to the bloom index, four critical satellite
derived parameters are being considered. They are: a) Surface Chlorophyll Concentration
(Chl), b) rolling anomaly in chlorophyll (RCA), c) sea surface temperature (SST) and d)
rolling anomaly in SST (ΔSST). These five parameters are further categorized as primary
(anomalies of Chl and SST and Bloom Index) and secondary (chlorophyll and SST).
Description of algorithms & methodology
Bloom Index: The BI is based on the RTI of Ahn and Shanmugam (2006), and the index
has the functional form as shown in Equation 1. Mathematically, the index ranges
between -1 and +1, with values closer to positive unity being an HAB. In the equation, a
is the normalized water leaving radiance (nLw) at 531 nm, b is nLw(547) and c is
nLw(488)
cb
a
cb
a
1
Anomaly: A technique based on satellite derived anomalies in Chl and SST has been
made operational at NOAA’s ECOHAB Program (Stumpf et al., 2003). The rolling
anomaly is defined as the difference of geophysical parameter measured today from the
mean of 30 days with a phase lag of 5-days. For example: A Chlorophyll anomaly image
for February 5th
, 2011 corresponds to difference between the 30-day mean data starting
from January 1 to 30th
, 2011 and February 5th
data, while anomaly image for February 6th
,
2011 corresponds to the difference between the data of the same date from the mean of
data from January 2nd
, 2011 to January 31st, 2011. The 30-day mean is considered to
accumulate enough cloud free satellite retrievals and a lag of 5-day is being given to
avoid bias in the anomaly due to short-term biological activities (blooms lasting up to 72
hours only).
Standard algorithms: The satellite derived surface Chlorophyll values were estimated
using the default ocean color algorithm (OC3M) meant for MODIS-Aqua sensor
(O’Reilly et al., 2002). While the SST are empirically retrieved using the 11 and 12
micron bands in MODIS. The detailed reports on these standard data products are
available in the NASA Technical Memorandum Series (available at:
http://oceancolor.gsfc.nasa.gov/DOCS/TechMemo/).
Proposed framework
The HAB program is being implemented in four phases, with the service under the first
two phases being information based, while the latter two being a matured advisory
service. The timelines for the phased implementation is from 2011-2015. The Table 1
illustrates the service levels further.
Table 1: Timelines and service implementation strategy
Phase I
(2011-12) Information
Service
Data source: Single sensor (MODIS-Aqua).
Phase II
(2012-13)
Data source: Multi-sensor (MODIS-Aqua / MERIS /
OCM-II / AVHRR).
Phase III
Advisory
Service
Incorporation of sea surface current & wind data
from various available sources.
Tracking bloom movement using NRT wind data.
Phase IV
Incorporation of modeling component
(Hydrodynamic, Optical and Ecological).
Decision support system.
Prediction system for fate and transport processes.
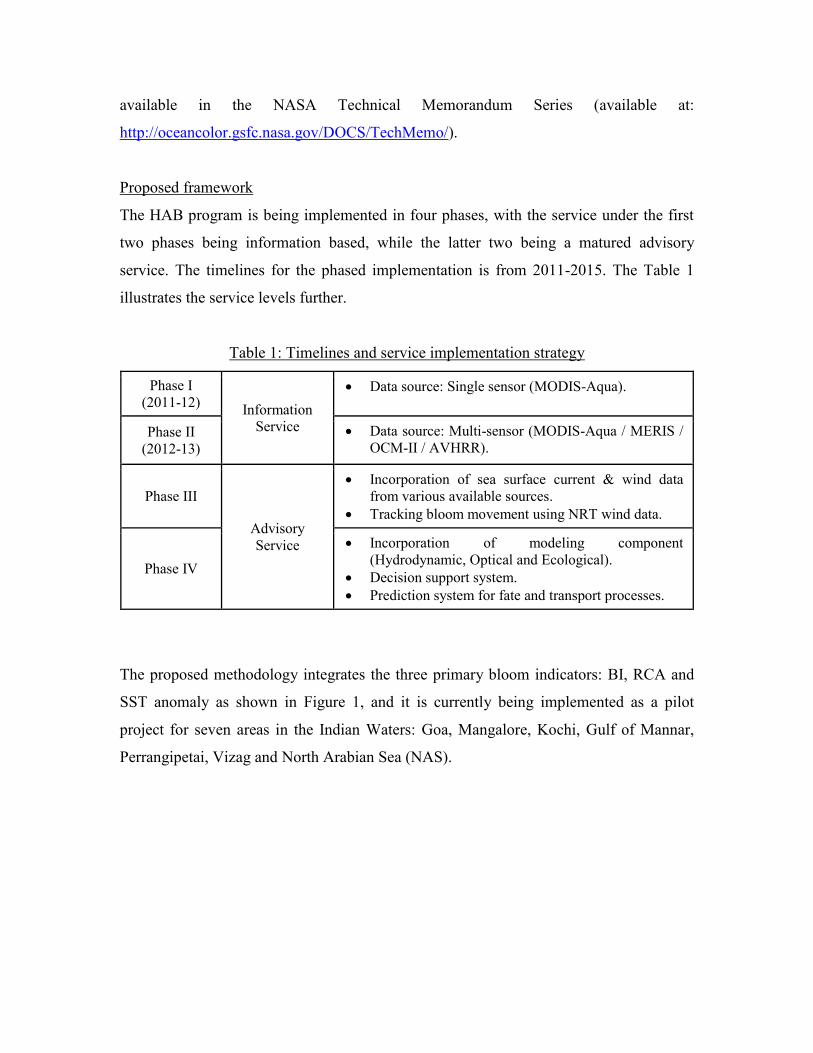
The proposed methodology integrates the three primary bloom indicators: BI, RCA and
SST anomaly as shown in Figure 1, and it is currently being implemented as a pilot
project for seven areas in the Indian Waters: Goa, Mangalore, Kochi, Gulf of Mannar,
Perrangipetai, Vizag and North Arabian Sea (NAS).
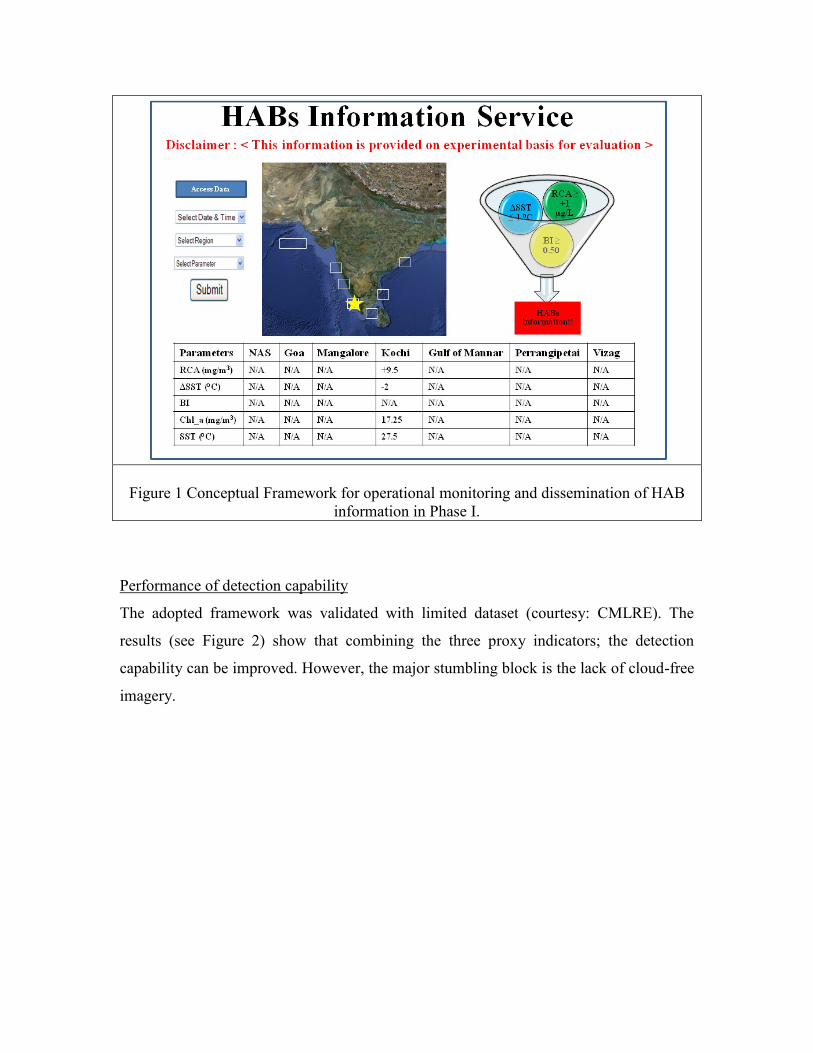
Figure 1 Conceptual Framework for operational monitoring and dissemination of HAB
information in Phase I.
Performance of detection capability
The adopted framework was validated with limited dataset (courtesy: CMLRE). The
results (see Figure 2) show that combining the three proxy indicators; the detection
capability can be improved. However, the major stumbling block is the lack of cloud-free
imagery.
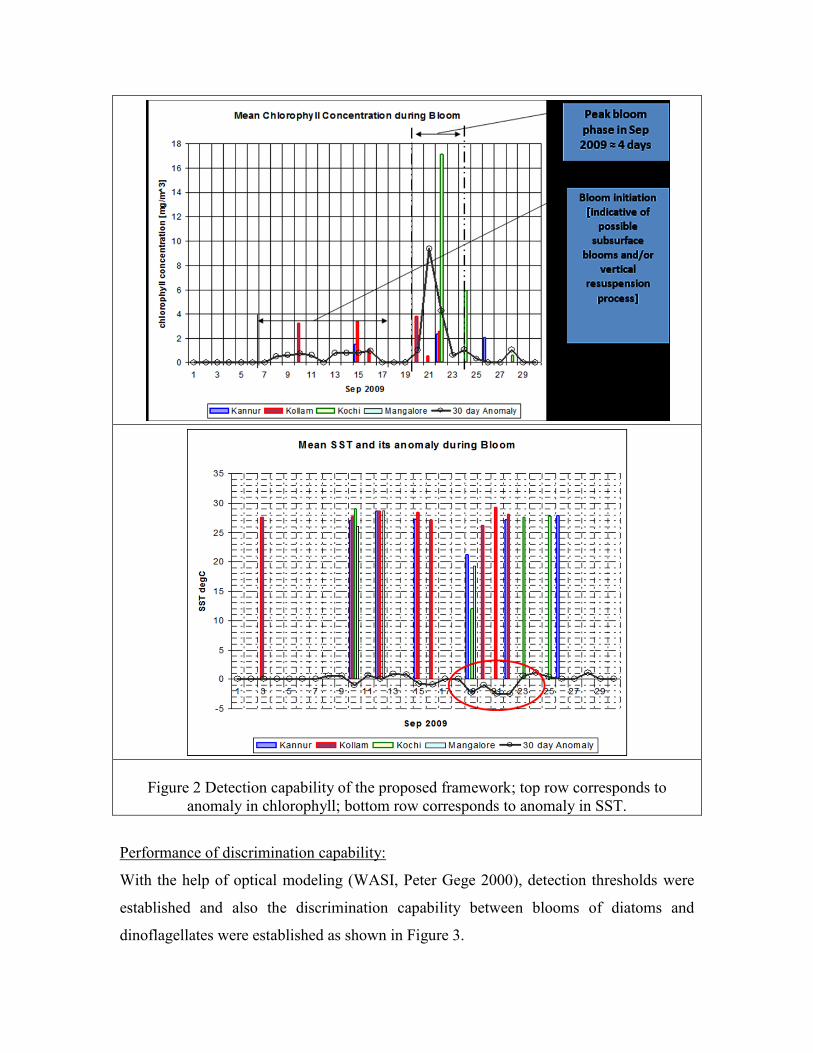
Figure 2 Detection capability of the proposed framework; top row corresponds to
anomaly in chlorophyll; bottom row corresponds to anomaly in SST.
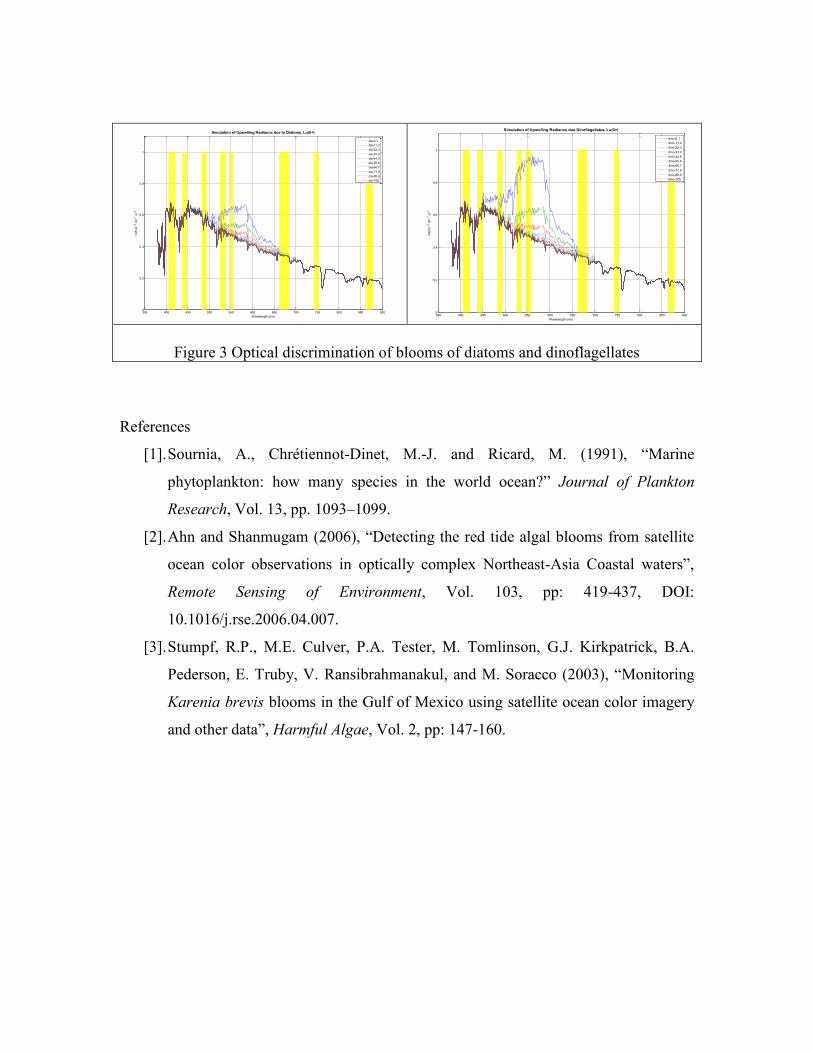
Performance of discrimination capability:
With the help of optical modeling (WASI, Peter Gege 2000), detection thresholds were
established and also the discrimination capability between blooms of diatoms and
dinoflagellates were established as shown in Figure 3.
350 400 450 500 550 600 650 700 750 800 850 9000
0.2
0.4
0.6
0.8
1
Wavelength (nm)
mW
.m-2
.nm
-1.s
r-1Simulation of Upwelling Radiance due to Diatoms, Lu(0+)
dia-0.1
dia-11.2
dia-22.3
dia-33.4
dia-44.5
dia-55.6
dia-66.7
dia-77.8
dia-88.9
dia-100
350 400 450 500 550 600 650 700 750 800 850 9000
0.2
0.4
0.6
0.8
1
Wavelength (nm)
mW
.m-2
.nm
-1.s
r-1
Simulation of Upwelling Radiance due Dinoflagellates, Lu(0+)
dino-0.1
dino-11.2
dino-22.3
dino-33.4
dino-44.5
dino-55.6
dino-66.7
dino-77.8
dino-88.9
dino-100
Figure 3 Optical discrimination of blooms of diatoms and dinoflagellates
References
[1]. Sournia, A., Chrétiennot-Dinet, M.-J. and Ricard, M. (1991), “Marine
phytoplankton: how many species in the world ocean?” Journal of Plankton
Research, Vol. 13, pp. 1093–1099.
[2]. Ahn and Shanmugam (2006), “Detecting the red tide algal blooms from satellite
ocean color observations in optically complex Northeast-Asia Coastal waters”,
Remote Sensing of Environment, Vol. 103, pp: 419-437, DOI:
10.1016/j.rse.2006.04.007.
[3]. Stumpf, R.P., M.E. Culver, P.A. Tester, M. Tomlinson, G.J. Kirkpatrick, B.A.
Pederson, E. Truby, V. Ransibrahmanakul, and M. Soracco (2003), “Monitoring
Karenia brevis blooms in the Gulf of Mexico using satellite ocean color imagery
and other data”, Harmful Algae, Vol. 2, pp: 147-160.