Embed Size (px)
Citation preview

Detecting Load Imbalance on the Cray XT
Luiz DeRose Programming Environment Director
Cray Inc. [email protected]

Slide 2
Motivation for Load Imbalance Analysis
Increasing system software and architecture complexity • Current trend in high end computing is to have systems with tens of
thousands of processors This is being accentuated with multi-core processors
Applications have to be very well balanced In order to perform at scale on these MPP systems • Efficient application scaling includes a balanced use of requested
computing resources
Desire to minimize computing resource “waste” • Identify slower paths through code • Identify inefficient “stalls” within an application

Slide 3
Cray Tools Load Imbalance Support
Very few performance tools focus on load imbalance • Need standard metrics • Need intuitive way of presentation
CrayPat support: • Imbalance time and % • MPI sync time • OpenMP Performance Metrics • MPI rank placement suggestions
Cray Apprentice2 support: • Load imbalance visualization

Slide 4
Imbalance Time
Metric based on execution time It is dependent on the type of activity:
• User functions Imbalance time = Maximum time – Average time
• Synchronization (Collective communication and barriers) Imbalance time = Average time – Minimum time
Identifies computational code regions and synchronization calls that could benefit most from load balance optimization
Estimates how much overall program time could be saved if corresponding section of code had a perfect balance • Represents upper bound on “potential savings”
• Assumes other processes are waiting, not doing useful work while slowest member finishes

Slide 5
Load balance metric - rationale
Slide 6
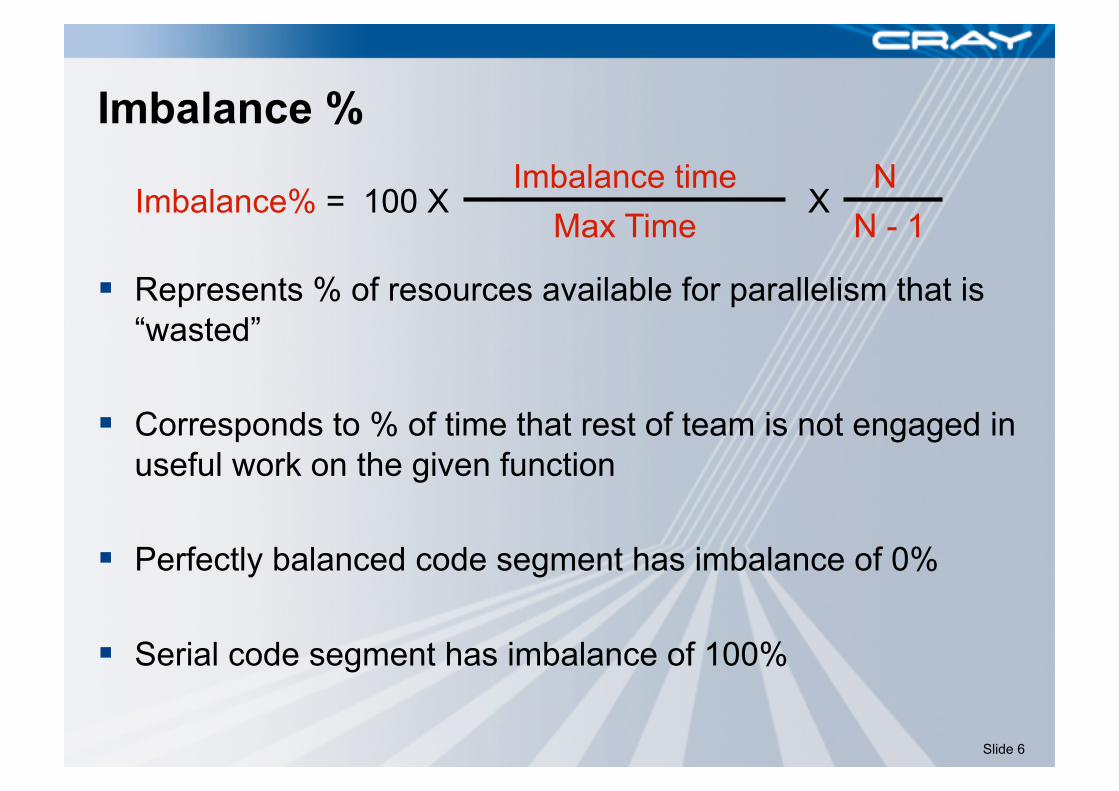
Imbalance %
Represents % of resources available for parallelism that is “wasted”
Corresponds to % of time that rest of team is not engaged in useful work on the given function
Perfectly balanced code segment has imbalance of 0%
Serial code segment has imbalance of 100%
Imbalance% = Imbalance time
Max Time X
N - 1 N
100 X
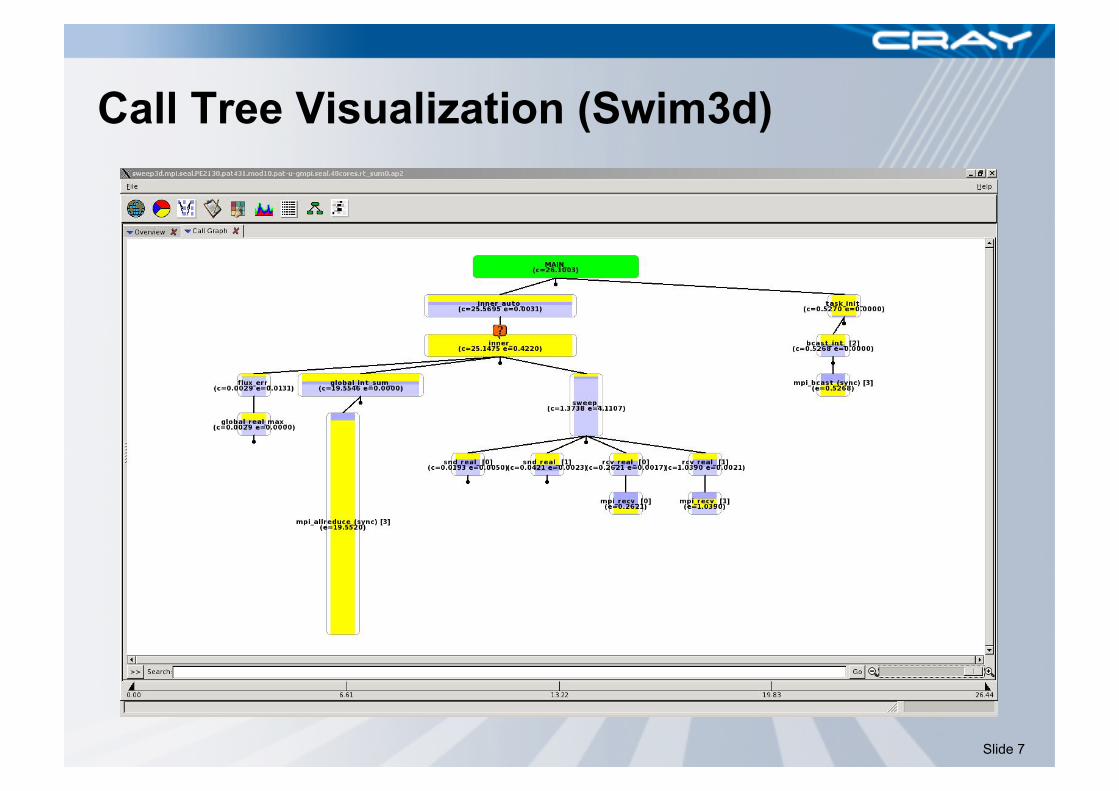
Call Tree Visualization (Swim3d)
Slide 7

Discrete Unit of Help (DUH Button)
Slide 8
Slide 9
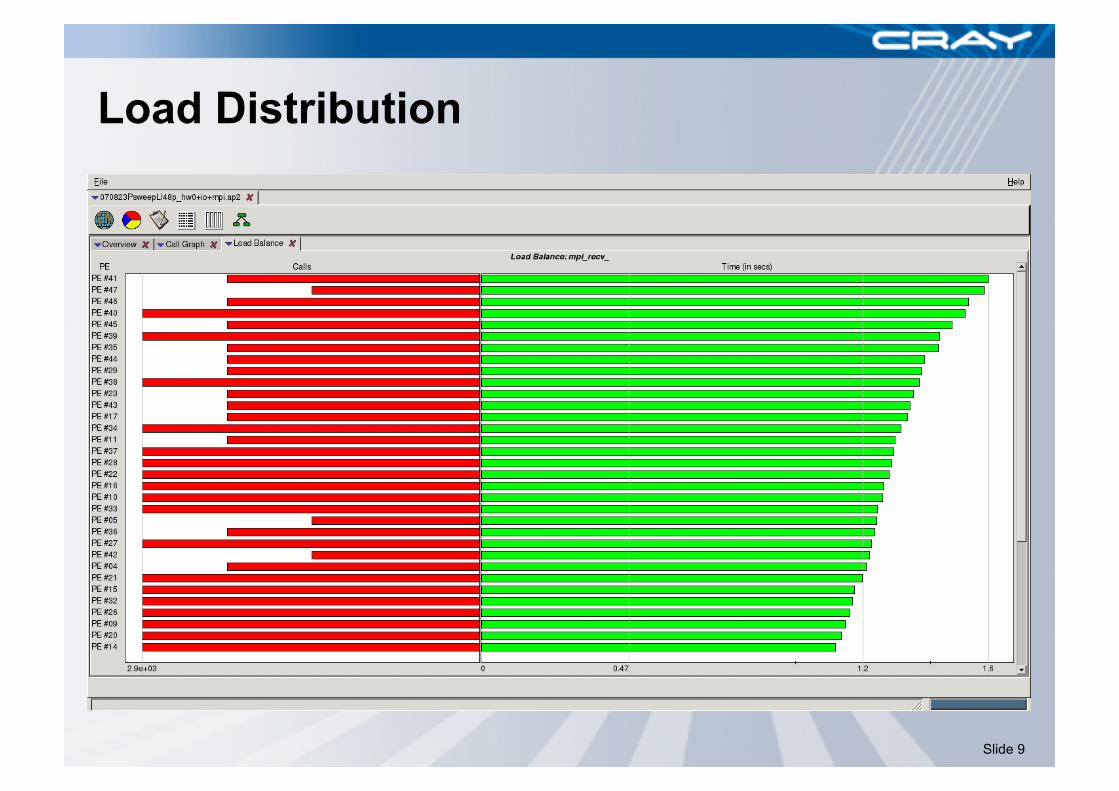
Load Distribution

November 3-6, 2008 Luiz DeRose ([email protected]) © Cray Inc. Slide 10
Profile with Load Distribution by Groups Table 1: Profile by Function Group and Function
Time % | Time |Imb. Time | Imb. | Calls |Group | | | Time % | | Function | | | | | PE='HIDE'
100.0% | 0.482144 | -- | -- | 2530 |Total |---------------------------------------------------------- | 83.7% | 0.403314 | -- | -- | 303 |USER ||--------------------------------------------------------- || 32.4% | 0.156028 | 0.009882 | 6.8% | 98 |calc3_ || 27.7% | 0.133643 | 0.007400 | 6.0% | 100 |calc2_ || 21.0% | 0.101406 | 0.002552 | 2.8% | 100 |calc1_ || 2.0% | 0.009696 | 0.000287 | 3.3% | 1 |inital_ ||========================================================= | 16.3% | 0.078830 | -- | -- | 2227 |MPI ||--------------------------------------------------------- || 12.7% | 0.061266 | 0.078133 | 64.1% | 351 |mpi_waitall_ || 2.2% | 0.010607 | 0.011582 | 59.7% | 936 |mpi_isend_ || 1.4% | 0.006945 | 0.004463 | 44.7% | 936 |mpi_irecv_ |==========================================================
November 3-6, 2008 Luiz DeRose ([email protected]) © Cray Inc. Slide 11
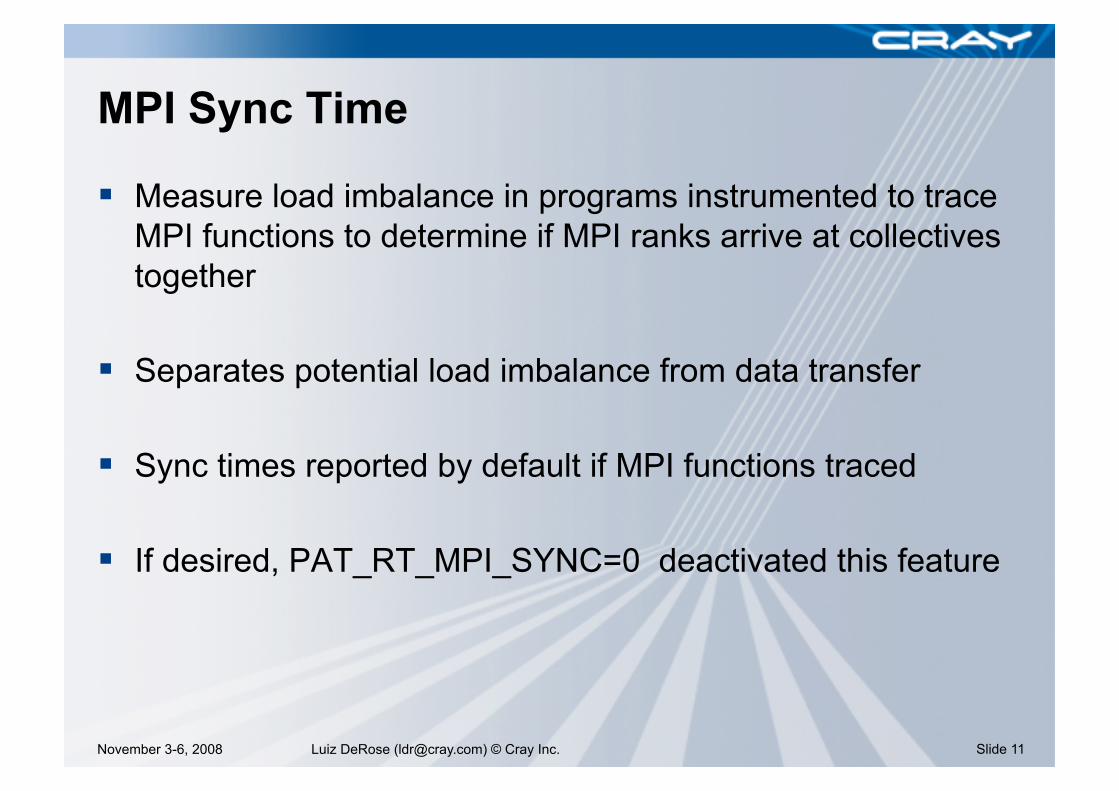
MPI Sync Time
Measure load imbalance in programs instrumented to trace MPI functions to determine if MPI ranks arrive at collectives together
Separates potential load imbalance from data transfer
Sync times reported by default if MPI functions traced
If desired, PAT_RT_MPI_SYNC=0 deactivated this feature
November 3-6, 2008 Luiz DeRose ([email protected]) © Cray Inc. Slide 12
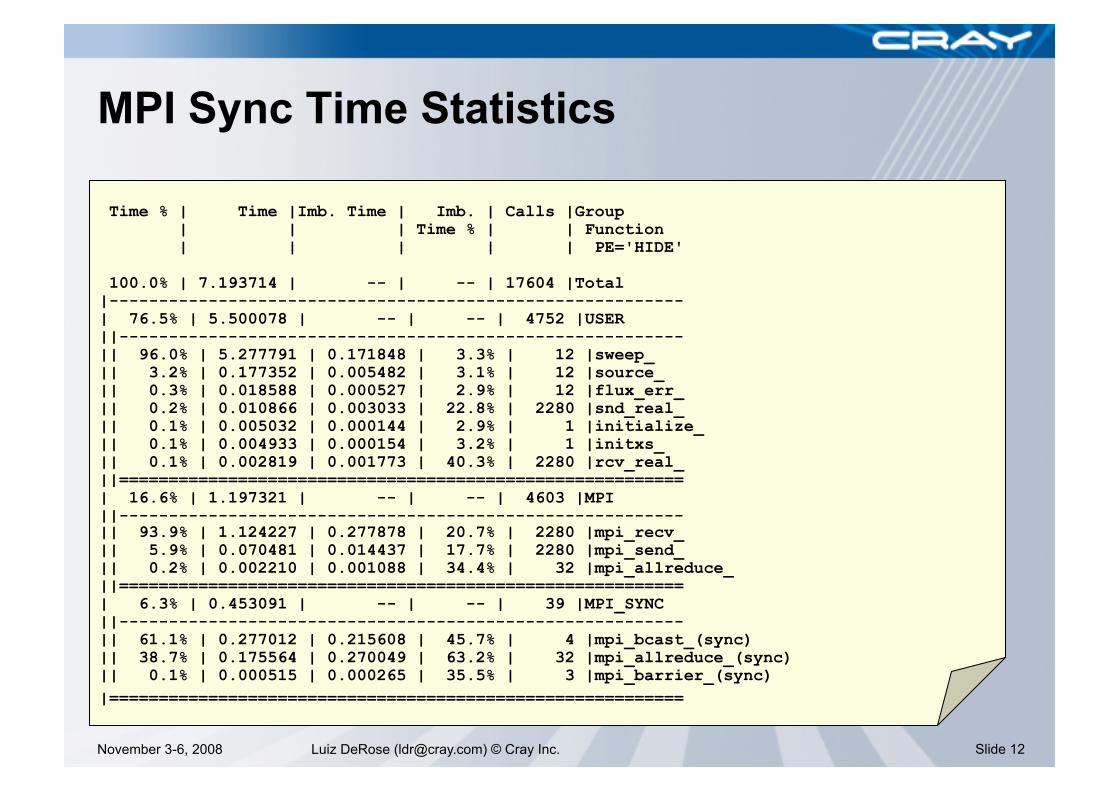
MPI Sync Time Statistics
Time % | Time |Imb. Time | Imb. | Calls |Group | | | Time % | | Function | | | | | PE='HIDE'
100.0% | 7.193714 | -- | -- | 17604 |Total |---------------------------------------------------------- | 76.5% | 5.500078 | -- | -- | 4752 |USER ||--------------------------------------------------------- || 96.0% | 5.277791 | 0.171848 | 3.3% | 12 |sweep_ || 3.2% | 0.177352 | 0.005482 | 3.1% | 12 |source_ || 0.3% | 0.018588 | 0.000527 | 2.9% | 12 |flux_err_ || 0.2% | 0.010866 | 0.003033 | 22.8% | 2280 |snd_real_ || 0.1% | 0.005032 | 0.000144 | 2.9% | 1 |initialize_ || 0.1% | 0.004933 | 0.000154 | 3.2% | 1 |initxs_ || 0.1% | 0.002819 | 0.001773 | 40.3% | 2280 |rcv_real_ ||========================================================= | 16.6% | 1.197321 | -- | -- | 4603 |MPI ||--------------------------------------------------------- || 93.9% | 1.124227 | 0.277878 | 20.7% | 2280 |mpi_recv_ || 5.9% | 0.070481 | 0.014437 | 17.7% | 2280 |mpi_send_ || 0.2% | 0.002210 | 0.001088 | 34.4% | 32 |mpi_allreduce_ ||========================================================= | 6.3% | 0.453091 | -- | -- | 39 |MPI_SYNC ||--------------------------------------------------------- || 61.1% | 0.277012 | 0.215608 | 45.7% | 4 |mpi_bcast_(sync) || 38.7% | 0.175564 | 0.270049 | 63.2% | 32 |mpi_allreduce_(sync) || 0.1% | 0.000515 | 0.000265 | 35.5% | 3 |mpi_barrier_(sync) |==========================================================