Embed Size (px)
Citation preview
Performance Analysis and Scalability Issues in Large-scaleSimulations
Peter StrazdinsComputer Systems Group,
Research School of Computer Science
30 January 2012
(slides available from http://cs.anu.edu.au/∼Peter.Strazdins/seminars)
Advcom, Jan 2012 Issues in Large-scale Simulations 1
1 Overview
• the MetUM and Chaste projects• supercomputers: the vayu cluster, the K supercomputer
• issues in large-scale, memory-intensive simulations
• techniques and tools for understanding scalability• identifying communication overhead & load imbalance, sections• tools: internal profilers, Integrated Performance Monitoring tool
• efficient performance analysis methodologies• accounting for variability of measurements; affinity effects• obtaining representative ‘sub-benchmarks’
• results on MetUM and Chaste on vayu
• techniques to improve scalability:• modelling: semi-implicit vs explicit methods• linear system solution: convergence prediction, sub-system solution
• conclusions and future work
◭◭ ◭ • ◮ ◮◮ ×
Advcom, Jan 2012 Issues in Large-scale Simulations 2
2 The Unified Model in Aust. Weather and Climate Simulations
• the Met Office Unified Model (MetUM, or just UM) is a (global) atmo-spheric model developed by the UK Met Office from early ’90s
• for weather, BoM currently uses a N144L50 atmosphere grid
• wish to scale up to a N320L70 (640×481×70) then a N512L70 (1024×769× 70) grid
• operational target: 24 hr simulation in 500s on < 1K cores (10-day‘ensemble’ forecasts)
• doubling the grid resolution increases ‘skill’ but is ≤ 8× the work!
• climate simulations currently use a N96L38 (192× 145× 38)
• ACCESS project to run many (long) runs for IPCC
• common infrastructure: atmosphere: UM (96 cores);ocean: NEMO, sea ice: CICE, coupler: OASIS (25 cores)
• next-generation medium-term models to use N216L85 then N320L70
• note: (warped) ‘cylindrical’ grids are easier to code but problematic . . .
◭◭ ◭ • ◮ ◮◮ ×
Advcom, Jan 2012 Issues in Large-scale Simulations 3
3 The MetOffice Unified Model
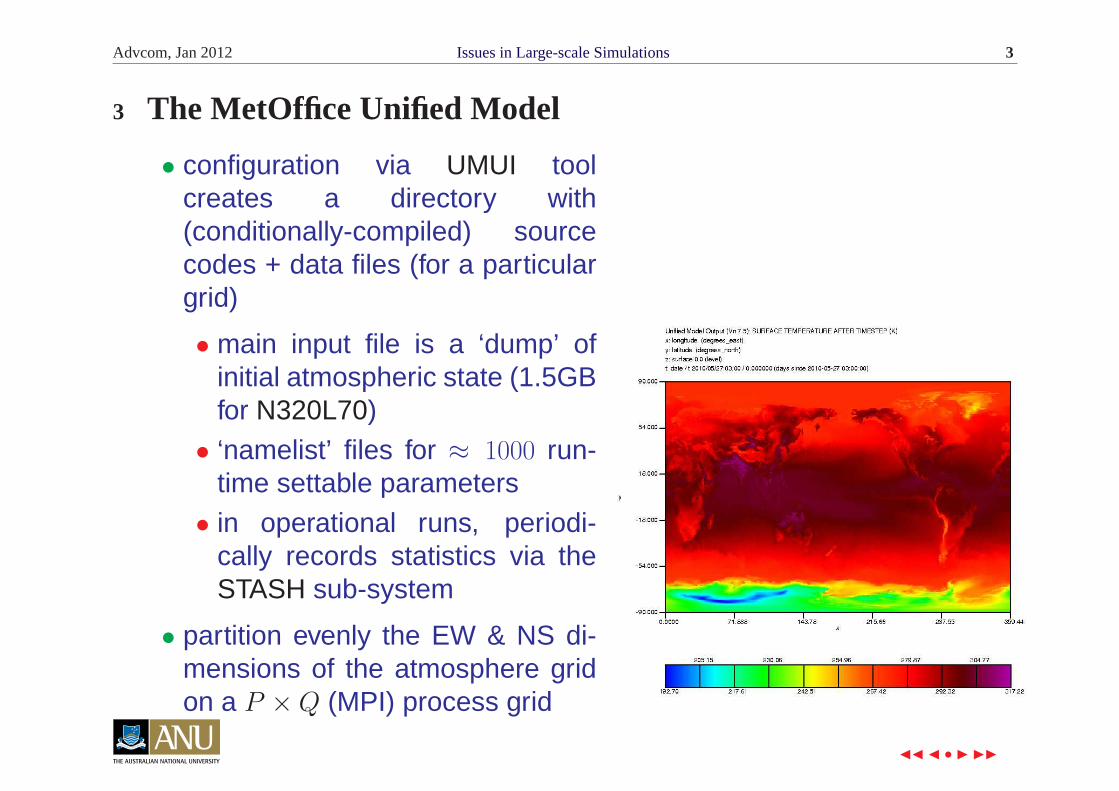
• configuration via UMUI toolcreates a directory with(conditionally-compiled) sourcecodes + data files (for a particulargrid)
• main input file is a ‘dump’ ofinitial atmospheric state (1.5GBfor N320L70)
• ‘namelist’ files for ≈ 1000 run-time settable parameters
• in operational runs, periodi-cally records statistics via theSTASH sub-system
• partition evenly the EW & NS di-mensions of the atmosphere gridon a P ×Q (MPI) process grid
◭◭ ◭ • ◮ ◮◮ ×
Advcom, Jan 2012 Issues in Large-scale Simulations 4
4 Unified Model Code Structure and Internal Profiler
• codes in Fortran-90 (mostly F77; ≈ 900 KLOC) with cpp (include com-mon blocks, commonly used parameter sub-lists, etc)
• main routine u model(), reads dump file & repeatedly calls atm step()
• dominated by Helmholtz P -T solver (GCR on a tridia. linear system)
• internal profiling module can be activated via ‘namelist’ parameters
• has ‘non-inclusive’ +‘inclusive’ timers (≈ 100 of each)• the top-level non-inclusive timer is for u model();
sum of all non-inclusive timers is time for u model()
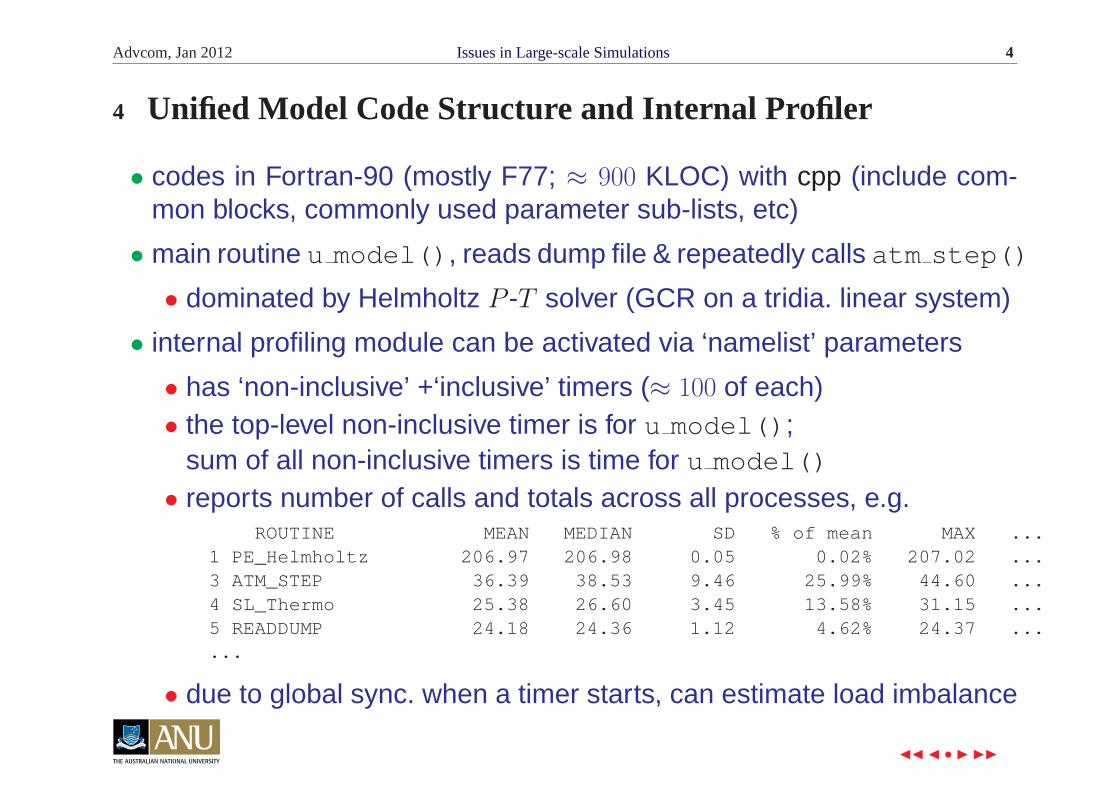
• reports number of calls and totals across all processes, e.g.ROUTINE MEAN MEDIAN SD % of mean MAX ...
1 PE_Helmholtz 206.97 206.98 0.05 0.02% 207.02 ...3 ATM_STEP 36.39 38.53 9.46 25.99% 44.60 ...4 SL_Thermo 25.38 26.60 3.45 13.58% 31.15 ...5 READDUMP 24.18 24.36 1.12 4.62% 24.37 ......
• due to global sync. when a timer starts, can estimate load imbalance
◭◭ ◭ • ◮ ◮◮ ×
Advcom, Jan 2012 Issues in Large-scale Simulations 5
5 The Chaste Cardiac Simulation Project
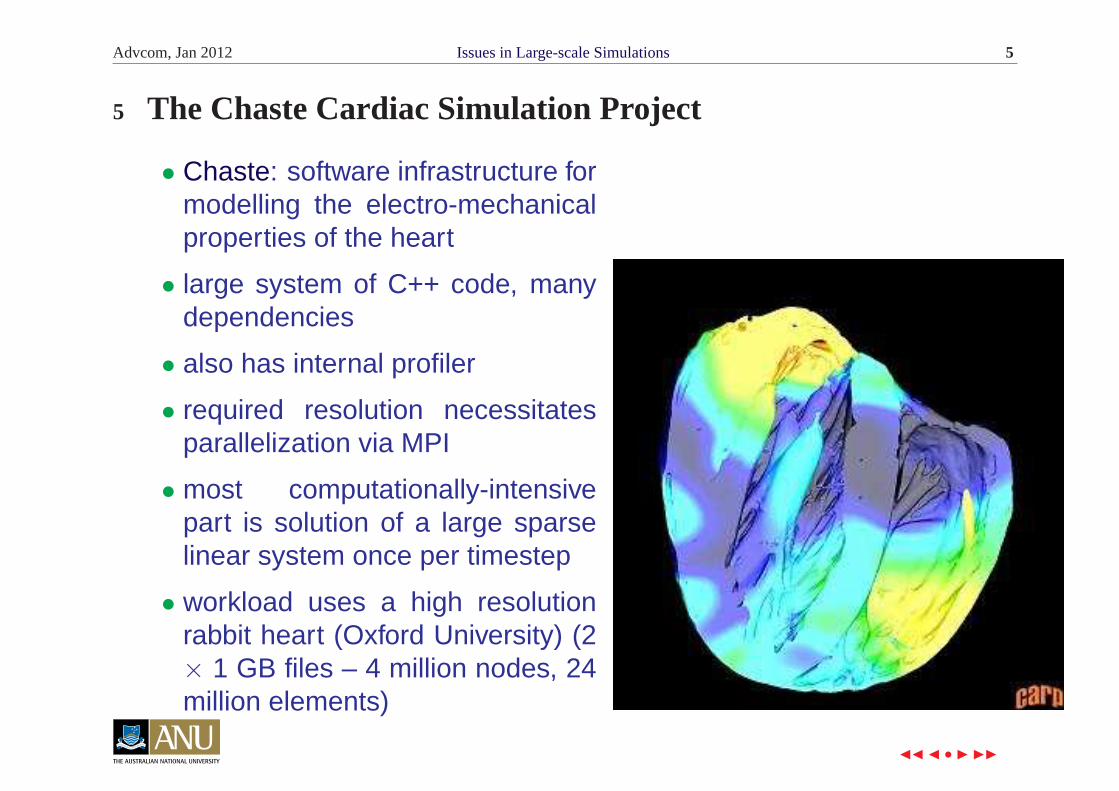
• Chaste: software infrastructure formodelling the electro-mechanicalproperties of the heart
• large system of C++ code, manydependencies
• also has internal profiler
• required resolution necessitatesparallelization via MPI
• most computationally-intensivepart is solution of a large sparselinear system once per timestep
• workload uses a high resolutionrabbit heart (Oxford University) (2× 1 GB files – 4 million nodes, 24million elements)
◭◭ ◭ • ◮ ◮◮ ×
Advcom, Jan 2012 Issues in Large-scale Simulations 6
6 Cardiac Modelling in Chaste
• bi-domain equations: continuity of electrical charges within & betweenheart cells
• chemical reaction kinetics describe ion transport at cell membranes
• after spatial discretisation by finite element method (semi-implicit),
Mududt
= Ai ui − g(u, c) Mcdcdt= f(u, c) Ai ui + Ae ue = 0
• ui and ue are the electric potentials (inside & outside cells) (u = ui − ue)
• c: chemical composition at the cell membranes
• g(): current across the membranes, f (): kinetics of the ion channels
• results in the following linear system
Mu 0 hAi
0 Mc 0Ae 0 −(Ai + Ae)
uk+1
ck+1
uk+1
i
=
Mu uk − hg(uk, ck)
Mc ck + hf (uk, ck)
0
• models the mechanical properties also (how?)
◭◭ ◭ • ◮ ◮◮ ×
Advcom, Jan 2012 Issues in Large-scale Simulations 7
7 The Vayu Cluster at the NCI National Facility
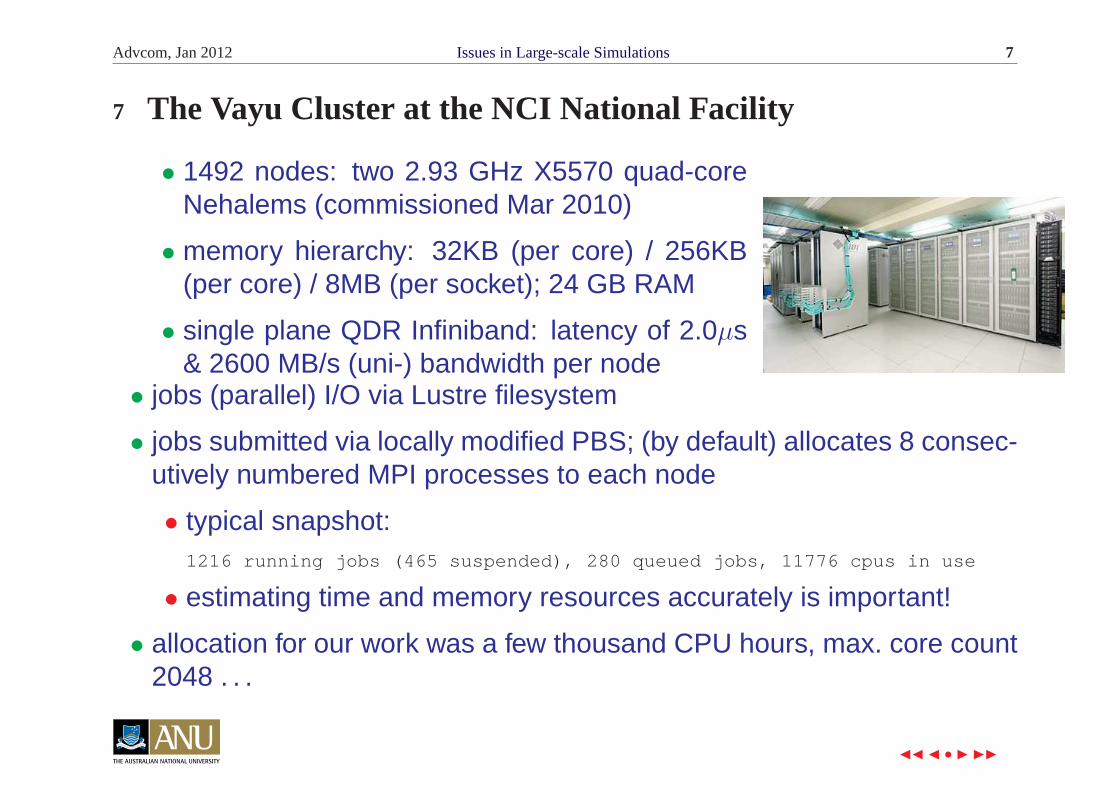
• 1492 nodes: two 2.93 GHz X5570 quad-coreNehalems (commissioned Mar 2010)
• memory hierarchy: 32KB (per core) / 256KB(per core) / 8MB (per socket); 24 GB RAM
• single plane QDR Infiniband: latency of 2.0µs& 2600 MB/s (uni-) bandwidth per node
• jobs (parallel) I/O via Lustre filesystem
• jobs submitted via locally modified PBS; (by default) allocates 8 consec-utively numbered MPI processes to each node
• typical snapshot:1216 running jobs (465 suspended), 280 queued jobs, 11776 cpus in use
• estimating time and memory resources accurately is important!
• allocation for our work was a few thousand CPU hours, max. core count2048 . . .
◭◭ ◭ • ◮ ◮◮ ×
Advcom, Jan 2012 Issues in Large-scale Simulations 8
8 Beyond Vayu: Why We Need New Algorithms
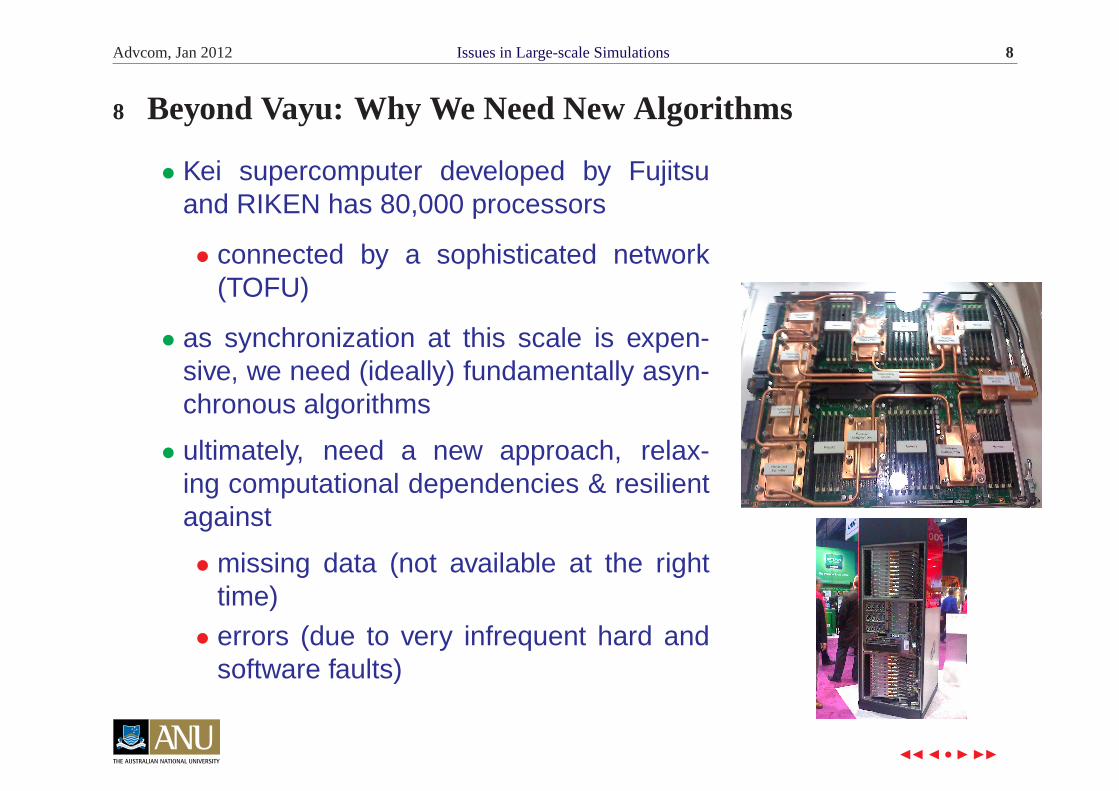
• Kei supercomputer developed by Fujitsuand RIKEN has 80,000 processors
• connected by a sophisticated network(TOFU)
• as synchronization at this scale is expen-sive, we need (ideally) fundamentally asyn-chronous algorithms
• ultimately, need a new approach, relax-ing computational dependencies & resilientagainst
• missing data (not available at the righttime)
• errors (due to very infrequent hard andsoftware faults)
◭◭ ◭ • ◮ ◮◮ ×
Advcom, Jan 2012 Issues in Large-scale Simulations 9
9 Issues in Large-scale Memory-Intensive Simulations
• simulations of scientific interest run over many timesteps
• ‘realistic’ benchmarks are resource-intensive: may be difficult on a‘premiere facility’
• variability of results problematic for accurate performance analysis
• resolution for state-of-the-art science pushes memory limits, even on a‘premiere facility’
• Chaste on 4M node mesh needs more memory than N320L70 atmo-sphere!
• running MetUM on vayu required:
• removing limit on stack size• redefining internal message buffer size (< 8 cores)• ‘pinning’ more (1 GB) physical memory for Infiniband (> 900 cores)• specifying memory limit to be physical (rather than virtual) (> 900
cores, wide process grid aspect ratios)
◭◭ ◭ • ◮ ◮◮ ×
Advcom, Jan 2012 Issues in Large-scale Simulations 10
10 Techniques for Understanding Scalability:Communication Overhead and Load Imbalance
• measure time spent in communication library (MPI) separately
• ideally, break-down per different communication operations(2 major categories: point-to-point and collective)
• and (major categories of) buffer size
• load imbalance is more tricky to measure
• differences in computation times across processes• and/or differences in times taken at barriers
• i.e. the averaged time (over each process) spent in barriers, minusthe estimated overhead of barriers (when perfectly balanced)
• ideally, should do this for other collectives as well (e.g. small all-reduce operations)
• note: problems are not solvable by a faster network!must be addressed at the application level
◭◭ ◭ • ◮ ◮◮ ×
Advcom, Jan 2012 Issues in Large-scale Simulations 11
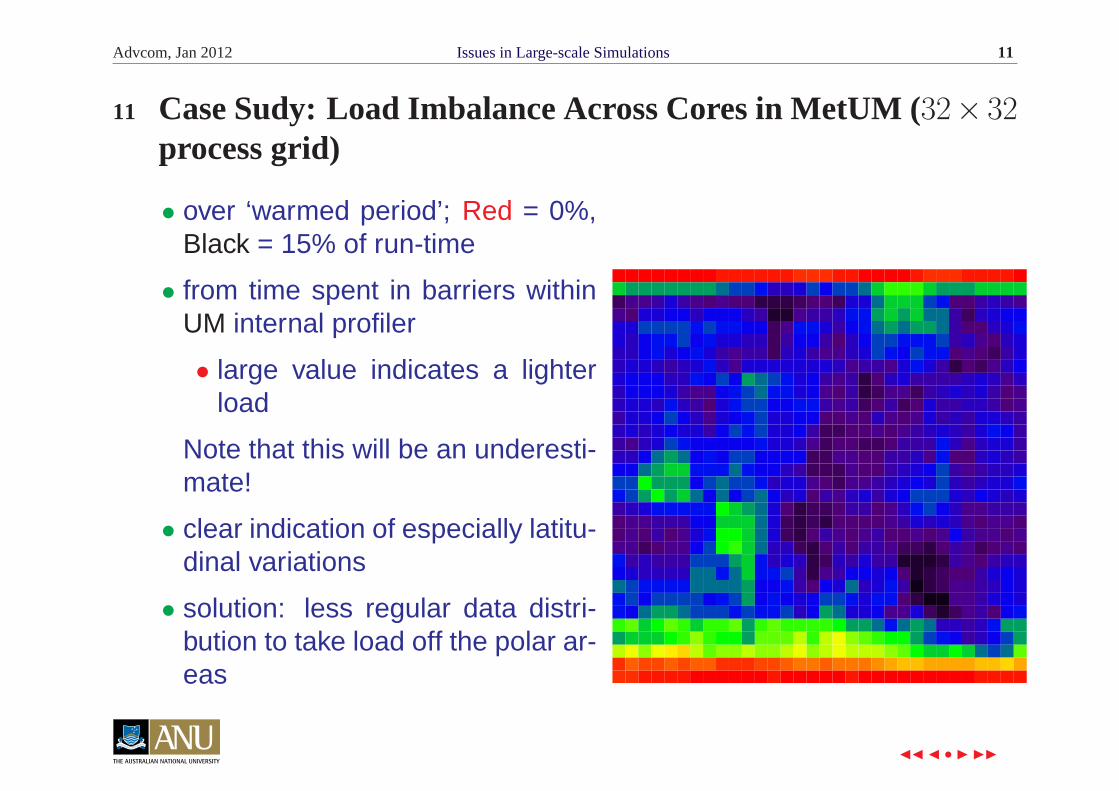
11 Case Sudy: Load Imbalance Across Cores in MetUM (32× 32process grid)
• over ‘warmed period’; Red = 0%,Black = 15% of run-time
• from time spent in barriers withinUM internal profiler
• large value indicates a lighterload
Note that this will be an underesti-mate!
• clear indication of especially latitu-dinal variations
• solution: less regular data distri-bution to take load off the polar ar-eas
◭◭ ◭ • ◮ ◮◮ ×
Advcom, Jan 2012 Issues in Large-scale Simulations 12
12 Tech. for Understanding Scalability: Section-Based Analysis
• consider latitudinal load imbalance in global atmosphere simulation
• simulation at each timestep proceeds in a number of ‘sections’polar filtering, thermal radiative transfers, convection, advection, etc
• some require more work in high latitude, others in lower
• understanding of issues can be sharpened if considered separately
• in particular, aggregate load imbalance is better estimated from weightedsum of per-section imbalances (triangle inequality)
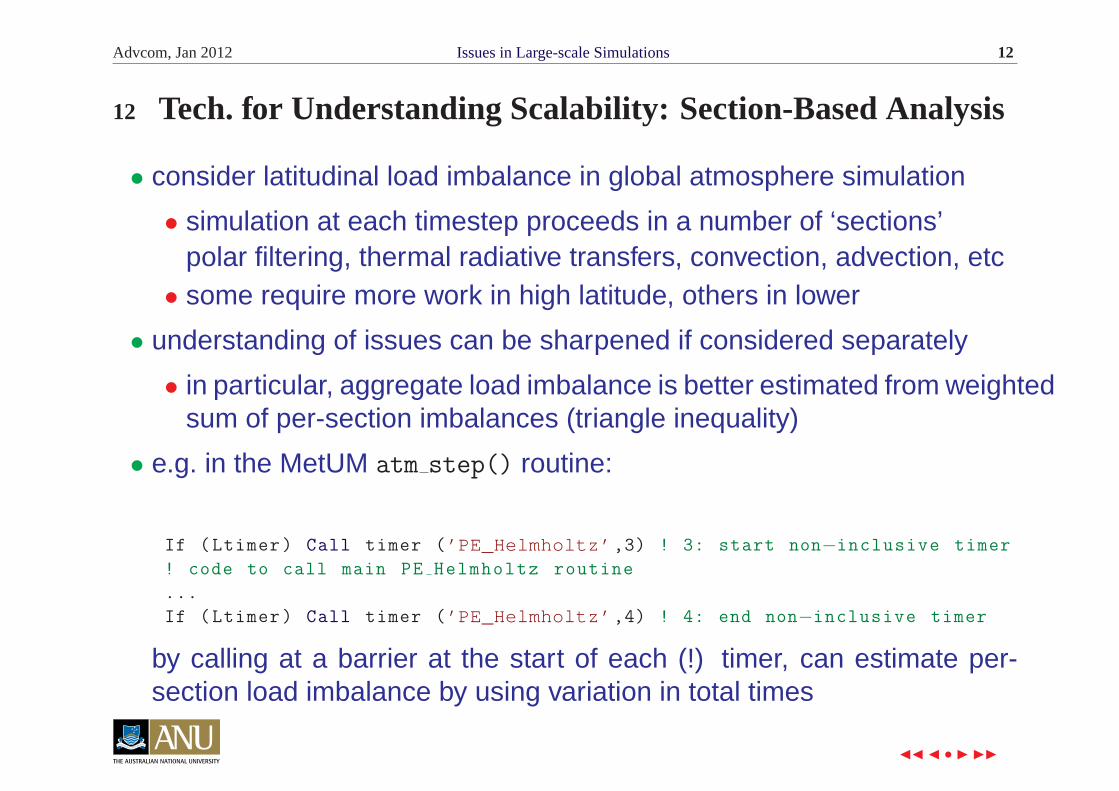
• e.g. in the MetUM atm step() routine:
If (Ltimer) Call timer (’PE_Helmholtz’,3) ! 3: start non−inclusive timer
! code to call main PE Helmholtz routine
...
If (Ltimer) Call timer (’PE_Helmholtz’,4) ! 4: end non−inclusive timer
by calling at a barrier at the start of each (!) timer, can estimate per-section load imbalance by using variation in total times
◭◭ ◭ • ◮ ◮◮ ×
Advcom, Jan 2012 Issues in Large-scale Simulations 13
13 Tools for Understanding Scalability
• desirable properties of any tool collecting scalability-related data
• have minimum impact on computation time and memory footprint• communication vs. computation time breakup, load imbalance
• provide further information indicating likely causes (i.e. hardwareevent counts: e.g. cache misses)
• breakdown of these over component parts of the computation ,
• range from internal profilers to the heavy-weight SunStudio collect
• the works! Pertinent sections derived automatically from the subrou-tine call-graph – combined with MPI & hardware event count profiling
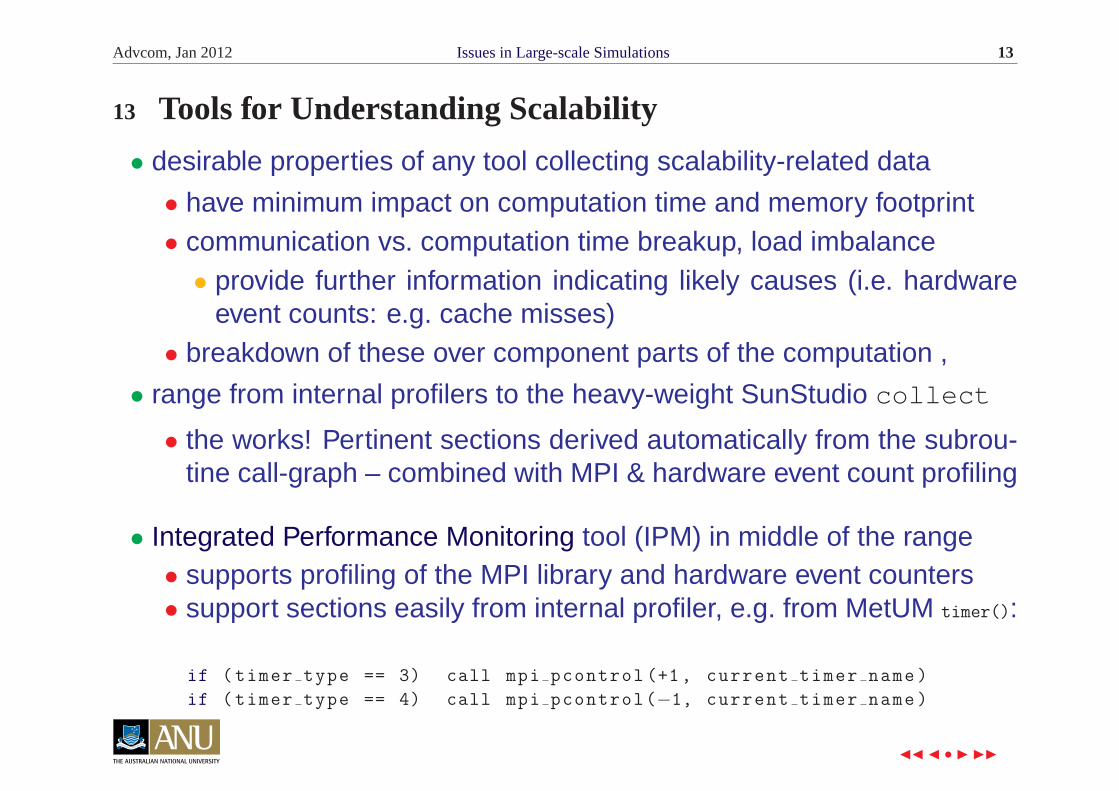
• Integrated Performance Monitoring tool (IPM) in middle of the range• supports profiling of the MPI library and hardware event counters• support sections easily from internal profiler, e.g. from MetUM timer():
if ( timer type == 3) call mpi pcontrol (+1, current timer name )
if ( timer type == 4) call mpi pcontrol(−1, current timer name )
◭◭ ◭ • ◮ ◮◮ ×
Advcom, Jan 2012 Issues in Large-scale Simulations 14
14 Methodologies: Minimizing Measurement Variability
• to analyze large-scale and long-running simulations over 1000’s of cores,potentially need vast computing resources!
• compounded with fact that repeated experiments on a facility may givesignificant variability: many need to run many times!
• on a cluster such as vayu:
• each node has 2 quad-core sockets; 8 processes given to each node
the following effects were found to be important:
• process affinity: once a node is assigned to a core, ensure that itstays there
• NUMA affinity: memory used by a process must only be allocated onthe socket of the core that it is bound to
• input/output requires (on vayu) access to the shared Lustre file system
• exposes experiments to other users’ using the file system• remains an open problem!
◭◭ ◭ • ◮ ◮◮ ×
Advcom, Jan 2012 Issues in Large-scale Simulations 15
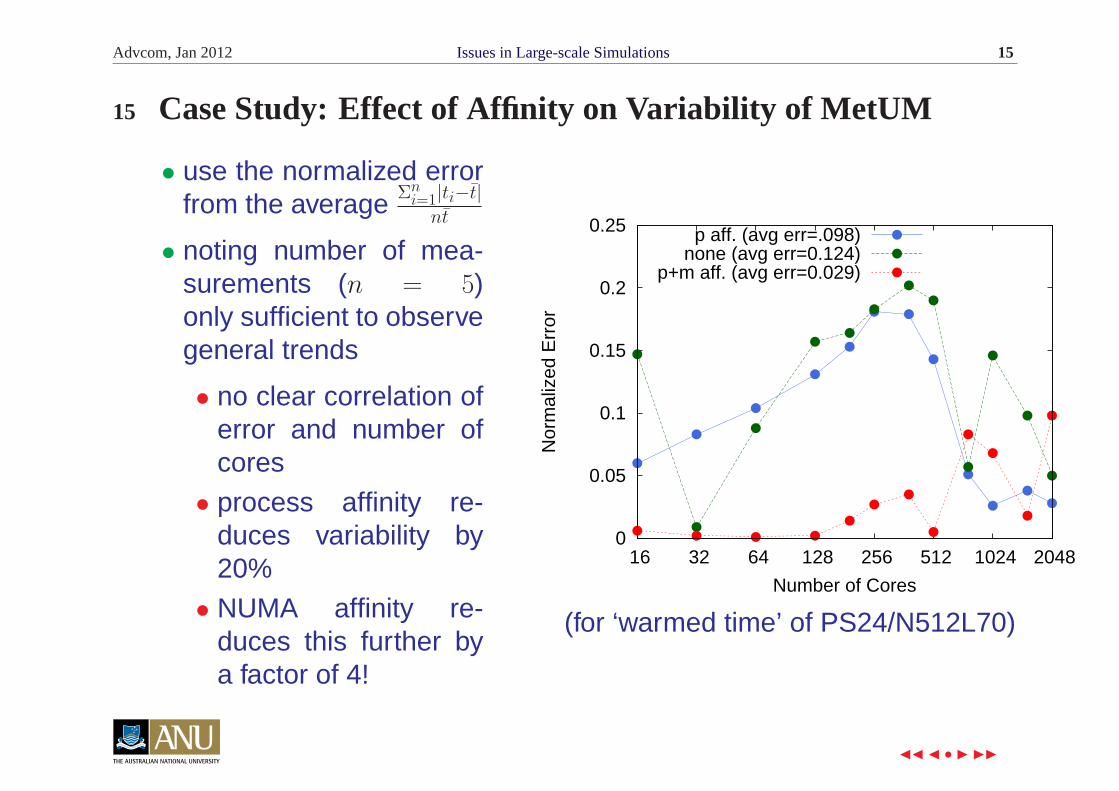
15 Case Study: Effect of Affinity on Variability of MetUM
• use the normalized errorfrom the average Σn
i=1|ti−t̄|
nt̄
• noting number of mea-surements (n = 5)only sufficient to observegeneral trends
• no clear correlation oferror and number ofcores
• process affinity re-duces variability by20%
• NUMA affinity re-duces this further bya factor of 4!
0
0.05
0.1
0.15
0.2
0.25
16 32 64 128 256 512 1024 2048N
orm
aliz
ed E
rror
Number of Cores
p aff. (avg err=.098)none (avg err=0.124)
p+m aff. (avg err=0.029)
(for ‘warmed time’ of PS24/N512L70)
◭◭ ◭ • ◮ ◮◮ ×
Advcom, Jan 2012 Issues in Large-scale Simulations 16
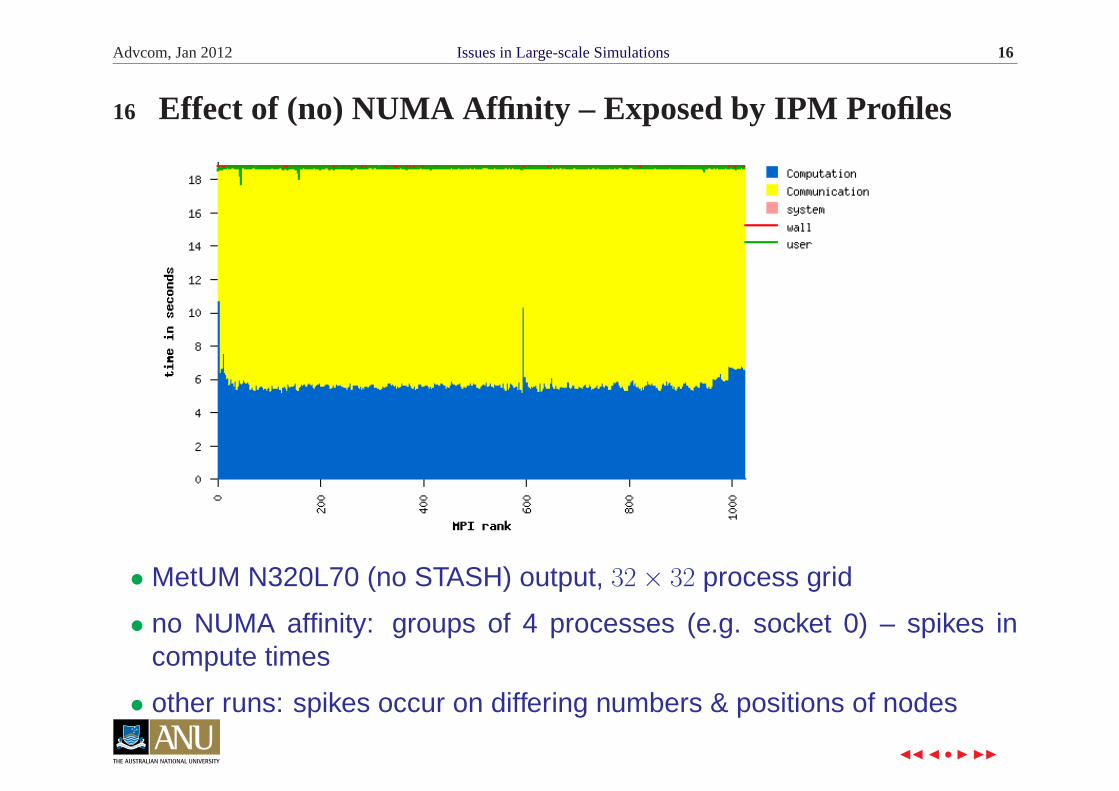
16 Effect of (no) NUMA Affinity – Exposed by IPM Profiles
• MetUM N320L70 (no STASH) output, 32× 32 process grid
• no NUMA affinity: groups of 4 processes (e.g. socket 0) – spikes incompute times
• other runs: spikes occur on differing numbers & positions of nodes
◭◭ ◭ • ◮ ◮◮ ×
Advcom, Jan 2012 Issues in Large-scale Simulations 17
17 Methodologies: Obtaining Representative Sub-Benchmarks
• standard 24 hour atmosphere benchmarks used by BoM are deemed torepresent 10-day operational runs
• how much of this actually needs to be done for an accurate and repre-sentative performance analysis?
• basic idea: reduce number of iterations and select representative itera-tions for extrapolation for a larger simulation
• works well when simulation’s computational profile is time-invariant
• cardiac simulation is more problematic:
• simulations of interest comprise applying an electric stimulation (e.g.0.25 ms) and awaiting response over a longer interval (e.g. 30 ms)
• depolarization are repolariztion wavefronts travel back and forth acrossthe model over the response time
• in such cases, detailed performance analysis is required across all po-tentially different intervals to see if computational profiles (significantly)change
◭◭ ◭ • ◮ ◮◮ ×
Advcom, Jan 2012 Issues in Large-scale Simulations 18
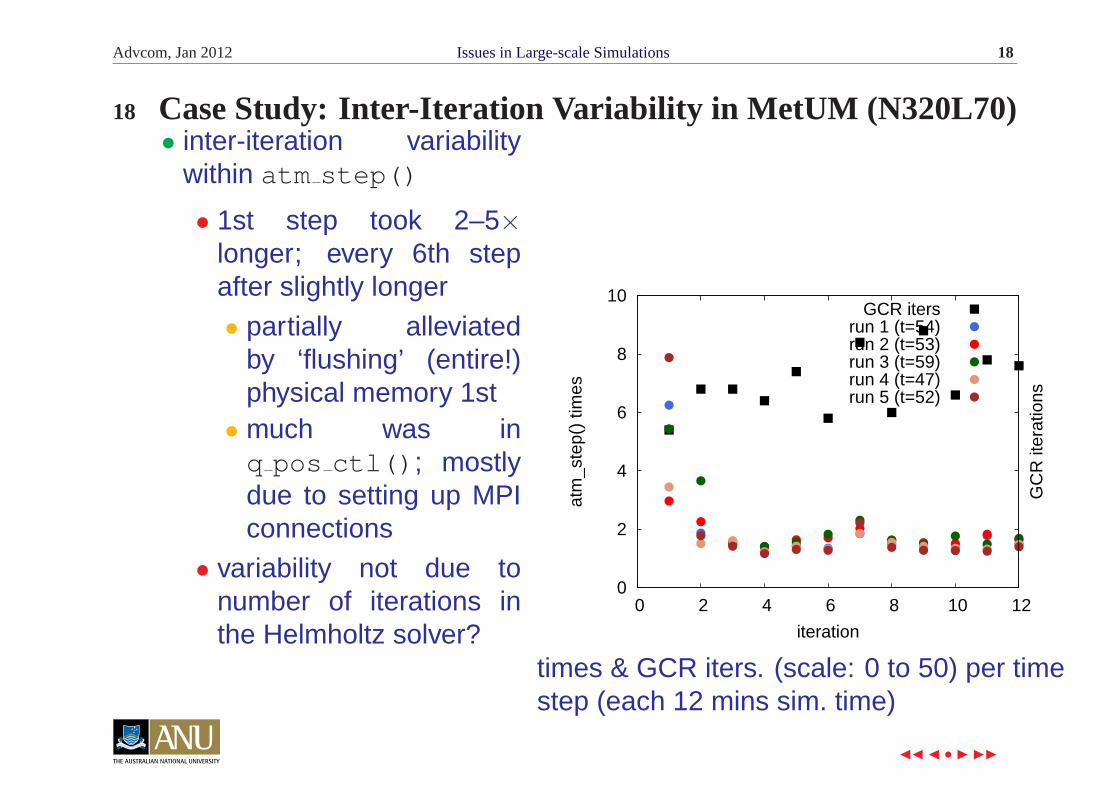
18 Case Study: Inter-Iteration Variability in MetUM (N320L70)• inter-iteration variability
within atm step()
• 1st step took 2–5×longer; every 6th stepafter slightly longer
• partially alleviatedby ‘flushing’ (entire!)physical memory 1st
• much was inq pos ctl(); mostlydue to setting up MPIconnections
• variability not due tonumber of iterations inthe Helmholtz solver?
0
2
4
6
8
10
0 2 4 6 8 10 12
atm
_ste
p()
times
GC
R it
erat
ions
iteration
GCR itersrun 1 (t=54)run 2 (t=53)run 3 (t=59)run 4 (t=47)run 5 (t=52)
times & GCR iters. (scale: 0 to 50) per timestep (each 12 mins sim. time)
◭◭ ◭ • ◮ ◮◮ ×
Advcom, Jan 2012 Issues in Large-scale Simulations 19
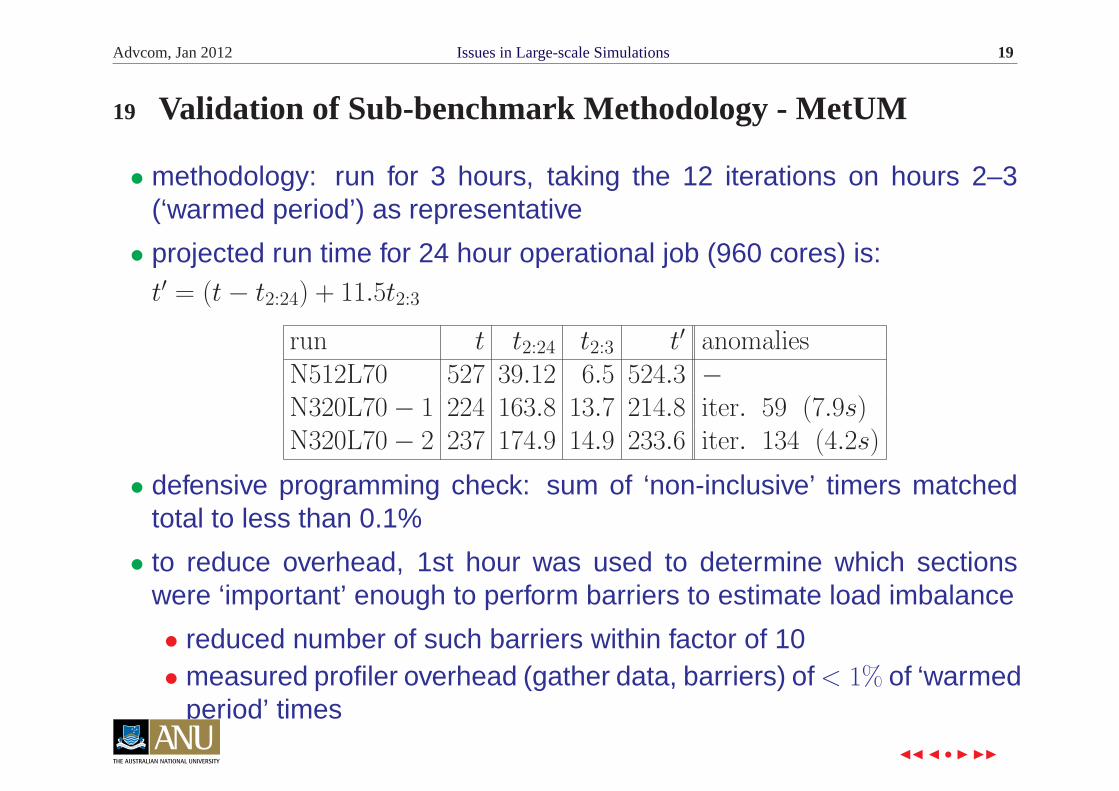
19 Validation of Sub-benchmark Methodology - MetUM
• methodology: run for 3 hours, taking the 12 iterations on hours 2–3(‘warmed period’) as representative
• projected run time for 24 hour operational job (960 cores) is:t′ = (t− t2:24) + 11.5t2:3
run t t2:24 t2:3 t′ anomaliesN512L70 527 39.12 6.5 524.3 −N320L70− 1 224 163.8 13.7 214.8 iter. 59 (7.9s)N320L70− 2 237 174.9 14.9 233.6 iter. 134 (4.2s)
• defensive programming check: sum of ‘non-inclusive’ timers matchedtotal to less than 0.1%
• to reduce overhead, 1st hour was used to determine which sectionswere ‘important’ enough to perform barriers to estimate load imbalance
• reduced number of such barriers within factor of 10• measured profiler overhead (gather data, barriers) of < 1% of ‘warmed
period’ times
◭◭ ◭ • ◮ ◮◮ ×
Advcom, Jan 2012 Issues in Large-scale Simulations 20
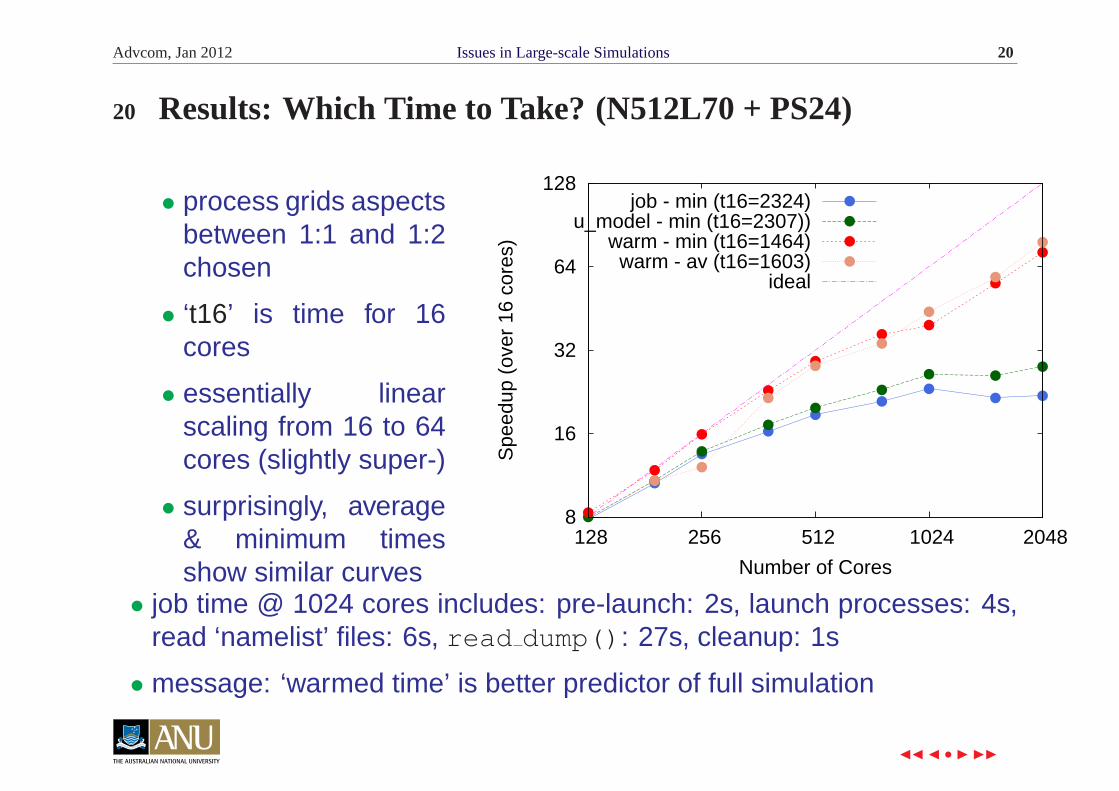
20 Results: Which Time to Take? (N512L70 + PS24)
• process grids aspectsbetween 1:1 and 1:2chosen
• ‘t16’ is time for 16cores
• essentially linearscaling from 16 to 64cores (slightly super-)
• surprisingly, average& minimum timesshow similar curves
8
16
32
64
128
128 256 512 1024 2048
Spe
edup
(ov
er 1
6 co
res)
Number of Cores
job - min (t16=2324)u_model - min (t16=2307))
warm - min (t16=1464)warm - av (t16=1603)
ideal
• job time @ 1024 cores includes: pre-launch: 2s, launch processes: 4s,read ‘namelist’ files: 6s, read dump(): 27s, cleanup: 1s
• message: ‘warmed time’ is better predictor of full simulation
◭◭ ◭ • ◮ ◮◮ ×
Advcom, Jan 2012 Issues in Large-scale Simulations 21
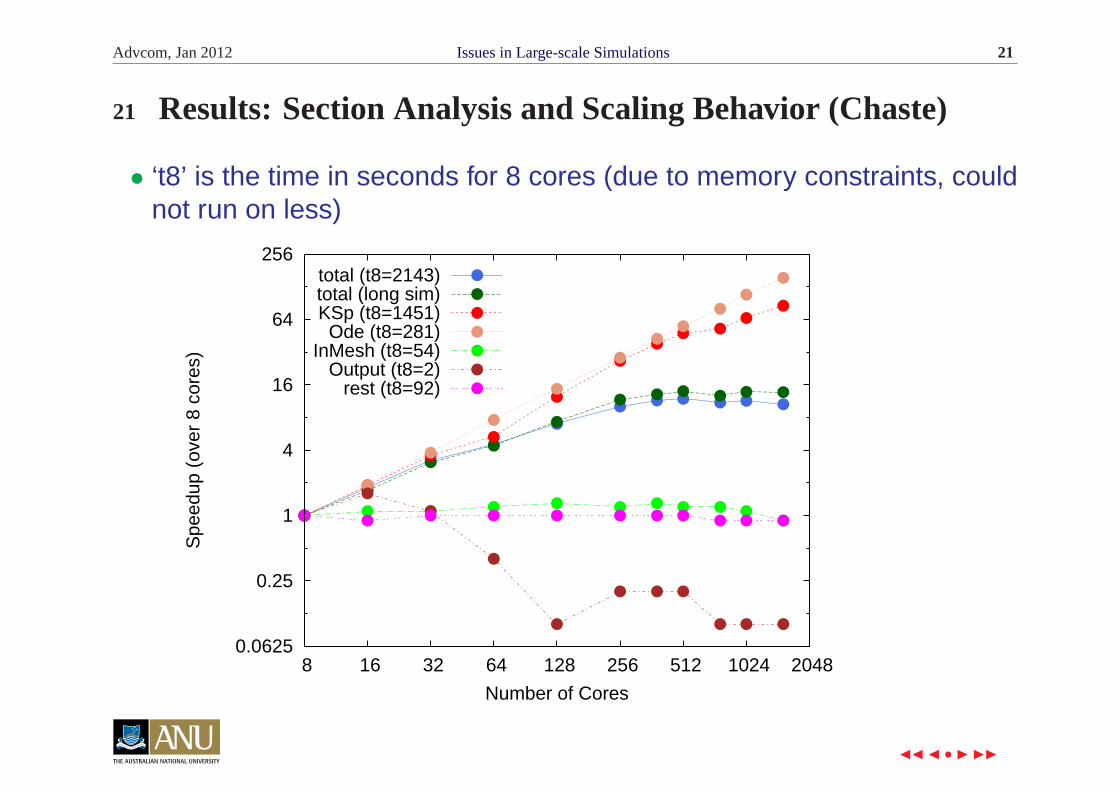
21 Results: Section Analysis and Scaling Behavior (Chaste)
• ‘t8’ is the time in seconds for 8 cores (due to memory constraints, couldnot run on less)
0.0625
0.25
1
4
16
64
256
8 16 32 64 128 256 512 1024 2048
Spe
edup
(ov
er 8
cor
es)
Number of Cores
total (t8=2143)total (long sim)KSp (t8=1451)
Ode (t8=281)InMesh (t8=54)
Output (t8=2)rest (t8=92)
◭◭ ◭ • ◮ ◮◮ ×
Advcom, Jan 2012 Issues in Large-scale Simulations 22
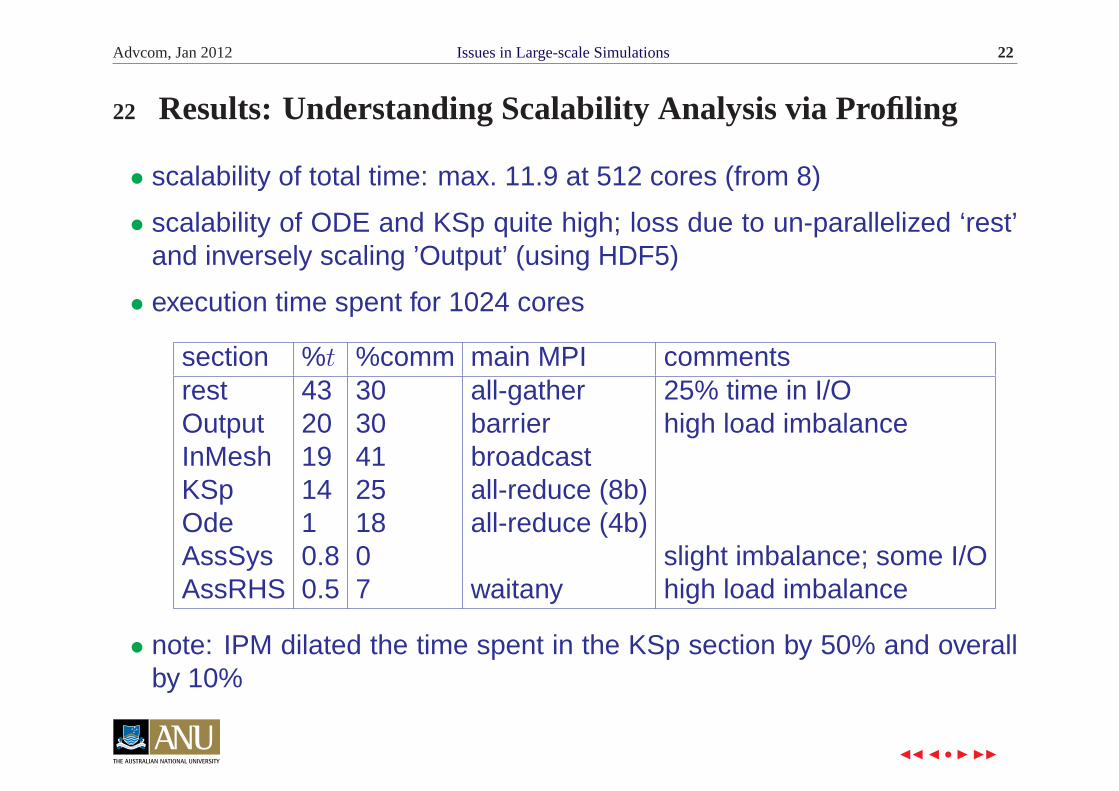
22 Results: Understanding Scalability Analysis via Profiling
• scalability of total time: max. 11.9 at 512 cores (from 8)
• scalability of ODE and KSp quite high; loss due to un-parallelized ‘rest’and inversely scaling ’Output’ (using HDF5)
• execution time spent for 1024 cores
section %t %comm main MPI commentsrest 43 30 all-gather 25% time in I/OOutput 20 30 barrier high load imbalanceInMesh 19 41 broadcastKSp 14 25 all-reduce (8b)Ode 1 18 all-reduce (4b)AssSys 0.8 0 slight imbalance; some I/OAssRHS 0.5 7 waitany high load imbalance
• note: IPM dilated the time spent in the KSp section by 50% and overallby 10%
◭◭ ◭ • ◮ ◮◮ ×
Advcom, Jan 2012 Issues in Large-scale Simulations 23
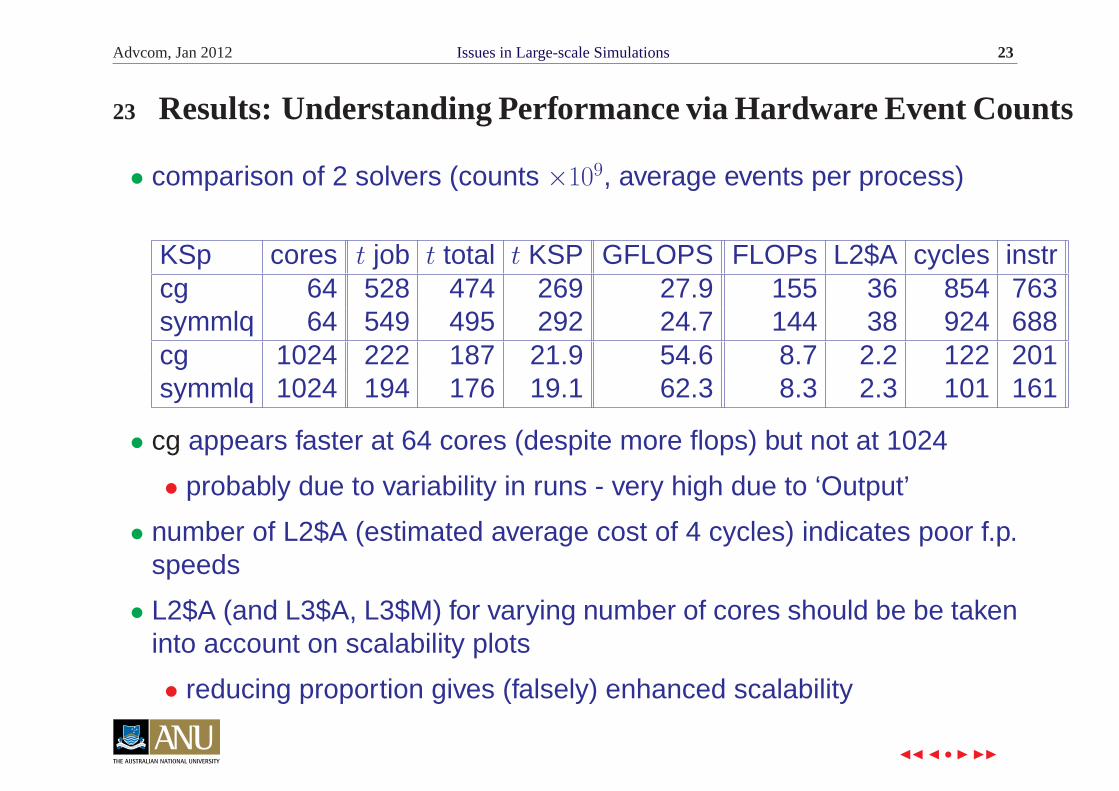
23 Results: Understanding Performance via Hardware Event Counts
• comparison of 2 solvers (counts ×109, average events per process)
KSp cores t job t total t KSP GFLOPS FLOPs L2$A cycles instrcg 64 528 474 269 27.9 155 36 854 763symmlq 64 549 495 292 24.7 144 38 924 688cg 1024 222 187 21.9 54.6 8.7 2.2 122 201symmlq 1024 194 176 19.1 62.3 8.3 2.3 101 161
• cg appears faster at 64 cores (despite more flops) but not at 1024
• probably due to variability in runs - very high due to ‘Output’
• number of L2$A (estimated average cost of 4 cycles) indicates poor f.p.speeds
• L2$A (and L3$A, L3$M) for varying number of cores should be be takeninto account on scalability plots
• reducing proportion gives (falsely) enhanced scalability
◭◭ ◭ • ◮ ◮◮ ×
Advcom, Jan 2012 Issues in Large-scale Simulations 24
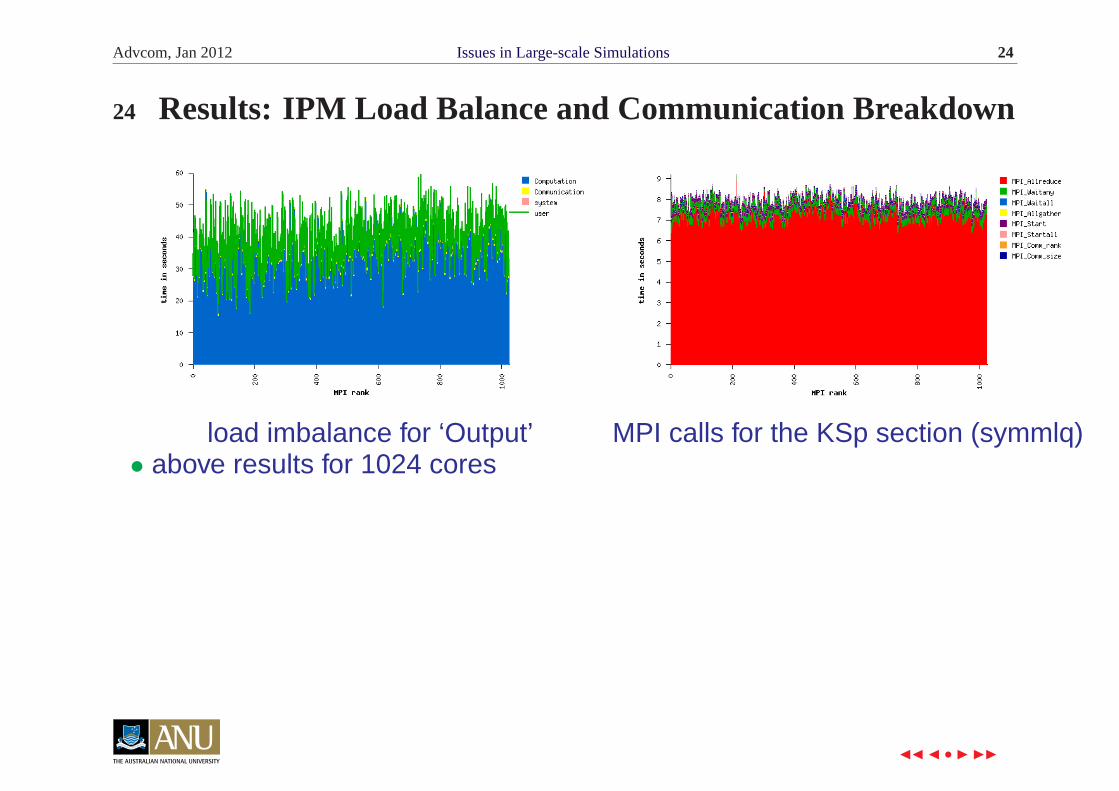
24 Results: IPM Load Balance and Communication Breakdown
load imbalance for ‘Output’ MPI calls for the KSp section (symmlq)• above results for 1024 cores
◭◭ ◭ • ◮ ◮◮ ×
Advcom, Jan 2012 Issues in Large-scale Simulations 25
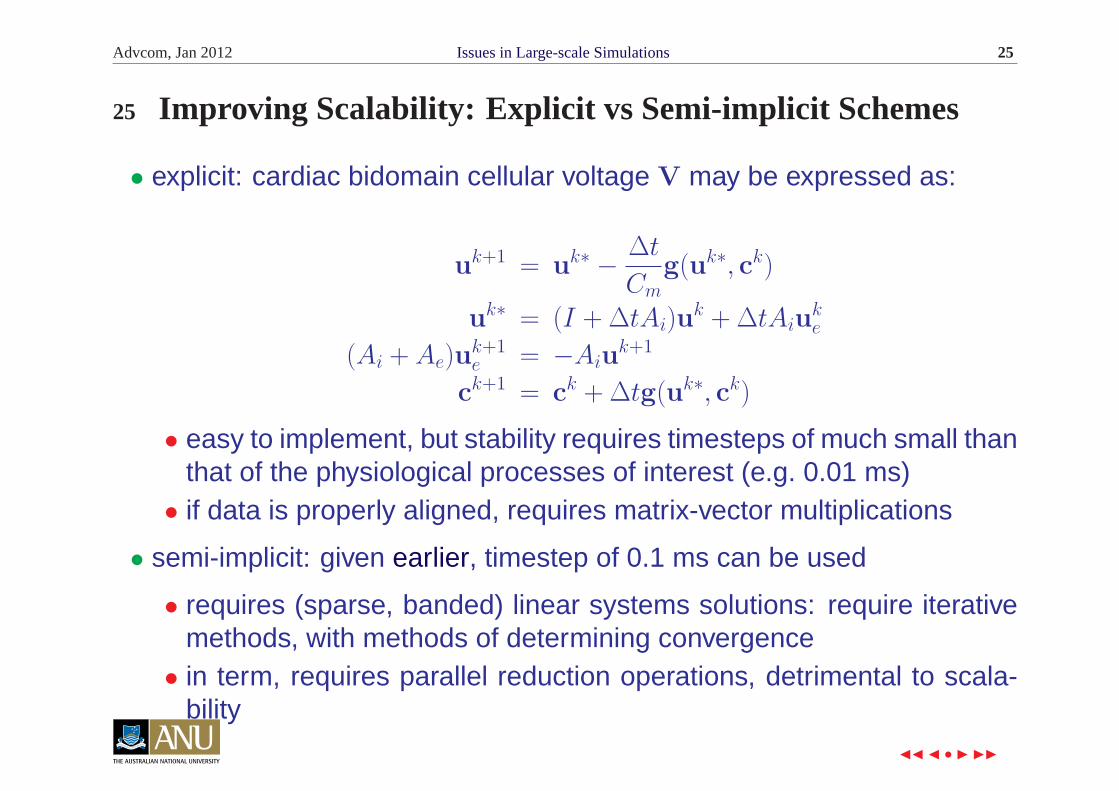
25 Improving Scalability: Explicit vs Semi-implicit Schemes
• explicit: cardiac bidomain cellular voltage V may be expressed as:
uk+1 = uk∗ −∆t
Cm
g(uk∗, ck)
uk∗ = (I +∆tAi)uk +∆tAiu
ke
(Ai + Ae)uk+1
e = −Aiuk+1
ck+1 = ck +∆tg(uk∗, ck)
• easy to implement, but stability requires timesteps of much small thanthat of the physiological processes of interest (e.g. 0.01 ms)
• if data is properly aligned, requires matrix-vector multiplications
• semi-implicit: given earlier, timestep of 0.1 ms can be used
• requires (sparse, banded) linear systems solutions: require iterativemethods, with methods of determining convergence
• in term, requires parallel reduction operations, detrimental to scala-bility
◭◭ ◭ • ◮ ◮◮ ×
Advcom, Jan 2012 Issues in Large-scale Simulations 26
26 Improving Scalability: Linear Systems Solution
• convergence prediction: can (dynamically) analyze rates across timesteps,estimating (upper bound on) minimum
• e.g. for MetUM N320L70 (GCR), always seems to ≥ 30 (never > 60)• for Chaste, generally ≥ 6
• the conjugate-gradient method requires 2 reductions per iteration
• used to guide ‘descent’ and determine convergence
other methods, e.g. Chebyshev and Richardson iterations require reduc-tions only to determine convergence
• these can be used (possibly in conjunction with other methods) toskip reductions until convergence becomes likely
• note: KSp section comm. time is dominated by 4-byte reductions!
• for systems with narrow bandwidth (i.e. ω ≈< Np), may be feasible to
replace solution of whole system with that of Np
local block sub-systems
• or at least, use this to precondition. e.g. fluid particulate systems
◭◭ ◭ • ◮ ◮◮ ×
Advcom, Jan 2012 Issues in Large-scale Simulations 27
27 Conclusions and Future Work
• performance of large-scale memory-intensive simulations
• working with such codes and systems is hard!
• many techniques and suitably lightweight tools needs to be applied inorder to understand it
• need to understand what (is the issue), then where, and then why• it is however possible to get useful insights, even for complex ap-
plications
• efficient methodologies need to be developed – non-trivial unlesscomputational profile is time-invariant!
• Chaste is challenging: need to look into this
• methods to reduce reductions and other global operations become moreattractive as we scale to larger numbers of cores
• future work includes looking at other applications (e.g. ANUGA, GENE)and even more radical methods!
◭◭ ◭ • ◮ ◮◮ ×
Advcom, Jan 2012 Issues in Large-scale Simulations 28
Acknowledgements!
• Tim Pugh and other staff at BoM
• NCI NF staff: Margaret Kahn, David Singleton, Jie Cai (IPM), . . .
• James Southern (FLE) – advice on benchmark configuration; Markus –Chaste modelling
• Fujitsu Laboratories Europe for supporting work on Chaste
Questons???
◭◭ ◭ • ◮ ◮◮ ×