Embed Size (px)
DESCRIPTION
Business plan
Citation preview
DESSERT BAKERY BUSINESS PLAN
Executive SummaryRutabaga Sweets is a dessert bar and bakery located in the Business Improvement District (BID) of Washington DC. We can loosely be described as a quick-service restaurant where customers sit around a bar and watch their desserts being made. The show, as well as the dessert, is our main selling point.Rutabaga Sweets will hold true to its vision of being a new concept with an old fashioned feel in order to become a favorite spot for DC natives. As the reported national leader in money spent in restaurants, Washington DC is an optimal location for launching a new restaurant concept. Rutabaga Sweets also hopes to become a destination for the thousands of tourists, both American and foreign, who visit DC every year.We plan to manipulate our location in the Business Improvement District to our utmost advantage. Both tax incentives and high traffic due to the MCI Center will give us an edge as a new business. As the BID fills up with new businesses over the next few years Rutabaga Sweets will receive an added boost of increased traffic. Therefore, we are aggressively planning for a 50% increase in sales the second year of business.By creating a new niche in the restaurant industry, Rutabaga Sweets will increase sales by more than $145,000 over three years while maintaining a gross margin of 80%. Through a philosophy of "nothing but the best" regarding both product and service, Rutabaga Sweets will establish itself as an exceptional dessert bar in Washington DC. We also will gain a competitive advantage in take out and catered desserts.This plan outlines our company concept, philosophy and forecasted financials. Rutabaga Sweets hopes to find seed money of $300,000 to launch our business in June of this year.
Need actual charts?We recommend using LivePlan as the easiest way to create graphs for your own business plan.Create your own business plan »1.1 Objectives
1. Attain sales of $166,000 in the first year.2. Increase second year sales by 50% and third year by 30%.3. Expand to two stores by the third year of business.
1.2 MissionRutabaga Sweets is a hospitality company dedicated to providing high-quality desserts in a comfortable atmosphere for clients who seek a fun "gourmet" experience outside restaurants. We intend to make enough profit to generate a fair return for our investors and to finance continued growth and development in quality products. We also maintain a friendly, fair, and creative work environment, which respects diversity, new ideas, and hard work.1.3 Keys to Success
Dedication to the finest quality ingredients and "make it happen no matter what" customer service. Ongoing employee education and recognition programs. Give back to the community.
Read more: http://www.bplans.com/dessert_bakery_business_plan/executive_summary_fc.php#ixzz2u3weXOxz
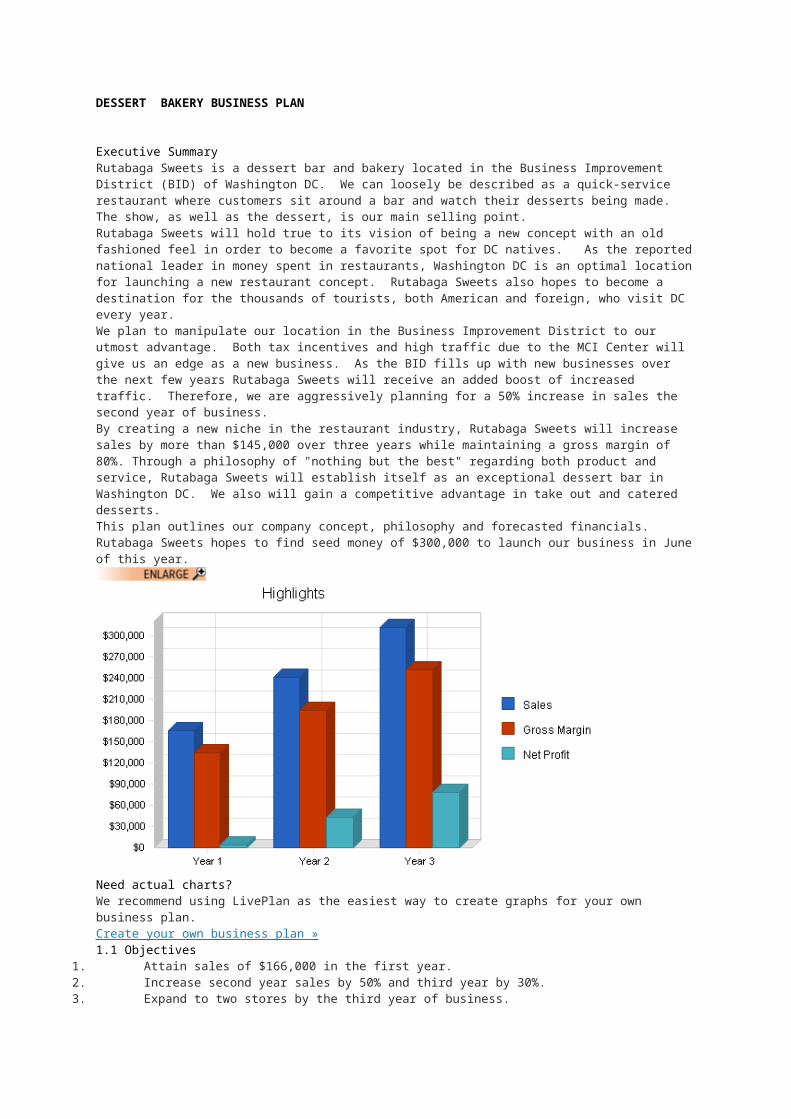
Company SummaryRutabaga Sweets is a dessert bar concept based in the Business Improvement District of Washington DC. It emphasizes handmade gourmet desserts in a casual atmosphere. Watching your dessert be prepared right in front of you is the unique selling point of our business.2.1 Company OwnershipRutabaga Sweets is a sole proprietorship seeking seed money. Incorporation will be decided at a later date as investors are secured.2.2 Start-up SummaryOur start-up costs come to $300,000 which is mostly kitchen equipment, store furnishings and construction, and starting inventory expenses associated with opening our first store. The start-up costs are to be financed by outside investment. The assumptions are shown in Table 1 and Illustration 2.
Need actual charts?We recommend using LivePlan as the easiest way to create graphs for your own business plan.Create your own business plan »
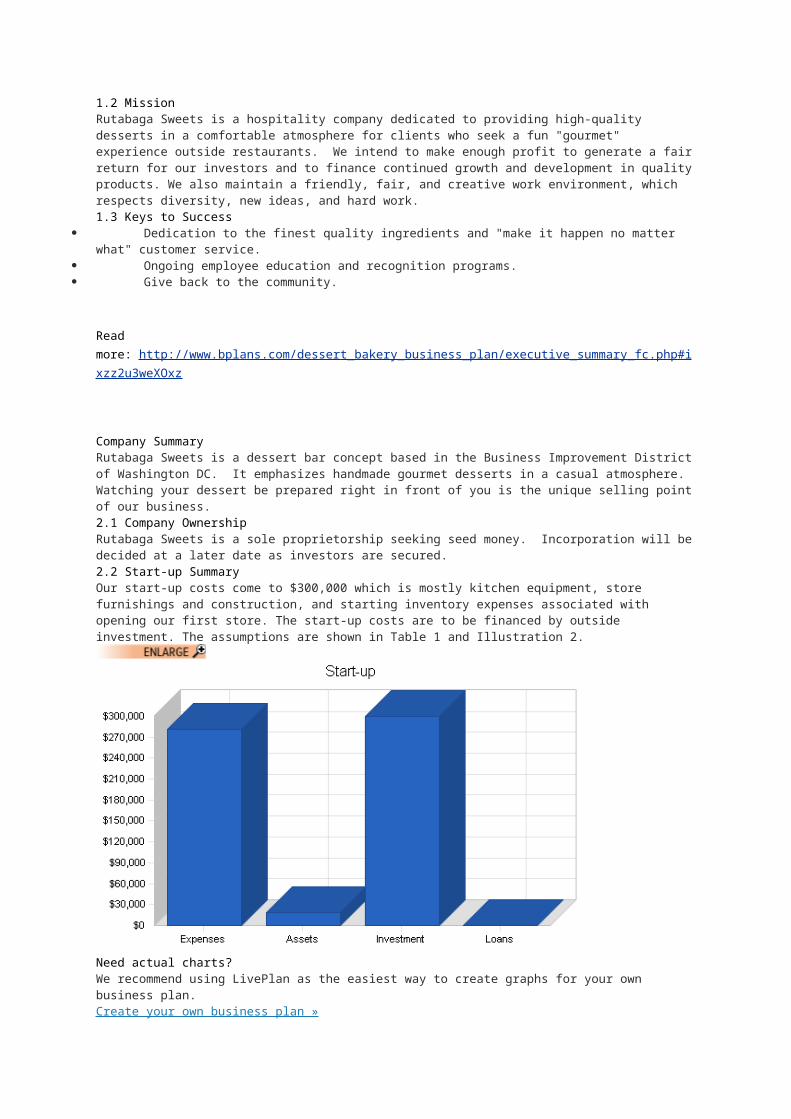
Start-up RequirementsStart-up Expenses
Legal $1,000
Office Supplies $2,000
Beginning Inventory $5,000
Sommelier consulting $500
Menus, etc $1,000
Insurance $500
Rent $5,000
Design & Construction $125,000
Research and Development $1,000
Furnishings $10,000
Expensed Equipment $125,000
Dishes, silverware, glassware, etc $5,000
Total Start-up Expenses $281,000
Start-up Assets
Cash Required $19,000
Start-up Inventory $0
Other Current Assets $0
Long-term Assets $0
Total Assets $19,000
Total Requirements $300,000Need real financials?We recommend using LivePlan as the easiest way to create automatic financials for your own business plan.
Create your own business plan »
Start-up FundingStart-up Expenses to Fund $281,000
Start-up Assets to Fund $19,000
Total Funding Required $300,000
Assets
Non-cash Assets from Start-up $0
Cash Requirements from Start-up $19,000
Additional Cash Raised $0
Cash Balance on Starting Date $19,000
Total Assets $19,000
Liabilities and Capital
Liabilities
Current Borrowing $0
Long-term Liabilities $0
Accounts Payable (Outstanding Bills) $0
Other Current Liabilities (interest-free) $0
Total Liabilities $0
Capital
Planned Investment
Investor 1 $300,000
Other $0
Additional Investment Requirement $0
Total Planned Investment $300,000
Loss at Start-up (Start-up Expenses) ($281,000)
Total Capital $19,000
Total Capital and Liabilities $19,000
Total Funding
Read more: http://www.bplans.com/dessert_bakery_business_plan/company_summary_fc.php#ixzz2u3x0CRdv
Products and ServicesRutabaga Sweets sells gourmet desserts coupled with exceptional customer service in a comforting atmosphere. Customers can dine-in and watch the chef create their dessert. We also offer carry-out to prepare our desserts at home or have a special cake for a celebration. And every month customers can join in the fun and take a cooking class taught by a Cordon Bleu trained chef.We will also offer special promotions such as After School Cookie Club. Moms will be encouraged to bring in their children for milk and cookies they help prepare! Or moms can come in with friends for some relaxing time away during our Tea Time. And to promote Rutabaga Sweets as a choice for celebrating, we will offer a large table that can be reserved for parties.
Read more: http://www.bplans.com/dessert_bakery_business_plan/products_and_services_fc.php#ixzz2u3xJtLqm
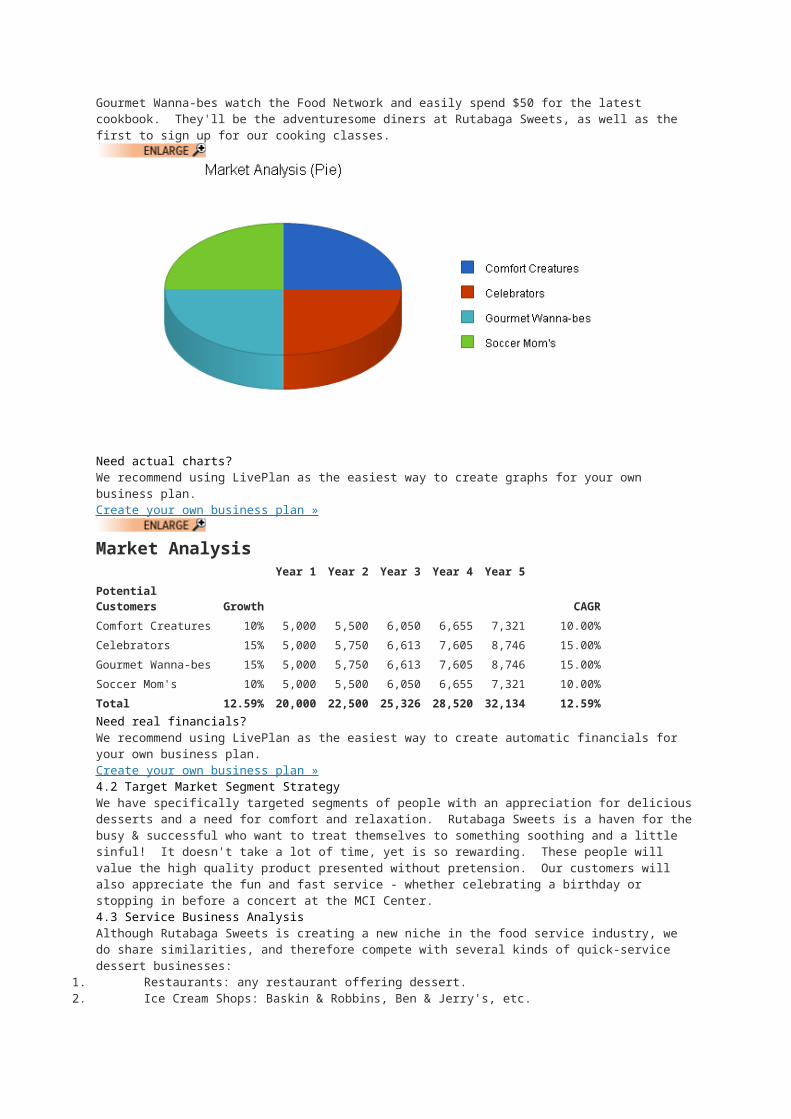
Market Analysis SummaryRutabaga Sweets focuses on local markets, with a special focus on restaurant and ice cream shop customers. Washington DC provides an excellent climate for our dessert bar as households there spend more money dining out than anywhere else in the country. 4.1 Market SegmentationOur market is divided into four different psychographics: Comfort Creatures, Celebrators, Soccer Moms, and Gourmet Wanna-bes. They represent groups of people sharing similar behavior patterns and reasons for patronizing Rutabaga Sweets.
Comfort Creatures are mainly white collar workers who are driven by success and prestige yet miss homemade comfort foods of their childhood. They may stop in on their own or bring clients in for a gourmet dessert experience.Celebrators are just that - people celebrating special occasions. Birthday, anniversary, graduation, valentine's day, etc., families and loved ones will gather at Rutabaga Sweets over sumptuous desserts and a festive atmosphere.Soccer Moms actually encompasses all family members. Rutabaga Sweets is a gathering place where families are welcome and feel comfortable. "Moms" can come in for after school milk and cookies with their children and relax while we pamper the little ones. Or they can meet up with friends for our Tea Time - a little civilized time stolen in the midst of a busy day.Gourmet Wanna-bes watch the Food Network and easily spend $50 for the latest cookbook. They'll be the adventuresome diners at Rutabaga Sweets, as well as the first to sign up for our cooking classes.
Need actual charts?We recommend using LivePlan as the easiest way to create graphs for your own business plan.Create your own business plan »
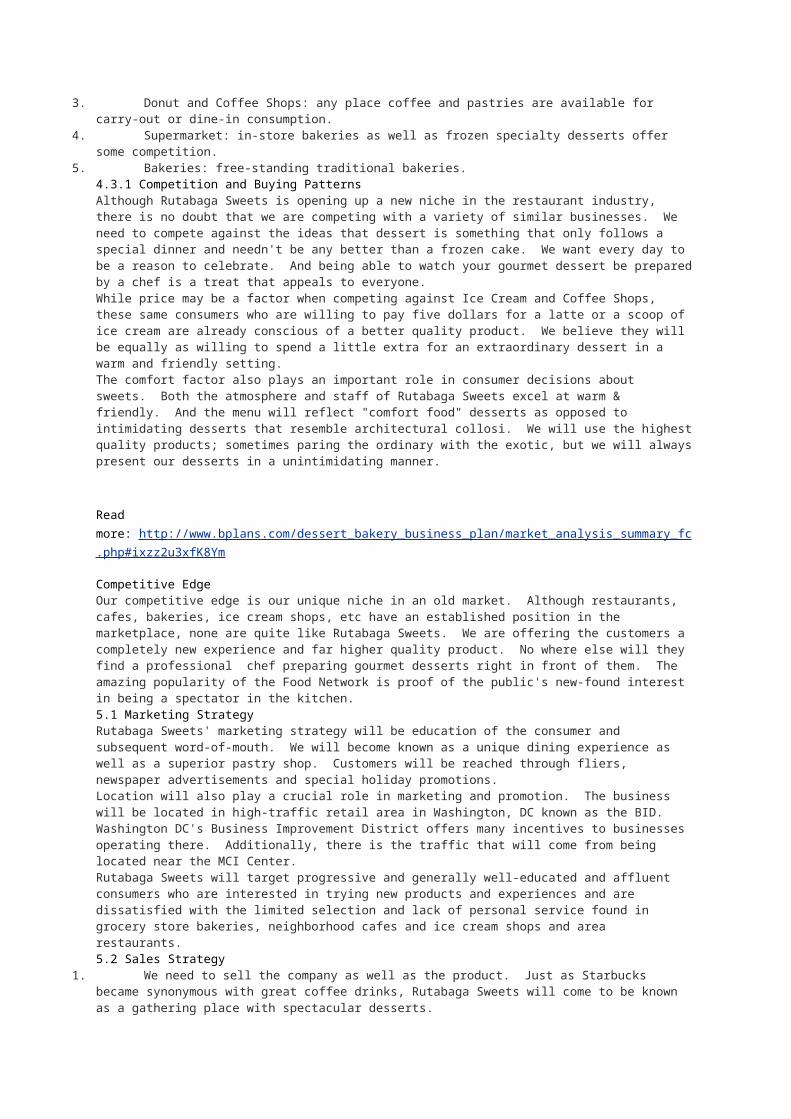
Market AnalysisYear 1 Year 2 Year 3 Year 4 Year 5
Potential Customers Growth CAGR
Comfort Creatures 10% 5,000 5,500 6,050 6,655 7,321 10.00%
Celebrators 15% 5,000 5,750 6,613 7,605 8,746 15.00%
Gourmet Wanna-bes 15% 5,000 5,750 6,613 7,605 8,746 15.00%
Soccer Mom's 10% 5,000 5,500 6,050 6,655 7,321 10.00%
Total 12.59% 20,000 22,500 25,326 28,520 32,134 12.59%Need real financials?We recommend using LivePlan as the easiest way to create automatic financials for your own business plan.Create your own business plan »4.2 Target Market Segment StrategyWe have specifically targeted segments of people with an appreciation for delicious desserts and a need for comfort and relaxation. Rutabaga Sweets is a haven for the busy & successful who want to treat themselves to something soothing and a little sinful! It doesn't take a lot of time, yet is so rewarding. These people will value the high quality product presented without pretension. Our customers will also appreciate the fun and fast service - whether celebrating a birthday or stopping in before a concert at the MCI Center.4.3 Service Business AnalysisAlthough Rutabaga Sweets is creating a new niche in the food service industry, we do share similarities, and therefore compete with several kinds of quick-service dessert businesses:
1. Restaurants: any restaurant offering dessert.2. Ice Cream Shops: Baskin & Robbins, Ben & Jerry's, etc.3. Donut and Coffee Shops: any place coffee and pastries are available for carry-out or dine-in
consumption.4. Supermarket: in-store bakeries as well as frozen specialty desserts offer some competition.5. Bakeries: free-standing traditional bakeries.
4.3.1 Competition and Buying PatternsAlthough Rutabaga Sweets is opening up a new niche in the restaurant industry, there is no doubt that we are competing with a variety of similar businesses. We need to compete against the ideas that dessert is something that only follows a special dinner and needn't be any better than a frozen cake. We want every day to be a reason to celebrate. And being able to watch your gourmet dessert be prepared by a chef is a treat that appeals to everyone.While price may be a factor when competing against Ice Cream and Coffee Shops, these same consumers who are willing to pay five dollars for a latte or a scoop of ice cream are already conscious of a better quality product. We believe they will be equally as willing to spend a little extra for an extraordinary dessert in a warm and friendly setting.The comfort factor also plays an important role in consumer decisions about sweets. Both the atmosphere and staff of Rutabaga Sweets excel at warm & friendly. And the menu will reflect "comfort food" desserts as opposed to intimidating desserts that resemble architectural collosi. We will use the highest quality products; sometimes paring the ordinary with the exotic, but we will always present our desserts in a unintimidating manner.
Read more: http://www.bplans.com/dessert_bakery_business_plan/market_analysis_summary_fc.php#ixzz2u3xfK8Ym
Competitive EdgeOur competitive edge is our unique niche in an old market. Although restaurants, cafes, bakeries, ice cream shops, etc have an established position in the marketplace, none are quite like Rutabaga Sweets. We are offering the customers a completely new experience and far higher quality product. No where else will they find a professional chef preparing gourmet desserts right in front of them. The amazing popularity of the Food Network is proof of the public's new-found interest in being a spectator in the kitchen.5.1 Marketing StrategyRutabaga Sweets' marketing strategy will be education of the consumer and subsequent word-of-mouth. We will become known as a unique dining experience as well as a superior pastry shop. Customers will be reached through fliers, newspaper advertisements and special holiday promotions.Location will also play a crucial role in marketing and promotion. The business will be located in high-traffic retail area in Washington, DC known as the BID. Washington DC's Business Improvement District offers many incentives to businesses operating there. Additionally, there is the traffic that will come from being located near the MCI Center.Rutabaga Sweets will target progressive and generally well-educated and affluent consumers who are interested in trying new products and experiences and are dissatisfied with the limited selection and lack of personal service found in grocery store bakeries, neighborhood cafes and ice cream shops and area restaurants.5.2 Sales Strategy
1. We need to sell the company as well as the product. Just as Starbucks became synonymous with great coffee drinks, Rutabaga Sweets will come to be known as a gathering place with spectacular desserts.
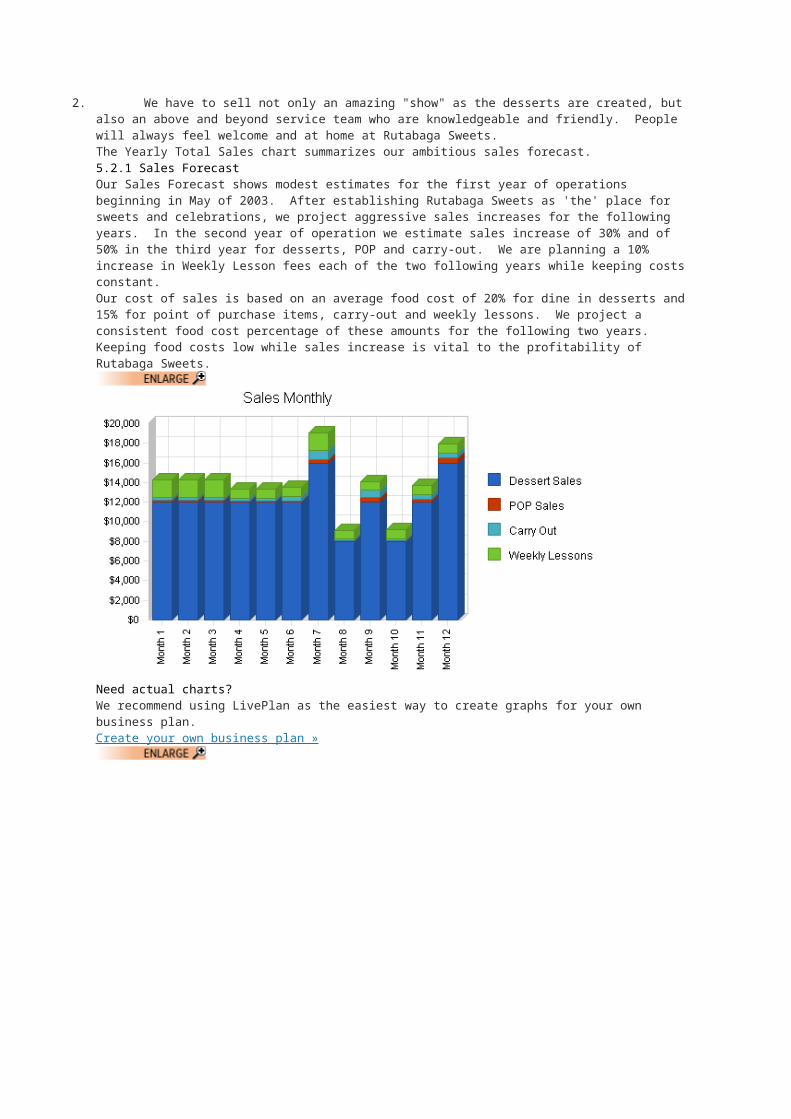
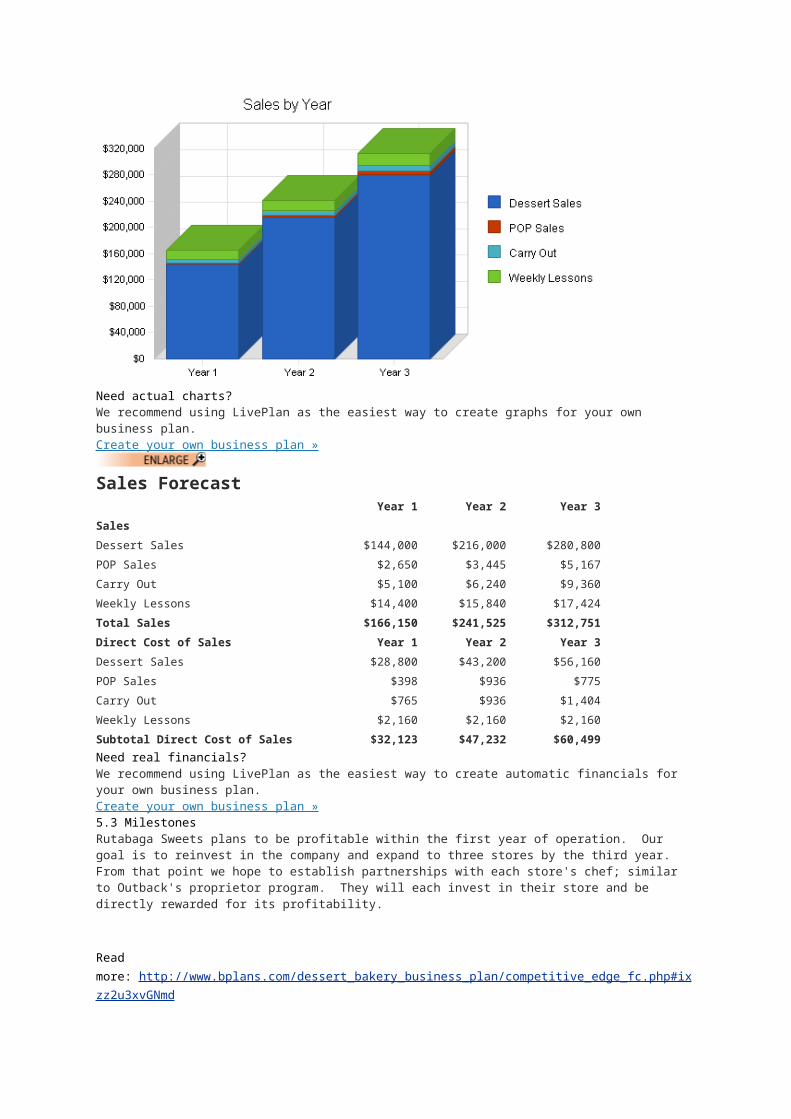
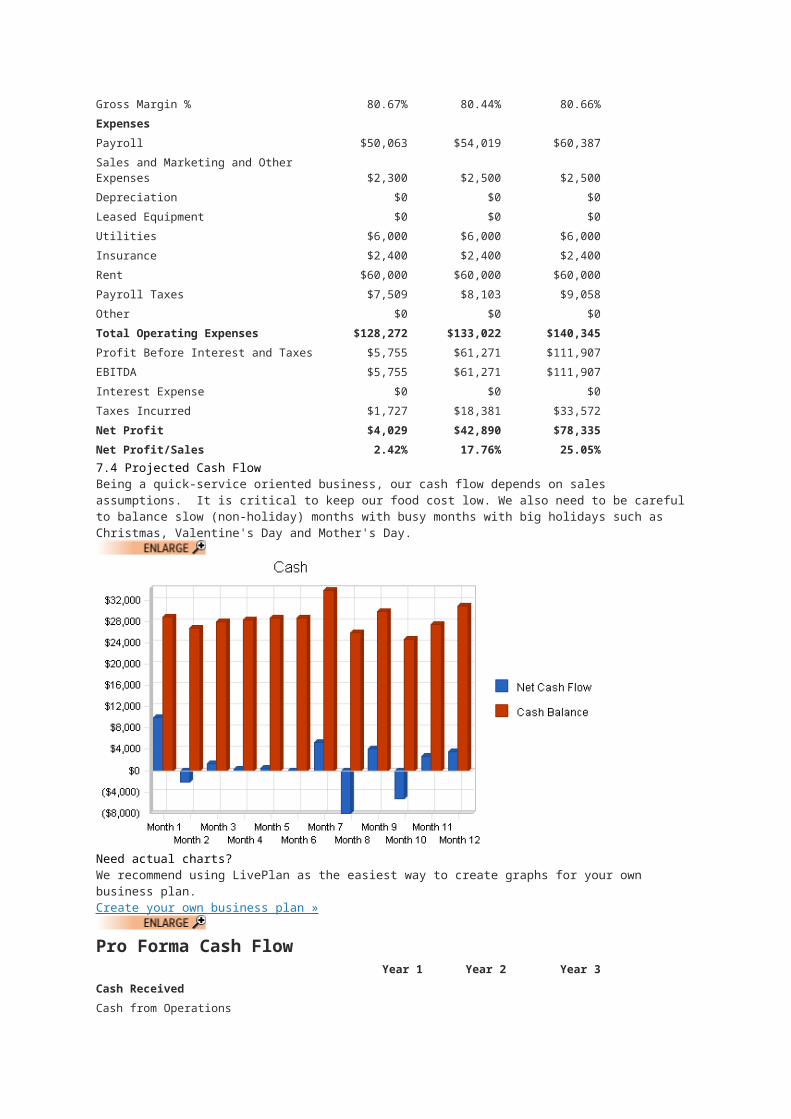
2. We have to sell not only an amazing "show" as the desserts are created, but also an above and beyond service team who are knowledgeable and friendly. People will always feel welcome and at home at Rutabaga Sweets.The Yearly Total Sales chart summarizes our ambitious sales forecast.5.2.1 Sales ForecastOur Sales Forecast shows modest estimates for the first year of operations beginning in May of 2003. After establishing Rutabaga Sweets as 'the' place for sweets and celebrations, we project aggressive sales increases for the following years. In the second year of operation we estimate sales increase of 30% and of 50% in the third year for desserts, POP and carry-out. We are planning a 10% increase in Weekly Lesson fees each of the two following years while keeping costs constant.Our cost of sales is based on an average food cost of 20% for dine in desserts and 15% for point of purchase items, carry-out and weekly lessons. We project a consistent food cost percentage of these amounts for the following two years. Keeping food costs low while sales increase is vital to the profitability of Rutabaga Sweets.
Need actual charts?We recommend using LivePlan as the easiest way to create graphs for your own business plan.Create your own business plan »
Need actual charts?We recommend using LivePlan as the easiest way to create graphs for your own business plan.Create your own business plan »
Sales ForecastYear 1 Year 2 Year 3
Sales
Dessert Sales $144,000 $216,000 $280,800
POP Sales $2,650 $3,445 $5,167
Carry Out $5,100 $6,240 $9,360
Weekly Lessons $14,400 $15,840 $17,424
Total Sales $166,150 $241,525 $312,751
Direct Cost of Sales Year 1 Year 2 Year 3
Dessert Sales $28,800 $43,200 $56,160
POP Sales $398 $936 $775
Carry Out $765 $936 $1,404
Weekly Lessons $2,160 $2,160 $2,160
Subtotal Direct Cost of Sales $32,123 $47,232 $60,499Need real financials?We recommend using LivePlan as the easiest way to create automatic financials for your own business plan.Create your own business plan »5.3 MilestonesRutabaga Sweets plans to be profitable within the first year of operation. Our goal is to reinvest in the company and expand to three stores by the third year. From that point we hope to establish partnerships with each store's chef; similar to Outback's proprietor program. They will each invest in their store and be directly rewarded for its profitability.
Read more: http://www.bplans.com/dessert_bakery_business_plan/competitive_edge_fc.php#ixzz2u3xvGNmd
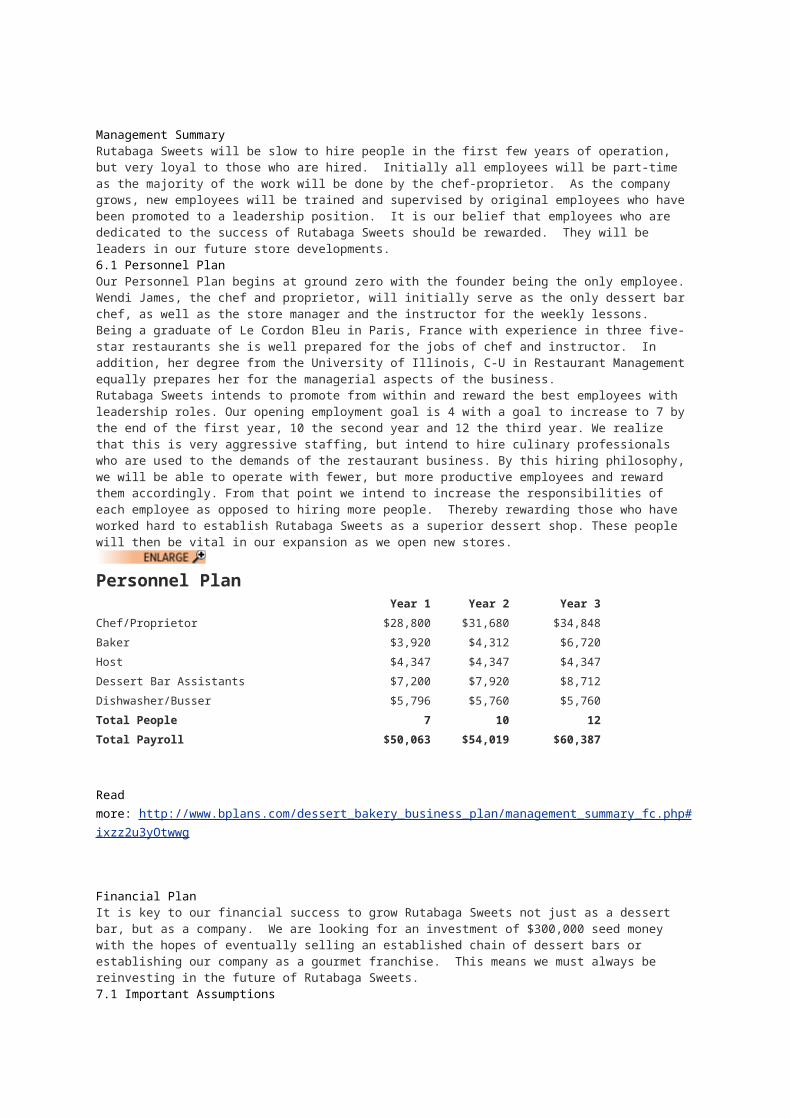
Management SummaryRutabaga Sweets will be slow to hire people in the first few years of operation, but very loyal to those who are hired. Initially all employees will be part-time as the majority of the work will be done by the chef-proprietor. As the company grows, new employees will be trained and supervised by original employees who have been promoted to a leadership position. It is our belief that employees who are dedicated to the success of Rutabaga Sweets should be rewarded. They will be leaders in our future store developments.6.1 Personnel PlanOur Personnel Plan begins at ground zero with the founder being the only employee. Wendi James, the chef and proprietor, will initially serve as the only dessert bar chef, as well as the store manager and the instructor for the weekly lessons. Being a graduate of Le Cordon Bleu in Paris, France with experience in three five-star restaurants she is well prepared for the jobs of chef and instructor. In addition, her degree from the University of Illinois, C-U in Restaurant Management equally prepares her for the managerial aspects of the business.Rutabaga Sweets intends to promote from within and reward the best employees with leadership roles. Our opening employment goal is 4 with a goal to increase to 7 by the end of the first year, 10 the second year and 12 the third year. We realize that this is very aggressive staffing, but intend to hire culinary professionals who are used to the demands of the restaurant business. By this hiring philosophy, we will be able to operate with fewer, but more productive employees and reward them accordingly. From that point we intend to increase the responsibilities of each employee as opposed to hiring more people. Thereby rewarding those who have worked hard to establish Rutabaga Sweets as a superior dessert shop. These people will then be vital in our expansion as we open new stores.
Personnel PlanYear 1 Year 2 Year 3
Chef/Proprietor $28,800 $31,680 $34,848
Baker $3,920 $4,312 $6,720
Host $4,347 $4,347 $4,347
Dessert Bar Assistants $7,200 $7,920 $8,712
Dishwasher/Busser $5,796 $5,760 $5,760
Total People 7 10 12
Total Payroll $50,063 $54,019 $60,387
Read more: http://www.bplans.com/dessert_bakery_business_plan/management_summary_fc.php#ixzz2u3yOtwwg
Financial PlanIt is key to our financial success to grow Rutabaga Sweets not just as a dessert bar, but as a company. We are looking for an investment of $300,000 seed money with the hopes of eventually selling an established chain of dessert bars or establishing our company as a gourmet franchise. This means we must always be reinvesting in the future of Rutabaga Sweets.7.1 Important AssumptionsThe financial plan depends on important assumptions, most of which are shown in the following table. The key underlying assumptions are:
We assume a slow-growth economy, without major recession. We assume of course that there are no unforeseen changes in technology to make products
immediately obsolete.
We assume access to equity capital and financing sufficient to maintain our financial plan as shown in the tables.
General AssumptionsYear 1 Year 2 Year 3
Plan Month 1 2 3
Current Interest Rate 10.00% 10.00% 10.00%
Long-term Interest Rate 10.00% 10.00% 10.00%
Tax Rate 30.00% 30.00% 30.00%
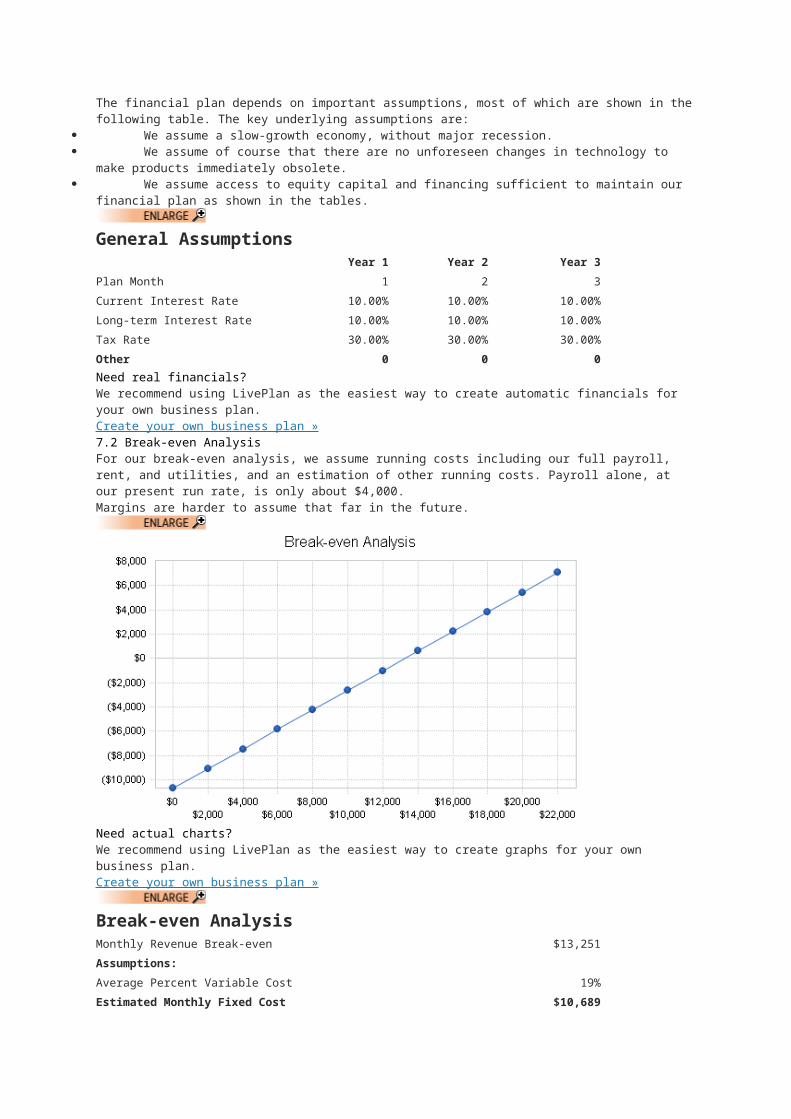
Other 0 0 0Need real financials?We recommend using LivePlan as the easiest way to create automatic financials for your own business plan.Create your own business plan »7.2 Break-even AnalysisFor our break-even analysis, we assume running costs including our full payroll, rent, and utilities, and an estimation of other running costs. Payroll alone, at our present run rate, is only about $4,000.Margins are harder to assume that far in the future.
Need actual charts?We recommend using LivePlan as the easiest way to create graphs for your own business plan.Create your own business plan »
Break-even AnalysisMonthly Revenue Break-even $13,251
Assumptions:
Average Percent Variable Cost 19%
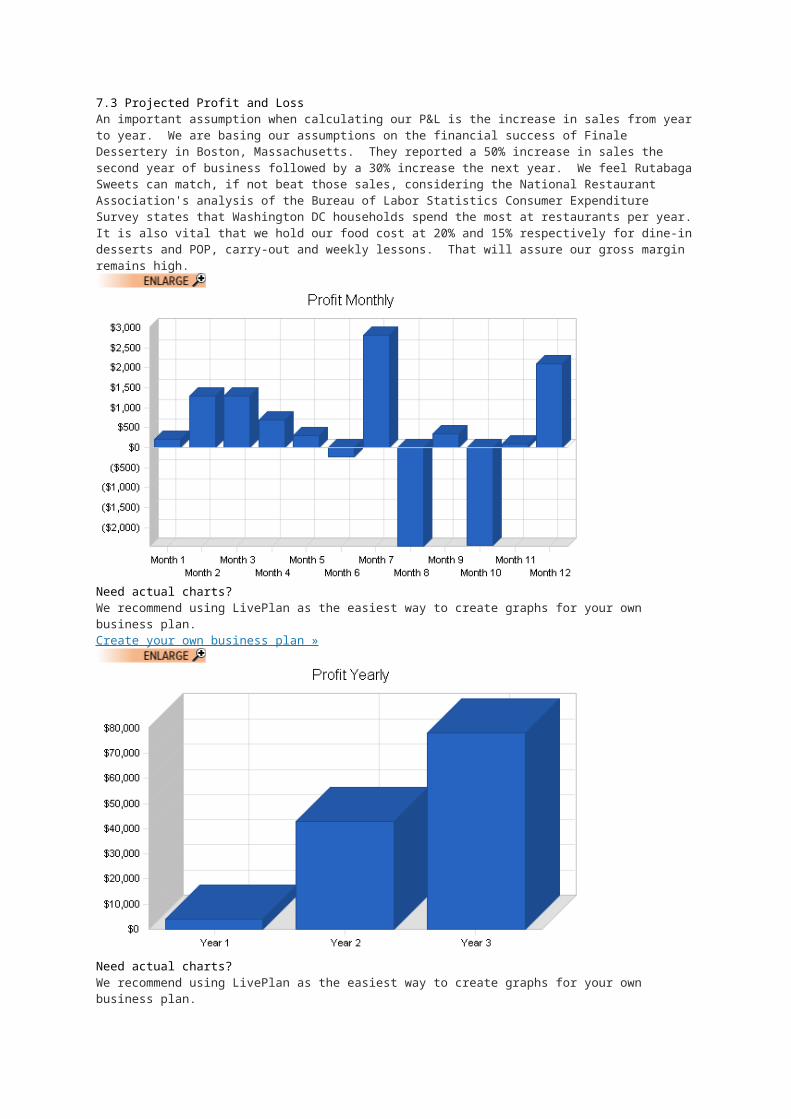
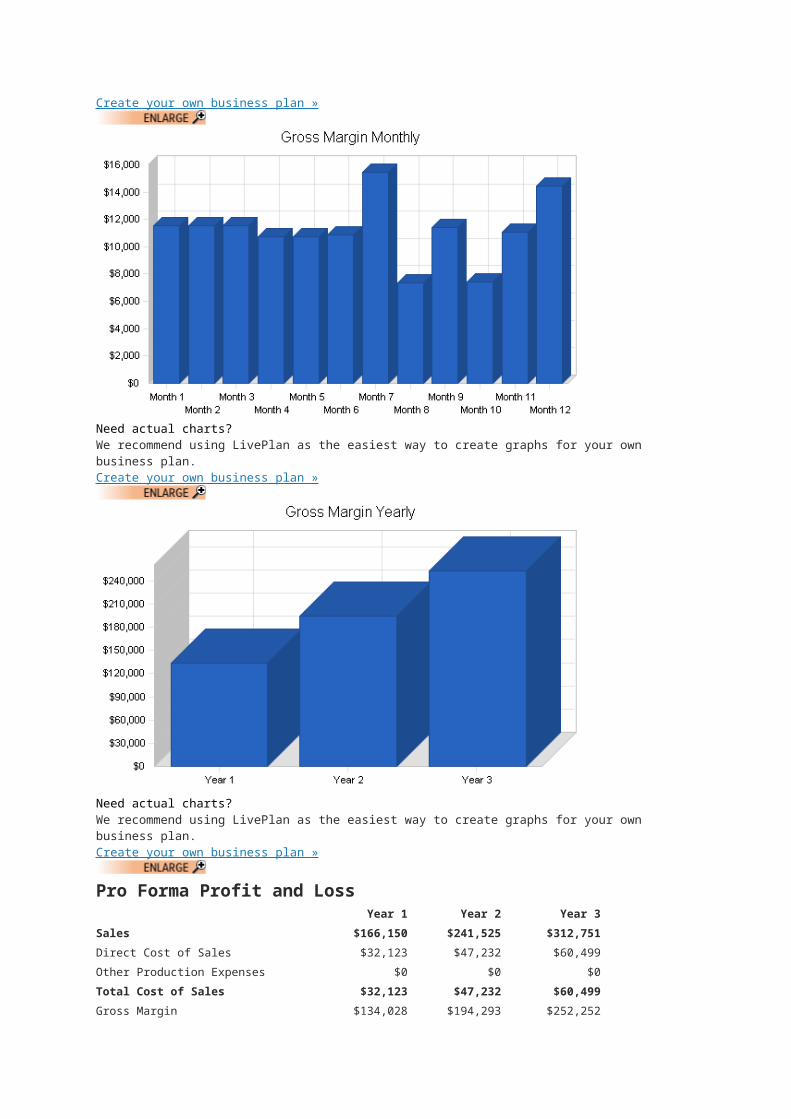
Estimated Monthly Fixed Cost $10,6897.3 Projected Profit and LossAn important assumption when calculating our P&L is the increase in sales from year to year. We are basing our assumptions on the financial success of Finale Dessertery in Boston, Massachusetts. They reported a 50% increase in sales the second year of business followed by a 30% increase the next year. We feel Rutabaga Sweets can match, if not beat those sales, considering the National Restaurant Association's analysis of the Bureau of Labor Statistics Consumer Expenditure Survey states that Washington DC households spend the most at restaurants per year.It is also vital that we hold our food cost at 20% and 15% respectively for dine-in desserts and POP, carry-out and weekly lessons. That will assure our gross margin remains high.
Need actual charts?We recommend using LivePlan as the easiest way to create graphs for your own business plan.Create your own business plan »
Need actual charts?We recommend using LivePlan as the easiest way to create graphs for your own business plan.Create your own business plan »
Need actual charts?We recommend using LivePlan as the easiest way to create graphs for your own business plan.Create your own business plan »
Need actual charts?We recommend using LivePlan as the easiest way to create graphs for your own business plan.Create your own business plan »
Pro Forma Profit and LossYear 1 Year 2 Year 3
Sales $166,150 $241,525 $312,751
Direct Cost of Sales $32,123 $47,232 $60,499
Other Production Expenses $0 $0 $0
Total Cost of Sales $32,123 $47,232 $60,499
Gross Margin $134,028 $194,293 $252,252
Gross Margin % 80.67% 80.44% 80.66%
Expenses
Payroll $50,063 $54,019 $60,387
Sales and Marketing and Other Expenses $2,300 $2,500 $2,500
Depreciation $0 $0 $0
Leased Equipment $0 $0 $0
Utilities $6,000 $6,000 $6,000
Insurance $2,400 $2,400 $2,400
Rent $60,000 $60,000 $60,000
Payroll Taxes $7,509 $8,103 $9,058
Other $0 $0 $0
Total Operating Expenses $128,272 $133,022 $140,345
Profit Before Interest and Taxes $5,755 $61,271 $111,907
EBITDA $5,755 $61,271 $111,907
Interest Expense $0 $0 $0
Taxes Incurred $1,727 $18,381 $33,572
Net Profit $4,029 $42,890 $78,335
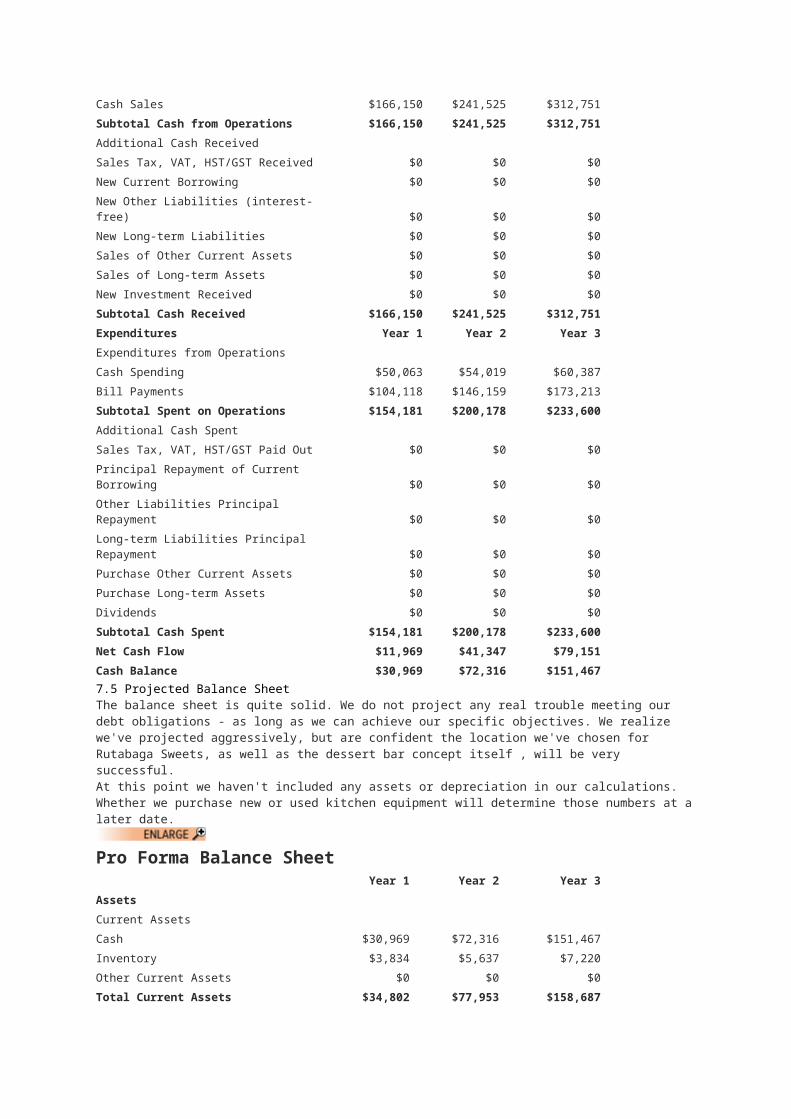
Net Profit/Sales 2.42% 17.76% 25.05%7.4 Projected Cash FlowBeing a quick-service oriented business, our cash flow depends on sales assumptions. It is critical to keep our food cost low. We also need to be careful to balance slow (non-holiday) months with busy months with big holidays such as Christmas, Valentine's Day and Mother's Day.
Need actual charts?We recommend using LivePlan as the easiest way to create graphs for your own business plan.Create your own business plan »
Pro Forma Cash FlowYear 1 Year 2 Year 3
Cash Received
Cash from Operations
Cash Sales $166,150 $241,525 $312,751
Subtotal Cash from Operations $166,150 $241,525 $312,751
Additional Cash Received
Sales Tax, VAT, HST/GST Received $0 $0 $0
New Current Borrowing $0 $0 $0
New Other Liabilities (interest-free) $0 $0 $0
New Long-term Liabilities $0 $0 $0
Sales of Other Current Assets $0 $0 $0
Sales of Long-term Assets $0 $0 $0
New Investment Received $0 $0 $0
Subtotal Cash Received $166,150 $241,525 $312,751
Expenditures Year 1 Year 2 Year 3
Expenditures from Operations
Cash Spending $50,063 $54,019 $60,387
Bill Payments $104,118 $146,159 $173,213
Subtotal Spent on Operations $154,181 $200,178 $233,600
Additional Cash Spent
Sales Tax, VAT, HST/GST Paid Out $0 $0 $0
Principal Repayment of Current Borrowing $0 $0 $0
Other Liabilities Principal Repayment $0 $0 $0
Long-term Liabilities Principal Repayment $0 $0 $0
Purchase Other Current Assets $0 $0 $0
Purchase Long-term Assets $0 $0 $0
Dividends $0 $0 $0
Subtotal Cash Spent $154,181 $200,178 $233,600
Net Cash Flow $11,969 $41,347 $79,151
Cash Balance $30,969 $72,316 $151,4677.5 Projected Balance SheetThe balance sheet is quite solid. We do not project any real trouble meeting our debt obligations - as long as we can achieve our specific objectives. We realize we've projected aggressively, but are confident the location we've chosen for Rutabaga Sweets, as well as the dessert bar concept itself , will be very successful.At this point we haven't included any assets or depreciation in our calculations. Whether we purchase new or used kitchen equipment will determine those numbers at a later date.
Pro Forma Balance SheetYear 1 Year 2 Year 3
Assets
Current Assets
Cash $30,969 $72,316 $151,467
Inventory $3,834 $5,637 $7,220
Other Current Assets $0 $0 $0
Total Current Assets $34,802 $77,953 $158,687
Long-term Assets
Long-term Assets $0 $0 $0
Accumulated Depreciation $0 $0 $0
Total Long-term Assets $0 $0 $0
Total Assets $34,802 $77,953 $158,687
Liabilities and Capital Year 1 Year 2 Year 3
Current Liabilities
Accounts Payable $11,774 $12,034 $14,434
Current Borrowing $0 $0 $0
Other Current Liabilities $0 $0 $0
Subtotal Current Liabilities $11,774 $12,034 $14,434
Long-term Liabilities $0 $0 $0
Total Liabilities $11,774 $12,034 $14,434
Paid-in Capital $300,000 $300,000 $300,000
Retained Earnings ($281,000) ($276,971) ($234,082)
Earnings $4,029 $42,890 $78,335
Total Capital $23,029 $65,918 $144,253
Total Liabilities and Capital $34,802 $77,953 $158,687
Net Worth $23,029 $65,918 $144,253Need real financials?We recommend using LivePlan as the easiest way to create automatic financials for your own business plan.Create your own business plan »7.6 Business Ratios
Ratio AnalysisYear 1 Year 2 Year 3 Industry Profile
Sales Growth 0.00% 45.37% 29.49% 4.56%
Percent of Total Assets
Inventory 11.02% 7.23% 4.55% 13.08%
Other Current Assets 0.00% 0.00% 0.00% 33.35%
Total Current Assets 100.00% 100.00% 100.00% 54.27%
Long-term Assets 0.00% 0.00% 0.00% 45.73%
Total Assets 100.00% 100.00% 100.00% 100.00%
Current Liabilities 33.83% 15.44% 9.10% 24.73%
Long-term Liabilities 0.00% 0.00% 0.00% 27.23%
Total Liabilities 33.83% 15.44% 9.10% 51.96%
Net Worth 66.17% 84.56% 90.90% 48.04%
Percent of Sales
Sales 100.00% 100.00% 100.00% 100.00%
Gross Margin 80.67% 80.44% 80.66% 24.26%
Selling, General & Administrative Expenses 78.24% 62.69% 55.61% 12.12%
Advertising Expenses 1.38% 1.04% 0.80% 0.98%
Profit Before Interest and Taxes 3.46% 25.37% 35.78% 1.92%
Main Ratios
Current 2.96 6.48 10.99 1.37
Quick 2.63 6.01 10.49 0.74
Total Debt to Total Assets 33.83% 15.44% 9.10% 59.26%
Pre-tax Return on Net Worth 24.99% 92.95% 77.58% 4.93%
Pre-tax Return on Assets 16.54% 78.60% 70.52% 12.10%
Additional Ratios Year 1 Year 2 Year 3
Net Profit Margin 2.42% 17.76% 25.05% n.a
Return on Equity 17.49% 65.07% 54.30% n.a
Activity Ratios
Inventory Turnover 10.74 9.97 9.41 n.a
Accounts Payable Turnover 9.84 12.17 12.17 n.a
Payment Days 27 30 28 n.a
Total Asset Turnover 4.77 3.10 1.97 n.a
Debt Ratios
Debt to Net Worth 0.51 0.18 0.10 n.a
Current Liab. to Liab. 1.00 1.00 1.00 n.a
Liquidity Ratios
Net Working Capital $23,029 $65,918 $144,253 n.a
Interest Coverage 0.00 0.00 0.00 n.a
Additional Ratios
Assets to Sales 0.21 0.32 0.51 n.a
Current Debt/Total Assets 34% 15% 9% n.a
Acid Test 2.63 6.01 10.49 n.a
Sales/Net Worth 7.21 3.66 2.17 n.a
Dividend Payout 0.00 0.00 0.00 n.a
Read more: http://www.bplans.com/dessert_bakery_business_plan/financial_plan_fc.php#ixzz2u3yoxoNR
Appendix
Sales ForecastMonth
1Month
2Month
3Month
4Month
5Month
6Month
7Month
8Month
9Month
10Month
11 Month 12
Sales
Dessert Sales 0% $12,000 $12,000 $12,000 $12,000 $12,000 $12,000 $16,000 $8,000 $12,000 $8,000 $12,000 $16,000
POP Sales 0% $200 $200 $200 $100 $100 $100 $300 $50 $500 $100 $300 $500
Carry Out 0% $300 $300 $300 $300 $300 $500 $1,000 $200 $700 $200 $500 $500
Weekly Lessons 0% $1,800 $1,800 $1,800 $900 $900 $900 $1,800 $900 $900 $900 $900 $900
Total Sales $14,300 $14,300 $14,300 $13,300 $13,300 $13,500 $19,100 $9,150 $14,100 $9,200 $13,700 $17,900
Direct Cost of SalesMonth
1Month
2Month
3Month
4Month
5Month
6Month
7Month
8Month
9Month
10Month
11 Month 12
Dessert Sales $2,400 $2,400 $2,400 $2,400 $2,400 $2,400 $3,200 $1,600 $2,400 $1,600 $2,400 $3,200
POP Sales $30 $30 $30 $15 $15 $15 $45 $8 $75 $15 $45 $75
Carry Out $45 $45 $45 $45 $45 $75 $150 $30 $105 $30 $75 $75
Weekly Lessons $270 $270 $270 $135 $135 $135 $270 $135 $135 $135 $135 $135
Subtotal Direct Cost of Sales $2,745 $2,745 $2,745 $2,595 $2,595 $2,625 $3,665 $1,773 $2,715 $1,780 $2,655 $3,485
Need real financials?We recommend using LivePlan as the easiest way to create automatic financials for your own business plan.Create your own business plan »
Personnel PlanMonth
1Month
2Month
3Month
4Month
5Month
6Month
7Month
8Month
9Month
10Month
11 Month 12
Chef/Proprietor 0% $2,400 $2,400 $2,400 $2,400 $2,400 $2,400 $2,400 $2,400 $2,400 $2,400 $2,400 $2,400
Baker 0% $0 $0 $0 $0 $0 $560 $560 $560 $560 $560 $560 $560
Host 0% $483 $0 $0 $0 $483 $483 $483 $483 $483 $483 $483 $483
Dessert Bar Assistants 0% $600 $600 $600 $600 $600 $600 $600 $600 $600 $600 $600 $600
Dishwasher/Busser 0% $483 $483 $483 $483 $483 $483 $483 $483 $483 $483 $483 $483
Total People 4 4 4 4 4 5 5 5 5 7 7 7
Total Payroll $3,966 $3,483 $3,483 $3,483 $3,966 $4,526 $4,526 $4,526 $4,526 $4,526 $4,526 $4,526
General AssumptionsMonth
1Month
2Month
3Month
4Month
5Month
6Month
7Month
8Month
9Month
10Month
11 Month 12
Plan Month 1 2 3 4 5 6 7 8 9 10 11 12
Current Interest Rate 10.00% 10.00% 10.00% 10.00% 10.00% 10.00% 10.00% 10.00% 10.00% 10.00% 10.00% 10.00%
Long-term Interest Rate 10.00% 10.00% 10.00% 10.00% 10.00% 10.00% 10.00% 10.00% 10.00% 10.00% 10.00% 10.00%
Tax Rate 30.00% 30.00% 30.00% 30.00% 30.00% 30.00% 30.00% 30.00% 30.00% 30.00% 30.00% 30.00%
Other 0 0 0 0 0 0 0 0 0 0 0 0
Pro Forma Profit and LossMonth
1Month
2Month
3Month
4Month
5Month
6 Month 7 Month 8 Month 9Month
10Month
11 Month 12
Sales $14,300 $14,300 $14,300 $13,300 $13,300 $13,500 $19,100 $9,150 $14,100 $9,200 $13,700 $17,900
Direct Cost of Sales $2,745 $2,745 $2,745 $2,595 $2,595 $2,625 $3,665 $1,773 $2,715 $1,780 $2,655 $3,485
Other Production Expenses $0 $0 $0 $0 $0 $0 $0 $0 $0 $0 $0 $0
Total Cost of Sales $2,745 $2,745 $2,745 $2,595 $2,595 $2,625 $3,665 $1,773 $2,715 $1,780 $2,655 $3,485
Gross Margin $11,555 $11,555 $11,555 $10,705 $10,705 $10,875 $15,435 $7,378 $11,385 $7,420 $11,045 $14,415
Gross Margin % 80.80% 80.80% 80.80% 80.49% 80.49% 80.56% 80.81% 80.63% 80.74% 80.65% 80.62% 80.53%
Expenses
Payroll $3,966 $3,483 $3,483 $3,483 $3,966 $4,526 $4,526 $4,526 $4,526 $4,526 $4,526 $4,526
Sales and Marketing and Other Expenses $1,000 $0 $0 $0 $0 $300 $500 $0 $0 $0 $0 $500
Depreciation $0 $0 $0 $0 $0 $0 $0 $0 $0 $0 $0 $0
Leased Equipment $0 $0 $0 $0 $0 $0 $0 $0 $0 $0 $0 $0
Utilities $500 $500 $500 $500 $500 $500 $500 $500 $500 $500 $500 $500
Insurance $200 $200 $200 $200 $200 $200 $200 $200 $200 $200 $200 $200
Rent $5,000 $5,000 $5,000 $5,000 $5,000 $5,000 $5,000 $5,000 $5,000 $5,000 $5,000 $5,000
Payroll Taxes 15% $595 $522 $522 $522 $595 $679 $679 $679 $679 $679 $679 $679
Other $0 $0 $0 $0 $0 $0 $0 $0 $0 $0 $0 $0
Total Operating Expenses $11,261 $9,705 $9,705 $9,705 $10,261 $11,205 $11,405 $10,905 $10,905 $10,905 $10,905 $11,405
Profit Before Interest and Taxes $294 $1,850 $1,850 $1,000 $444 ($330) $4,030 ($3,527) $480 ($3,485) $140 $3,010
EBITDA $294 $1,850 $1,850 $1,000 $444 ($330) $4,030 ($3,527) $480 ($3,485) $140 $3,010
Interest Expense $0 $0 $0 $0 $0 $0 $0 $0 $0 $0 $0 $0
Taxes Incurred $88 $555 $555 $300 $133 ($99) $1,209 ($1,058) $144 ($1,045) $42 $903
Net Profit $206 $1,295 $1,295 $700 $311 ($231) $2,821 ($2,469) $336 ($2,439) $98 $2,107
Net Profit/Sales 1.44% 9.05% 9.05% 5.26% 2.34% -1.71% 14.77% -26.99% 2.38% -26.52% 0.72% 11.77%
Pro Forma Cash FlowMonth
1Month
2Month
3Month
4Month
5Month
6Month
7Month
8Month
9Month
10Month
11 Month 12
Cash Received
Cash from Operations
Cash Sales $14,300 $14,300 $14,300 $13,300 $13,300 $13,500 $19,100 $9,150 $14,100 $9,200 $13,700 $17,900
Subtotal Cash from $14,300 $14,300 $14,300 $13,300 $13,300 $13,500 $19,100 $9,150 $14,100 $9,200 $13,700 $17,900
Operations
Additional Cash Received
Sales Tax, VAT, HST/GST Received 0.00% $0 $0 $0 $0 $0 $0 $0 $0 $0 $0 $0 $0
New Current Borrowing $0 $0 $0 $0 $0 $0 $0 $0 $0 $0 $0 $0
New Other Liabilities (interest-free) $0 $0 $0 $0 $0 $0 $0 $0 $0 $0 $0 $0
New Long-term Liabilities $0 $0 $0 $0 $0 $0 $0 $0 $0 $0 $0 $0
Sales of Other Current Assets $0 $0 $0 $0 $0 $0 $0 $0 $0 $0 $0 $0
Sales of Long-term Assets $0 $0 $0 $0 $0 $0 $0 $0 $0 $0 $0 $0
New Investment Received $0 $0 $0 $0 $0 $0 $0 $0 $0 $0 $0 $0
Subtotal Cash Received $14,300 $14,300 $14,300 $13,300 $13,300 $13,500 $19,100 $9,150 $14,100 $9,200 $13,700 $17,900
ExpendituresMonth
1Month
2Month
3Month
4Month
5Month
6Month
7Month
8Month
9Month
10Month
11 Month 12
Expenditures from Operations
Cash Spending $3,966 $3,483 $3,483 $3,483 $3,966 $4,526 $4,526 $4,526 $4,526 $4,526 $4,526 $4,526
Bill Payments $438 $13,027 $9,522 $9,503 $8,955 $9,030 $9,360 $12,644 $5,476 $9,844 $6,449 $9,870
Subtotal Spent on Operations $4,404 $16,510 $13,005 $12,986 $12,921 $13,556 $13,886 $17,170 $10,002 $14,370 $10,975 $14,396
Additional Cash Spent
Sales Tax, VAT, HST/GST Paid Out $0 $0 $0 $0 $0 $0 $0 $0 $0 $0 $0 $0
Principal Repayment of Current Borrowing $0 $0 $0 $0 $0 $0 $0 $0 $0 $0 $0 $0
Other Liabilities Principal Repayment $0 $0 $0 $0 $0 $0 $0 $0 $0 $0 $0 $0
Long-term Liabilities Principal Repayment $0 $0 $0 $0 $0 $0 $0 $0 $0 $0 $0 $0
Purchase Other Current Assets $0 $0 $0 $0 $0 $0 $0 $0 $0 $0 $0 $0
Purchase Long-term Assets $0 $0 $0 $0 $0 $0 $0 $0 $0 $0 $0 $0
Dividends $0 $0 $0 $0 $0 $0 $0 $0 $0 $0 $0 $0
Subtotal Cash Spent $4,404 $16,510 $13,005 $12,986 $12,921 $13,556 $13,886 $17,170 $10,002 $14,370 $10,975 $14,396
Net Cash Flow $9,896 ($2,210) $1,295 $314 $379 ($56) $5,214 ($8,020) $4,098 ($5,170) $2,725 $3,504
Cash Balance $28,896 $26,686 $27,981 $28,294 $28,674 $28,617 $33,831 $25,811 $29,910 $24,739 $27,465 $30,969
Need real financials?We recommend using LivePlan as the easiest way to create automatic financials for your own business plan.Create your own business plan »
Pro Forma Balance SheetMonth 1 Month 2 Month 3 Month 4 Month 5 Month 6 Month 7 Month 8 Month 9 Month 10 Month 11 Month 12
AssetsStarting Balances
Current Assets
Cash $19,000 $28,896 $26,686 $27,981 $28,294 $28,674 $28,617 $33,831 $25,811 $29,910 $24,739 $27,465 $30,969
Inventory $0 $3,020 $3,020 $3,020 $2,855 $2,855 $2,888 $4,032 $2,259 $2,987 $2,207 $2,921 $3,834
Other Current Assets $0 $0 $0 $0 $0 $0 $0 $0 $0 $0 $0 $0 $0
Total Current Assets $19,000 $31,915 $29,705 $31,000 $31,149 $31,528 $31,505 $37,863 $28,070 $32,896 $26,946 $30,385 $34,802
Long-term Assets
Long-term Assets $0 $0 $0 $0 $0 $0 $0 $0 $0 $0 $0 $0 $0
Accumulated Depreciation $0 $0 $0 $0 $0 $0 $0 $0 $0 $0 $0 $0 $0
Total Long-term Assets $0 $0 $0 $0 $0 $0 $0 $0 $0 $0 $0 $0 $0
Total Assets $19,000 $31,915 $29,705 $31,000 $31,149 $31,528 $31,505 $37,863 $28,070 $32,896 $26,946 $30,385 $34,802
Liabilities and Capital Month 1 Month 2 Month 3 Month 4 Month 5 Month 6 Month 7 Month 8 Month 9 Month 10 Month 11 Month 12
Current Liabilities
Accounts Payable $0 $12,709 $9,205 $9,205 $8,654 $8,722 $8,930 $12,467 $5,143 $9,633 $6,122 $9,464 $11,774
Current Borrowing $0 $0 $0 $0 $0 $0 $0 $0 $0 $0 $0 $0 $0
Other Current Liabilities $0 $0 $0 $0 $0 $0 $0 $0 $0 $0 $0 $0 $0
Subtotal Current Liabilities $0 $12,709 $9,205 $9,205 $8,654 $8,722 $8,930 $12,467 $5,143 $9,633 $6,122 $9,464 $11,774
Long-term Liabilities $0 $0 $0 $0 $0 $0 $0 $0 $0 $0 $0 $0 $0
Total Liabilities $0 $12,709 $9,205 $9,205 $8,654 $8,722 $8,930 $12,467 $5,143 $9,633 $6,122 $9,464 $11,774
Paid-in Capital $300,000 $300,000 $300,000 $300,000 $300,000 $300,000 $300,000 $300,000 $300,000 $300,000 $300,000 $300,000 $300,000
Retained Earnings ($281,000) ($281,000) ($281,000) ($281,000) ($281,000) ($281,000) ($281,000) ($281,000) ($281,000) ($281,000) ($281,000) ($281,000) ($281,000)
Earnings $0 $206 $1,501 $2,795 $3,495 $3,806 $3,575 $6,396 $3,927 $4,263 $1,823 $1,921 $4,029
Total Capital $19,000 $19,206 $20,501 $21,795 $22,495 $22,806 $22,575 $25,396 $22,927 $23,263 $20,823 $20,921 $23,029
Total Liabilities and Capital $19,000 $31,915 $29,705 $31,000 $31,149 $31,528 $31,505 $37,863 $28,070 $32,896 $26,946 $30,385 $34,802
Net Worth $19,000 $19,206 $20,501 $21,795 $22,495 $22,806 $22,575 $25,396 $22,927 $23,263 $20,823 $20,921 $23,029
Read more: http://www.bplans.com/dessert_bakery_business_plan/appendix_fc.php#ixzz2u3z8Wz8X