Embed Size (px)
Citation preview

DESIGNING TURBINE ENDWALLS DESIGNING TURBINE ENDWALLS FOR DEPOSITION RESISTANCE WITH 1400C COMBUSTOR EXIT TEMPERATURES AND SYNGAS
WATER VAPOR LEVELS Ch i S ith B tt B k P h th Sh kChris Smith, Brett Barker, Prashanth Shankaran
Josh Webb, Brian CasadayDr. Ali Ameri, Dr. Jeffrey Bons
“THE” OHIO STATE UNIVERSITYTHE OHIO STATE UNIVERSITY
Robert Laycock, Dr. Thomas Fletcher“THE” BRIGHAM YOUNG UNIVERSITY“THE” BRIGHAM YOUNG UNIVERSITY
(3‐year grant awarded Oct 2009) 1

MOTIVATION/NEED• Operational Issues
-Fuel flexibility (range of feedstock heat release)y ( g )-Diluent use (e.g. steam)-Filtration requirements
• Technical Challenges- Higher firing temperature
I d h t t f ( t dil t)- Increased heat transfer (steam diluent)- Potential for increased levels of airborne contaminants- Deposition rate increases with temperaturep p- Advanced cooling, greater reliance
2

OBJECTIVESThe objectives of this work are to study turbine deposition at elevated gas temperatures and water vapor levels g p pAND explore modifications to turbine endwall geometries that reduce the potential for degradation due to depositionreduce the potential for degradation due to deposition.
The effort includes both experimental and computational t ith k di id d i t th hcomponents, with work divided into three phases.
1) Modeling and Experimental Validation) g p2) CFD and Experimental Endwall Design Study3) CFD Design Study with Cooling & Experiments with
Steam
3
Steam

RESEARCH TEAMDr. Jeffrey BonsProfessorDepartment of Aerospace Engineering
TEAM LEADFocus: Experimental Heat Transfer and Deposition
Ohio State UniversityColumbus, OH
pMeasurements in OSU Turbine Reacting Flow Rig
Dr. Ali AmeriResearch ScientistDepartment of Aerospace EngineeringOhio State University
Co‐PIFocus: Deposition Model Development and Heat
Dr Thomas Fletcher
Ohio State UniversityColumbus, OHTransfer CFD
Co PI Dr. Thomas FletcherProfessorDepartment of Chemical EngineeringBrigham Young University
Co‐PIFocus: Experimental Work in BYU’s Turbine Accelerated Deposition Facility with
4
Provo, UTElevated Temperatures (1400C) and Steam Injection

RESEARCH FOCUSResearch at OSU will explore turbine flow passage and/or cooling designs that either: i) have performance less sensitive to surfacei) have performance less sensitive to surface degradation due to deposition, erosion, and corrosion, or ii) alleviate flow path deposition, erosion, and
Gas Turbine Deposition Accelerated by Steam Diluent Injection used for NOx Control
corrosion.
D i i d l d l d OSU ill bDeposition models developed at OSU will be validated with experimental data from OSUand BYU deposition facilities and incorporated into commercially available CFD.into commercially available CFD.
Research at BYU will explore the sensitivity of deposition to: i) G t t th 900 1400C
5
Failed turbine rotor platform with elevated deposition
i) Gas temperatures over the range 900-1400Cii) Water vapor concentrations up to 25%

BYU Results/Progress
6

OSU’s Turbine Reacting Flow Rig (TuRFR)• Natural gas burning
combustor rig
• Combustor exit flow accelerated in cone nozzle
View Section
Vane Holder
• Transition from circular to annular sector
• Real vane hardware (CFM56) installed in annular
d t
Viewports
Transition Piece
cascade sector
• Tt4 up to 1120°C (2050°F)
• Inlet Mach number ~ 0.1
• 300,000 < Recex < 1,000,000
Sealing System
• Adjustable inlet temperature profiles
• Adjustable inlet turbulence profiles (through dilution jets)
Equilibration Tube
Conejets)
• Film cooling from vane casing and hub (density ratio 1.6‐2.0)
• Ash particulate feed in Spool PieceAsh particulate feed in combustion chamber (10 m MMD)
7
Steel Base

OSU’s Turbine Reacting Flow Facility (TuRFR)
Vane Holder and Upstream Conditioning
Film Cooling SupplyTop
Section/ Vane
container
Rectangular t A l
Dilution Jet Supply
Circular to Rectangular T iti
to Annular Transition
Interchangeable
8
TransitionInterchangeable Dilution Plates for Pattern Factors

OSU - TuRFRVane Specific Hardware
Film Cooling Inlet
Common
Dilution Jet Inlet
Co oHardware
Camera Image
9

Typical TuRFR Test Profile2500
1500
2000
2500
rees F]
culate
500
1000
Tt4 [degr
Ash Partic
InjectionBefore
0
0 1 2 3 4
Time [hr]
A I
“ ’d h dAfter
“I’d hoped never to see anything like that again!”
10‐ Polk Plant Operator

Post Test DiagnosticsDeposit MicroscopySurface Metrology Deposit Microscopy
Pre Test Scan
Surface Metrology
• Scanning Electron Mi l
Deposit height indicated in contour map relative to Pre‐
Test Datum Microscopy reveals deposit structure.• Xray Diffraction Spectroscopy reveals d it h i t
Post Test Scan
Test Datum
deposit chemistry.• Courtesy of Dr. Padture’s student, Andrew Gledhill
11

TuRFR ResultsOBSERVATIONS of DEPOSITION MECHANICS
• Suction surface deposit free• Deposit builds from mid-chord on pressure surface f d t l di dforward to leading edge.• Final deposit thickness decreases with chordwisedistance on pressure surfacedistance on pressure surface• Film cooling holes are sites for deposition initiation (whether or not they are blowing)( y g)• Large deposits are sloughed off the surface during and after testing (e.g. during cooldown)
12

TuRFR ResultsTypical Test Run
13

Test on 10/1/10Wyoming (Jim Bridger Power Station)
S b Bit i A h (f BYU)Sub-Bituminous Ash (from BYU)Test Conditions: ~1900 F; M=0.09; No Cooling
t=0 sec

t= +30 sec

Distributed Buildup
Cooling Hole Deposits
t= +1 min

t= +2 min

t= +3 min

t=+4 min

t= +5 min

t=+6 min

t=+7 min

t=+8 min

t=+9 min

t=+10 min

Narrowing of Passageof Passage Throat
t=+11 min

Test on 10/1/10Wyoming (Jim Bridger Power Station)Wyoming (Jim Bridger Power Station)
Sub-Bituminous Ash (from BYU)Test Conditions: ~1900 F; M=0.09;
No Film Cooling
Final Deposit Image
OBSERVATIONS•Deposit builds from mid-chord on pressure•Deposit builds from mid-chord on pressure surface forward to leading edge.•Film cooling holes are sites for deposition initiation (whether or not they are blowing)• Narrowing of passage throat

Pretest ImagegBituminous Coal AshM = 0.09, T = 1900F, Film Cooling 12%

Time: 30min 0sec

Time: 30min 10sec

Time: 30min 20sec

Time: 30min 30sec

Time: 30min 40sec

Time: 30min 50sec

Time: 31min 0sec

Time: 31min 10sec

Time: 31min 20sec

Time: 31min 30sec

Time: 31min 40sec

Time: 31min 50sec

Time: 32min 0sec

Time: 32min 5sec

Final Deposit Imagep gOBSERVATIONS•Film cooling holes are sites for deposition initiation even when they aredeposition initiation even when they are blowing• Deposits accumulate on casing endwallendwall
Bituminous: T =2000FBituminous: Ttin=2000F, 12% film cooling
ff
Lignite: T =1900F
Different ash have higher threshold temperatures for deposition with film cooling
Lignite: Ttin=1900F, 8% film cooling

CasingBlade 4
Blade 3
Hub
Clean Blades Test on 4/15/10
Bituminous Coal AshBituminous Coal AshTest Conditions:
2000 F; M=0.085; No Film CoolingRe(inlet)=30950 Re(exit)=180700
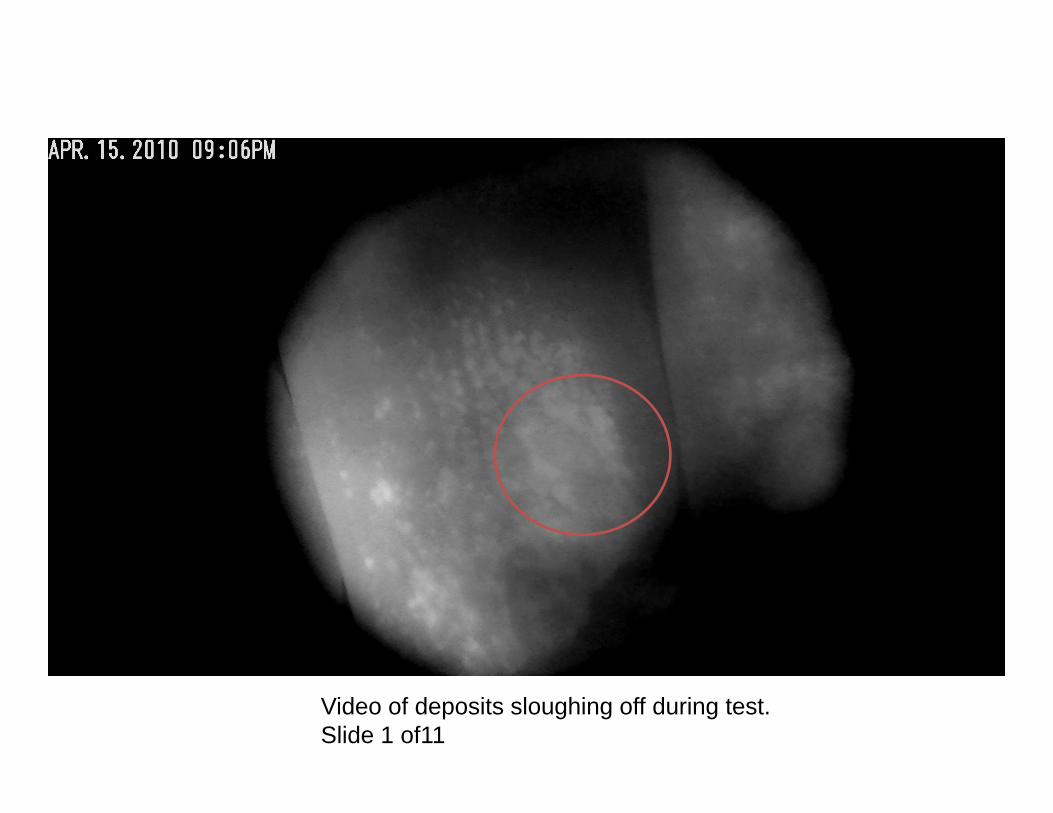
Video of deposits sloughing off during test.Slide 1 of11

Slide 2 of 11

Slide 3 of 11

Slide 4 of11

Slide 5 of11

Slide 6 of11

Slide 7 of11

Slide 8 of11

Slide 9 of11

Slide 10 of11

Slide 11 of11

TuRFR ResultsSloughing During Cool-Down
56

Results with Different AshT t S i ith 4 Diff t A h Bit i 2 S bbit i Li it•Test Series with 4 Different Ash: Bituminous, 2 Subbituminous, Lignite
• Nominally Constant Operating Conditions: -Min=0.09-TTin=1900-2050°F
Red Line Represents MMD for Bituminous Coal Ash and BYU Ash (14.1 μm)
Tin-100ppmw for 30-50 min- No film cooling- 2 to 20% capture efficiency
Blue Line Represents MMD for Lignite and PRB (15‐20 μm)
60
Ash Composition by % weight (5‐10% relative error)
Lignite
40
50
ight
Bituminous
PRB
BYU Ash
10
20
30
% W
e
57
0
SiO2 CaO Al2O3 Fe2O3 MgO TiO2 SO3 (*Dr. Padture’s Materials Lab)
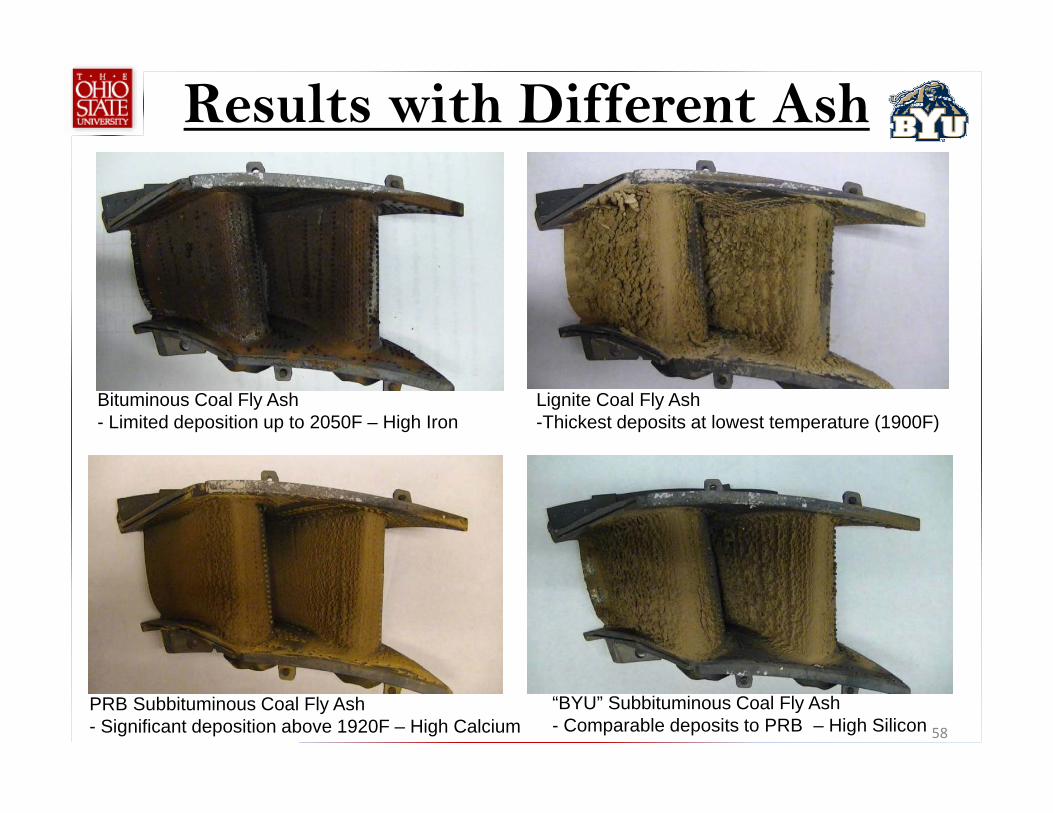
Results with Different Ash
Bituminous Coal Fly Ash- Limited deposition up to 2050F – High Iron
Lignite Coal Fly Ash-Thickest deposits at lowest temperature (1900F)
58
PRB Subbituminous Coal Fly Ash- Significant deposition above 1920F – High Calcium
“BYU” Subbituminous Coal Fly Ash- Comparable deposits to PRB – High Silicon

Results with Different AshLignite
Leading edge stagnation line well defined
Large structures near trailing edge. Smooth deposits last 20%.
Evidence of secondary
Jagged structures develop inupstream direction on pressure
Subbituminous
secondary flows on
casing (and hub) endwall.
upstream direction on pressure surface. Terminate toward
suction surface.
59

Results with Different Ash
Optical Surface Metrology
0.018
Thickness at Leading Edge0.018
Thickness at 37% Chord0.018
Thickness at 53% Chord
0.01
0.012
0.014
0.016
0.018
s/pp
mw
PRB
Lignite
BYU
0.01
0.012
0.014
0.016
0.018
s/pp
mw
0.01
0.012
0.014
0.016
0.018
s/pp
mw
0.002
0.004
0.006
0.008
Thickn
ess
0.002
0.004
0.006
0.008
Thickn
ess
0.002
0.004
0.006
0.008
Thickn
ess
60
0
0 20 40 60 80 100
% Span
0
0 20 40 60 80 100
% Span
0
0 20 40 60 80 100
% Span
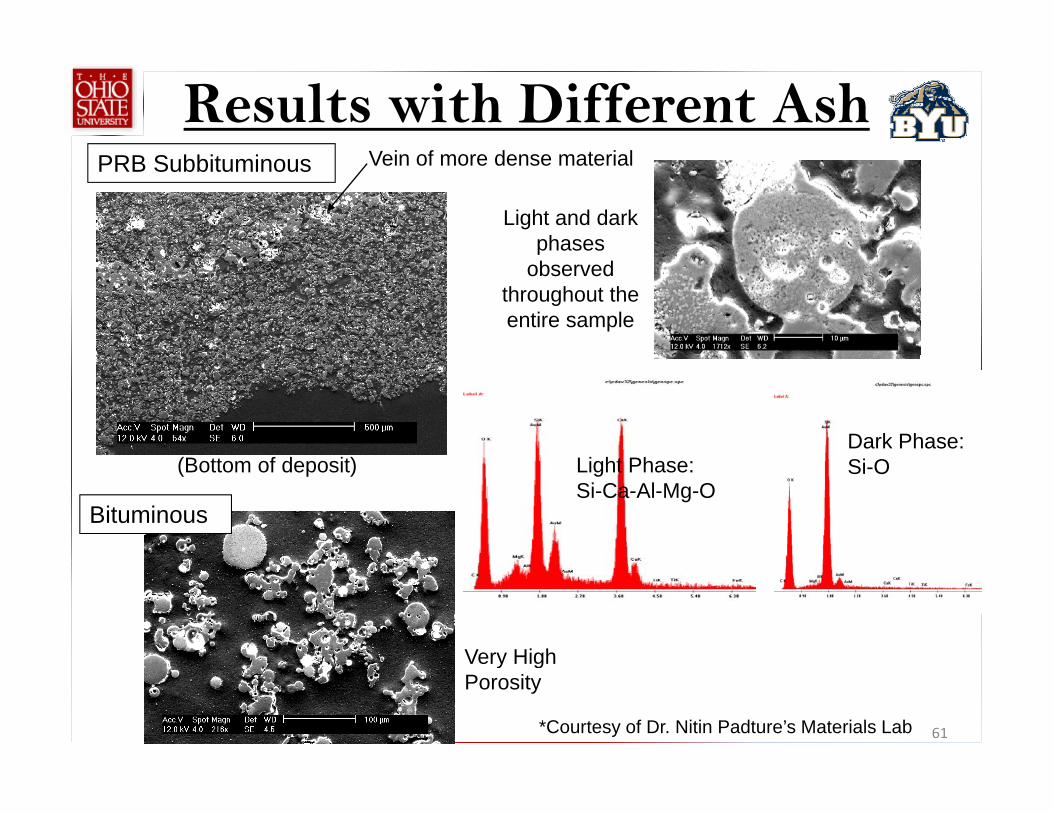
Results with Different AshV i f d i lVein of more dense material
Light and dark phases
PRB Subbituminous
pobserved
throughout the entire sample
(B tt f d it) Li ht PhDark Phase:
(Bottom of deposit) Light Phase: Si-Ca-Al-Mg-O
Si-O
Bituminous
Very High
61*Courtesy of Dr. Nitin Padture’s Materials Lab
Very High Porosity

3rd YEAR EFFORT• Continue to assess deposition dependency on…
- Ash type (add petcoke blend from Polk)Gas temperature- Gas temperature
- Cooling level- Massflow (Reynolds number)
• Assess effect of deposition on…- Aerodynamic lossesy- Narrowing of passage throat
• Pursue possibility of 2nd set of hardware integrated in• Pursue possibility of 2nd set of hardware integrated in TuRFR for Year 3
W k l l ith d iti d l d l t f62
• Work closely with deposition model development for validation.

OSU CFD Results/Progress
63

Program ScheduleNGV hardware from industry
OSU TuRFR construction
YEAR 1 YEAR 2 YEAR 3
Deposition model
Flow model
Model validation with BYU TADF
Redesign BYU TADF for high Temp
Test 2 NGV designs in OSU TuRFR
Explore endwall redesign using CFDCFD
Explore deposition sensitivity to gas temperature with BYU TADF facility
CFD for nozzle cooling redesign
Nozzle/cooling redesign in OSU TuRFR
Water vapor content in BYU TADF
V lid t CFD d l ith
XXXXXXXX
64
Validate CFD models with experimental results

QUESTIONS?