Embed Size (px)
Citation preview

10/19/2017
1
Design of Unpaved RoadsDesign of Unpaved RoadsDesign of Unpaved RoadsDesign of Unpaved Roads
A Geotechnical PerspectiveA Geotechnical PerspectiveA Geotechnical PerspectiveA Geotechnical Perspective
� CGTR 2017CGTR 2017CGTR 2017CGTR 2017
� NERISTNERISTNERISTNERIST
Arindam DeyAssistant ProfessorDepartment of Civil Engineering
Geotechnical Engineering DivisionIIT Guwahati
Introduction
• Road Network in India
� Over 42 lakh kms (CIA, 2012)
� 48% Unpaved Roads (MoRTH, 2008)
• Unpaved roads (Includes haul roads and access roads)
� Sand or stone aggregate placed directly over the local soil subgrade
� No permanent surfacing before immediate application
• Constant passage of traffic over time
� Settlement
� Rutting
2
10/19/2017
2
Layout of the Presentation
• Unpaved Roads
� Quasi-Static Analysis and Formulations : Design Charts
� Influence of Traffic
� Numerical FE Modeling: PLAXIS 2D v2012 : Safe Designing Methodology
3
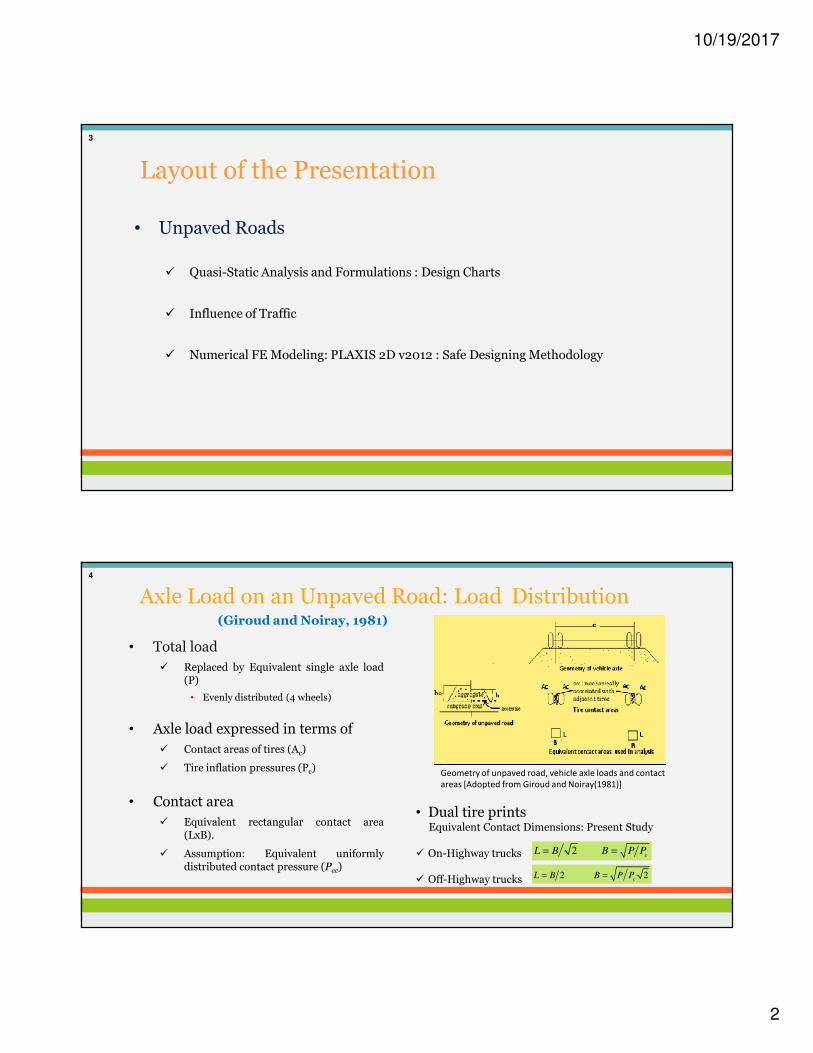
Axle Load on an Unpaved Road: Load Distribution
• Total load
� Replaced by Equivalent single axle load(P)
• Evenly distributed (4 wheels)
• Axle load expressed in terms of
� Contact areas of tires (Ac)
� Tire inflation pressures (Pc)
• Contact area
� Equivalent rectangular contact area(LxB).
� Assumption: Equivalent uniformlydistributed contact pressure (Pec)
• Dual tire printsEquivalent Contact Dimensions: Present Study
� On-Highway trucks
� Off-Highway trucks
2c
L B B P P= =
2 2c
L B B P P= =
Geometry of unpaved road, vehicle axle loads and contact
areas [Adopted from Giroud and Noiray(1981)]
4
(Giroud and Noiray, 1981)

10/19/2017
3
Load Distribution by Aggregate Layer on Subgrade
• Load-Distribution Shape
� Pyramidal
� Load-dispersion angle (α0)
• Stresses generated on the aggregate-subgrade interface
� With geotextile �p , Without geotextile � p0
• Aggregate thickness
� With geotextile � h, Without geotextile � h0
0 4 2aggα α π φ= = −
( )( )
( )( )
0 0
0 0 0 02 2 tan 2 tan
2 2 tan 2 tan
Pp h
B h L h
Pp h
B h L h
γα α
γα α
= ++ +
= ++ +
Load distribution by aggregate layer on the subgrade soil (a) Without
geotextile (b) With geotextile [Giroud and Noiray(1981)]
5
( )0
2
u
u
p c
p c
π
π
=
= +
Idea from Past Research
• Proposed design charts
� Uses only undrained cohesion
• c-φ soil: Strength Parameters
� Cohesion
� Angle of internal friction
• Conventional Design Charts
� Over estimation of aggregate layer thickness
� Only a degenerated condition
• Improvisation over the Giroud & Noiray’s Model (1981)
� Accounts internal friction angle of soil subgrade
� Reveals substantial reduction in aggregate thickness (Compared after inclusion of φ)
� Accounts moving load as static
• Maximum axle load
• “Quasi-Static Analysis”
� Detailed parametric study
• Influence & Sensitivity of various contributory parameters.
� Design Charts (with & without Geotextiles) for several combination of various parameters
Present Study6

10/19/2017
4
Quasi-static Analysis of Unpaved Roads
• Unpaved roads: Aggregate cover
� Acts as load-dispersing mechanism � Reduce subgrade stresses
� Minimizes hindrance for passage of vehicles
• Shear strength of the soil (Mohr-Coulomb expression)
• Allowable bearing capacity (qall) (Terzaghi, 1943)
� Bearing capacity factors
tancτ σ φ= +
00.5 '
c q
all
cN h N B Nq
FOS
γγ γ+ +=
32( )
4 2 2cos( )4 2
2( 1) tan
( 1)cot
q
q
c q
N e
N N
N N
π φ
γ
π φ
φ
φ
−
= +
= +
= −
7
Design of Unpaved Road without Geotextile
• Net pressure on the subgrade soil
• Net Pressure ≤ Allowable Bearing Capacity (FOS=1)
• Solution � Required thickness of aggregate layer on c-φ subgrade without geotextile
Load distribution by aggregate layer on the
subgrade soil without geotextile [Giroud and
Noiray(1981)]
( )( )0 0
0 0 0 02 2 tan 2 tan
Pp h
B h L hγ
α α= +
+ +
0 0 0 0
0 0 0 0
0.5 ( 2 tan )2( 2 tan )( 2 tan )
c q
Ph cN h N B h N
B h L hγγ γ γ α
α α+ = + + +
+ +
8

10/19/2017
5
Design of Unpaved Road with Geotextile
• Subgrade soil
� Undrained and Incompressible
• Geotextile
� Stretched wavy shape due to settlement under tires and heave in between them
• Generation of tension membrane effect
� Reduction of pressure by geotextile : pg
• Pressure transferred to subgrade soil, p*(portion AB)
*
gp p p= −
Kinematics of unpaved roads with geotextile [Giroud and Noiray(1981)]
9
Design of Unpaved Road with Geotextile
• Pressure (p*) ≤ Allowable bearing capacity of the subgrade soil
K� Tension-elongation modulus
ε� Elongation of Geotextile
s� Function of rut depth(r)
FOS =1
• Solution � Required thickness of aggregate layer on c-φ subgrade with single layer of geotextile
* 0.5 ( 2 tan )2( 2 tan )( 2 tan )
g c q
Pp h p cN hN B h N
B h L hγγ γ γ α
α α= + − = + + +
+ +
( )2
1 2 tan 22
g
ap K a a B h
sε α
= + = +
'1
'
b b
a aε
+= −
+
Shape of deformed geotextile [Giroud and Noiray (1981)]
10

10/19/2017
6
Parameters…
• MATLAB codes
� Compute required aggregate thickness (with and without geotextile layer)
• Sensitivity plotted
� For various important parameters
Range of various parameters chosen (Indian traffic conditions)
Axle Load (P) 30 kN–360 kN (MoRTH, GoI, 2005; IRC-37-2001)
Tire inflation pressure (Pc) 150 kPa–750 kPa (AFJM, 1994; Khanna and Justo,
2001)
Angle of internal friction of
aggregate (φagg)
25°– 35°
Angle of internal friction of soil
(φ)
0-50°[Covers the broad domain of soil- purely
cohesive soil to rocky subgrade]
Soil cohesion (c): 0–500 kPa [Covers purely cohesionless soil to hard
clay in the subgrade]
Unit weight of soil and
aggregate (γ):
19 kN/m3 [Kept same- No significant variation in γ ]
Track widths of Indian Cargo
vehicles (e)
1.7 – 2.6 m
Tension-elongation modulus of
geotextiles (K)
1-5000 kN/m (Giroud and Noiray, 1981)
Factor of safety (FOS): 1 – 2 [FOS =1 (ultimate bearing capacity) other FoS
(allowable bearing strength)]
11
Design Charts: Effect of Cohesion of subgrade soil
• Soft soil: Very low c and φ values
� Immensely thick aggregate layer
• Optimum cohesion of 30 kPa to substantially reduce
the aggregate layer thickness
� Adopt some subgrade modification techniques for
soils with natural cohesion less than 30 kPa
• Application of geotextiles can be a solution
• Stiffer clays
� Theoretically no necessity of aggregate layer
• With Geotextile
• Without Geotextile12

10/19/2017
7
Design Charts: Effect of Angle of Internal Friction of subgrade soil
• Subgrade containing coarser soil particles
� Enhanced angle of internal friction
• Increase in bearing strength � Substantialreduction in the required aggregate thickness
• Analysis by Giroud and Noiray (1981)
� Based on purely cohesive soils
• Results in overestimated results for naturalsubgrade soils having cohesionless particles aswell
• With Geotextile
• Without Geotextile13
Design Charts: Effect of Axle Load and Tire Pressure
• Increment in Axle Load
� Required aggregate thickness is higher
• Obvious observation
• Increment in tire inflation pressure
� Does not significantly affect the requiredaggregate thickness for lower axle loads
• Lower tire inflation pressure �Higher equivalent contact area
• With Geotextile • With Geotextile
c=5 kPa, aggϕ = 35°, soilϕ = 5°, K=100 kN/m, r=0.3 m, e=1.7 m c=5 kPa, aggϕ = 35°, soil
ϕ = 5°, K=100 kN/m, r=0.3 m, e=1.7 m
14

10/19/2017
8
Benefit from Geotextile: Tensile Strength• Depicts benefit of geotextiles :
� Enhanced tensile strength of geotextile
• Reduction in required aggregate thickness
� Zero tensile strength
• Absence of geotextile
• Efficacy of geotextiles
� Degree of improvement (If)
• 100% improvement theoretically signifies that aggregate cover is not necessary
• With Geotextile
• With Geotextile
0
0
100i
f
K KI
K
−= ×
0Ki
K = Thickness at initial K value = Thickness at final K value
15
Effect of Rut Depth• Lower rut depths
� Negligible or Nil efficacy of geotextiles
• Reconfirms the finding of Holtz and Sivakugan (2005)
• Larger rut depth
� Large deformation
• Enhanced mobilization of membranetension � Increased efficiency of thegeotextile� Substantial reduction in h
• With Geotextile
• With Geotextile
16

10/19/2017
9
Benefit from Geotextile: Comparison
• The reduction in thickness increases with increase in tensile strength- Economy
• Comparison shows a reduction of ~200 mm Aggregate layer thickness
• With Geotextile: (K= 100 kN/m)
• With Geotextile: (K= 400 kN/m)
17
Typical Quick Design Charts: Unreinforced and Reinforced Case
Without Geotextile With Geotextile
18

10/19/2017
10
Influence of Traffic
N=10
N=100
N=1000
19
Influence of traffic
• Webster and Alford’s Expression
� For rut depth= 0.075 m
� Standard Axle load= 80 kN
• Need to extend the applicability
� Rut depth
� Other Axle Loads
� Bearing capacity of subgrade
Black’s Expression (Field test data)
• Equation: Multiple passage
� Solution Technique : MATLAB
� Yields cumulative aggregate thickness (hm)
( )0.63
0.19 logs
m
Nh
CBR=
3.95
s i
i s
N P
N P
=
( )log log 2.34 0.075s s
N N r⇔ − −
s iP P⇔
10uq CBR=
( )0.63
0.81log 3.19 log 1.89 5.95i i
m
u
N P rh
q
+ − −=
20

10/19/2017
11
Design Charts without Geotextile: Multiple Passage
Multiple Passage: Without Geotextile Multiple Passage: Without Geotextile
P = 80 kN P = 190 kN
21
Design Charts with Geotextile: Multiple Passage
Multiple Passage: With Geotextile
K = 500 kN/m, e = 1.7
Multiple Passage: With Geotextile
K = 1000 kN/m, e = 1.7
22

10/19/2017
12
Summary…
• Accounting both subgrade strength parameters (c & φ) in present study
� Realistic estimation of h- Economical design
� Influential contributory parameters
• Axle load (P)
• Subgrade strength parameters (c and φ)
• Angle of internal friction of aggregate (φagg)
� Parameters having minimal effects on required aggregate thickness
• Tire inflation pressure (for lower axle loads)
• Location of vehicles
� Tensile strength of geotextile
• Significantly affects degree of improvement (in terms of reduction in h)
� Beneficial effect of geotextile is highlighted for higher rut depths (elevated ‘tensioned membrane’ effect)
� Cumulative Aggregate Thickness � Based on Empirical formulas � not for N > 10,000
23
Need for Continuum Modeling
• Lack of practical applicability� Very low value of subgrade strength�High aggregate thickness (Vice-Versa)
• Construction Failure
� Unbound Aggregate �Mechanically unstable
• Punching Failure
• Fine content required � 4-8% (IRC:SP:77-2008)
• To bring Precision � Limit Equilibrium - Finite Element Approach
� LE: Simplification for complex numerical problem – Resort to FE approach
� Propagation of failure
24

10/19/2017
13
Modeling tool
• PLAXIS 2D v2012
� Performs deformation & stability analysis – Geotechnical applications
� Convenient GUI : allows automatic generation of 2D FE mesh (Global and Local refinement)
� Realistic construction simulation : allows activating, de-activating element clusters, loads
25
Present Study: Model Description
• Model Type
� Plain Strain Geometry
• Uniform cross-section
• Same stress state perpendicular to cross-section
• Model Geometry� 2 Layered System
• Subgrade & Aggregate
� Side Slopes
• 3H: 1V (stable side slope)
� Model Boundaries
Properties Subgrade Aggregate
Constitutive Model Mohr-Coulomb Mohr-Coulomb
Unit Weight (γ) 19 kN/m² 19 kN/m²
Elastic Modulus (E) 6 MPa 20 MPa
Poisson’s Ratio (ν) 0.4 0.3
Initial Void Ratio (eint) 0.5 0.1
26

10/19/2017
14
Model Geometry: Unreinforced Model
Unreinforced Model Geometry Finite Element Mesh: Triangular- 15 nodded
27
Failure under Aggregate Load
• Checking Stability
� csoil , φsoil , φagg: Analytical results
� cagg= 0.001 (to avoid numerical instability)
• Result: Failure in Subgrade
� During lay of aggregate
28

10/19/2017
15
Critical/Limiting Failure Conditions
• Subgrade Failure� Aggregate Load ≤ Allowable Bearing Capacity of Subgrade
,min
0
0.5s c s
s
c N BNh
FOS
γγγ
+=
Failure Zone Cmin chart
29
Failure under Vehicular Loading
• Checking Stability
� cs,min , φsoil , φagg: Analytical results
� cagg= 0.001 (to avoid numerical instability)
• Result: Failure in Aggregate
� Due to punching
• Mechanical Instability
• Absence of Fine soil
30

10/19/2017
16
Critical/Limiting Failure Conditions
• Aggregate Failure
� Stress intensity under tire ≤ Allowable Bearing Capacity of Aggregate
• Result
� With each φagg : Different FOS
� Variation in axle load: Varying stress distribution angle � different stress intensities
• Stability Check : Excessively strong Subgrade
,min 0.5
2
a c ac N tNP
tL FOS
γγ+=
31
Combined Configuration
• Subgrade
� cs,min , φsoil : Determined from failure
only due to aggregate load
• Aggregate
� ca,min , φagg : Determined only from
punching failure of aggregate under vehicle load
• Loading� Subgrade fails: enhancement of
parameters required (cs,min� csa,min )
32

10/19/2017
17
Estimation of enhanced Subgrade cohesion (csa,min)
• Parametric Trial-and-Error determination• Determination of the property enhancement zone
� Total Deviatoric Strain plot
� Total Displacement plot
33
Design Methodology: Unreinforced Case
Geometry and Cluster Parameters: Design ChartsGeometry and Cluster
Parameters: Design Charts
If subgrade fails :Aggregate loadIf subgrade fails :Aggregate load
Find cs,minand test model with this valueFind cs,minand test
model with this value
Passes: Test Aggregate under load
Passes: Test Aggregate under load
Passes: OKPasses: OKFails: Find ca,min and test model
Fails: Find ca,min and test model
Passes: Find csa,minand test model
Passes: Find csa,minand test model
Passes : OKPasses : OK
Fails : Fine TuneFails : Fine Tune
Fails: Fine Tune
Fails: Fine Tune
Fails: Fine TuneFails: Fine Tune
If subgradepasses : OKIf subgradepasses : OK
34

10/19/2017
18
Thickness Reduction using GeotextileModel Number 3674 8000 1900 2400 63352
Model Load P = 30 kN P = 80 kN P =190 kN P = 240 kN P = 360 kN
Initial model height 1.14 m 0.72 m 1.1 m 1.24 m 1.46 m
Reduced height without
geotextile0.5 m 0.70 m 1.05 m 1.15 m 1.46 m
Reduced height with
geotextile0.4 m 0.55 m 0.65 m 0.75 m 1.20 m
Reduction due to
geotextile0.10 m 0.15 m 0.4 m 0.4 m 0.2 m
Percentage Reduction 20 % 21.42 % 38.09 % 34.78 % 14.28 %
53
Conclusions…
• To impart mechanical stability to Stacked Unbound Aggregate
� Mixture of aggregate, sand, fine-sized particles
• Stress distribution angle
� Presence of fine material in cluster voids � Varies with varying axle load even for same φ value
• Modification of Strength Parameters: Subgrade
� Based on strain concentration pattern under operational conditions
• Advantage of Numerical MOdelin
� Coupled stress-deformation based analysis (c-φ soil)
� Different from conventional stress based stability of only cohesive soil
36

10/19/2017
19
Thank YouThank YouThank YouThank You