Embed Size (px)
Citation preview

TECHNICAL REPORT STANDARD TITLE PAGE
1. Report No. 2. Government Accession N, 3. Recipient's Catalog No.
~HWA/TX-83/D6+284-4 4. Title and Subritle--- ------~--------------------------~~~~~--------------------5. Report Da!e
Design of Asphalt Pavements for Thennal Fatigue Cracking
7. Author' 5)
Robert L. Lytton, U. Shanmugham, and B. D. Garrett 9. Performing Organization Nome and Address
Janu.ru:y, 1983 6. Performing Organization Code
8. Performing Orgonization Report No.
Research Re:r;x::>rt No. 284-4 10. Work Unit No.
Texas Transportation Institute 11. Contract or Grant No.
Texas A&M University Study No. 2-8-80-284 College Station, TX 77843 13. Type of Report and Period Covered
------------------------------~ 12. Sponsoring Agency Name and Address
Texas State Department of Highways and Public TranSDOrtation
15. Supplementary Notes
Research Perfonned in Cooperation with DOT, FHWA. Study Title: Flexible Pavement Data Base and Design.
16. Abstract
Interim - September, 1981 Janu.ru:y, 1983
14. Sponsoring Agency Code
Transverse cracking of asphalt pavements can be the result of temperature changes and it was once thought that temperature induced transverse cracking of a spha I t pavements was entirely the result of lOW' temperatures causing the pavement material I"~ tensile strength to be exceeded by b¥lsile stresses --a mechanism nOW' termed "lOw-temperature cracking". Although models for lOW' temperature cracking have been used with sane success in northerly regions, where the temperature drops lOW' enough to cause a pavement to reach its "fracture temperature", in many cases, transverse cracking is quite catm:)n even though relatively moderate temperatures prevail. A mechanism that accounts for thenna.ll y induced cracking of asphalt pavements in relatively moderate climates is "thennal-fatigue cracking II due to temperature cycling that eventually results in the fatigue resistance of the asphalt concrete being exceeded.
This report describes the developnent of a design procedure for asphalt pavements to resist thermal fatigue cracking. The first step is the development of a computer model based on fracture mechanics for predicting transverse cracking due to thermal fatigue cracking in asphalt concrete pavements. It uses Shahin's and McCullouqh ' s revision of Barber's Eq:uations (Bulletin 168, Highway Research Board, 1957) to caupute pavement temperatures but extends upon mechanistic methods of Chang, Lytton, and carpenter, based on fracture mechanics to predict crack growth and spacing. The effectiveness of the model developed is dem::mstrated by canparing its results with field data from Michigan. The design equation is developed by regression analysis of the results of 576 separate runs of the caTlDUter model for a
17. Key Words 18. Distribution Statement tover) No restrictions. This document is
Asphalt pavement, transverse cracking, fracture mechanics, temperature cracking
available to the~?pblic through the Nat Technical Information vice, 5285 Port Royal Road, Springfield, Virginia 22161.
19. Security Classi/. (of this report) 20. Security Clauif. (of thi s page) 21. No. of Pages 22. Price
Unclassified Unclassified 276
Form DOT F 1700.7 (8-69)

DESIGN OF ASPHALT PAVEMENTS FOR THERMAL
FATIGUE CRACKING
by
Robert L. Lytton U. Shanmugham B. D. Garrett
Research Report Number 284-4
Flexible Pavement Data Base and Design Research Study 2-8-80-284
conducted for the State Department of Highways
and Public Transportation
in cooperation with the U. S. Department of Transportation
Federal Highway Administration
by the
TEXAS TRANSPORTATION INSTITUTE Texas A&M University
College Station, Texas
January 1983

ABSTRACT
Transverse cracking of asphalt pavements is often the
result of environmental, non-load associated causes and
accounts for many millions of dollars in maintenance cost
each year. Such cracking can be the result of temperature
stresses. It was once thought that temperature induced
transverse cracking of asphalt pavements was entirely the
result of low temperatures causing the pavement material's
tensile strength to be exceeded by tensile stresses - a
mechanism now termed "low-temperature cracking". Although
models for low temperature cracking have been used with some
success in northerly regions, where the temperature drops
low enough to cause a pavement to reach its "fracture
temperature", in many cases transverse cracking is quite
common even though relatively mod~rate temperatures prevail. \
A mechanism that accounts for thermally induced cracking of
asphalt pavements in relatively moderate climates is
"thermal-fatigue cracking" due to temperature cycling that
eventually results in the fatigue resistance of the asphalt
concrete being exceeded.
This report describes the development of a design
procedure for asphalt pavements to resist thermal fatigue
cracking. The first step is the development of a computer
model based on fracture mechanics for predicting transverse
cracking due to thermal fatigue-cracking in asphalt concrete
pavements. It uses Shahin's and McCullough's revision of
i

Barber's Equations (Bulletin 168, Highway Research Board,
1957) to compute pavement temperatures but extends upon
mechanistic methods of Chang, Lytton, and Carpenter, based
on fracture mechanics to predict crack growth and spacing.
The effectiveness of the model developed is demonstrated by
comparing its results with field data from Michigan. The
design equation is developed by regression analysis of the
results of 576 separate runs of the computer model for eight
different climatic conditions. The design procedure is
automated, using a computerized pattern search routine to
select the best combination of asphalt concrete thickness,
bitumen and mix properties to withstand thermal fatigue for
a specified period of time in a specified climate.
Thermal fatigue cracking was first described by M.
Shahin and B.M. McCullough in Research Report No. 123-14,
August, 1972, but their procedure gave no insight into the
mechanism itself. H. S. Chang, R. L. Lytton, and S. H.
Carpenter in Research Report No. 18-3, 1976 and in Research
Report No. l8-4F, October, 1977, developed mechanistic
models to predict crack growth and spacing due to cyclic
thermal contraction in base materials. This report builds
upon both to develop a design procedure for asphalt
pavements to resist thermal fatigue cracking.
ii
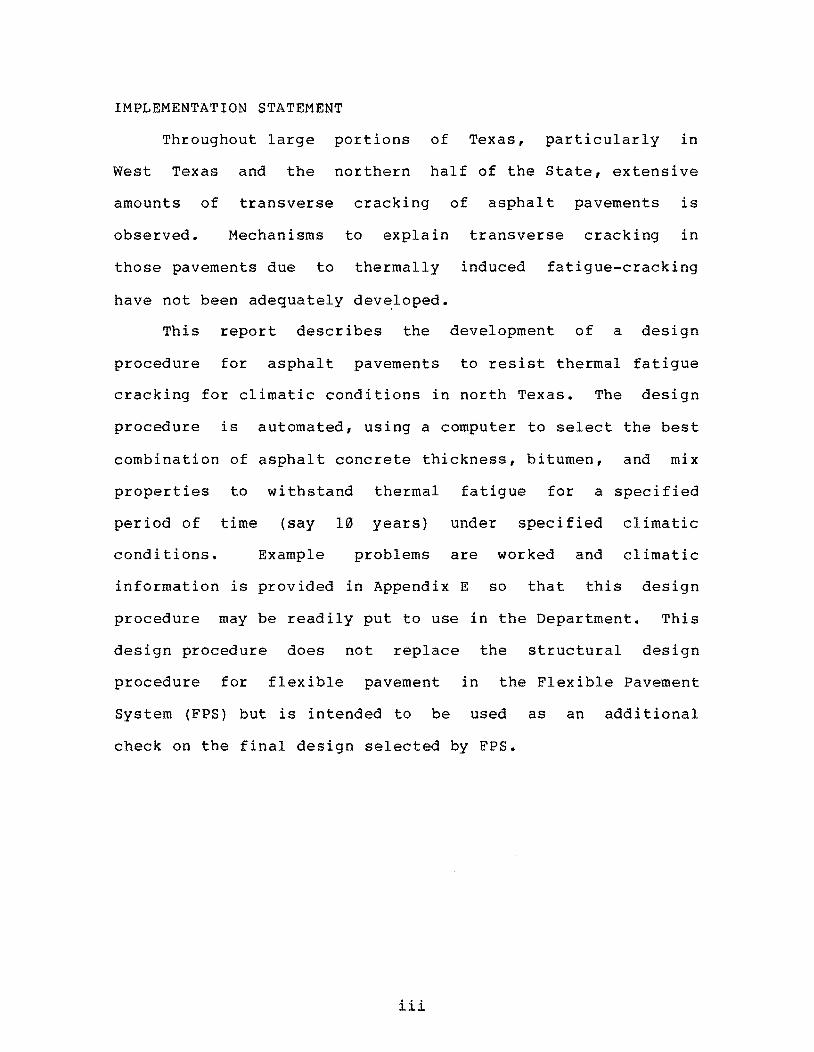
IMPLEMENTATION STATEMENT
Throughout large portions
West Texas and the northern
amounts of transverse cracking
of Texas, particularly in
half of the State, extensive
of asphalt pavements is
observed. Mechanisms to explain
those pavements due to thermally
have not been adequately dev~loped.
transverse cracking in
induced fatigue-cracking
This report describes the development of a design
procedure for asphalt pavements to resist thermal fatigue
cracking for climatic conditions in north Texas. The design
procedure is automated, using a computer to select the best
combination of asphalt concrete thickness, bitumen, and mix
properties to withstand thermal fatigue for a specified
period of time (say 10 years) under specified climatic
conditions. Example problems are worked and climatic
information is provided in Appendix E so that this design
procedure may be readily put to use in the Department. This
design procedure does not replace the structural design
procedure for flexible pavement in the Flexible Pavement
System (FPS) but is intended to be used as an additional
check on the final design selected by FPS.
iii

DISCLAIMER
The contents of this Report reflect the views of the
authors who are responsible for the facts and the accuracy
of the data presented within. The contents do not
necessarily reflect the official views or policies of the
Federal Highway Administration. This report does not
constitute a standard, a specification, or a regulation.
LIST OF REPORTS
Report No. 284-1, "An Investigation of Vehicle Speed and
Pavement Roughness Relationships for Texas Highways", by
N.F. Rhodes, Jr., J.P. Mahoney, and R.L. Lytton, September,
1979.
Report No. 284-2, "Pavement Roughness on Expansive Clays",
by Manuel O. Velasco and R.L. Lytton, October 1980.
Report No. 284-3, "Layer Equivalency Factors and Deformation
Characteristics of Flexible Pavements", by J.T. Hung, J-L.
Briaud, and R.L. Lytton, January 1982.
Report No.
Deformation
284-3a, "Layer
Characteristics
Equivalency
of Flexible
Factors
Pavements
and
Test
Data", by J.T. Hung, J-L. Briaud, and R.L. Lytton, January,
1982.
iv
TABLE OF CONTENTS
ABSTRACT . . . i
IMPLEMENTATION STATEMENT . iii
DISCLAIMER . . . iv
LIST OF REPORTS iv
TABLE OF CONTENTS v
LIST OF TABLES . vii
LIST OF FIGURES ix
CHAPTER I
Introduction 1
CHAPTER II
Development of Fracture Mechanics Computer Program. 5 The Basic Equation of Fracture Mechanics . . . .. 5 Computation of Thermal Stress Intensity Factors .. 8 Equations Used in the Mechanistic Thermal Cracking
Model . . . . . . . . . . . . . . . . . . . . .. 23
CHAPTER III
Empirical Verification of the Mechanistic Thermal Cracking Model . . . . . . . . . . .. •.• 40
Further Analysis of Michigan Data . • . . • . • .. 54
CHAPTER IV
Design Procedure for Thermal Fatigue Cracking . .. 58
CHAPTER V
Conclusions . 70
REFERENCES . 73
APPENDIX A . A-l
Sample Calculations for Change of Pavement Temperature . .. ......... . A-3
v
TABLE OF CONTENTS (continued)
APPENDIX B • • • • . . B-1
Computer Model to Predict Thermal Cracking B-2 Flow Chart of Thermal Cracking Program with Aging,
THERM, Which Makes Use of VISCO • . • • • . . • • B-4 Flow Chart of Thermal Cracking Program with No
Aging When Crack Length, Yc, is Greater Than 1.00 Inch (THERM1) Which Makes Use of VISC01 . • • • • B-12
Description of Input Data: VISCO, VISC01, THERM, and THERM1 •••.•.••... • • • • • . • • B- 21
Computer Program (VISCO) to Determine Viscoelastic Properties of Asphalt Concrete • • • . . • • B-28
Computer Program for Thermal Cracking Model (THERM) B-41 Computer Program (VISC01) to Determine Viscoelastic
Properties of Asphalt Concrete . • • . . •. B-53 Computer Program for Thermal Cracking Model • • B-66 Sample Run of Program VISCO • • . . • • • • . . . • B-80 Sample Run of Program THERM • . . • • • • • . • . • B-84 Sample Run of Program VISCOl • • • • • . . • • B-87 Sample Run of Program THERMl • • . . •• • B-94
APPENDIX C .
Pattern Search Program to The Guide for Input Data Pattern Search Program to
of PI, TRB, CV, and DF
APPENDIX D .
Find Optimum Values •
Determine Optimal Values
Results of Computations in Michigan and Texas Using
C-1
C-2 C-2
C-4
D-1
Program THERMl • • •• •.• • . • • • . • . D-1
APPENDIX E
Solar Radiation and Minimum Temperature Maps for Texas .•
References
vi
E-l
E-2 E-7

1
2
3
4
5
6
7
8
9
10
11
M
Al
LIST OF TABLES
Properties of Pavement Used • • • • . . . • • • . •
Range of Variables Used to Develop Aging Equations.
Predicted Aging of a Low Penetration Asphalt
Predicted Aging of a High Penetration Asphalt •
Range of Important Variables Reported Relating to Transverse Cracks in Michigan • . . . • . • • • •
The Data Used to Run the Model for Analyzing the Michigan Pavements .•• • • • • • .
Asphalt Concrete Mix Properties Used to Run the Model for Analyzing Michigan Pavements • • •
Computations of CMDG2 for Michigan Pavements Using the Results From the Model (Case: 1, with Aging)
Computations of CMDG2 for Michigan Pavements Using the Results From the Model {Case: 2, without Ag ing} ...... ............ .
Computations of CMDG2 for Michigan Pavements Using the Results From the Model (Case: 3, Aging Up to a Depth of 1.0" i.e. No Aging When Yc > 1.0") •.
Results of Pavement Design Program
Metric Conversion Factors •
Calculated Values of crT and ~T
12
31
32
33
41
43
45
47
49
51
65
A-2
A-8
A2 Calculated Values of Thermal Tensile Stress, crT' for 2" Thickness of Suiface Course • • . • • • • A-9
A3 Calculated Values of Thermal Tensile Stress, crT' for 4" Thickness of Surface Course ••••••• A-10
A4 Calculated Values of Thermal Tensile Stress, crT' for 8" Thickness of Surface Course • • • • • . • A-ll
A5 Calculations for the Corrected Stress Intensity Factor, Kl , for d=2", and TR=50 o F •••.•••• A-12
A6 Calculations for the Corrected Stress Intensity Factor, Kl , for d=2", and TR=lOO°F ••••••. A-13
vii

LIST OF TABLES (continued)
A7 Calculations for the Corrected Stress Intensity Factor, Kl , for d=2", and T
R=l50oF · · · · · · · A-l4
A8 Calculations for the Corrected Stress Intensity Factor, Kl , for d=4", and T =50°F R · · · · · · · · A-l5
A9 Calculations for the Corrected Stress Intensity Factor, Kl , for d=4", and TR=lOO°F · · · · · · · A-l6
AlO Calculations for the Corrected Stress Intensity Factor, Kl , for d=4", and TR=l50°F · · · · · · · A-l7
All Calculations for the Corrected Stress Intensity Factor, Kl , for d=8", and T =50 oF R · · · · · 0 · · A-l8
Al2 Calculations for the Corrected Stress Intensity Factor, K
l, for d=8" , and TR=lOO°F · · · 0 0 0 · A-l9
Al3 Calculations for the Corrected Stress Intensity Factor, Kl , for d=8" , and TR=l50oF · · · · · · · A-20
Al4 Intercepts and Slopes From the Stress Intensity Factor, Kl , Versus Crack Length, Yc, Curves •.. A-2l
Al5 Intercepts and Slopes From a Versus TR, and b Versus TR Curves • • • . . . . . . . • . . . . 0 A-22
D-l Computation of CMDGl Using Thermal Cracking Program for Michigan - Area 1 (Marquette) 0 • • • 0 • • 0 D-2
D-2 Computation of CMDGl Using Thermal Cracking Program for Michigan - Area 2 (Sault Steo Marie) ..•• D-6
D-3 Computation of CMDGl Using Thermal Cracking Program for Michigan - Area 3 (Honghton) · · · · · · · · D-IO
D-4 Computation of CMDGl Using Thermal Cracking Program for Michigan - Area 4 (Grand Rapids) · 0 0 0 D-14
Computation of CMDGIUsing Thermal Cracking Program for Amarillo . .. . . '. o . . . .. . · · · · 0 · · · D-18
D~6 Computation of CMDGl Using Thermal Cracking Program for Abilene . • • • • • • . • • . o. • • • · 0 · · D-22
D~7 Computation of CMDGl Using Thermal Cracking Program for El Paso • 0 • • • • • • • • • • 0 • • · 0 0 · D-26
D-8 Computation of CMDGl Using Thermal Cracking Program for Dallas • • • • • • . • • . 0 • • • • · · · · D-30
viii

LIST OF FIGURES
1 Area of Influence of Transverse Cracks · · · · · · 2 Details of the Pavement Used · · · · · · · · · · · 3 Finite Element Representation of Pavement Structure
4 (a) Details of Crack Tip Element · · · · · · · · · 4(b) Nine-node Tip Element for Non-symmetric Case · · · 4(c) Five-node Tip Element for Symmetric Case · · · 5 Surface Temperature as a Function of Time without
Radiation and Wind . . . . • . . . .. ...
6 Illustration of the Effect of Solar Radiation on
7
8
9
10
A1
A2
A3
A4
A5
A6
Pavements •.
A Comparison Between Air Temperature and Effective Air Temperature • • . . . • . . . . . . . • • . •
A Typical Relaxation Modulus Curve at Master Temperature of 25°C: Stiffness of A.C. Mix Versus Loading Time • • •. ......... .
A Typical Log aT Versus Log (T-TA) Curve
Schematic Diagram of Mechanistic Thermal Cracking Model . . . . . . . . . . . · · · · · · · · · · ·
Stress Intensity Factor Versus Crack Length · · · · Stress Intensity Factor Versus Crack Length · · Stress Intensity Factor Versus Crack Length · · · · Stress Intensity Factor Versus Crack Length · · · · Stress Intensity Factor Versus Crack Length · · · · Stress Intensity Factor Versus Crack Length · · · ·
A7 Intercept, a, Versus Daily Air Temperature Range
10
11
13
14
14
14
17
17
19
26
29
59
A-23
A-24
A-25
A-26
A-27
A-28
Below the Stress Free Temperature . • • • • . . .A-29
A8 Intercept, a, Versus Daily Air Temperature Range Below the Stress Free Temperature • • • . • . . . A-30
A9 Intercept, a, Versus Daily Air Temperature Range Below the Stress Free Temperature . • • • . . . • A-3l
ix

LIST OF FIGURES (continued)
A10 Intercept, a, Versus Daily Air Temperature Range Below the Stress Free Tem"gerature • • . . . . . . A-32
All Slope, b, Versus Daily Air Temperature Range Below the Stress Free Temperature . . • • . • • • • • • A-33
A12 Slope, b, Versus Daily Air Temperature Range Below the Stress Free Temperature . . • . • • • . . • • A-34
A13 Slope, b, Versus Daily Air Temperature Range Below the Stress Free Temperature • . • • • . • • . • • A-35
A14 Slope, b, Versus Daily Air Temperature Range Below the Stress Free Temperature . • . • • • •. • A-36
A15 Intercept, ml , Versus Depth of Surface Course •.• A-37
A16 Slope, m2 , Versus Depth of Surface Course .•••• A-38
A17 Intercept, m3 , Versus Depth of Surface Course • A-39
A18 Slope, m4 , Versus Depth of Surface Course ..••. A-40
El Average Annual Solar Radiation in Texas . . E-3
E2 Mean Daily Solar Radiation for June in Langleys per Day . . • . E-4
E3 Lowest Normal Monthly Minimum Temperatures in Texas E-6
x

CHAPTER I
INTRODUCTION
The problem of non-load associated cracking of asphalt
pavements has been a serious concern for many years. By
1966 this concern had grown to the point that, as a part of
the 1966 Annual Meeting of the Association of Asphalt Paving
Technologists, a special
Associated Cracking of
symposium, "Non-Traffic
Asphalt Pavements," was held
Load
to
address this problem. In the introductory paper of that
symposium (1), V. Marker summarized the known possib
contributing causes for this type of cracking.
Non-load associated cracking in flexible pavements
generally takes the form of "transverse cracking"; that is,
nearly straight cracks across the pavement or perpendicular
to the direction of traffic. Transverse cracking, when
fully developed, can be seen as a series of cracks across
the pavement whose spacings may be as little as a few feet
to as much as several hundred feet.
At the time of the symposium mentioned above, the only
suitable explanations for temperature induced transverse
cracking of flexible pavements involved the exceeding of the
pavement material's tensi strength by tensile stresses -
a mechanism now termed "low-temperature cracking." The
statement below comes from Marker's 1966 paper at that
symposium.
1

"It would appear that the only manner in which a
more or less straight crack can occur in an
asphalt pavement is by a pulling force. In other
words, a pull of some type sets up tensile
stresses in the pavement which are greater than
its resisting capabilities."
Extending from the above assumption, Marker listed a
number of possible causes of transverse cracking. Among
them are incluqed both shrinkage of tne asphalt layer .. itself
and shrinkage of the base or subgrade.
Models for low temperature cracking have been used with
varying degrees of success in the more northerly regions of
the united States and in Canada. In those areas, the
temperature drops low enough that it will reach the pavement
material's "fracture temperature," defined as the
temperature at which the developed tensile thermal stress
exceeds the tensile strength of the asphalt concrete
mixture. However, in many cases transverse cracking may be
common even though the pavement has not been subjected to
such temperature extremes. This is the case in some parts
of Texas where a considerable amount of transverse cracking
is observed and where relatively moderate temperatures
prevail.
A mechanism to account for thermally induced transverse
cracking of flexible pavements other than low-temperature
cracking, is "thermal-fatigue cracking." It was first
2

described by M. Shahin and B. F. McCullough (2) and is
defined
daily
fatigue
to be caused by thermal fatigue distress due to
temperature cycling, which eventually exceeds the
resistance of the asphalt concrete. They developed
a model to predict thermal-fatigue cracking which assumes a
fatigue law and obtains necessary constants by requiring the
results to match an actual data point. The results of their
procedure are not easily applied, particularly as no method
of determining the fatigue constants of an asphalt mix was
developed and no insight is provided into the mechanism
itself.
In "Prediction of Thermal Reflection Cracking in West
Texas" (3) and in "Thermal Pavement Cracking in West Texas"
(4), computer models were developed to predict crack growth
and crack spacing with time, where the cracking was due to
volumetric changes in base materials. These mechanistic
models use both materials properties and climatic data as
inputs and since they do offer insight into the mechanism of
thermal-fatigue cracking of flexible pavements, are an
improvement over the Shahin-McCullough model.
This report describes the development of a design
procedure for asphalt concrete pavements to resist thermal
fatigue cracking. The first step in this development is a
computer model based on fracture mechanics for predicting
the occurrence of transverse
pavements. This work was
cracking in asphalt concrete
motivated by the work of Shahin
3

and McCullough and the later developments described above to
develop better understanding of the mechanisms of thermal
fatigue cracking. It makes use of Shahin's and McCullough's
revisions of Barber's Equations (5) to compute pavement
temperatures based on air temperature, wind speed, and solar
radiation, calculates pavement temperature
(5) and determines the effective modulus as
as was done in
in (3) • The
mechanistic method, based on fracture mechanics, used in
this development may be expected to have more universal
application than previous methods. The effectiveness of
this method is demonstrated by comparing its results with
observed crack spacings from Michigan which were previously
used for evaluation of an empirical model developed by Haas
(6, 7). A total of 576 runs of the computer model for four
north Texas provided sites in Michigan and four sites in
data for the development of a
thermal fatigue cracking that is the
regression equation for
basis for the design
procedure which is the objective of this report. The design
is carried out using another computer program that selects,
for given climatic conditions, the best pavement thickness,
asphalt properties, and volumetric concentration of
aggregate in the mix. Example problems are worked to show
the results that may be expected when using the design
procedure.
4

CHAPTER II
DEVELOPMENT OF FRACTURE
MECHANICS COMPUTER PROGRAM
the theory of fracture This
mechanics
chapter summarizes
that was used in developing a computer program
that is capable of predicting thermal fatigue cracking. The
reader who is more interested in seeing the results of
calculations made with the program may turn directly to
Chapter 3, which is concerned with verifying the model by
comparing calculated results with observed field data. The
actual design procedure with example calculations is given
in Chapter 4.
The subjects that are covered in this chapter include
the basic equation of fracture mechanics, the computation of
stress intensity factors, and the set of equations used in
the thermal cracking model.
THE BASIC EQUATION OF FRACTURE MECHANICS
In the development of a model to predict the frequency
or spacing of transverse cracks in asphalt concrete that are
the result of thermal-fatigue cracking, the equation of
Paris and Erdogan (8) is used. This equation was originally
developed through a fatigue test in metals. As formulated
here, cracking of the asphalt concrete surface is assumed to
begin at the top and progress downward through the asphalt.
The asphalt is said to be "cracked" (or failed) when the
5

calculated "crack length" (or depth in this case) equals at
least the thickness of the asphalt layer. Thus we have
where
dc dN
ilK
A and n
dc dN
=
=
= (1)
the rate of growth of the crack length
(depth) with respect to the number of
thermal loadings, N,
the change at the cracked tip of the
stress intensity factor, from the time
of maximum temperature to the time of
minimum temperature,
are fracture properties of the asphalt
mix.
Using equation (1), the number of temperature cycles
from a temperature maximum to a temperature minimum that are
required before the cracking of the asphalt will have
developed a crack through the asphalt layer can be found by
integration. Rearranging equation (1) we have
c o
d
= d
1 + f c
o
dc (2) A(IlK)n
= the initial crack length that occurs in
a new pavement,
= the thickness of the asphalt layer,
6

= the number of temperature cycles to
failure, and
C, A, and ~K are as defined before.
In the above Equations, if A, ~K and n are known, then,
for some number ~N of temperature cycles, which is less than
the change in crack depth, ~C can be found by using
the following equation, developed from Equation 1:
C = (3)
To successfully apply Equations 1 and 2 toward the
development of a method for predicting the frequency
(spacing) of transverse cracks in asphalt pavements, the
various elements of those equations must be properly
described. This requires the following
(1) A methodology for the calculation of the stress
intensity factor, K, must be developed which
considers that the stress intensity
sensitive to the thickness of the
surface, the current crack length, the
factor is
pavement
effective
modulus of elasticity of asphalt concrete, and the
range of temperature to which the pavement has
been subjected.
(2) The fatigue parameters A and n need to be
determined from asphalt concrete properties that
are readily available when a pavement is designed
and in such a way that the change in material
7
properties with time and temperature is accounted
for.
The methods used to handle these concerns are detailed
in the next two sections of this chapter.
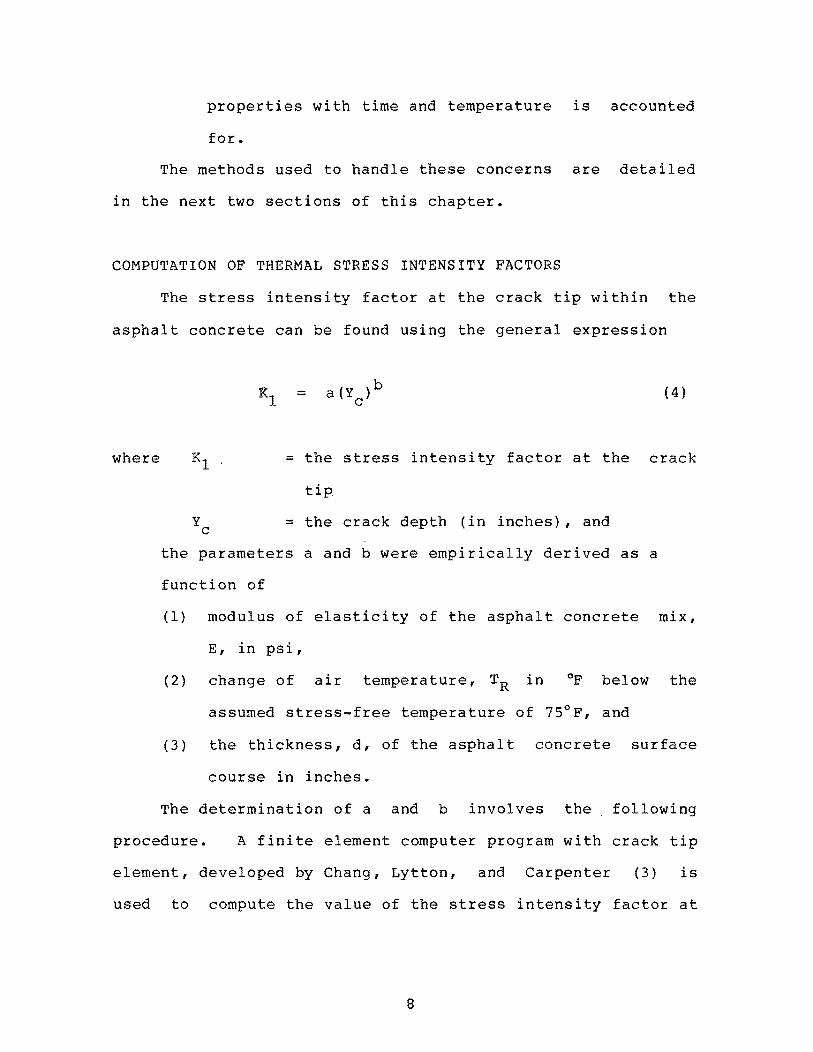
COMPUTATION OF THERMAL STRESS INTENSITY FACTORS
The stress intensity factor at the crack tip within the
asphalt concrete can be found using the general expression
where
:Rl = (4)
= the stress intensity factor at the crack
Y c
tip
= the crack depth (in inches), and
the parameters a and b were empirically derived as a
function of
(1) modulus of elasticity of the asphalt concrete mix,
E, in psi,
(2) change of air temperature, TR in of below the
assumed stress-free temperature of 75°F, and
(3) the thickness, d, of the asphalt concrete surface
course in inches.
The determination of a and b involves the following
procedure. A finite element computer program with crack tip
element, developed by Chang, Lytton, and Carpenter (3) is
used to compute the value of the stress intensity factor at
B

the crack tip which is then corrected in the manner of
Barenblatt (9) • As was stated before and as is represented
in Figure 1, the crack is assumed to be in a transverse
direction. For purposes of analysis, the influence of the
crack is assumed to be within 45 inches of the crack in
either direction, so that the solutions will not be affected
by boundaries. The spacing of the transverse cracks usually
ranges from 5 feet to several hundreds of feet (2). The
details of the pavement cross section used for this analysis
are shown in Figure 2 and its material properties are given
in Table 1. A typical example of the finite element mesh is
shown in Figure 3. The thermal tensile stresses were
calculated at both the top of the pavement and at the top of
the crack tip element (Figure 4) using Barber's equation as
modified by Shahin and McCullough (2). That equation is
T = T + T m v
where T =
TM =
TV =
x =
H =
H -xc e
temperature of
mean effective
Sin(S. ) . ~
the mass in of,
air temperature in of,
maximum variation in temperature
the effective mean temperature in of,
depth below the surface in feet,
h/k,
9
(5)
from

o o It) I -
It)
w (!) z « et:
x ft.
Transverse Crack
Area of Influence LUU..l.LLI.-lU
Transverse Crack
Figure 1. Area of Influence of Transverse Cracks
10

Surface Course
Base Course I
I
Subgrade I
,
I
I- 45"
Fi gure 2. Oeta il s of the Pavement Used
11
~
If) If) _
Q)
c 00 .:s:. .S:2 ~ ..c - -..- v 0'1 .. C =
J .::;., C\J \...
o -> -co
LO r<>

TABLE 1. Properties of Pavement Used
Modulus of Poisson's Density El asti city Ratio lb/ft. 3 lb/in3 E v
(ps i)
1,QOO 0.45 146 0.0845
Surface Course 10,000 0.40 146 0.0845 I
100,000 0.30 146 0.0845
Base Course 50,000 0.35 140 0.0810
Subgrade 20,000 0.45 120 0.0694
12

x- Axis (+ ve)
~~Tr .E 5-+-'-0
ci5 u t--AxiS -ve)
Q)~ C/)'-~ O:::J
aJ8 f>
5
4
3
2
I
~
~ fff ,,.
-
m~ I~~
, A A
Figure ,3. Finite Element Representation of Pavement Structure
13
Crock tip element

234 252 269 ..-
233 251 268 -.. t
O"T T x T
Yc
z
232 250 ~ C rack Tip Element
231 249 267 (a)
230 248 266
AA 'V~
2 9 8 2 1
3 (b)
3 (c)
v
-4 5 6 4 5
Figure 4. (a) Details of Crack Tip Element, (b) Nine-node Tip Elenent for Non-Symmetric Case, (c) Five-node Tip Element for Symmetric Case
14
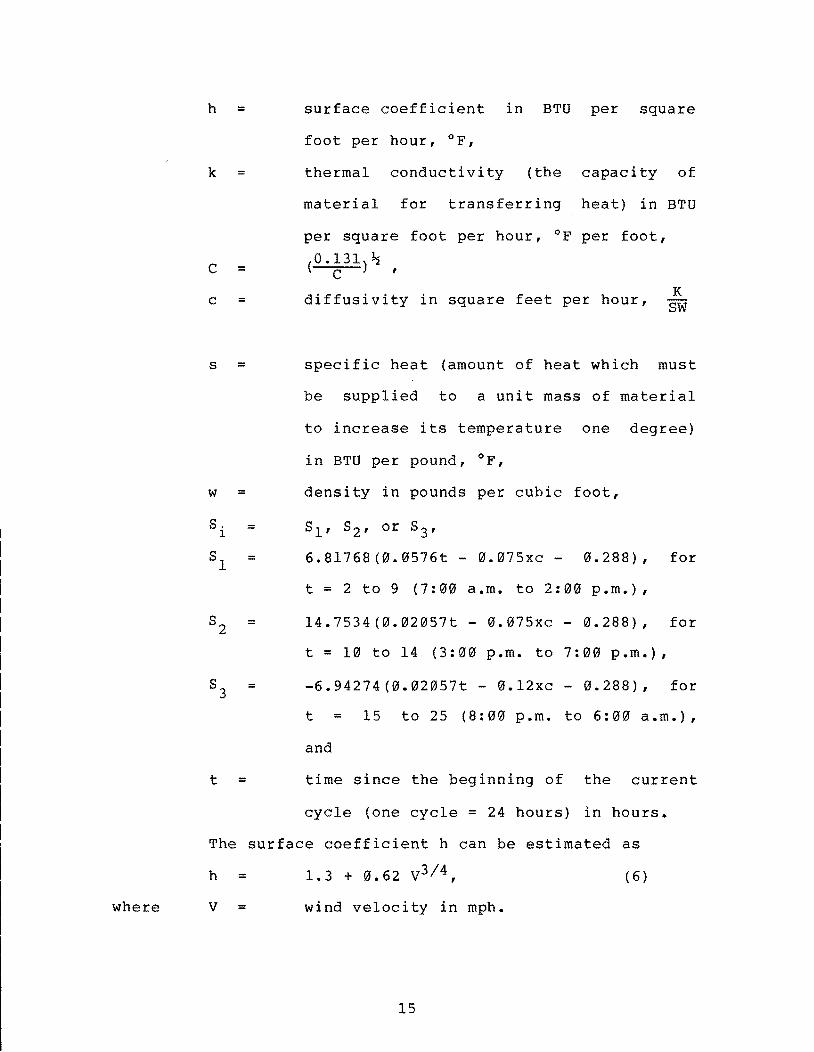
where
h = surface coefficient in BTU per square
foot per hour, of,
k = thermal conductivity (the capacity of
material for transferring heat) in BTU
per square foot per hour, of per foot,
C = (O.13l)l>:2 c ,
diffusivity in feet hour, K c = square per SW
s = specific heat (amount of heat which must
w
S. 1
=
=
=
=
=
be supplied to a unit mass of material
to increase its temperature one degree)
in BTU per pound, of,
density in pounds per cubic foot,
6.8l768(0.0576t - 0.075xc - 0.288) , for
t = 2 to 9 (7:00 a.m. to 2:00 p.m.),
14.7534(0.02057t 0.075xc - 0.288), for
t = 10 to 14 (3:00 p.m. to 7:00 p.m.),
-6.94274(0.02057t - 0.12xc - 0.288), for
t = 15 to 25 (8:00 p.m. to 6:00 a.m.),
and
t = time since the beginning of the current
cycle (one cycle = 24 hours) in hours.
The surface coefficient h can be estimated as
h = 1. 3 + 0. 62 v3 / 4 , ( 6)
v = wind velocity in mph.
15

Figure 5 shows the surface temperature as a function of
time without radiation and wind. Solar radiation is the
amount of heat from the sun per unit area and time. The
average net loss of solar radiation through long wave
radiation is about one-third of the total solar radiation.
Therefore the average contribution of solar radiation to the
effective air temperature can be determined by
R = (~) (b) (solar radiation) (1) 3 h
(7)
where b is the surface absorptivity (ability of the
surface to absorb heat) from solar radiation. Since solar
radiation is usually reported in Lang1eys per day and one
Langley is 3.69 BTU per square foot per day, Equation 7 can
be rewritten as
R (~) = 3 (b) (8)
where L = solar radiation in Lang1eys per day.
Figure 6 shows the effect of solar radiation on pavement
temperatures.
The maximum or the minimum pavement temperature can be
determined using the following equations in conjunction with
Equation 7
16

6 lime, t (hrs.)
Mean Air Temperature (T M)
Air Temperature
Figure 5. Surface Temperature as a Function of Time Hithout Radiation and t~i nd (1)
Solar Radiation
Pavement surface~
Semi- infinite Mass Retention
c o :0:: o
" e ~
tt
Figure 6. Illustration of the Effect of Solar Radiation on Pavements (1)
17

\
=
=
=
=
0.5TR + 3R, if sin (Si) > 0,
if sin (S . ) 1
> 0,
if sin (Si) < 0, and
TA + 0.5 TR, if sin (S ) <0,
(9)
(10)
(11 )
(12 )
where the daily air temperature range in of.
A comparison between air temperature and effective air
temperature is shown in Figure 7 •.
Sample calculations for determining the change in
pavement temperature, AT, and thermal tensile stress,
are given in Appendix Ai the results are summarized in
Tables Al through A4. The stress intensity factors were
determined for six crack depths in each of three surface
thicknesses (2 inches, 4 inches, and 8 inches), for two
different moduli of elasticity (10,000 and 100,000 psi), and
for three different temperature ranges, AT, (50°F, 100°F,
and 150 0 F) • The computed values of stress intensity
factors, Kl are corrected using a correction factor (9),
(13 )
18
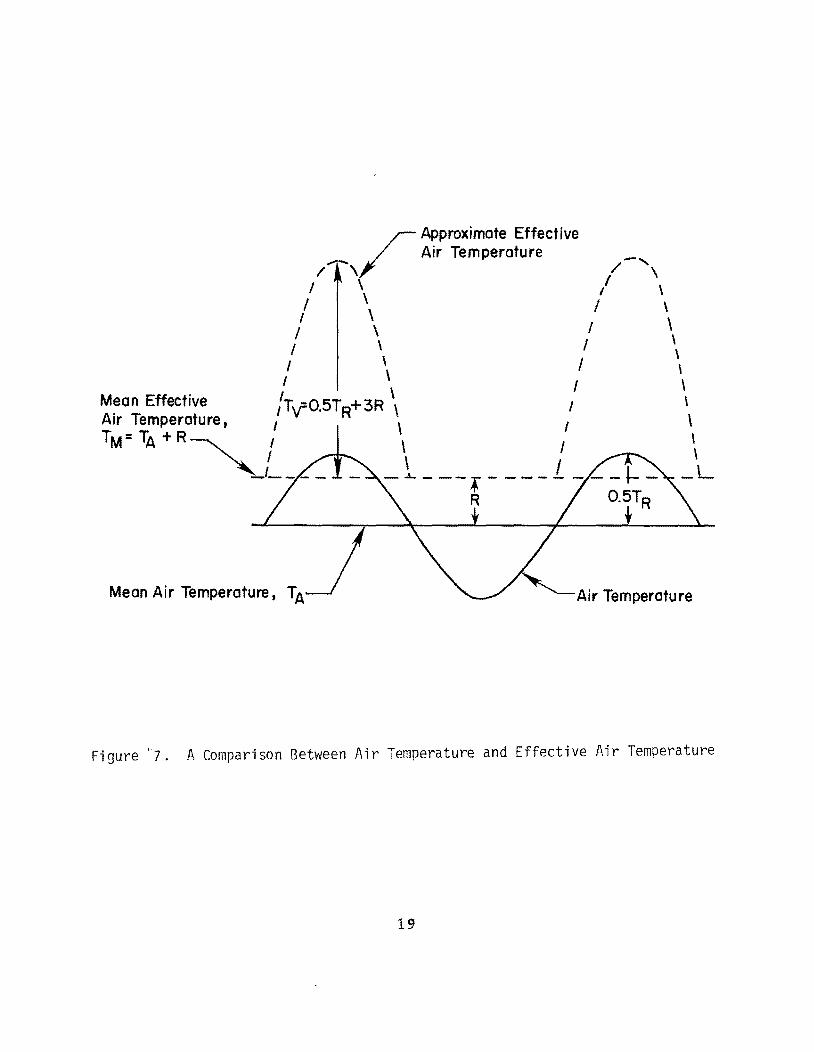
..... -/ \ /
Approximate Effective Air Temperature
I \
-, / \
/ \ I \ I \
I \
I \ I \ I \
I \
M~an Effective 't -O.5T +3R \ Air Temperature I V- R \
t I \
I I
I
I
I I
TM= TA +R~ J ~ I \ I
_1- - - - _1. - - - f - - - - 1. - - - ~ -R O.5TR
\ \ \ \ \ \ \ \ \
_L
Mean Air Temperature t TA Air Temperature
Figure '7. A Comparison Between Air Temperature and Effective Air Temperature
19

For the definition of Z, see Figure 4a. In this
investigation, the value of Z was taken to be 0.25 inches.
The corrected stress intensity factor, KI , is equal to
the sum of the computed value of stress intensity factor, KI,
and the correction factor, Ck ,
= (14)
The computed stress intensity factors, correction factors,
and the corrected stress intensity factors are given in
Tables A5 tQrough A13.
For particular values of the modulus of elasticity, E,
daily air temperature range below stress-free temperature,
TR, and depth, d, values of the stress intensity factor,
Kl , were plotted against crack length, Yc ' on a full
logarithmic graph paper (Figures Al through A6). From these
plots, values of a and b are obtained by linear regression
analysis and are summarized in Table A14. If all values of
a and b were the same, a general equation for the stress
intensity factor, Kl , would result.
Given a value of E, a and b varies with daily air
temperature range below the stress-free temperature, TR•
Therefore, a and b are plotted against daily air temperature
range below stress-free temperature, TR (Figures A7
through AI4). The resulting linear relationship between a
and TR, and between band TR are written as
20

(15 )
(16 )
The values of m1 , m2' m3 , and m4 are given in Table A15.
The values of m1 , m2 , m3 , and m4 change with a change
in the modulus of elasticity, E, or in the depth, d. The
relationships of m1' m2' m3' and m4 with the modulus of
elasticity, E, and depth, d, are generated as described
below.
The value of m1 is plotted against d for values of
E=100,000, and 10,000 psi. In Figure A1~, it can be seen
that a linear relation holds between and d whenever E
is in the range 100,000 to 10,000 psi, provided that d is
between 0.0 and 29.1063 inches. Thus for 10,000 < E <
100,000 psi,
E m1 = 8.8988 + (29.1063-d) (1.3573-0.01357(1000» (17)
In Figure A15, it can be seen that a linear relation holds
between and d whenever E is in the range 100,000 to
10,000 psi, with d between 0.0 and 129.3215 inches. Thus
for 10,000 < E < 100,000 psi,
E = 2.0599 - (129.32l5-d) (0.01687-0.000169(1000»
(18)
21

In Figure A17, it is seen that, when d < 4 and 10,000 <
E < 100,000 psi, then
m3 = 0.8481 + (2.7811-d) (0.002738(io~0» (19 )
and when d > 4 inches and 10,000 < E < 100,000 psi,
then
E m3 = 0.8481 - (6.5835-4) (0.12919-0.0012919(1000»
(20)
The plot of m4 versus d is shown in Figure Ala. As in
the case of ml and m2 , a linear relation holds
between m4 and d for E in the range of 100,000 to 10,000
psi. Thus for 10,000 < E < 100,000 psi,
m4 = -0.00157 + (5.0472-d) (0.001129-0.00001129(1:00»
(21)
In summary, the equation for the thermal stress intensity
factor is
(22)
where a = (T R - m1 )m2 and (23)
b = m3 + m4 TR• (24)
which results in the final form given in Equation 25.
K1 = (TR-m1 ) m2 (Y ) (m3+m4 TR) (25)
c
22

EQUATIONS USED IN THE MECHANISTIC THERMAL CRACKING MODEL
The equation for the number of thermal cycles to reach
failure is
d Nf = 1 + !c
o
dc (2)
The previous section of this chapter showed how the change
of stress intensity factor, ~K, may be calculated as a
function of temperature, modulus, and pavement depth. This
section will show how the fracture properties A and n may be
calculated.
Although these two fatigue parameters can be measured
in the laboratory, it is a very time consuming process.
Their values are not likely to be available to designers
during the preparation of mixes for asphalt concrete
pavements and, therefore, not likely to be available for
direct use in our model.
The values of the two fatigue parameters, A and n, are
found in the model as follows.
(1) The asphalt stiffness is calculated using Van der
Poel's nomograph (10) as computerized by de Bats
(11) •
(2) Given the stiffness of the asphalt cement, the
stiffness of the asphalt mix is calculated for
various loading times, producing a relaxation
modulus curve.
23

(3) Schapery (12) has shown that the slope, m, for a
relaxation modulus curve, at a master temperature
of 77°F, of the 10g 10 of the loading time is
related to n as follows:
n (26)
(4) Germann and Lytton (13) attempted to verify
Schapery's relation in the laboratory, and found
that the values of n from Equation (26) must be
divided by 2.5 in order that the calculated values
will agree with laboratory observations.
(5) The value of A is found by substitution into
n = -0.69 - 0.511 10g10A (27)
which is a relationship found through crack
propagation testing of asphalt concrete at the
Texas Transportation Institute (14).
The de Bats program has been modified to compute the
viscoelastic properties of the asphalt concrete; inputs are
the aggregate volume concentration along with sufficient
parameters to identify the temperature susceptibility of the
bitumen. The model allows several choices of parameters to
describe temperature susceptibility. The stiffness of the
asphalt cement is used to calculate the stiffness of the mix
24

given various loading times (15):
C S = [1 2.5 (_V_)] N 0 000145
Smix Sbit ~ l-Cv x. (2B)
where = stiffness modulus of the asphalt
concrete mix in Ib/in2 ,
= stiffness modulus of bi tumen from Van
der Poel's nomograph in N/m2,
= volume of aggregate volume of aggregate + volume of bitumen '
=
= stiffness modulus of bitumen from Van
der Poel's nomograph in kg/cm2 •
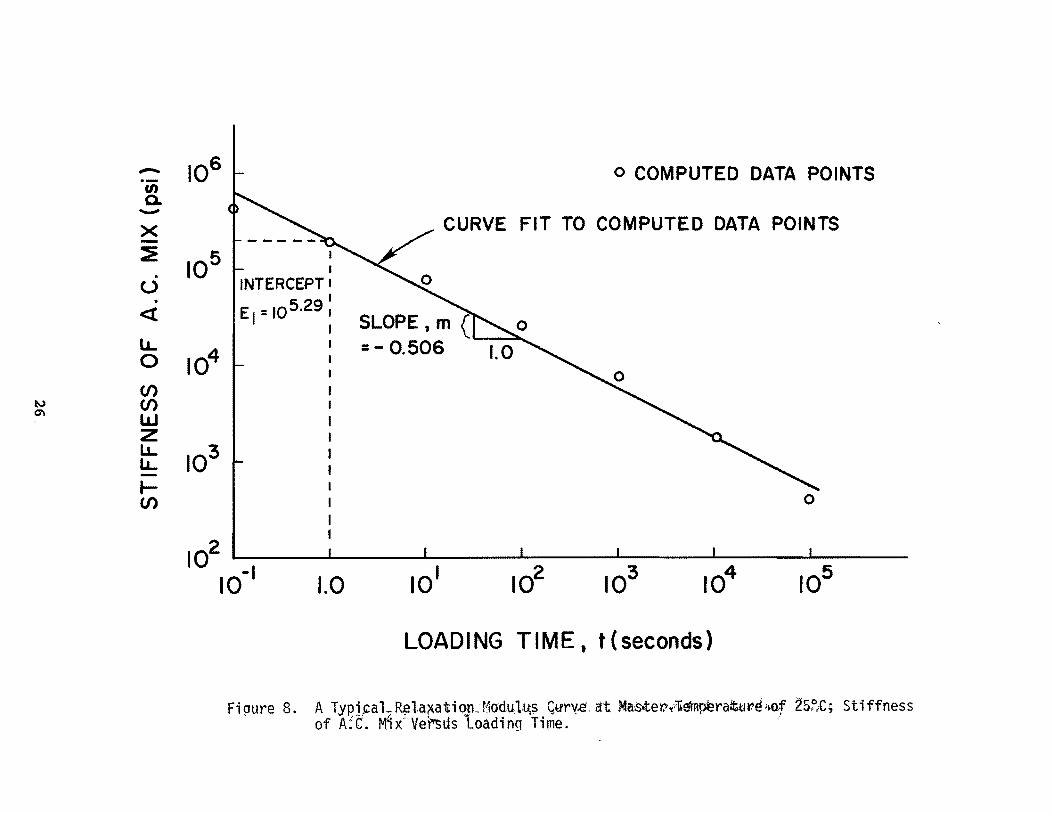
A relaxation modulus curve can be drawn as the log of
stiffness modulus of asphalt concrete mix versus the log of
loading time as shown in Figure B. The slope of this curve
is designated as m and the intercept of this curve is
designated as El at a master temperature, of
25 Q C (77 0 F). From the relaxation curve, a relation between
Smix' El , m, and t (loading time) is obtained:
S. = E t-m m~x 1
(29)
25
....... 106 o COMPUTED DATA POINTS . iii ~ -X CURVE FIT TO COMPUTED DATA POINTS -~
105 . INTERCEPT U . EI = 105.29 « SLOPE, m ( 0
LL 104 = - 0.506 1.0 0
(/) N (/) 0'\
lLJ Z LL
103 LL -l-(/) 0
102
101 102 10-1 1.0 103 104 105
LOADING TIME, t (seconds)
Fipure 8. A Typi,ca L ~ laxa t.i qp:r1oclu,1~? Curv-e, atNaoce~""li~raittlv.~ $jQf ~S.?,£; Sti ffness of A;C. M1x"VeM;us Loading Time. ..'

The above relation is obtained for three temperatures,
0° C, 25°C (master temperature), and 60°C. From Equation 29,
the loading times, t, for the three temperatures can be
written as follows:
S mix 1 t(at"O°C) = (E (at O°C» in (at O°C),
1
S mix t(at 25°C) = (E (at 25°C» m (at 25°C) (30)
1
s . 1 t(at 60°C)
mJ.x (at;. 60°C) = (E (at 60°C» m
1
where S. is assumed to be constant and its value is mlX
calculated by taking 1/2 of the mix stiffness corresponding
to a loading time of one second on the log S . mlX versus
log t (Figure 8) curve at the master temperature. Then the
time-temperature shift factor, aT' is defined as the
loading time at temperature T divided by loading time at the
master temperature, For the
temperatures, aT can be written as follows:
t(at OOC) t(at 25°C)
27
and
three different
(31)

A graph is drawn relating log aT and log (T
The value of TA is chosen by trial and error so that the
graph is as close as possible to a straight line. The
temperature of the mix, T, and the temperature constant,
TA, are expressed in °C. A typical straight line fit is
shown in Figure 9. The slope of the straight line is
designated as BETA. The variables Log 10 m,
TA, and BETA are viscoelastic properties of the asphalt
concrete mix. These viscoelastic properties are used as
inputs to the thermal cracking program, THERM.
Some empirical equations were developed by regression
analysis of a data set published by Shahin and McCullough
(2), which includes observations from four areas of the
united States, to predict aging of the asphalt. Those
equations are
where
P(t) = o • 4 + 0. 716 Po - ( 0 • 19 3 Po - 9. 1) log t , (32)
= -30.6 + 1.230TRB + 10.5 loget, (33 )
t is the time in months that the asphalt has been in
place in the pavement,
Po and P(t) are respectively, the penetration at 77 ° F
of the original and aged asphalt in standard units
of 0.1 millimeters penetration, and
28

3.0
2.0
1.0
J- 0.0
CJ')
o .J
-1.0
-2.0
BETA =-13.26
a 2
Figure 9 •. 8. typical1.og ~T·versus log (T - TA) curve.

TRB and TRB (t), respectively, for original and aged
asphalt, are the softening point ring and ball
temperatures in of.
Equations 32 and 33, which predict the aging of the
asphalt, are incorporated in the modified de Bats' program.
The range of variables on which these equations are based is
given in Table 2. Both equations were developed assuming an
initial change in properties during mixing and construction
placement followed by time dependent changes as described by
Benson (16). There is an anomaly in the relation of
penetration with time since the long-term penetration is
inversely proportioned to the original penetration. Tables
3 and 4 exhibit this peculiarity with two examples of aged
asphalt properties, including the fracture properties, A and
n. The calculations of viscoelastic properties are repeated
for each year of the analysis in order to allow for aging of
the bitumen.
Program THERM, which makes up the main part of the
thermal cracking model, uses the viscoelastic properties of
the asphalt concrete obtained from the modified de Bats'
program. The inputs to THERM, apart from viscoelastic
properties, are the thickness and other properties of the
asphalt layer, daily temperatures, initial crack length,
volumetric concentration of aggregate, and others.
The fracture parameter, n, is estimated using
Schapery's formula (12) , as modified by laboratory
30

TABLE 2. Range of Variables Used to Develop Aging Equations
High Low
Original Penetration 239 61
Softening Point Ring and Ball Temperature, of 125 100
Time to Age,Months 118 5
31

TABLE 3. Predicted Aging of a Low Penetration Asphalt
Age of Pavement Months
6
18
30
42
54
66
78
90
102
Original Penetration at 77°F: 58 Original Softening Point: 124°F
Softening Fracture Parameters Penetration Point 77°F of A n
37 140 2.6xl0 -6 2.16
35 152 1.1xl0-6 2.36
34 157 7.1xl0-7 2.45
33 161 2.6xl0-7 2.67
33 164 2.0xl0-7 2.73
32 166 3.4xl0-7 2.62
32 167 2.8xl0-7 2.66
32 169 2.4xlO-7 2.69
31 170 2.1xl0-7 2.72
32

TABLE 4. Predicted Aging of a High Penetration Asphalt
Age of Pavement
IVlonths
6
18
30
42
54
66
78
90
102
Original Penetration at 77°F: 172 Original Softening Point: 106°F
Softening Fracture Parameters Penetration Point nOF of A n
80 118 6.2xl0-6 1.97
53 130 4.3xl0-6 2.05
41 135 3.6xl0-6 2.09
33 139 3.2xl0 -6 2.12
27 141 3.0xl0 -6 2.14
22 144 2.8xl0-6 2.15
20 145 2.6xl0-6 2.17
20 147 2.3xl0-6 2.19
20 148 2.1xl0-6 2.21
33

observations by Germann and Lytton (13):
n = 2 (1 + 1) b m (34)
The value of b used in Equation 34 is 2.5 so that calculated
values of n match laboratory observations of these values
(13, 14).
The parameter A in equation (1) is calculated directly
from
n = -0.69 - 0.511 log A (35 )
Equation 35 was developed from crack propagation testing of
asphalt concrete at the Texas Transportation Institute (14).
Calculations of fracture parameters are repeated each year
to allow aging of the bitumen.
For each day, the maximum and the minimum temperatures
of the asphalt concrete layer of the pavement, the change in
stress intensity factor, the number of cycles required to
extend a crack through the asphalt concrete layer, and the
two cumulative damage functions described below are computed
in the THERM program. The maximum and the minimum
temperatures of the asphalt concrete layer corresponding to
the maximum and minimum temperatures of the air are
determined using Barber's equations modified by Shahin and
McCullough (2), given as the Equations 5 through 11.
The stress intensity factor is calculated using the
34

Equations 4 and 14 through 20. These equations hold for
moduli of elasticity in the range of 10,000 to 100,000 psi.
The asphalt concrete is assumed to approach a glassy state
whenever the modulus of elasticity is above 100,000 psi; so
that the modulus no longer varies with temperature and the
calculations for ml through m4 are made using an E
value of 100,000 psi. The modulus used in this program is
an fective modulus computed from the viscoelastic
properties of the mix according to the power law theory
developed by Schapery (12) and assuming that the temperature
decreases linearly from the maximum to the minimum
temperature each day.
In the method developed herein to predict crack
frequency, two cumulative damage functions CMDG and CMDGl
are computed:
CMDG 1: 1
= j=l
N f . OJ
CMDGl = 1: N f · . j=l 1.J
where Nfo and Nfi represent the number of cycles
failure determined each day, j, by different methods.
The first of these, Nf " oJ is calculated as
(36)
(37)
to
the
number of thermal stress cycles such as experienced on day,
j, which will cause a crack to propagate from the current
crack depth all the way through the rest of the depth of the
asphalt concrete. The second
35
of these, Nf · ., 1J is

calculated as the number of thermal stress cycles such as
experienced on day, j, which will cause a crack to propagate
from its initial crack length through the entire depth of
the asphalt surface layer.
This is explained in more detail as follows. The
number of cycles to failure is given by Equation 2, for
which ways are now developed of determining all of the
needed elements:
where Co =
d =
.t1K =
A and n
d =1+1 c
o
dc A(.t1K)n
the initial crack
the thickness of
surface,
(2)
depth,
the asphalt concrete
the change in the stress intensity
factor at the crack tip from the time of
maximum temperature to the time of
minimum temperature, and
are fracture properties of the asphalt
mix.
If, rather than using the initial crack depth, Co'
is used then Equation 38 is the current crack depth, C c'
found: d dc
Nf = Ic A (!::'K) c ( 38)
36
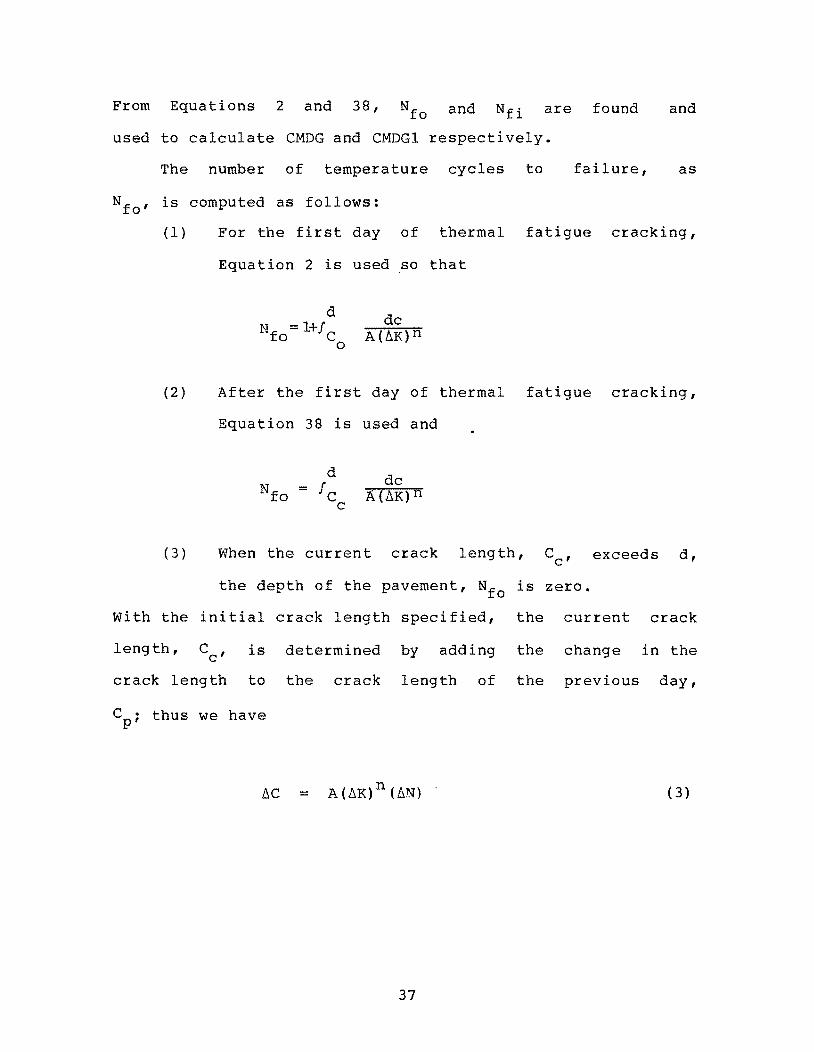
From Equations 2 and 38, Nfo and Nfi are found and
used to calculate CMDG and CMDGI respectively.
The number of temperature cycles to failure, as
Nfo ' is computed as follows:
(1) For the first day of thermal fatigue cracking,
Equation 2 is used so that
d Nf = 1+/ C
o 0
dc
(2) After the first day of thermal fatigue cracking,
Equation 38 is used and
dc
(3) When the current crack length, Cc ' exceeds d,
the depth of the pavement, Nfo is zero.
with the initial crack length specified, the current crack
length, C c' is determined by adding the change in the
crack length to the crack length of the previous day,
C . thus we have p'
/:::,c = (3)
37

where is the increase in the crack length and
~N is the number of temperature cycles per
day (assumed here to be 1.0 per day).
Now C can be found with c
where Cp
Obviously,
The
is
on
C c
the
the
number
=
crack length
first day, C = p
of temperature
of the previous
Co·
cycles to failure,
is computed only with the use of Equation 2, i.e.
dc =
which is calculated each day during the period of
analysis.
The calculation of CMDG, which uses Nf ., OJ
( 39)
day.
Nfi'
the
is
terminated when the crack breaks through the entire depth of
the asphalt surface layer whereas CMDG1, which uses
Nf · ., 1J is computed again each day during the entire
period of analysis. A third cumulative damage index, CMDG2,
is computed from CMDGl using its value on the day when the
crack length, computed by Equation 39, penetrates through
the entire depth of the asphalt surface layer. The equation
for CMDG2 is as follows:
CMDG2 = CMDGl [CMDG1]~ =d
c
38

These three cumulative damage indices are used in
verifying the mechanistic thermal cracking model in the next
chapter.
39

CHAPTER III
EMPIRICAL VERIFICATION OF THE
MECHANISTIC THERMAL CRACKING MODEL
The mechanistic thermal cracking model that has been
described in the previous chapter was run for thirty-two
Michigan pavements starting with the year of construction
and ending with the year cracking observations were
recorded. The data were collected and recorded by Novak
(17) • The Michigan data were gathered from thirty-two
highway segments ranging from 3.0 to 14.8 miles in length.
A mean cracking index I, the sum of the number of complete
transverse cracks and one-half the number of half transverse I
cracks per 500 ft. of roadway, was reported for each
section. Novak's report included the original asphalt
properties, the pavement surface thickness, bitumen
stiffness, and the age of the pavement at the time of
observations. The stiffness was reported for a loading time
of 20,000 seconds at the winter design temperature as
defined by Haas (6). The cracking which was reported was
observed during the late summer and fall of 1973. Table 5
presents the range of key variables reported by Novak. The
asphalt properties were obtained from construction records;
however, test results did not indicate locations within each
pavement where each particular asphalt was used and
equivalent data were not available for all projects. Novak
divided the state of Michigan into four environm~nta1 areas.
40

TABLE 5. Range of Important Variables Reported Relating to Transverse Cracks in Michigan (5).
Variable I High Low
Observed Cracking Index, I 21.20 0.00
Standard Deviation of Observed I at each site 6.70 0.00
Original Penetration at 77°F 243.00 60.00
Penetration Index +0.09 -0.84
Softening Point Ring and Ball Temperature °C 51.00 37.00
Thickness of Pavement, Inches 4.5 2.1
Age of Pavement, Years 12.00 1.00
Stiffness of Asphalt Concrete at Winter design Temperature and 20,000 2econds loading time (KG/em ) 300.00 13.00
41
-

The data collected for the Michigan Areas I, 2, 3, and 4 are
shown in the Table 6 and were used to run the model. The
ring and ball temperature, penetration index, and pavement
thickness were entered into the model for each of the
thirty-two Michigan pavements shown in Table 6, while
typical asphalt mix heat transfer characteristics, as
reported by
concentration,
Shahin (2),
C , v of 0.88,
and an aggregate volume
determined to be typical in
Michigan (17) were held constant. Table 7 presents the
asphalt concrete mix properties used to run this model for
analyzing the Michigan pavements. An initial crack length
of 0.2 inches is assumed for all of the Michigan cases. The
initial crack break-through predicted by the model is very
sensitive to the initial crack length selected. It is
possible that this initial crack length is related to the
size of the larger aggregates in the mix or surface
macrotexture.
Representative daily maximum and minimum temperatures
for each area were obtained on computer readable magnetic
tapes from the National Climatic Center in Asheville, North
Carolina. The tapes contained data for approximately
fourteen years prior to 1973. Such tapes are readily
available for locations throughout the United States; with
them, actual air temperatures closely approximating those to
which the pavements were subjected during their life could
be entered into the thermal cracking model.
42

TABLE 6. The Data Used to Run the t·1odel for Analyzing the Michigan pavements
A~6f~~e AYearl~ verag * Ring and Radiation Solar
No. of Ball Pavement Wind for July Radiation Serial Station Area Starting Years Temperature Penetra t ion Thickness Velocity (Langl eys (Langleys
No. 1.0. 1. D. Date to run (ee) Index ( in. ) (mph) /day) /day) -
1 1 4 680630 5 46 -0.64 2.1 10.3 519 308
2 2 4 670630 6 45 -0.39 2.5 10.3 '519 308 -- ---
3 3 4 690630 4 43 -0.38 2.5 10.3 519 308
4 4 4 690630 4 46 -0.44 2.5 10.3 519 308
5 7 3 700630 3 38 -0.36 3.3 9.0 518 272 --
6 8 2 670630 6 44 -0.26 2.5 9.6 498 283
7 9 2 690630 4 38 -0.25 2.5 9.6 498 283
8 10 2 670630 6 38 +0.09 2.5 9.6 498 283
9 11 1 710630 2 38 -0.40 2.5 8.3 498 333
10 12 2 720630 1 42 -0.25 2.5 9.6 498 283
11 13 1 670630 6 38 -0.02 2.5 8.3 498 333
12 14 2 690630 4 41 -0.56 2.8 9.6 498 283
13 15 2 640630 9 48 +0.07 3.3 9.6 498 283
14 16 3 680630 5 37 -1.18 2.5 9.0 518 272
15 17 3 650630 8 47 -0.45 2.5 9.0 518 272
16 18 3 680630 5 37 -0.18 2.5 9.0 518 272
. * 680630 means June 30, 1968

TA.B~E 6. The Data Used to Run the t~.odel for Analyzin.g the Michigan Pavements (Contld)
- . -- Average Yearly Solar Average
Ring and Radiation. Solar
No. of Ball Pavement Wind for July Radiation
Serial Station Area Starting Years Temperature Penetration Thickness Velocity (Langl eys (Langleys
No. LD. LD. Date to run (Oc) Index (i n. ) (mph) /day) /day) -
-
--
17 19 3 710630 2 43 -0.09 2.5 9.0 518 272 \
18 20 3 650630 8 46 -0;40 2.5 9,0 518 272
19 21 3 640630 9 42 -0.32 2.5 9.0 518 272 -
20 22 3 640630 9 41 -0.27 2.5 9.0 518 272
21 23 3 640630 11 51 -0.59 4.5 9.0 518 272
22 24 3 640630 12 51 -0.73 4.5 9.0 518 272
23 25 4 620630 11 49 -0.84 4.5 10.3 519 308
24 26 4 620630 11 50 -0.60 4.5 10.3 519 308
25 ' 27 4 610630 12 50 -0.61 4.5 10.4 519 308 ---
26 28 4 610630 12 50 -0.60 4.5 10.4 519 308 --
27 29 4 640630 9 50 -0.53 4.5 10.4 519 308
28 30 3 640630 12 50 )-0.61 4.5 9.0 518 272
29 31 3 640630 12 50 -0.56 4.5 9.0 518 272
30 32 3 640630 12 50 -0.56 4.5 9.0 518 272
31 33 3 640630 12 50 -0.56 4.5 9.0 518 272
32 34 3 640630 11 50 -0.53 4.5 9.0 518 272

Table 7. Asphalt Concrete Mix Properties Used to Run the Model for Analyzing Michigan Pavements.
Volumetric Concentration of the Aggregate, cv 0.88
Unit Weight of the Pavement, W, (lbs/cft) 140
Specific Heat, s, (BTU/lb, OF) 0.22
Thermal Conductivity, k, (BTU/ft2/hr, OF) 0.70
Surface Absorptivity to the Solar Radiation, b 0.95
45

The model was run for three cases for thirty-two
Michigan pavements starting with the year of construction
and ending with the year cracking observations were
recorded. Temperatures used by the model for each of the
computations of the CMDG~ using the results from the model
with aging (Case: 1), the model without aging (Case: 2),
and the model with no aging when Yc > 1.0 (Case: 3).
The calculated value of CMDG2 was related to observed
cracking through the application of regression analysis.
Both linear and log forms were investigated with the best
relationship including aging being
I = -2.18 + 2.14 (CMDG2), with R2 = 0.17. (40)
The standard error in observed cracking index through
application of the thermal cracking model and the above
equation was 5.2. Analysis on the Michigan data was
repeated without using the asphalt aging process in the
thermal cracking model; that is, with the initial asphalt
properties maintained throughout the analysis period. The
resulting relationship without aging considered is
1= -2.91 + 2.65 (CMDG2), with R2 = 0.40. (41)
46

TABLE 8. Computation of CMDG2 for Michigan Pavements Using the Results from the Model . (Case: 1, with Aging)
(1) (2) (3) (4) (5) (6) (7) (8) (9) (10)
Seria 1 Station Area No. of Observed Time to COMG COMG1 Ending COMG2 No. 1.0. 1.0. Years Cracking First at First at First COMGl (9)/{8)
Index, Crack Crack Crack I Break Break Break
Through Through Through (months)
1 1 4 5 0.7 46 7.4 0.890 1.049 1.18
.2 2 4 6 3.3 53 7.5 0.879 1.183 1. 35
3 3 4 4 0.0 - - - 0.829 1.00
4 4 4 4 0.1 - - - 0.778 1.00
5 7 3 3 0.0 20 6.9 0.896 1.242 1.39
6 8 2 6 0.1 31 19.6 0.894 2.328 2.60
7 9 2 4 1.0 20 8.5 0.962 1.960 2.04
8 10 2 6 0.3 31 6.3 0.926 2.552 2.76
9 11 1 2 0.0 - - - 0.374 1.00
10 12 2 1 0.0 - - - 0.329 1.00
11 13 1 6 0.4 55 15.4 0.900 1.167 1.30
12 14 2 4 3.4 20 15.2 0.915 1.784 1. 95
13 15 2 9 1.0 31 7.5 0.822 2.736 3.33
14 16 3 5 0.0 30 6.1 0.922 2.182 2.37
15 17 3 8 0.0 31 7.2 0.908 3.212 3.54
16 18 3 5 0.0 30 6.1 0.922 2.182 2.37

TABLE 8. (Continued)
(1) (2) (3) (4 ) (5) (6) (7) (8) (9) (10)
Serial Station Area No. of Observed Time to CDMG CDMGl Ending CDMG2 No. 1.0. 1.0. Years Cracking First at Fi rst at First CDMGl (9)/(8)
Index. Crack Crack Crack I Break Break Break
Through Through Through (months)
17 19 3 2 0.0 20 5.4 0.932 0.970 1.04
18 20 3 8 1.9 31 6.8 0.917 3.304 3.60
19 21 3 9 0.0 32 5.5 0.919 3.996 4.35
20 22 3 9 0.0 32 8.8 0.931 4.094 4.40 ---
21 23 3 11 2.6 32 6.1 0.717 2.417 3.37
22 24 3 12 5.4 32 60.3 0.723 2.559 3.54
23 25 4 11 1.0 31 7.4 0.719 2.833 3.94 ---------- - f-------------
_ 24 26 4 11 3.1 32 12.8 0.713 2.722 3.82
25 27 4 12 1.5 31 6.7 0.709 2.893 4.08
26 28 4 12 10.7 32 12.8 0.713 2.893 4.06
27 29 4 9 0.2 32 6.4 0.711 2.331 I 3.28
28 30 3 12 10.4 32 7.0 0.727 2.701 3.72
29 31 3 12 21.2 32 11.6 0.729 2.699 3.70 -
30 32 3 12 20.3 32 11.6 0.729 2.699 3.70
31 33 3 12 12.5 I 32 11.6 0.729 2.699 3.70 --
32 34 3 11 0.2 32 6.4 0.725 2.538 3.50

TABLE 9. Computations of CMDG2 for Michiga,n pavements Using the Results from the Model . . (Case: 2, without Aging) .
1) (2) (3) (4) (5) (6) (7) (8) (9) (10)
Serial Station Area No. of Observed Time to COMG CDMG1 Ending COMG2 No. LD. 1.0. Years Cracking Fi rst at First at First CDMG1 (9)/(8)
Index, Crack Crack Crack I Break Break Break
ThrouQh (months)
Through Through
1 1 4 5 0.7 - - - 0.895 1.00
2 2 4 6 3.3 - - - 0.763 1.00
3 3 4 4 0.0 - - - 0.423 1.00
4 4 4 4 0.1 - - - 0.622 1.00
5 7 3 3 0.0 - - - 0.406 1.00
6 8 2 6 0.1 41.30 6.520 0.927 2.012 2.17 -
7 9 2 4 1.0 - - - 0.773 1.00
8 10 2 6 0.3 - - - 0.916 1.00
9 11 1 2 0.0 - - - 0.082 1.00
I 10 12 2 1 0.0 - - - 0.154 1.00
"11 13 1 6 0.4 - - - 0.254 1.00
12 14 2 4 3.4 31.00 9.083 0.940 1.371 1.46
13 15 2 9 1.0 32.30 6.588 0.926 2.873 3.10
14 16 3 5 0.0 - - - 0.574 1.00
15 17 3 8 0.0 30.20 6.196 0.953 3.227 3.39
16 18 3 5 0.0 - - - 0.574 1.00

(J1
a
/
(1)
Serial No.
17
18
19
20
21
22
23
24
45
26
27
28
29
30
31
32
(2) (3)
Station Area LD. LD.
19 3
20 3
21 3
22 3
23 3
24 3
25 4
26 4
27 4
28 4
29 4
30 3
31 3
32 3
33 3
34 3
TABLE 9. (Continued)
(4) (5) (6)
No. of Observed Time to Years Cracking First
Index, Crack I Break
Through (mont:.hs )
2 0.0 -8 1.9 30.30
9 0.0 42.00
9 0.0 43.50
11 2.6 31. 75
12 5.4 31.30
11 1.0 55.50
11 3.1 56.00
12 1.5 54.50
12 10.7 54.50
9 0.2 66.50
12 10.4 32.00
12 21.2 32.30
12 20.3 32.30
12 12.5 32.30
11 0.2 32.30
-(7) (8) (9) (10)
CDMG CDMG1 Ending CDMG2 at Fi rst at First CDMG1 (9)/(8)
Crack Crack Break Break
Through Through
- - 0.499 1.00 - -
6.139 0.951 2.903 3.05
5.351 0.932 2.539 2.72
5.566 0.944 2.264 2.40
5.130 0.829 3.518 4.24
6.021 0.823 3.909 4.75
7.114 0.841 1.954 2.32
5.332 0.840 1.898 2.26
13.081 0.821 2.114 2.57
105.048 0.831 2.109 2.54
6.229 0.824 1.429 1. 73
6.017 0.834 3.688 4.42
6.911 0.830 3.665 4.41
6.911 0.830 3.665 4.41
6.911 0.830 3.665 4.41
5.057 0.829 3.378 4.07
(J1 .....
~-~
(1 )
Serial No.
1
.2
'3
.4
5
6
7
8
9
10
11
12
13
14
15
16
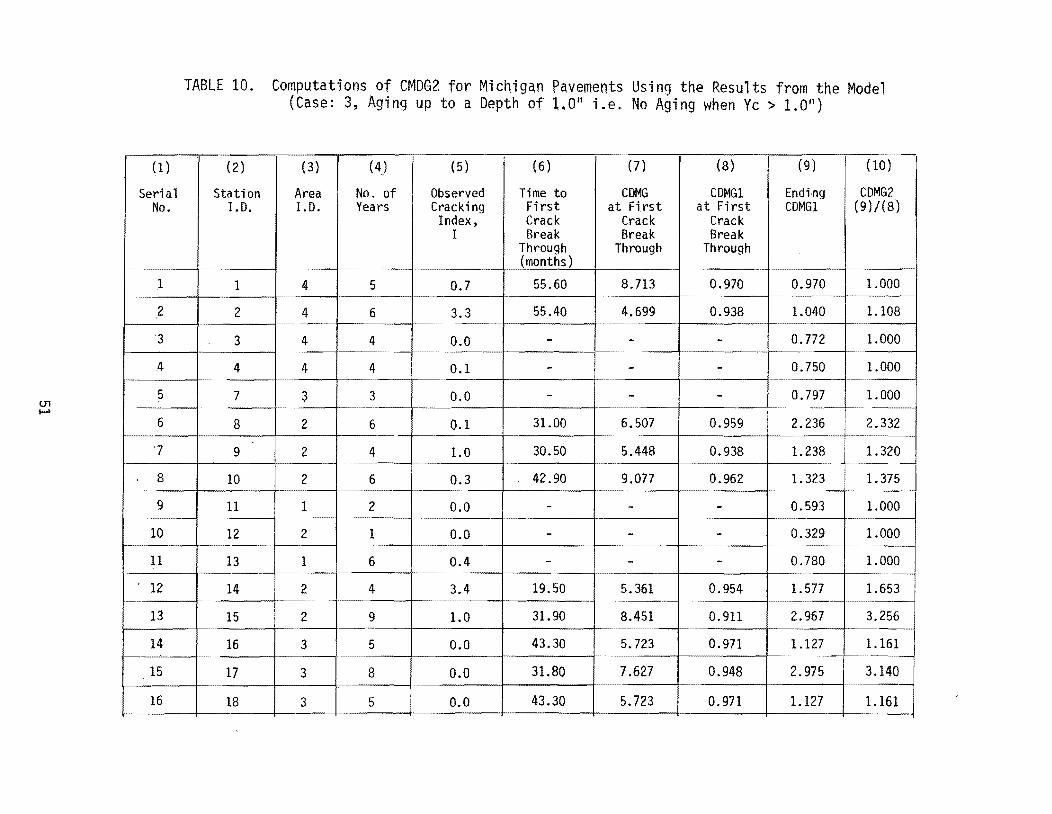
TABLE 10. Computations of CMDG2 for Michigan Pavements Using the Results from the Model (Case: 3, Aging up to a Depth of 1.0" i.e. No Aging when Yc > 1.0")
~~-
(2) (3) (4) (5) (6) (7) (8) (9) (10)
Station Area No. of Observed Time to COMG COMG1 Endi,ng COMG2 I. o. 1.0. Years Cracking First at First at First COMG1 (9 )/(8)
Index, Crack Crack Crack I Break Break Break
Through (months)
Through Through
1 4 5 0.7 55.60 8.713 0.970 0.970 1.000 --~
2 4 6 3.3 55.40 4.699 0.938 1.040 1.108 ----
3 4 4 0.0 - - - 0.772 1.000 ~-
4 4 4 0.1 - - - 0.750 1.000
7 3 3 0.0 - - - 0.797 1.000 ~-
8 2 6 0.1 31.00 6.507 0.959 2.236 2.332
9 2 4 1.0 30.50 5.448 0.938 1.238 1.320 --~
10 2 6 0.3 42.90 9.077 0.962 1. 323 1.375 ~-
--~~---
11 1 2 0.0 - - - 0.593 1.000 ~-----
12 2 1 0.0 - - - 0.329 1.000 ~-~
~-~ --~ ~-~
13 1 6 0.4 - - - 0.780 1.000 --
14 2 4 3.4 19.50 5.361 0.954 1.577 1.653 ~-~ ~-~
~-~
15 2 9 1.0 31.90 8.451 0.911 2.967 3.256 ----
16 3 5 0.0 43.30 5.723 0.971 1.127 1.161 ----
17 3 8 0.0 31.80 7.627 0.948 2.975 3.140 ~------
18 3 5 0.0 43.30 5.723 0.971 1.127 1.161

(J1
N
(1)
Serial No.
17
18
19
20
21
22
2J
24
25
26
27
28
29
30
31
32
(2)
Station LD.
19
20
21
22
23
24
25
26
27
28
29
30
31
32
33
34
(3) (4)
I Area No. of LD. Years
3 2
3 8
3 9
3 9
3 11
3 12
4 11
4 11
4 12
4 12
4 9
3 12
3 12
3 12
3 12
3 11
TABlE 10. (Continued)
(5 ) (6 ) (7) (8) (9) (10)
Observed Time to CDMG CDMG1 Ending CDMG2 Cracking First at F.i rst at First CDMGl (9)/(8)
Index, Crack Crack Crack I Break Break Break
Through Through Through (months)
0.0 - - - 0.801 1.000
1.9 31.60 4.996 0.952 2.772 2.912
0.0 31.60 8.654 0.976 2.678 2.~742
0.0 31.90 8.443 0.950 2.471 2.601
2.6 42.00 12.574 0.831 3.118 3.750
5.4 42.00 6.884 0.830 3.444 4.151
1.0 55.90 5.145 0.822 1.912 2.327
3.1 66.00 17.615 0.836 1.848 2.211
1.5 55.80 5.211 0.806 1. 975 2:450
10.7 55.80 5.071 0.805 1. 970 2.446
0.2 54.90 17 .025 0.819 1.521 1.856
10.4 32.30 6.059 0.826 3.266 3.956
21.2 32.60 5.941 0.833 3.196 3.838
20.3 32.60 5.941 0.833 3.196 3.838
12.5 32.60 5.941 0.833 3.196 3.838
0.2 32.60 6.148 0.833 2.989 3.590

In this case, the standard error in estimated crack index
was 4.4.
Finally, a third analysis was made assuming that the
asphalt ages only to a depth of one inch (=2.54 cm), which
is consistent with the observations of Jones (18). The
regression equations that resulted were
I = -2.66 + 3.06 (CMDG1) , for which R2 = 0.28
and the standard error was 4.9, and (42 )
I = -4.23 + 3.23(CMDG2), with R2 = 0.30 and the
standard error was 5.3. (43)
Equations 40, 41, 42, and 43 are reasonable: a greater
frequency of cracks is predicted with an increase in the
cumulative damage function and at the minimum allowable
value of CMDG2 = 1.0, neither of these equations predicts
cracking. The onset of cracking is predicted as CMDG2 grows
to slightly above 1.0. Standard errors in the predicted
crack index are below the standard error of 6.2 reported by
Haas in his empirical equation developed from observed
cracking on test roads in Canada (6). Haas' empirical
equation had a coefficient of determination, R2 = 0.82.
53

FURTHER ANALYSIS OF MICHIGAN DATA
The Michigan data reported by Novak (17) was run
through a regression search program, SELECT; in which the
observed cracking index, I, was the dependent variable, and
a total of eighteen independent variables were tried. The
resulting best equation is as follows:
I = 55.6 - 30.2(10g TR+B) - (3.53(10g P77))
+ (0.906A - 2.61) (log 8-1) (44)
where I is the sum of full transverse cracks
plus 1/2 of the number of half
transverse cracks per 500 feet of
roadway.
TR+B is the softening point ring and ball
temperature in C of the original
asphalt,
P77 is the penetration of the original
asphalt at 25 C in units of 0.1 mm,
A is the age of the pavement in years, and
S is the stiffness of the bitumen at the
winter design temperature and with
20,000 seconds loading time in
Kg/cm2 •
54

While the statistics for Equation 44 are remarkable,
R2 = 0.996 and a standard error in estimated I of 0.4,
some discussion of its applicability is necessary. The
coefficient on indicates
asphalt ring and ball temperature
that as
increases,
the
the
original
frequency
of cracking will drop. It is known that, for a given value
of penetration at 25 0 C, the asphalt temperature
susceptibility decreases when the ring and ball temperature
increases, which is consistent with Equation 44. The
equation also says that at higher penetrations, cracks will
be less frequent, as is expected for a softer asphalt. The
older the pavement, the more cracks are expected - again
reasonable. However, at ages of less than about three
years, the empirical equation says that increasing stiffness
gives fewer cracks. To maintain reasonable results, the
equation should not be used for pavements which are less
than three years old. Only three of the pavements in the
Michigan data base were of less than three years in age.
The model also fails to behave well when stiffness is below
10 kg/cm2 ; such low stiffness is outside the range for
which the model is based (see Table 5) and it should not
then be applied.
Comparing this empirical equation, Equation 44, with
the mechanistic thermal cracking equation described herein,
the following conclusions can be drawn.
55

(1) Both of the equations depend heavily upon the
original asphalt rheological properties and its temperature
susceptibility.
(2) Both of the equations are highly dependent on the
age of the pavement. The mechanistic equation only produces
cracking due to temperature cycling but the empirical
equation may account for other causes of cracking through
the age variable.
(3) The thickness of the pavement is important in the
mechanistic model while it did not appear in the empirical
equation. It should be noted that, in the Michigan data
used, age and thickness correlated highly because the
pavements were built thicker with time; the correlation
coefficient between these two variables was 0.83. Also, the
coefficient of age reported in this empirical model was
lower than the coefficient (0.906 vs 1.339) of an identical
variable in the Haas empirical equation. Because of these
considerations, the age variable may take into account the
effects of both the age and the pavement thickness on
observed cracking behavior.
(4) Temperature is considered in the empirical model
only through the stiffness at the winter design temperature
- a low temperature expected to be reached only for a few
hours during the coldest winters. The mechanistic model
considers daily temperatures, but most of its contribution
to the predicted cumulative damage occurs on only a few very
56

cold days during the year.
(5) The empirical equation has no consideration of the
asphalt concrete mix or agg~egate. It is only applicable
for mixes typical in Michigan. The mechanistic model
considers mix and aggregate properties through aggregate
volume concentrations and initial crack length.
(6) Both of the models are sensitive to the same
inputs. The empirical equation reproduces the data on which
it was based better than the mechanistic model reproduces
that data. However, the mechanistic model can be used for
conditions not necessarily similar to conditions in the
Michigan data base as it has a sound theoretical basis.
57

CHAPTER IV
DESIGN PROCEDURE FOR
THERMAL FATIGUE CRACKING
The mechanistic model is not directly applicable to the
design of individual roadway segments. It consumes large
amounts of computer time and requires very detailed
temperature data for its operation. A schematic diagram,
Figure 10, indicates the nature of the repetitive detailed
calculation necessary for the model. The mechanistic
thermal cracking model and the guide to the input data are
given in Appendix B. However, the mechanistic model could
be used by the individual highway departments to develop an
empirical
in their
equation
design equation suited to pavements and conditions
jurisdiction. The following empirical design
is developed for use in north Texas and is an
example of how the model may be used to develop other such
design equations for other regions in the United States.
The mechanistic model was run for eight locations, four
in Michigan and four in Texas. Quite large differences in
climatic conditions prevailed among the eight locations.
For each location, several runs (36 in all) were made with
variations in layer thickness, bitumen properties, and
asphalt concrete mix characteristics. These runs were made
using the aging predictions to a depth of I-inch within the
computations of the cumulative damage index and the crack
length. The results are given in Tables D-l through 0-8 in
58

INPUT
AC LAYER THICKNESS
BITUMEN AND MIX PROPERTIES
DAILY TEMPERATURES
! FATIGUE CONSTANTS
VISCOELASTIC PROPERTIES
- t----- ------1 TEMPERATURE OF PAVEMENT l
l I CHANGE IN STRESS INTENSITY FACTOR I >
L I ~ NUMBER OF DAYS FOR PAVEMENT TO CRACK I ~
I t ~ jl OUTPUT:" CUI\1ULATIVE DAMAGE FUNCTION I L-"-----~-.-------- _._--"_- ------... -1
Figure 10. Schematic Diagram of Mechanistic Thermal Cracking ~1odel.
59
Appendix D.
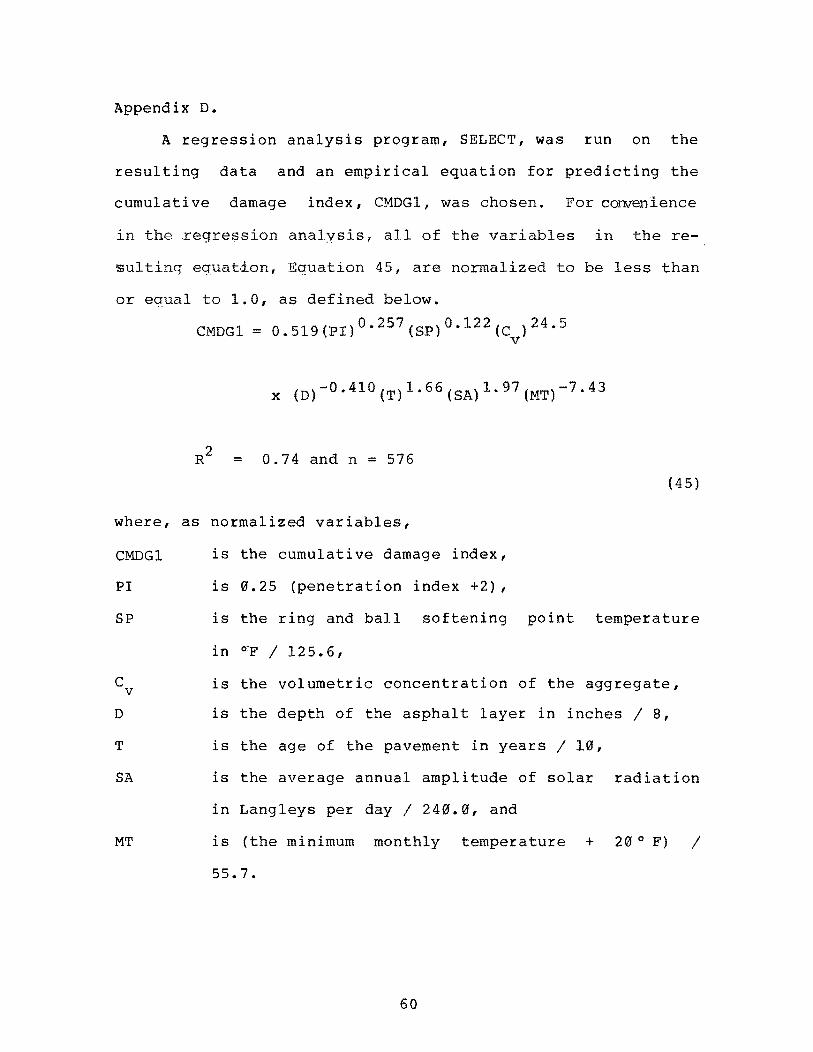
A regression analysis program, SELECT, was run on the
resulting data and an empirical equation for predicting the
cumulative damage index, CMDGl, was chosen. For corwenience
in the regression analysis, 1 of the variables in the re-
~ultinq equation, Equation 45, are normalized to be less than
or equal to 1.0, as defined below.
CMDGI - ° 5l9(PI)0.257 (Sp)0.122(C )24.5 - • v
x (D)-0.410(T)1.66(SA)1.97 (MT)-7.43
R2 = 0.74 and n = 576
(45 )
where, as normalized variables,
CMDGI
PI
SP
C v
D
T
SA
MT
is the cumulative damage index,
is 0.25 (penetration index +2),
is the ring and ball softening point temperature
in OCF / 125.6,
is the volumetric concentration of the aggregate,
is the depth of the asphalt layer in inches / 8,
is the age of the pavement in years / 10,
is the average annual amplitude of solar radiation
in Langleys per day / 240.0, and
is (the minimum monthly temperature + 20 0 F) /
55.7.
60

When the cumulative damage index, CMDGl, ~ 1.0, the first crack
appears in the pavement (13). If it is desired to use
Equation 45 in the design of a pavement, then the cumulative
damage index from Equation 45 can be substituted into
Equation 42, and a critical level of the crack index at a
specific age may be set. By trial and error, the mix
properties and depth of the pavement may be chosen to meet
the selected criteria. It is significant that the pavement
depth variable has a negative exponent, meaning that thicker
pavements will retard crack propagation better than will
thinner pavements - a fact that may explain why the Michigan
data indicated that pavements were built thicker with time
(and with experience). The large exponent of C, v 24.5,
makes it essential that no value of Cv should ever be
entered into Equation 45 which is outside the range used in
the regression analysis, i.e., 0.85 to 0.90. A similar
comment applies to the value of the minimum temperature
variable.
A computer program (19) for function optimization,
using pattern search and gradient, is modified to find the
optimum values of penetration index, PI, softening point
ring and ball temperature, SP, depth of asphalt concrete
layers, DF, and the volumetric concentration of aggregate,
Cv ' for given values of the age of pavement, T, the
average annual amplitude of solar radiation, SA, and the
minimum monthly temperature, MT. The inputs to this program
61

are the initial values of PI, SP, C v' and DF, and T, SA,
and MT. The lower and upper limits of PI, SP, C and v'
DF applicable to this model are
PI = -1. 00 to 2.00,
SP = 100.4 F to 125.6 F,
C = 0.85 to 0.90, and v
DF = 2.00 inches to 8.00 inches.
These limits are set within the program. The limits on the
surface course thickness, Df , are set between 2 and 8
inches so as to span the range of practical thicknesses that
are usually built with asphaltLc concrete. The equation can
be used to extrapolate to other values outside the range, if
such is desirable. However, because of the large exponent
on the C -term, it is usually advisable to remain within v
the range of 0.85 and 0.90. Using Equation 42 the value of
CDMGl is determined by setting the desired value of the
cracking index, I, at the end of a design period. As an
example, suppose I = 0.90, i.e.,
0.90 = -2.66 + 3.06 (CMDG1),
CMDGl = 1.163 = C.
Substituting the value 1.163 for C in Equation 45, the value
of the constant A0 is calculated for the given values of T,
SA, and MT. Using T = 10 years, SA = 215 Langleysjday, MT =
6 F for Michigan Area 2, A0 is determined as follows:
62
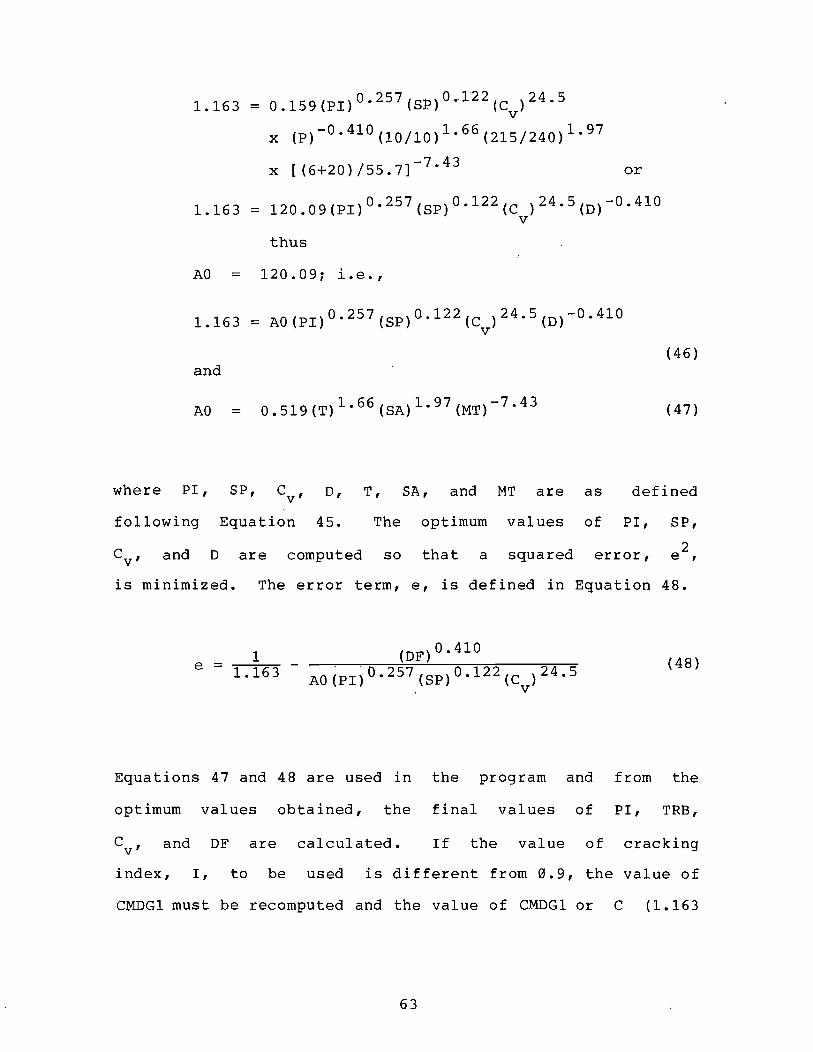
1.163 = 0.159(PI)0.257(sp)Or122(C )24.5 v
x (p)-0.4l0(10/10)1.66(2l5/240)1.97
x [(6+20)/55.7]-7.43 or
1.163 = l20.09(PI)0.257(Sp)0.122(C )24.5(D)-0.4l0 v
thus
AO = 120.09; i.e.,
1.163 = AO(PI)0.257 (Sp)O.122(C )24.5(D)-0.4l0 v
and
AO =
(46)
(47)
where PI, SP, CV
' 0, T, SA, and MT are as defined
following Equation 45. The optimum values of PI, SP,
and 0 are computed so that a squared error, 2 e ,
is minimized. The error term, e, is defined in Equation 48.
e = 1 (DF)0.410 (48)
1.163
Equations 47 and 48 are used in the program and from the
optimum values obtained, the final values of PI, TRB,
C, and OF are calculated. v If the value of cracking
index, I, to be used is different from 0.9, the value of
CMDGl must be recomputed and the value of CMDGl or C (1.163
63

in Equation 48) must be replaced by the new value.
This program was run for four locations in Michigan and four
locations in Texas, setting the value of C at either v
its lower limit of a.85 or its upper limit of a.9a to
determine the effect of various design inputs such as
minimum temperature, pavement age, and solar radiation upon
the optimum design thickness, DF, ring and ball softening
point, SP, and penetration index, PI. The results of these
example problems are given in Table 11.
For convenience in applying this design procedure in
Texas, the minimum temperature and solar radiation data for
Texas can be taken from maps given in Appendix E.
Table 11 shows that the optimum pavement thickness
varies between the limits of 2.a and s.a inches, and that
the thickness is very sensitive to the minimum temperature
and less so to changes in the design pavement life. This
sensitivity could be expected from a review of the exponents
in Equation 45. The higher exponents produce the greater
sensitivity of the variables, including the pavement
thickness and mix design variables in the equation. The
following list of variables is ranked in order of decreasing
sensitivity.
64

I
TABLE 11. Results of Pavement Design Program
-Location Problem Given Values Optimal Solutions
No.
SA T (Langleys MT
Cv (years) /day) (oF)
Michigan 1 0.85 10 240 10 Area 1 2 0.90 10 240 10 Michigan 3 0.85 10 215 6 Area 2 4 0.90 10 215 6
Michigan 5 0.85 10 226 7 Area 3 6 0.90 10 226 7 Michigan 7 0.85 10 223 16 Area 4 8 0.90 10 223 16 Dall as 9 0.90 10 181 35
10 0.85 20 181 25 11 0.90 20 181 25
El Paso 12 0.90 10 212 30 13 0.85 20 212 18 14 0.90 20 212 18
Abil ene 15 0.90 10 177 32 16 0.85 20 177 21 17 0.90 20 177 21
Amari 11 0 18 0.90 10 199 23 19 0.85 20 199 13 20 0.85 20 199 12 21 0.90 20 199 12
Cv = volumetric concentration of the aggregate T = age of pavement, years
PI (~~) 0.8 102
-1.0 100 -1.0 100 -1.0 100 -1.0 100 -1.0 100 1.5 125 0.75 110 2.0 125 2.0 125 2.0 125 2.0 125 2.0 125
-1.0 105 2.0 125 2.0 125 1.9 124 1.8 125 0.8 102
-0.1 104 -1.0 100
SA = average annual amplitude of solar radiation, Langleys/day MT = minimum monthly temperature, of
PI = penetration index (initially assumed value, 1.0)
Of (inches)
3.74 7.72 7.72 7.72 7.72 7.72 2.00 3.00 2.00 2.00 2.00 2.00 2.00 7.71 2.00 2.00 2.00 2.00 4.48 6.27 8.00
Error
7.2x10~5
0.50 0.21 0.70 0.085 0.67
-1.87 -5.8xlO-4
-22.0 -5.8 -0.77 -7.4 -0.52 2.6x10⁻⁵
-14.9 -2.6 2.1x10⁻⁵
-2.2 -2.6x10⁻⁴
2.4xlO-4
0.58
TRB = softening point ring and ball temperature (initially assumed value, 110°F)
Of = depth of asphalt layer (initially assumed value, 3.50 inches)
65
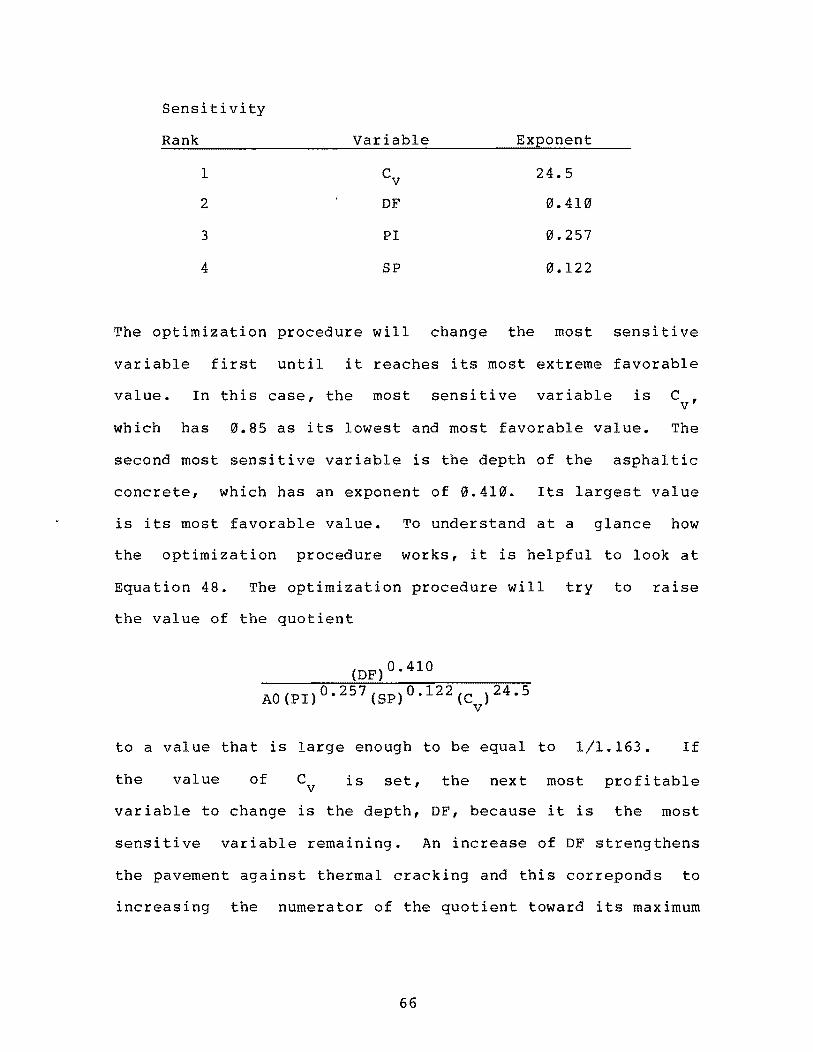
Sensitivity
Rank Variable Exponent
1 Cv 24.5
2 OF 0.410
3 PI 0.257
4 SP 0.122
The optimization procedure will change the most sensitive
variable first until it reaches its most extreme favorable
value. In this case, the most sensitive variable is C, v
which has 0.85 as its lowest and most favorable value. The
second most sensitive variable is the depth of the asphaltic
concrete, which has an exponent of 0.410. Its largest value
is its most favorable value. To understand at a glance how
the optimization procedure works, it is helpful to look at
Equation 48. The optimization procedure will try to raise
the value of the quotient
(OF)O.410
to a value that is large enough to be equal to 1/1.163. If
the value of C v is set, the next most profitable
variable to change is the depth, OF, because it is the most
sensitive variable remaining. An increase of OF strengthens
the pavement against thermal cracking and this correponds to
increasing the numerator of the quotient toward its maximum
66

value. The next most sensitive variable is the penetration
index, PI, which will be reduced toward its smallest value
because it is in the denominator. And, of course, a lower
penetration index
thermal cracking.
gives a pavement added resistance against
Similarly, the smallest value of the
softening point is its most favorable value.
If the climate is relatively mild, the pattern search
procedure will force the quotient toward its lowest value,
which is reached when DF=2.0 inches, PI=+2.0, and TRB=125 u F.
But even with these variables at their most unfavorable
values, the resulting quotient is a number that is larger in
magnitude than 1/1.63. Since the quotient has a negative
sign, the error calculated by Equation 48 is
number and the error term has a negative sign.
that even at its lower limits the pavement has
capacity to resist thermal cracking.
a negative
This means
an excess
It is seen in Table 11 that when a
reported, the design
least favorable values.
quantities are
In all areas
negative error is
at or close to their
in Michigan and in
Amarillo, Texas the climate was severe enough to cause the
program to seek a greater pavement depth. Once the design
period was changed to 20 years, one of the example problems
in El Paso reached a greater pavement thickness without
changing the softening point to its most favorable value.
In all of the areas where a milder climate prevails, the
pavement thickness that was determined by the pattern search
67
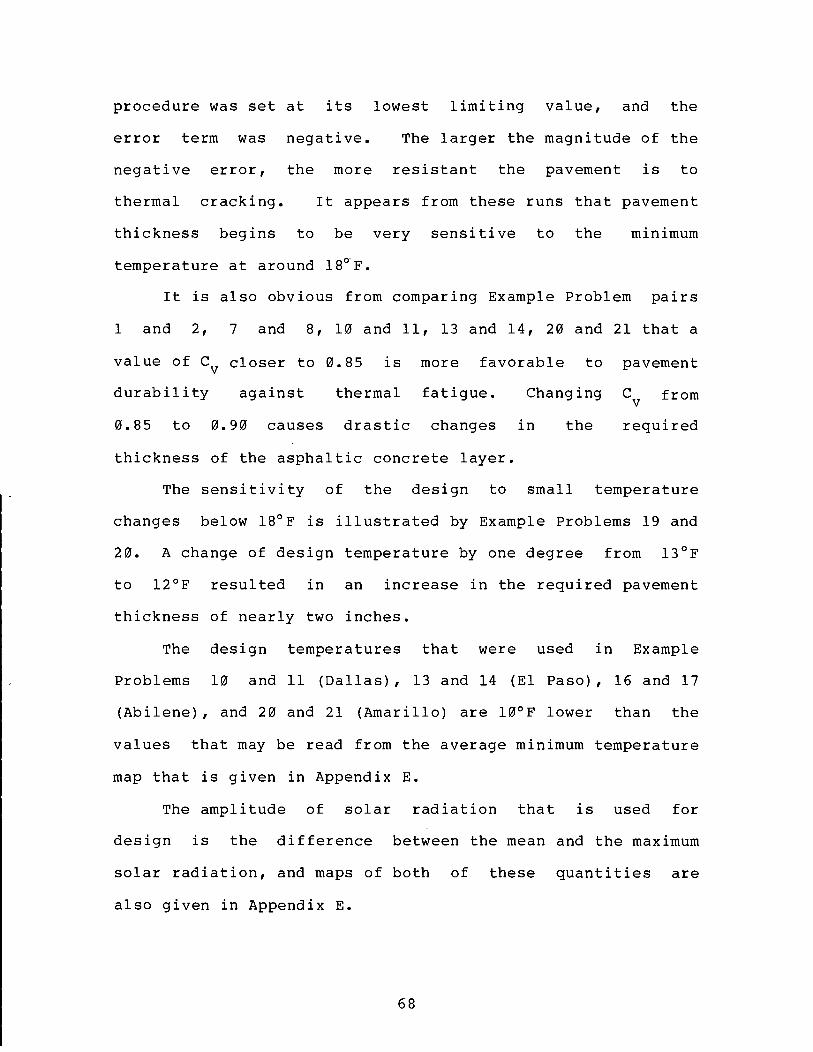
procedure was set at its lowest limiting value, and the
error term was negative. The larger the magnitude of the
negative error, the more resistant the pavement is to
thermal cracking. It appears from these runs that pavement
thickness begins to be very sensitive to the
temperature at around 18°F.
minimum
It is also obvious from comparing Example Problem pairs
1 and 2, 7 and 8, 10 and 11, 13 and 14, 20 and 21 that a
value of Cv closer to 0.85 is more favorable to pavement
durability against thermal fatigue. Changing
0.85 to 0.90 causes drastic changes in
thickness of the asphaltic concrete layer.
the
C v from
required
The sensitivity of the design to small temperature
changes below 18°F is illustrated by Example Problems 19 and
20. A change of design temperature by one degree from 13°F
to 12°F resulted in an increase in the required pavement
thickness of nearly two inches.
The design temperatures that were used in Example
Problems 10 and 11 (Dallas), 13 and 14 (El Paso), 16 and 17
(Abilene), and 20 and 21 (Amarillo) are 10°F lower than the
values that may be read from the average minimum temperature
map that is given in Appendix E.
The amplitude of solar radiation that is used for
design is the difference between the mean and the maximum
solar radiation, and maps of both of these quantities are
also given in Appendix E.
68

As the example problems in Table 11 illustrate, the
design program is very versatile. It can provide an optimum
mix design
concrete to
(i.e.,
resist
Cv '
thermal
PI, TRB )
cracking
of the asphalt
or it can be used to
calculate the depth of the asphalt layer that is required to
resist thermal cracking' assuming that the mix has already
been designed by other means to resist traffic stresses. In
fact, Equation 48, as it stands, can be used as a design
equation for the depth of the asphalt concrete if the mix
has already been designed. Alternatively, if a surface
course depth has already been selected, and a choice of
asphalt cements is available, Equation 48 can be used to
determine which asphalt will provide the best resistance to
thermal cracking.
69

CHAPTER V
CONCLUSIONS
A mechanistic model based on fracture mechanics has
been developed to predict temperature cracking of asphalt
concrete pavement. The standard errors in the cracking
index, I, from the application of the model described herein
are smaller than those that were computed in the development
of other design equations and models (6). Two real
advantages exist for the mechanistically based approach over
those that are probabilistic or empirical.
(1) Mechanistic models can be more readily transferred
from situation to situation than can empirical
models. Empirical models are restricted to
situations or conditions close to those from which
they were derived.
(2) Mechanistic models can be improved by giving
consideration to more or different variables and
conditions.
There are four areas of further development which could
prove to be valuable in improving the model reported here.
(1) This fracture mechanics based model considers
only one mode of crack generation. The crack is
assumed to begin at the surface and progress
downward through the asphalt concrete.
Considerable work has been done on a different
mode of failure (3, 4, 20) in which a crack begins
70

in stiff base course materials and reflects upward
through the surface. A model developed to predict
such a mode of failure could be combined with the
one described here and the prediction of crack
frequency would be from the accumulated
contributions of both modes of failure.
(2) In its present form, the model described here
gives no consideration to residual stresses or to
healing. Cracks are predicted to develop as the
pavement temperature drops. However, when the
temperature returns to a higher level, the cracks
will close and may heal due to the residual
stresses that develop (21). No authoritative work
allowing inclusion of the healing process in a
mechanistic model of asphalt concrete is known to
be available.
(3) More work is needed on the prediction of aged
rheological properties of bitumen.
(4) The current methodology for calculating the
fracture parameters A and n from the slope of the
relaxation modulus curve can, and should, be
developed further. Fracture properties of aged
asphalt concrete pavement should be measured in
the laboratory to permit confirmation or revision
of the aged properties that are predicted by the
model.
71

The pavement thermal cracking model which was developed
in this report is based on fracture mechanics and thermal
stresses calculated with viscoelastic theory. Despite its
sophisticated basis in mechanics, the model is easy to use
since it requires very simple input data on the properties
of the mix and pavement thickness. It generates all of the
required time and temperature dependent properties
internally by using a numerical form of Van der Poel's
nomograph. The verification that has been done by comparing
predictions made with this program with observed thermal
cracking data has shown that the program is a reasonably
reliable prediction tool and recommends its further use in
the analysis of pavements subjected to thermal cracking.
This report has described the use of this model to
develop a design procedure for asphaltic concrete pavements
to resist thermal cracking, and has presented several design
examples which illustrate how the computerized design
procedure works, and how sensitive it is to several climatic
and material property variables.
72

REFERENCES
1. Marker, V., "Introductory Statement of the Problem,
Symposium Non-Traffic Load Associated Cracking of
Asphalt Pavements," Proceeding of the Association of
Asphalt Paving Technologists, Minneapolis, Minnesota,
Vol. 35, 1966, pp. 239-247.
2. Shahin, Mohamed, Y., and B. Frank McCullough,
"Prediction of Low-Temperature and Thermal-Fatigue
Cracking in Flexible Pavements," Research Report No.
123-14, Highway Design Division Texas Highway
Department, Texas Transportation Institute, Texas A&M
University, Center for Highway Research, The University
of Texas at Austin, August, 1972, 225 p.
3. Chang, Hang-Sun, Lytton, R. L., and
"Prediction of Thermal Reflection
Carpenter,
Cracking
S.
in
H. ,
West
Texas," Research Report No. 18-3, Texas Transportation
Institute, Texas
Texas, March 1976.
A&M University, College Station,
4. Carpenter, S.H., and Lytton, R.L., "Thermal Pavement
Cracking in West Texas," Research Report l8-4F, Texas
Transportation Institute, Texas A&M University, College
Station, Texas, October 1977.
5. Barber, E.S.,
Temperature from
Highway Research
1-8.
"Calculation of Maximum Pavement
Weather Reports," Bulletin 168,
Board, Washington, D.C., 1957, pp.
73

6. Haas, R.C.G., "A Method for Designing Asphalt Pavements
to Minimize Low-Temperature Shrinkage Cracking,"
Research Report 73-1 (RR-73-1), The Asphalt Institute,
College Park, Maryland, January 1973, 91 p.
7. Rauhut, J. B., and P. R. Jordahl, "Effects on Flex ible
Highways of Increased Legal Vehicle Weights Using
VESYSIIM" Report No. FHWA-RD-77-116, Federal Highway
Administration, Office of Research and Development,
Washington, D.C., January, 1978, 203 p.
8.
9.
Paris, P., and F. Erdogan,
Crack Propagation Laws,"
"A Critical
Transactions
Analysis of
of the ASME
Journal of Basic Engineering, Series D, Vol. 85, No.
4, December, 1963, pp. 528-534.
Barenblatt, G.I.,
Equilibrium Cracks
liTher Mathematical Theory of
in Brittle Fracture," Advances in
Applied Mechanics, Vol. VII, Academic Press, 1962, pp.
55-129.
10. Van der Poel, C., "A General System Describing the
Viscoelastic Properties of Bitumens and Its Relation to
Routine Test Data," Journal of Applied Chemistry, Vol
4, May, 1954.
11. de Bats, F.Th., "External Report The Computer Programs
PONOS and POEL," AMSR. 0008.72, January, 1972.
12. Schapery, R.A., "A Theory of Crack Growth in
Viscoelastic Media," Research Report MM2764-73-1,
Mechanics and Materials Research Center, Texas A&M
74
13.
University, March, 1973.
Germann, F.P., and Lytton, R.L.,
Predicting the Reflection Cracking
Concrete Overlays," Research Report
"Methodology for
Life of Asphalt
207-5, Texas
Transportation Institute, Texas A&M University, College
Station, Texas, March, 1979.
14. Pickett, D.L., "Laboratory Evaluation of Selected
Fabrics for Reinforcement of Asphaltic Concrete
Overlays," Unpublished Master's Thesis, Texas A&M
University, College Station, Texas, May, 1981.
15. Yoder, E.L, and Witczak, M.W., "Principles of Pavement
Design," Second Edition, John Wiley & Sons, Inc., 1975.
16. Benson, Paul E., "Low Temperature Transverse Cracking
of Asphalt Concrete Pavements in Central and West
Texas," Research Report No. 175-2F, Texas
Transportation Institute, Texas A&M University,
September, 1976.
17. Novak, E.C., Jr., "Evaluation of a Model for Predicting
Transverse Cracking of Flexible Pavement," Testing and
Research Division, Michigan Department of State
Highways and Transportation, Report No. R-975, Lansing,
Michigan, February, 1976, 32 p.
18. Jones, G.M. , "In Situ Recycling of Asphaltic
Pavements," 15th Paving Conference, Department of Civil
Engineering, University of New Mexico, Albuquerque, New
Mexico, January, 1978.
75
19. Augustine, Yelto R., "Computer Program for Function
Optimization using Pattern Search and Gradient,"
unpublished Master of Science Thesis, Texas A&M
University, College Station, Texas, 1968.
20. Carpenter, S.H., and Lytton, R.L., "Thermal Activity of
Base Course Material Related to Pavement Cracking,"
Research Report 18-2, Texas Transportation Institute,
Texas A&M University, College Station, Texas, December,
1975.
21. Yandell, W.O., and Lytton, R.L., "Residual Stresses Due
to Traveling Loads and Reflection Cracking," Research
Report 207-6, Texas Transportation Institute, Texas A&M
University, College Station, Texas, June, 1979.
76

APPENDIX A
Sample Calculations for
Change of Pavement Temperature
A-I

TABLE M.
METRIC CONVERSION FACTORS
Symbol
in It yd mi
oz Ib
tsp ThsP flol C
pt qt gal fts yd'
Approximate Conversions to Motric Measures
When You Know
inches feet yards miles
square in~hes square feet lIquare yards square miles acres
ounces pounds short ton.
{20001bl
Multiply by
LENGTH
"2.5 30
0.9 1.6
AREA
6.5 0.09 0.8 2.6 0.4
MASS (weight)
28 0.45 0.9
To Find
centimeters centimeters meters kilometers
square centimeters square mjlters square meters square kilometers hectares
grams kilO1lrams tonnes
Symbol
cm cm m km
g kg
-----.... -
G> -
VOLUME _
tll<lspoonl table5Poons fluid ounces cups pint. quarts gallons cub,c feet cubic yards
5 15 30
0.24 0.47 0.95 3.8 0.03 0.76
milliliters milliliters milliliters liters liters liters liters cubic meters cubic meters
TEMPERATURE (exact)
Fahrenheit temperatur,
5/91aft. subtracting 321
Celsius temperature
ml ml ml I I I I m' mS
Co) _
., in· 2.54 {e".~tly). For other exact conversions and more detailed tables. see NBS Misc. Pub!. 28G. Unill of Weighl$ and Measures. Price $2.2&. SO c"talog No. C13.10;286.
= -
M N
o N
dI ... co ... ,.. ...
., ... M .. N ... -...
...... ~ = ----;; ==
., M
Symbol
mm em m m km
g kg
ml I I I m' m'
Approximate Conversions from Metric Mealures
When You Know
millimeters centimeters meters met .... kilometers
square centimeters square meten squate kilometer, hectares 110.000 ma,
Multiply by
LENGTH
0.04 0.4 3.3 1.1 0.6
AREA
0.16 1.2 0.4 2.5
To Find
Inches inches feet yards miles
square inches square yards square miles acres
MASS (weight)
grams kilograms tonnes 11000 kg)
millilitaf'l liters liters liters cubic meters cubic melers
0.035 2.2 1.1
VOLUME
0.03 2.1 1.06 0.26
35 1.3
ounces pounds short Ions
fluid ounces pint$ quarts gallons cubic f .... t cubic yard$
TEMPERATURE (exact)
Celsius temperature
32
• ~ 'f! '14~ I 1 ·20 0
9/5 (then add 32)
Fahrenheit temperature
i I it II 20 40 60 80
37
Symbol
in in ft yd mi
in' yd' mi'
oz Ib
floz pt qt gal ft' yd'

Sample calculation for determining the change in pavement temperature,
~T, and thermal tensile stress,
Stress-free temperature, T = 75°F o Maximum change in air temperature, TR, below the stress-free temperature
= 150°F;
Mean air temperature, TA = 1/2(75 + (75-150)) = O°F
Thickness of surface course (asphalt concrete) = 211
The following values are used for the investigation:
Thermal conductivity, k = 0.80 BTU/ft2/hr, of
Specific heat, s = 0.22 BTU/lb, of
Unit weight of surface course, w = 146 lbs/cft
l.Jind velocity, V = 10 mph
Maximum solar radiation, l = 500 Langleys/day
Minimum solar radiation, L = 100 Langleys/day
Surface absorptivity to the solar radiation, b = 0.95
Coefficient of thermal activity of the surface course, CI. = 1.35xl0-5
jDF
Sample calculation to find maximum pavement temperature, Tmax , at the
surface of the r:>avement; i .. ep < at x=O(Figure 4a)
c = k 0.80 _ 2/h sw = 0.22 x 146 - 0.02491 ft r"
C = (0.lc31 )1/2 = 2.29325,
h ~ 1.3 + 0.62 v3/ 4 = 1.3 + 0.62(10)3/4 = 4.7865,
R 2 b x (3·26!L) 1 2 x 0.95 x (3.69 x 500) x 1 = 10 17184 and = 3" x x 11 = 3" 24 4.7856 . ,
A-3
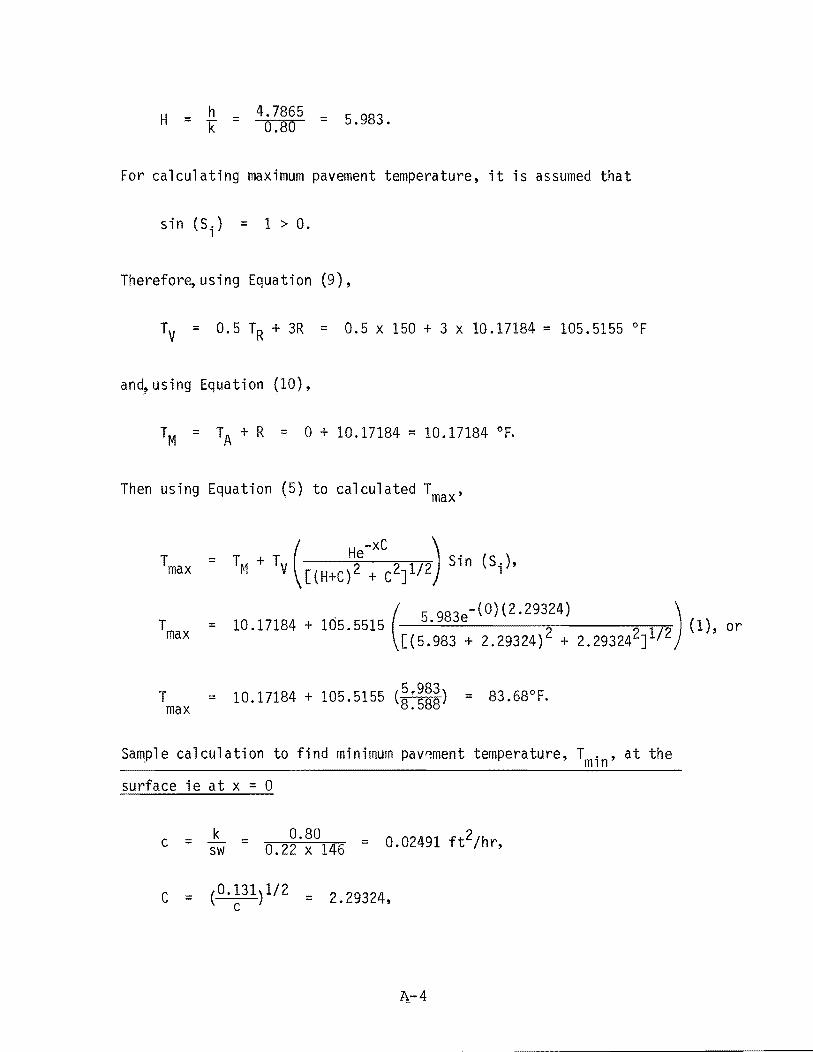
H = h = 4.7865 = K 0.80 5.983.
For calculating maximum pavement temperature, it ;s assumed that
sin (Si) = 1 > O.
Therefore,using Equation (9),
TV = 0.5 TR + 3R = 0.5 x 150 + 3 x 10.17184 = 105.5155 of
and? using Equation (10),
TM = TA + R = 0 + 10.17184 = 10.17184 of.
Then using Equation (5) to calculated Tmax '
T = T + T ( He-xC ) Sin (S ) max M V [(H+C}2 + C2J1/2 i '
T = 10.17184 + 105.5515 5.983e (1), or (
-(0}(2.29324) )
max [(5.983 + 2.29324)2 + 2.293242J1/2
T = 10.17184 + 105.5155 (~:~~~) = 83.68°F. max
Sample calculation to find minimum pav~ment temperature, Tmin , at the
surface ie at x = 0
c = sw k = 0.80 =
0.22 x 146 0.02491 ft2/hr,
A-4

h = 1.3 + 0.62 V3/~
h = 1.3 + 0.62 (10)3/~
h = 4.7865,
R ~ x b x (3 '26!L) 1 = x h' 3
R = 2 x 0.95 x (3.692~ 100) 1 x 4.7865'
R = 2. 03437 ,
H h 4.7865 and = k = 0.80 ,
H = 5.983.
For calculating minimum pavement temperature, it is assumed tha~
sin (S.) = -1 < 0 1
Therefore using Equation (lD,
TV = 0.5 TR,
TV = 0.5 x 150, or
TV = 75°F.
an~ using Equation ( 12) ,
TM = TA + 0.5 R,
TM = 0 + 0.5 x 2.03437,
TM = 1.01718°F.
By using equation (5) for calculating Tmin,
A-S
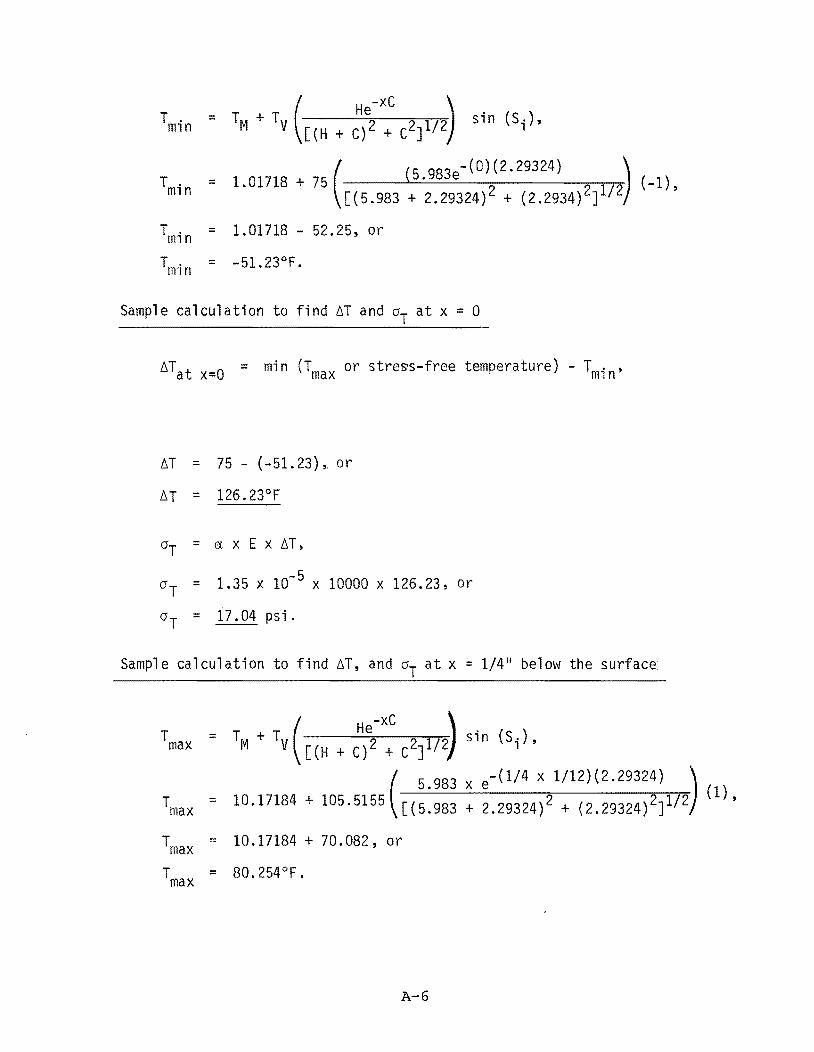
T . mln = TM + TV( He2-xc
2172\ sin (S;), [(H + C) + C J )
= 1.01718 + 75 (5.983e (-1) (
-(0}(2.29324»)
[(5.983 + 2.29324)2 + (2.2934)2J1/2 '
= 1.01718 - 52.25, or
Sample calculation to find ~T and at x = 0
~Tat x=o = min (Tmax or stress-free temperature) - Tmin ,
~T = 75 - (-51.23) ,. or
~T = 126.23°F
crT = a,xEx~T,
crT :: 1.35 x 10-5 x 10000 x 126.23, or
crT 17.04 psi.
Sample calculation to find ~T, and at x = 1/411 below the surface
= TM + TV( He2-xc
21/2' sin (Si)' [(H + C) + C J 1
( 5.983 x e-(1/4 x 1/12)(2.29324) ) (1)
= 10.17184 + 105.5155 [(5.983 + 2.29324)2 + (2.29324)2J1/2 '
- 10.17184 + 70.082, or
A-6

( He-xC ) T . = TM + TV 2 2 1/2 sin (S;), mln [(H+C) +CJ
T . mln = 1.01718 + 75 . e ( (5 983) -(1/4 x 1/12)(2.29324) ~
[{5.983 + 2.29324)2 + (2.29324)2J1/2 (-1),
T . = 1.01718 - 49.814, or mln T . m~n
= -48. 7968°F.
l!.T = (Tmax or 75°F (whichever is smaller) - T . ), mln
l!.T = 75 - (-48.7968),
l!.T = 123.7968, or
l!.T = 123. 80°F.
A-7

TABLE AI. Calculated Values of aT and ~T
Depth Daily Air Temperature !oailY Air Temperature !Daily Air Temperature Range, T , below Stress Range, T , below Stress Range, TR, below Stress
Below Free Tem~erature = 50°F Free Tem~erature = 100°F Free Temperature == 150°F
Surface ~T aT for ~T aT for ~T aT for
E = 10,000 psi E = 10,000 psi E = 10 ,000 psi {i n} { oF} (psi) (OF) (psi) {oF} (psi)
0.00 41.40 5.589 83.82 11.320 126.23 17.040
0.25 40.59 5.480 82.19 11. 096 123.80 16.700
0.50 39.81 5.374 80.64 10.890 121.47 16.400
0.75 39.07 5.275 79.17 10.690 118.13 15.947
1.00 38.37 5.180 77.76 10.500 113.04 15.260
1. 25 37.70 5.090 76.42 10.320 108.20 14.600
1.50 37.06 5.003 75.13 10.143 103.58 14.000
1. 75 36.45 4.921 73.92 9.979 99.17 13.388
I 2.00 35.87 4.843 71. 20 9.613 94.97 12.822
2.25 35.31 4.767 68.31 9.222 90.97 12.280
2.75 34.28 4.628 62.92 8.494 83.51 11. 274
3.25 33.34 4.501 58.02 7.833 76.74 10 .360
3.50 32.91 4.443 55.74 7.525 73.59 9.935
3.75 32.49 4.386 53.57 7.232 70.59 9.529
4.25 31. 72 4.282 49.52 6.686 64.99 8.774
4.75 31.01 4.186 45.84 6.188 59.90 8.086
5.00 30.68 4.143 44.13 5.958 57.53 7.767
5.75 27.85 3.760 39.46 5.327 51.07 6.895
6.75 24.60 3.321 34.19 4.616 43.78 5.910
A-a

TABLE A2. Calculated Values of Thermal Tensile Stress, crT' for 2" Thickness of Surface Course.
Therma 1 Tens i1 e Stress, crT (ps i)
Depth Daily Air Temperature Daily Air Temperature Daily Air Temperature Range, TB' below Stress Range, T , below Stress Range, T , below Stress
Below Free Tem erature = 50°F Free Tem~erature = 100°F Free Tem~erature = 150°F·
Surface Modulus of Elasticity, Modulus of Elasticity, Modulus of Elasticity, E (ps 1) E (psi) E (psi)
( in) 10,000 100,000 10,000 100,000 10,000 100,000
0.0 5.589 55.89 11.320 113.20 17 .040 170.40 0.25 5.480 54.80 11.096 110.96 16.700 167.00 0.50 5.374 . 53.74 10.890 108.90 16.400 164.00 0.75 5.275 52.75 10.690 106.90 15.947 159.47 1.00 5.180 51.80 10.500 105.00 15.260 152.60 1.25 5.090 50.90 10.320 103.20 14.600 146.00 1.50 5.003 50.03 10.143 101.43 14.000 140.00

TABLE A3. Calculated Values of Thermal Tensile Stress, crT' for 4" Thickness of Surface Course.
Thermal Tensile Stress, crT (psi)
Depth Daily Air Temperature Daily Air Temperature Daily Air Temperature Range, T~, be10w Stress Range, T , below Stress Range, T , below Stress
Below Free Tern erature = 50°F Free Tem~erature = 100D F Free Tem~erature = 150D F·
Surface Modulus of Elasticity, Modulus of Elasticity, Modulus of'Elasticity, E (psi) E (ps;) E (psi)
(; n) 10,000 100,000 10,000 100,000 10,000 100,000
0.00 5.589 55.89 11. 320 I- 113.20 17 . 040 170.40 0.75 5.275 52.75 10.690 106.90 15.947 159.47 1.25 5.090 50.90 10.320 103.20 14.600 146.00 1. 75 4.921 49.21 9.979 99.79 13.388 l33.88 2.25 4.767 47.67 9.222 92.22 12.280 122.80 2.75 4.628 46.28 8.494 84.94 11. 274 112.74 3.25 4.501 45.01 7.833 78.33 10.360 103.60

)
r'
TABLE A4. Calculated Values of Thermal Tensile Stress, crT' for 811 Thickness of Surface Course.
Thermal Tensile Stress, aT (psi)
Depth Daily Air Temperature Daily Air Temperature Daily Air Temperature Range, T~, below Stress Range, T , below Stress Range, T , below Stress
Below Free Tern erature = 50°F Free Tem~erature = 100°F Free Tem~erature = 150°F,·
Surface Modulus of Elasticity, Modulus of Elasticity, Modulus of Elasticity, E (ps i) E (psi) E (psi)
(i n) 10,000 100,000 10,000 100,000 10,000 100,000
0.00 5.589 55.89 11. 320 113.20 17.040 170.40 0.75 5.275 52.75 10.690 106.90 15.947 159.47 1. 75 4.921 . 49.21 9.979 99.79 13.388 133.88 2.75 4.628 46.28 8.494 84.94 11.274 112.74 3.75 4.386 43.86 7.232 72.32 9.529 95.29 4.75 4.186 41.86 6.188 61.88 8.086 80.86 5.75 3.760 37.60 5.327 53.27 6.895 68.95 6.75 3.321 33.21 4.616 46.16 5.910 59.10

TABLE A5. Calculations for the Corrected Stress Intensity Factor, K1, for d = 211
, and TR = 50°F
_.
Elastic Crack Computed Correction Corrected Modulus Length Stress Factor Stress
E Yc Intensity CK Intensity (psi) (inches) Factor
(lb_in-3/ 2) Factor
K1 K1=K1+C K (lb_in- 3/ 2) (lb_in-3/ 2)
0.50 -6.4687 4.3720 -2.0937
0.75 -7.2436 4.2880 -2.9556
1.00 -6.2624 4.2090 -2.0534 10,000
1.25 -6.6953 4.1320 -2.5633
1. 50 -6.3662 4.0610 -2.3052
1. 75 -2.5938 3.9910 1.3972
0.50 9.0309 43.7200 52.7509
0.75 11.0447 42.8800 53.9247
100,000 1.00 41. 2181 42.0900 83.3081
1.25 59.6755 41.3200 100.9955
1.50 72.2146 40.6100 112.8246
1. 75 84.6702 39.9100 124.5802
A-12
-

TABLE A6. Calculations for the Corrected Stress Intensity Factor, K1, for d=2", and TR = lOO°F
Elastic Crack Computed Correction Corrected Modulus Length Stress Factor Stress
E Vc Intensity CK Intensity ( psi) (inches) Factor
(lb_in-3/ 2) Factor
K1 K1 =K1+CK (lb_in-3/2) (lb_in-3/2)
0.50 -4.4071 8.8530 4.4459
0.75 -5.0805 8.6890 3.6085
1.00 -2.0683 8.5290 6.4607 10,000
1.25 -1. 7716 8.3780 6.6064
1.50 -0.5403 8.2340 7.6937
1. 75 6.0588 8.0930 14.1518
0.50 34.0312 88.5300 122.5612
0.75 37.6344 86.8900 124.5244
1.00 99.1391 85.2900 184.4291 100,000
1.25 136.1290 83.7800 219.9090
1.50 i
161. 9470 82.3400 244.2870
1. 75 I
188.9340 80.9300 269.8640

TABLE A7. Calculations for the Corrected Stress Intensity Factor~ K1, for d = 211
, and TR = 150°F
Elastic Crack Computed Correction Corrected Modulus Length Stress Factor Stress
E y Intensity CK Intensity ( psi) c Factor Factor (inches)
K1 (lb_in-3/ 2) K1 =K1+CK (lb_in-3/ 2) (lb_in-3/ 2)
0.50 -2.3497 13.3250 10.9753
0.75 -2.9206 13.0850 10 .. 1644
1.00 -2.0684 12.7240 10.6556 10,000
1.25 2.9218 12.1760 10.6556
1.50 4.8132 11. 6490 15.0978
1. 75 13.7054 11.1700 24.8754 i
0.50 58.9811 133.2500 192.2311
0.75 64.1846 130.8500 195.0346
100,000 1.00 156.2400 127.2400 283.4800
1.25 208.9020 121.7600 330.6620
1.50 244.3250 116.4900 360.8150
1. 75 281.2120 111.7000 392.9120
A-14

TABLE A8. Calculations for the Corrected Stress Intensity Factor, K1, for d = 4", and TR = 50°F
Elastic Crack Computed Correction Corrected Modulus Length Stress Factor Stress
E \ Intensity CK Intensity (psi) (inches) Factor
(lb_in-3/ 2) Factor
K1 K1 =K1+CK (lb_in- 3/2) Clb_in-3/ 2)
i
1.00 -2.1757 4.2090 2.0333
1.50 -1. 1703 4.0610 2.8907
2.00 -0.8333 3.9260 3.0927 10,000
2.50 -0.1840 3.8040 3.6200
3.00 -0.5361 3.6930 3.1569
3.50 0.4871 3.5910 4.0781
1.00 47.5878 42.0900 89.6778
1. 50 78.6993 40.6100 119.3093
100,000 2.00 102.6050 39.2600 141.8650
2.50 126.7460 38.0400 164.7860
3.00 164.5010 36.9300 201.4310
3.50 185.3530 35.9100 221.2630
A-IS

I
TABLE A9. Calculations for the Corrected Stress Intensity Factor, Kp for d = 411, and TR = lOO°F
Elastic Crack Computed Correction Corrected Modulus Length Stress Factor Stress
E y Intensity CK Intensity (ps i ) c Factor Factor (inches)
Kl (lb_in- 3/ 2) K1=K1+C K (lb_in-3/ 2) (lb_in-3/ 2)
1.00 3.4685 8.5.290 11. 9975
1.50 6.8235 8.2340 15.0575
2.00 8.6551 7.9620 16.6171 10,000
2.50 10.3244 7.3580 17.6824
3.00 10.6555 6.7770 17.4325
3.50 12.8593 6.2500 19.1093
-1.00 115.0340 85.2900 200.3240
1.50 179.4490 82.3400 261. 7890
100,000 2.00 228.8660 79.6200 308.4860
2.50 271.5680 73.5800 345.1480
3.00 338.3880 67.7700 406.1580
3.50 370.2320 62.5000 432.7320
A-16
., L

I
TABLE A10. Calculations for the Corrected Stress Intensity Factor, K1, for d = 411
, and TR = 150°F
Elastic Crack Computed Correction Corrected Modulus Length Stress Factor Stress
E y Intensity CK Intensity (psi) c Factor Factor (inches)
1<1 (lb_in- 3/ 2) K1 =K1+CK (lb_in- 3/ 2) (lb_in-3/2)
1.00 9.0329 12.7240 21.7569
1.50 14.1421 11.6490 25.7911
2.00 16.7215 10.6820 27.4035 10,000
2.50 19.4015 9.7980 29.1995
3.00 20.5725 8.9950 29.5675
3.50 24.0878 8.2660 32.3538
-- -1.00 181.5020 127.2400 308.7420
1.50 271. 4310 116.4900 387.9210
100,000 2.00 335.7450 106.8200 442.5650
2.50 396.4150 97.9800 494.3950
3.00 492.4270 89.9500 582.3770
3.50 538.3980 82.6600 621.0580
A-17

!
j
TABLE All. Calculations for the Corrected Stress Intensity Factor, Kl' for d = 8", and TR = 50°F
Elastic Crack Computed Correction Corrected Modulus Length Stress Factor Stress
E Yc Intensity CK Intensity (psi) (inches) Factor
(lb-in-3/2) Factor
K1 K1 =K1+CK (lb_in- 3/ 2) (lb_in-3/ 2)
1.00 -1.6714 4.2090 2.5376
2.00 1.0470 3.9260 4.9260
3.00 5.6364 3.6930 9.3294 10,000 4.00 7.0390 3.5000 10.5390
5.00 9.1528 3.3400 12.4928
6.00 11.2093 3.0000 14.2093
7.00 8.4651 2.6500 11.1151
1.00 37.5670 42.0900 79.6570
2.00 92.2173 39.2600 131.4773
3.00 165.5830 36.9300 202.5130 100,000 4.00 202.6790 35.0000 237.6790
5.00 268.7020 33.4000 302.1020
6.00 332.0150 30.0000 362.0150
7.00 341.5890 26.5000 368.0890
A-18

TABLE A12. Calculations for the Corrected Stress Intensity Factor, Kl' for d = 811
, and TR = 100°F
Elastic Crack Computed Correction Corrected Modulus Length Stress Factor Stress
E \ Intensity CK Intensity (psi) (inches) Factor
(lb_in-3/ 2) Factor
II Kl =K1+C K (lb-in-3/ 2) (lb_in-3/ 2)
1.00 4:0799 8.5290 12.6089
2.00 11.4738 7.9620 19.4358
3.00 19.9371 6.7770 26.7141 10,000 4.00 21. 9121 5.7700 27.6821
5.00 25.5840 4.9370 30.5210
6.00 29.6863 4.2500 33.9363
7.00 27.0993 3.6830 30.7823 -1.00 103.5410 85.2900 188.8310 2.00 217.8810 79.6200 297.50lD 3.00 347.8440 67.7700 415.6140
100,000 4.00 400.5190 57.7000 458.2190 5.00 503.8990 49.3700 553.2690 6.00 612.6470 42.5000 655.1470 7.00 633.6580 36.8300 670.4880
•
A-19

--~ --------~
TABLE A13. Calculations for the Corrected Stress Intensity Factor, K1, for d = 8", and TR = 150°F
Elastic Crack Computed Correction Corrected Modulus Length Stress Factor Stress
E Yc Intensity CK Intensity (psi) (i nches) Factor
(lb_in- 3/ 2) Factor
K1 K1 =K1+CK (lb_in-3/ 2) (lb_in-3/ 2)
1.00 9.7499 12.7240 22.4739
2.00 20.3509 10.6820 31.0329
3.00 32.6579 8.9950 41.6529
10,000 4.00 35.8153 7.6030 43.4183
5.00 41. 7676 6.4520 48.2196
6.00 48.1385 5.5010 53.6395
7.00 45.7020 4.7150 50.4170 -1.00 168.5560 127.2400 295.7960
2.00 324.0690 106.8200 430.8890
3.00 509.0910 89.9500 599.0410 100,000 4.00 585.1860 76.0300 661.2160
5.00 735.5230 64.5200 800.0430
6.00 892.9000 55.0100 947.9100
7.00 925.2310 47.1500 972.3810
A-20

I
TABLE A14. Intercepts and Slopes from the Stress Intensity Factor, K1, versus Crack Length, Yc, Curves
Elastic I Daily Ai r Temp. t
Modulus Range below E Stress Free
(psi) Temperature TR
(0 F)
I I
I I
100,000 150 I ; , t ,
i
100,000 i
100
i i
i
I 100,000 50 ,
I -r-10,000 150
10,000 100
10,000 50
A-21
Depth of Intercept Slope Surface b Course a
d (inches)
. I
T-9.076:-T 0.6270 2 4 8
2 4 8
2 !
! 4 ,
8
2 4 8
2
4 8
2
4 8
191 .3016
83.0854
10.5728 22.2331 23.2550
5.6456 12.5750 13.6505
2. 1846 2.8700
,
t
0.6615
0.7842
1 .3991 0.2906 0.4458
1 .2796 0.3430 0.4904
0.4703 0.8599
;
,
i I
,
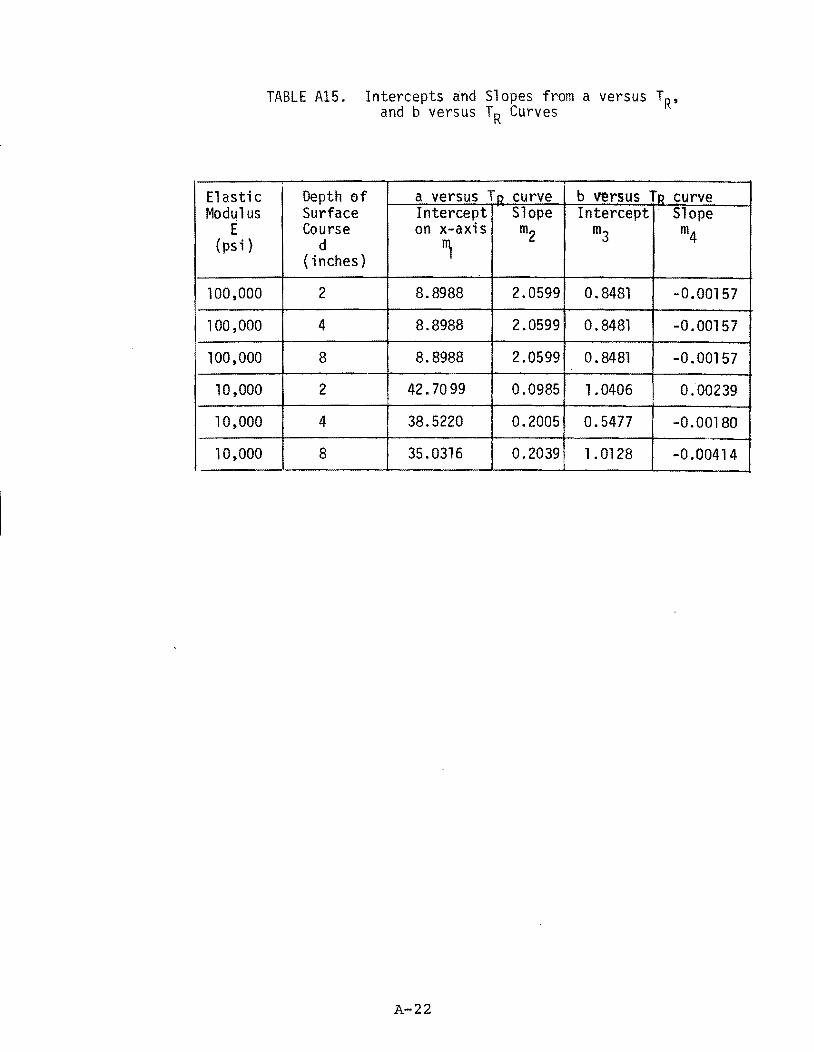
Elastic Modu1 us
E (psi)
100,000
100,000
100,000
10,000
10,000
10,000
TABLE A15. Intercepts and Slopes from a versus TR, and b versus TR Curves
Depth of a versus T(2 curve b versus TR curve Surface Intercept Slope Intercept Slope Course on x-axis m2 m3 m4 d ~ (inches)
2 8.8988 2.0599 0.8481 -0.00157
4 8.8988 2.0599 0.8481 -0.00157
8 8.8988 2.0599 0.8481 -0.00157
2 42.7099 0.0985 1.0406 0.00239
4 , 38.5220 0.2005 0.5477 -0.00180
8 35.0316 0.2039 1.0128 -0.00414
A-22

-~ t<') Ie
I .0 ........,
'::::t:.-
~
a::: ~ u Lt >-I-(f)
z w I-Z
(f) (f) W 0:::
tn
1000
E= 100,000 psi
100 T R= 500 F
A - d = 2"
13 - d=4"
e-d=S"
"\t L{) 00 0
10 rt') 00 II
0
I~I~--------------~IO~--------------~I~OO=
CRACK LENGTH, Yc (inches)
Figure AI. Stress Intensity Factor Versus Crack Length
A"""'23

10,000
-~ 1"0 Ie:
I ..c
:Z 1000 ~
0:: o IU
Lt >I-(f) Z W IZ
~ 100 w 0::
tn
II
C
E = 100,000 psi
TR=IOO°F
8. - d=2"
lll-d=4"
10) - d=8"
10
CRACK LENGTH, Yc (inches)
Figure A2. Stress Intensity Factor Versus Crack Length
A--24
100

10,000
,.-..
~ ['(')
Ie .-
I ..0
1000 ......:.--
~
~
0:::
f2 u Lt E = 100,000 psi
>- TR = 150°F I-(j)
Z W I- A- d = 2" z
100 EI- d = 4 11
(j) L() (j) <.0 d =8
11
W I"-0-
0::: 0 I-(j) ())
00 (\J II a
10~~---------------------~-------------------------~ I 10 100
CRACK LENGTH, Yc (inches)
Figure A3. Stress Intensity Factor Versus Crack Len<]th
A-25

1000
rft"N E = 10,000 psi TR = 50°F I
C I
..Q
~
.. 100 0:::
~ u Lt >I-00 Z w IZ
00
~ 10 0::: I-00
* N II a
o ~ CQ C\I II a
---Iil--- d =411
~d=811
1~1~r-lr-----------7.IO~----------------~IO~O
CRACK LENGTH! Yc (i nches)
Fi gure A4. Stress I ntens ity Factor Versus Crack Length
A-26

1000
-~ I'f)
Ie
I ..c ........
~IOO ~
0::
~ U
~
>-I-(f)
Z W I-Z
(f)
E::: 10,000 psi TR ::: 100 0 F
- . .-.e-.- d ::: 2 II
-----G----- d ::: 4" ~d=811
(f) 10 w 0:: I-(f)
0 Lf)
Lf) 0
~ Lf)
to to Lf) C\I rri q- II II
~ C C Lf) II C
I~I ~--------~L--L~I~O----------------~IOO~
CRACK LENGTH, Yc (inches)
Fi gure A-5. Stress Intensity Factor Versus Crack Length
A-27

1000
"N ri'f Ie
I .0
~IOO
>r-(j) z W IZ
~ 10 w 0::: r(j)
00 C\J I"tQ o II a
o ro LO ro LO C\J C\J C\J ro C\J <;)J
11 a a I
E = 10,000 psi TR =150°F
---A--- d = 2"
----El---- d =4"
-+-- d =811
I~I ~~--~~~------~IO~----------------JIO-O-
CRACK LENGTH, Yc (inches)
Figure A6. Stress Intensity Factor Versus Crack Length
A-28

300
250
200
o 150
..... a.. w u a:: w 100 ..... z
50
ml=8.8988
--.\
E = 100,000 psi
d ::: 2 11, 4 r: 8 rr
O~~-------------r----------------+---------------~--a
-50
FigureA7.
50 100
DAILY AIR TEMPERATURE RANGE, TR (OF), BELOW
THE STRESS FREE TEMPERATURE, 75°F
Intercept, a, Versus Daily Air Temperature Range Below the Stress Free Temperature
A-29
150

o
to... w u a:: w tZ
16
12
8
4
-4
-8
E = 10,000 psi d = 2"
100 150
DAILY AIR TEMPERATURE RANGE, T R ( of), BELOW
THE STRESS FREE TEMPERATURE, 75 of
Figure A8. Intercept, a, Versus Daily Air Temperature Range Below the Stress Free Temperature
A-~O

25
20
15
10
o -~5 (.) ~ Q) -c: -
a = (T R - m I ) m2 E = 10,000 psi
d = 4"
~---'
m 2 =Gi:;2005
a 0 100 150
-5
-10
Daily Air Temperature Range, TR (OF). Below The Str~ss Free Temperature I 75 0 F
Figure A9. Intercept, a, Versus Daily Air Temperature Range Below the Stress Free Temperature.

25 a =(T -m}m R I 2 E = 10,000 psi
20
15 -
10
c .. -g- 5 o ~
<U -C
m, =35.0316 O~~------~~--~----------------~--------______ ~_ o
-10
100
Doily Air Temperatura. Range, T R (OF), Below
The Stress Free Tempe.roture l 75°F
150
Fi gure AIG. Intercept, a, Versus Daily Ai r Temperature Range Belolil the Stress Free Temperature.

.Q ,.
CD Q. 0 -CI)
1.0
0.8
0.6
Q4
0.2
00 qo Q)
0
" rt')
E
tTl =-0.00157 4
E = 100,000 psi
d = 2". 4 II I 8 n
"
o~ ___ ~ __________ ~ ________________ ~ ________________ ~ o 50 100
Daily Air Temperature Range, T R (O F) I Below The Stress Free Temperature" 75 0 F
150
Fi gure All. Slope. b. Versus Daily Ai r Temperature Range Below the Stress Free Temperature.

.0 .. Got·· Q.. 0 -en
1.6 to-
J2 I-
0.8 I-
0.4 ....
(J)
0 v 0 . -II
l'f)
E
-
E = 10,000 psi d =2·'
b=m3 +m4 TR
-- I -- ~ =0.00239
O----------____ ~I ______________ j~ ____________ ~I __
o 50 roo 150
Doily Air Temperature Range, TR (OF), Below
The Stress Free Temperature t 75 0 F
Figure A12. Slo.pe, b, Versus Daily Air Temperature Range Below the Stress Free Temperature.

0.6
0.5
0.4
..Q ..... ,....
E = IO,OOOpsi
d = 4"
Q) ~
Co 0.3 10 0 -en 0 ..
rt')
E 0.2
0.1
O~--~--------~----------____ -L ______________ -L __ o 50 100
Daily Air. Temperature Range, TR (OF), Below
The Stress Free Temperature,. 750 F
Figure Ai3~Slope, b, Versus Daily Air Temperature Range Below the Stress Free Temperature. ___ ~_,_,._~ ___ '
l\-~$-
150

.c .. Q,) 0-0
CJ)
.. 1.2
a
on ro C\J
0 -.. rt')
O~ .. ..... ,. ".',~ E
o
E = IOlOOOpsi d .. Q.II .: 0
:b= m3 +m4 TR
Nl4 :: -0.00414 __ --'ilIo....
I
OO--~----------5~O-------------I~OO-------------~15-0-Doily Air .. Temperature Rqng" T R (OF 1, Belqw
The Stress Free Temperature, 75° F
Figure A14. Slope, b, Versus Daily Air Temperature Range Below the Stress Free Temperature.

50
E =IO,OOOpsi
40
30 E ,. ... -Co I()
CD I/') (.)
~ ~ CI) v - 2.0 c: v
E =100 ,OOOps; 10·
Q) Q) m en (X)
0 0
10 4 6 8 12
Depth Of Surfoce Course, d(ine hes)
Figure Al5. Intercept~ m1, Versus Depth of Surface Course.

(\J
e ~
.-.. 2 .. .5.
2.0
1.5
!. 1..0 o -CJ)
0.5
---01---_--..of=Q 0)---_
4. lOO,OOOpsl
E = IO,OOOpsi
o .. , .·O.0t51B ...
6 a 10
Figure A16.S1ope,m2,VersusDepthof Surface Course.

1.4
1.2
1.0
rt') 08 E ~ -Q.
eu o L-eu 'E 06
0.4
(0,1.5335)
E = 10.000 psi (d~ 4")
(00.8481)
E = 10,000 psi (d ~ 411 )
o~----~~----~--------~----~------~--o 2 4 6 8 10
Depth Of Surface Course, d (inches)
Figure All. Intercept, m3, Versus Depth of Surface Course.
~l~t·· .....

0.004
A,
',0.002 ~ ,- " 1 'i
, -' , :0.0010:164
o.oot
O.OOO .... f __ '<_" --------'to------..r...----....... ---......... _ :0 2 6 8 10
" Depth Of Cour,se" d (i'ne h'es)
.. ~ ~'tOOI o -en
"
, -(OrO.OOI57) " - 0.002 . " f'
-0:003
-0.004 i
E.-IOO ,000 psi
Figure AlB. Slope, m4, Versus Depth of Surface Course. A-40',

APPENDIX B
Computer Model To Predict Thermal Cracking
B-1

APPENDIX B
COMPUTER MODEL TO PREDICT THERMAL CRACKING
This model, based on fracture mechanics, has been
developed to predict the occurrence of transverse cracking
in asphalt concrete pavements due to temperature changes.
Cracks are assumed to begin at the surface of the pavement
and propagate downward as temperature cycling occurs. There
are two programs, VISCO and THERM, in the thermal cracking
model. Program VISCO makes use of Van der Poel's nomograph
(10) as computerized by de Bats' (11) to calculate stiffness
of the asphalt, which is used to compute the stiffness of
the mix, given various loading times. The viscoelastic
properties of the asphalt concrete mix are computed in the
VISCO program for every year, assuming that the asphalt ages
with time. In this program, the asphalt can be aged up to
10 years. Program THERM, uses viscoelastic properties,
thermal properties, and material properties of the asphalt
concrete mix, air temperature, wind velocity, and solar
radiation. The thermal cracking program computes the
cumulative damage indices, CMDG and CMDG1. The computations
of CMDG and CMDGl are shown in the Flow Chart, pages B-3
through B-10.
Other versions of Programs VISCO and THERM, in which I
the asphalt does not age, compute the cumulative damage
indices, CMDG and CMDGI when the crack length, y > 1.0 c
inches, i. e. , when y > 1.0 inches (the original c
B-2

properties of the asphalt are used); these
programs are called VISCOI and THERMI.
them is on pages B-ll through B-19. The
versions of the
A Flow Chart for
input data guide
for VISCO, THERM, VISCOl, and THERMI are given on pages B-20
through B-26. Listings of each of these programs are given
and sample runs with both input and output data follow.
B-3

FLOW CHART OF THERMAL CRACKING PROGRAM
WITH AGING, THERM,
WHICH MAKES USE OF VISCO
B-4

INPUT TAPE 05
W = DENSITY OF THE ASPHALT CONCRETE, PCF.
S = SPECIFIC HEAT OF THE ASPHALT CONCRETE, BTU/LB, of.
AK = THERMAL CONDUCTIVITY OF THE ASPHALT CONCRETE,
BTU/FT2/HR, of/FT.
B = THE ABSORBTIVITY OF THE ASPHALT CONCRETE.
DO = INITIAL CRACK LENGTH, INCHES.
DF = DEPTH OF THE ASPHALT CONCRETE, INCHES.
VMPH = AVERAGE WIND VELOCITY, MPH.
NSEL = STARTING DATE: YR/MO/DY.
SRI = THE AVERAGE SOLAR RADIATION FOR JULY, LANGLEYS ,PER DAY.
SRM = THE YEARLY AVERAGE SOLAR RADIATION, LANGLEYS PER DAY.
B-5

INPUT TAPE 02 (FROM VISCO)
IMODE = MODES 1, 2, & 3.
IAGE = NUMBER OF YEARS TO BE RUN.
CV = (AGGREGATE VOLUME)/(AGGREGATE VOLUME + ASPHALT VOLUME).
SPRB = ORIGINAL SOFTENING POINT RING AND BALL TEMPERATURE, °C.
(IMODE = 1 OR 2)
PI = ORIGINAL PENETRATION INDEX. (IMODE = 1)
TPEN2 = ORIGINAL TEMPERATURE OF REFERENCE PENETRATION, °C.
(IMODE = 3)
PENI = ORIGINAL PENETRATION AT 25°C. (IMODE = 2 OR 3)
PEN2 = ORIGINAL REFERENCE PENETRATION AT TPEN2. (IMODE = 3)
B-6

INPUT TAPE 01 (WEATHER DATA TAPE)
NDATE = YEAR READ FROM TAPE SCAN DOWN TAPE TO SELECTED
DATE, NSEL
FOR EACH YEAR, I, OF ANALYSIS PERIOD
INPUT TAPE 02 (RESULTS FROM VISCO)
IYR = NUMBER OF YEARS THE BITUMEN HAS AGED.
PEN1 = PENETRATION AT 25°C.
SPRBI = SOFTENING POINT RING AND BALL TEIV1PERATURE, °C.
CN = THE SLOPE OF THE MASTER RELAXATION
MODULUS CURVE.
D1 ::: THE POWER OF THE INTERCEPT VALUE FOR LOG T = 0
OF THE MASTER RELAXATION MODULUS CURVE.
TA = THE POWER LAW CONSTANT FOR THE SHIFT FACTOR.
CM ::: THE SLOPE OF THE POWER LAW CURVE FOR THE
SHIFT FACTOR.
B-7

NYEAR =
LL =
DAY =
TMAX =
TMIN =
FOR EACH MONTH, J, OF YEAR, I
INPUT TAPE 01 (WEATHER DATA TAPE)
YEAR
MONTH
EACH DAY OF THE MONTH
MAXIMUM TEMPERATURE OF THE AIR FOR EACH DAY
OF THE MONTH.
MINIMUM TEMPERATURE OF THE AIR FOR EACH DAY
OF THE MONTH.
FOR EACH DAY, K, OF MONTH, J
COMPUTE' AVERAGE MINIMUM TEMPERATURE AND
AVERAGE MAXIMUMJEMPERATURE OF PAVEMENT
B-8

COMPUTE EFFECTIVE MODULUS OF ELASTICITY AT AVERAGE
MINIMUM AND MAXIMUM TEMPERATURES OF THE PAVEMENT
USING SUBROUTINES CURVE, COOL, HEAT, INTGRT, AND FACTOR.
COMPUTE STRESS INTENSITY FACTOR AT MAXIMUM TEMPERATURE
(KTMX) AND AT MINIMUM TEMPERATURE (KTMN) OF THE
PAVEMENT USING SUBROUTINE, FACTOR.
COMPUTE THE DIFFERENCE OF STRESS INTENSITY FACTOR (~K)
BETWEEN MAXIMUM AND MINIMUM TEMPERATURES. COMPUTE THE
CHANGE IN CRACK LENGTH AND THE TOTAL CRACK LENGTH, YC.
B-9

COMPUTE NUMBER OF TEMPERATURE CYCLES TO FAILURE
METHOD 1
DF
f de NFO = 1 + A(AK)n
FOR THE FIRST DAY WHEN THE TEMPERATURE CYCLE OCCURS DO
NF = jDF
YC(ID)
METHOD 2
DF
de A(AK)n
FOR THE SUCCESSIVE DAYS WHEN THE TEMPERATURE CYCLE OCCURS
Nfl = f A~~K)n
METHOD 1
CMDG
METHOD 2
CMDGl
WHERE
DO
COMPUTE CUMULATIVE DAMAGE INDEX
= 1
L Nfl L
L = SET OF DAYS WHEN TEMPERATURE CYCLING OCCURS
~ B-IO

AT THE END OF THE MONTH, J, PRINT OUT
THE CURRENT RESULTS.
B-ll

FLOW CHART OF THERMAL CRACKING
PROGRAM WITH NO AGING WHEN
CRACK LENGTH, YC, IS GREATER
THAN 1.00 INCH (THERM1)
WHICH MAKES USE OF
VISC01
B-l~~

INPUT TAPE 05
W = DENSITY OF THE ASPHALT CONCRETE, PCF.
S = SPECIFIC HEAT OF THE ASPHALT CONCRETE,
BTU/LB, of.
AK = THERMAL CONDUCTIVITY OF THE ASPHALT CONCRETE,
BTU/FT2/HR, of/FT.
B = THE ABSORBTIVITY OF THE ASPHALT CONCRETE.
DO = INITIAL CRACK LENGTH, INCHES.
DF = DEPTH OF THE ASPHALT CONCRETE, INCHES.
VMPH = AVERAGE WIND VELOCITY, MPH.
NSEL = STARTING DATE: YR/MO/DY.
SRI = THE AVERAGE SOLAR RADIATION FOR JULY,
LANGLEYS PER DAY.
SRM = THE YEARLY AVERAGE SOLAR RADIATION,
LANGLEYS PER DAY.
B-13

I---------------------l----------------~ INPUT TAPE 02 . (FROM VISCO)
II~ODE = I~ODES l, 2, & 3.
IAGE = NUMBER OF YEARS TO BE RUN.
CV = (AGGREGATE VOLUME)/(AGGREGATE VOLUME
+ ASPHALT VOLUME)
SPRB = ORIGINAL SOFTENING POINT RING AND BALL
TEMPERATURE, °C. (IMODE = 1 OR 2)
PI = ORIGINAL PENETRATION INDEX. (IMODE = l)
TPEN2 = ORIGINAL TEMPERATURE OF REFERENCE PENETRATION,
°C. (IMODE = 3)
PENl = ORIGINAL PENETRATION AT 25°C. (IMODE = .
2 OR 3)
PEN2 = ORIGINAL REFERENCE PENETRATION AT TPEN2.
(IMODE = 3)
-
!
B-14

.------------------~~----------------~ INPUT TAPE 01 (WEATHER DATA TAPE)
NDATE = YEAR READ FROM TAPE. SCAN DOWN TAPE TO
SELECTED DATE, NSEL.
IYR =
DUM1 =
OUM2 =
DUM3 =
DUI\14 =
DUM5 =
DUM6 =
INPUT TAPE 02 (RESULTS FROM VISC01)
(VARIABLES OF BITUMEN WITHOUT AGING)
NUMBER OF YEARS THE BITUMEN HAS AGED
(IN THIS CASE IYR = -1, ie NO AGING)
PEN1
SPRB
CN, THE SLOPE OF THE MASTER RELAXATION
MODULUS CURVE.
01, THE POWER OF THE INTERCEPT VALUE FOR
LOG T = 0 OF THE MASTER RELAXATION
MODULUS CURVE.
TA, THE POWER LAW CONSTANT FOR THE SHIFT
FACTOR.
CM, THE SLOPE OF THE POWER LAW CURVE FOR THE
SHIFT FACTOR.
B-15

FOR EACH YEAR, I, OF ANALYSIS PERIOD
INPUT TAPE 02 (RESULTS FROM VISCO)
IYR = NUMBER OF YEARS THE BITUMEN HAS AGED.
PEN! = PENETRATION AT 25°C.
SPRBI = SOFTENING POINT RING AND BALL TEMPERATURE, °C.
CN = THE SLOPE OF THE MASTER RELAXATION
MODULUS CURVE.
D1 = THE POWER OF THE INTERCEPT VALUE FOR LOG T = 0
OF THE MASTER RELAXATION MODULUS CURVE.
TA = THE POWER LAW CONSTANT FOR THE SHIFT FACTOR.
CM = THE SLOPE OF THE POWER LAW CURVE FOR THE
SHIFT FACTOR.
B-16
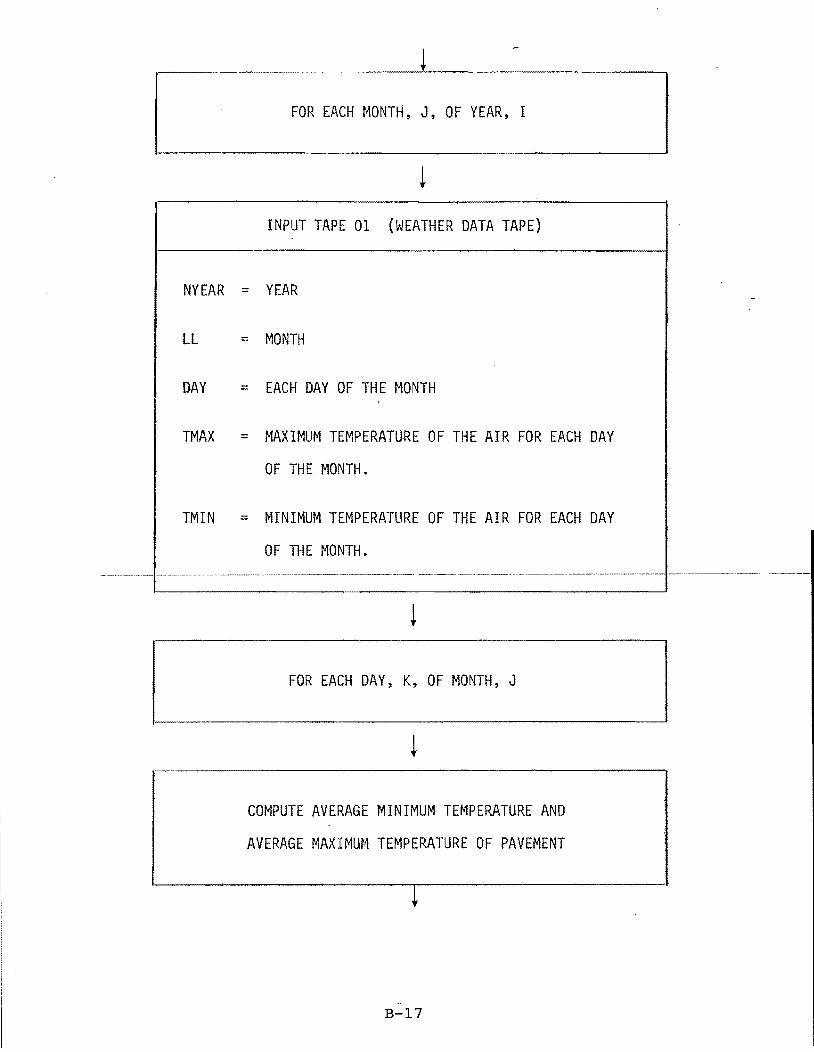
NYEAR
LL
DAY
TMAX
TMIN
FOR EACH MONTH, J, OF YEAR, I
INPUT TAPE 01 (WEATHER DATA TAPE)
= YEAR
:: MONTH
::: EACH DAY OF THE MONTH
= MAXIMUM TEMPERATURE OF THE AIR FOR EACH DAY
OF THE MONTH.
:: MINIMUM TEMPERATURE OF THE AIR FOR EACH DAY
OF THE MONTH. _~~ __ . _______ ~·_. ____ • _____ ·• _____ "'_"_~"· ___ ~'r __ ·~·_r-
FOR EACH DAY, K, OF MONTH, J
COMPUTE AVERAGE MINIMUM TEMPERATURE AND
AVERAGE MAXIMUM TEMPERATURE OF PAVEMENT
B-17
-
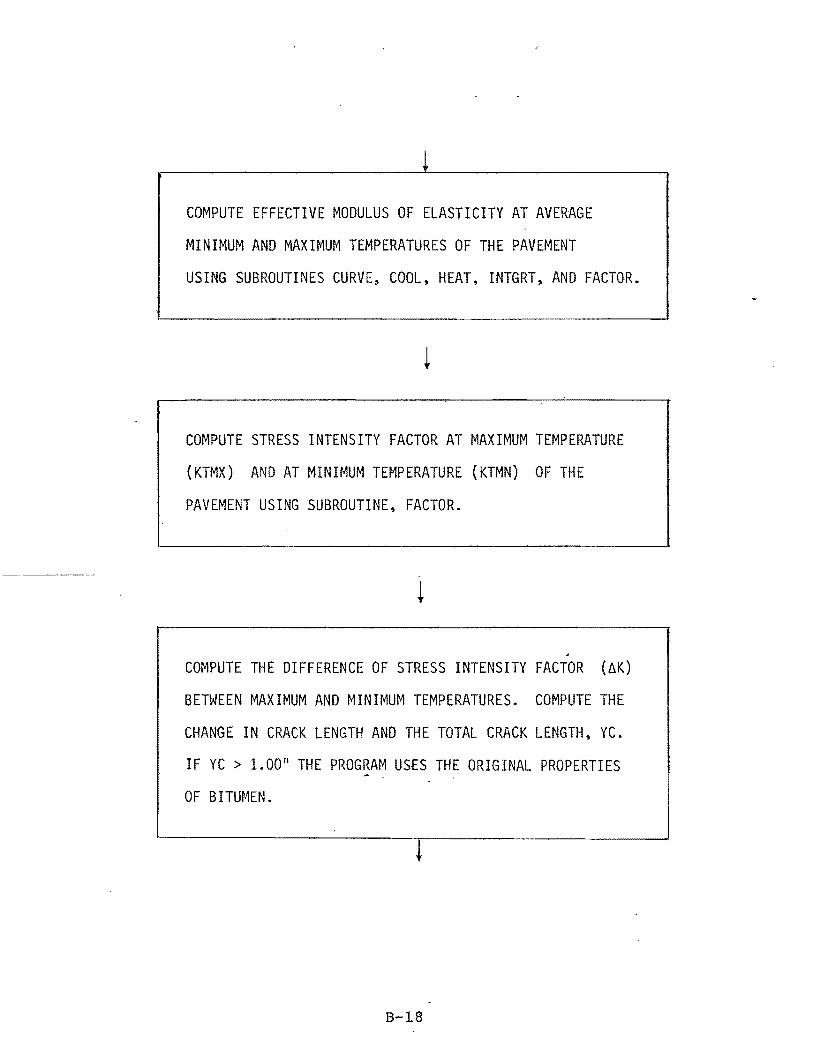
!
COMPUTE EFFECTIVE MODULUS OF ELASTICITY AT AVERAGE
MINIMUM AND MAXIMUM TEMPERATURES OF THE PAVEMENT
USING SUBROUTINES CURVE~ COOL, HEAT, INTGRT, AND FACTOR.
COMPUTE STRESS INTENSITY FACTOR AT MAXIMUM TEMPERATURE
(KTMX) AND AT MINIMUM TEMPERATURE (KTMN) OF THE
PAVEMENT USING SUBROUTINE, FACTOR.
. COMPUTE THE DIFFERENCE OF STRESS INTENSITY FACTOR (t~K)
BETWEEN MAXIMUM AND MINIMUM TEMPERATURES. COMPUTE THE
CHANGE IN CRACK LENGTH AND THE TOTAL CRACK LENGTH, YC.
IF YC > LOOn THE PROGRAM USES THE ORIGINAL PROPERTIES
OF BITUMEN.
B-18

f
!
COMPUTE NUMBER OF TEMPERATURE CYCLES TO FAILURE
METHOD 1
OF
NFO = 1 + / A(~~)n DO
FOR THE FIRST DAY WHEN THE TEMPERATURE CYCLE OCCURS
NF =
METHOD 2
j OF de
A{llK)n YC( ID)
FOR THE SUCCESSIVE DAYS WHEN THE TEMPERATURE CYCLE OCCURS
Nfl = 1 +
METHOD 1
CMDG
METHOD 2
CMDGI
WHERE
DO
COMPUTE CUMULATIVE DAMAGE INDEX
= 1 + l: N1F NFO L
= l: N~l L
L = SET OF DAYS vlHEN TEMPERATURE CYCLING OCCURS

AT THE END OF THE MONTH, J, PRINT OUT
THE CURRENT RESULTS.
B-20
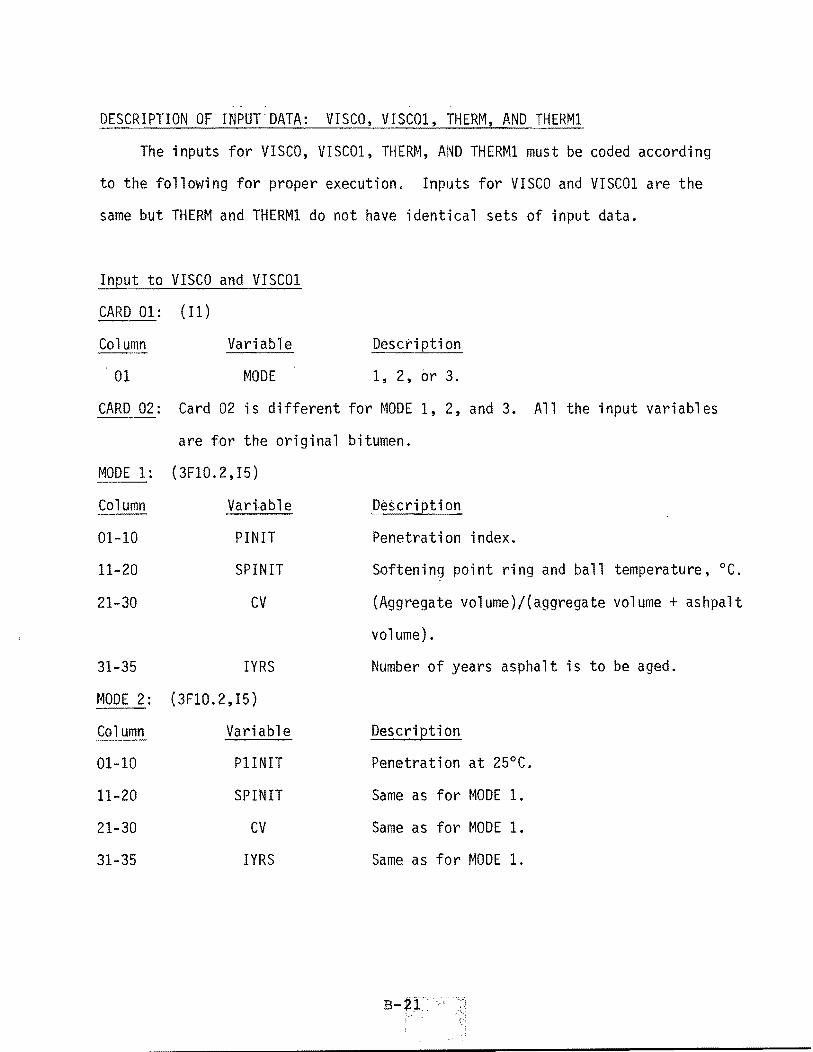
DESCRIPTION OFINPUT'DATA: VISCO, VISC01, THERM, AND THERMl
The inputs for VISCO, VISCOl, THERM, AND THERM1 must be coded according
to the following for proper execution. Inputs for VISCO and VISC01 are the
same but THERM and THERM1 do not have identical sets of input data.
Input to VISCO and VISC01
CARD 01: (11)
Co 1 urnn Variable
. 01 MODE
Description
1, 2, or 3.
CARD 02: Card 02 is different for MODE 1, 2, and 3. All the input variables
are for the original bitumen.
MODE 1: (3F10.2,I5)
Column
01-10
11-20
21-30
31-35
MODE 2:
Column
01-10
11-20
21-30
31-35
Variable
PINIT
SPINIT
CV
IYRS
(3F10.2,I5)
Variable
PlINIT
SPINIT
CV
IYRS
Description
Penetration index.
Softening pOint ring and ball temperature, °C.
(Aggregate volume)/(aggregate volume + ashpalt
volume).
Number of years asphalt is to be aged.
Description
Penetration at 25°C.
Same as for MODE 1.
Same as for MODE 1.
Same as for ~10DE 1.

MODE 3: (4FlO.2,I5)
Column Variable· Description
01-10 PlINIT Same as for MODE 2.
11-20 P2INIT Reference penetration at TPEN2.
21-30 TPEN2 Temperature of reference penetration, DC.
31-40 CV Same as for MODE 1 and 2.
41-45 IYRS Same as for MODE 1 and 2.
NOTE: A blank card should be inserted at the end of the data cards.
Input to THERM
DATA from TAPE 05
CARD (15A4)
Column
01-60
Variable
TITL
CARD 02: (8FlO.0)
Column
OhIO
11-20
21-30
31-40
Variable
W
S
AK
B
CARD 03: (8FlO.0)
Column
01-10
11-20
21-30
Vartable
DO
OF
VMPH
Description
Titl~ of the problem (Alpha-numeric).
Description
Unit weight of the asphalt concrete, PCF.
Specifi cheat of the asphalt concrete,
BTU/lb, of.
Thermal conductivity of the asphalt concrete,
BTU/sq.ft/hr,oF/ft.
The absorbtivity of the asphalt concrete.
Description
Initial crack lengths, in. (Crack is propa
gating downwards).
Depth of the asphalt concrete, in.
Average wind velocity, mph.

CARD 04: (8IlO)
Column Variable Description
01-10 NSEL Starting date, YR/MO/DY.
CARD 05: (8F10.0)
Column Variable Description
01-10 SRI The average solar radiation for July,
Langleys/day.
11-20 SRM The yearly average solar radiation, Langleys/
day.
DATA from TAPE 02 (Variables from VISCO program)
CARD 01: (2I2,4FI0.3)
Column
01-02
03-04
05-14
15-24
25-34
35-44
Variable
IMODE
IAGE
CV
SPRB
or
TPEN2
PI or
PENI
PEN2
Description
MODES 1, 2, or 3.
(Number of years to be run) or (The number of
years the bitumen is to be aged), usually
both are the same.
(Aggregate volume)/(aggregate volume + asphalt
volume).
Ori gina 1 soften i ng PO"j nt ri ng and ba 11 tempera
ture' DC (For ~~ODE = 1 or 2).
Temperature of reference penetration, DC (For
IMODE = 3).
Original penetration index (IMODE = 1).
Original penetration at 25°C (IMODE = 2, 3).
Reference penetration at TPEN2 (Only for
IMODE = 3).

CARD 02: (I2,2F10.3)
Card 02 to 04 are for the current year.
Column
01-02
Variable
IYR
03-12 PEN 1
13-22 SPRBI
CARD 03: (2F10.5)
Column Variable
01-10 CN
11-20 01
CARD 04: (2F10.5)
Column
01-10
11-20
Variable
TA
CM
DATA from TAPE 01 (Weather Tape)
CARD 01: (11X,I6)
Column
12-17
Variable
NDATE
Description
The number of years the bitumen has aged
[IYR = 0 (Aged 6 months, for the first year),
IYR = 1 (Aged 18 months, for the second year),
etc.].
Penetration at 25°C.
Softening point ring and ball temperature, °C.
Description
The slope of the master relaxation modulus
curve.
The power of the intercept value for Log T = 0
of the master relaxation modulus curve.
Description
The power law constant for the shift factor.
The slope of the power law curve for the shift
factor.
Description
Date, YRjMOjDY, in the weather data tape (Scan
down tape to selected date, NSEL).

CARD 02: (11X,3I2,2X,2F3.0)
Column Variable Description
12-13 NYEAR Year (2 digits).
14-15 LL Month (2 digits).
16-17 DAY (1) Day (2 digits).
20-22 TMAX(1 ) Maximum temperature during DAY(I), of.
23-25 TMIN(I) Minimum temperature during DAY(I), of.
CARD 03: (1IX,I2,2X,I2,2X,2F3.0)
Column Variable Description
12-13 NYEAR Year (2 digits).
16-17 DAY (I) Day (2 digits).
20-22 TMAX(I ) Maximum temperature during DAY(I), ° F .
23-25 TMIN (I) Minimum temperature during DAY(I), of.
NOTE: CARD 03 must be repeated for each day of the analysis period. Format
of the CARDS 01, 02, and 03 must be changed according to the format of
weather data tape.
INPUT TO THERMI (No Aging When Crack Length, Yc, > 1.0")
DATA from TAPE 05
Same as for THERM program.
DATA from TAPE 02 (Variables from VISCOl program)
CARD 01:
Same as for THERM program.
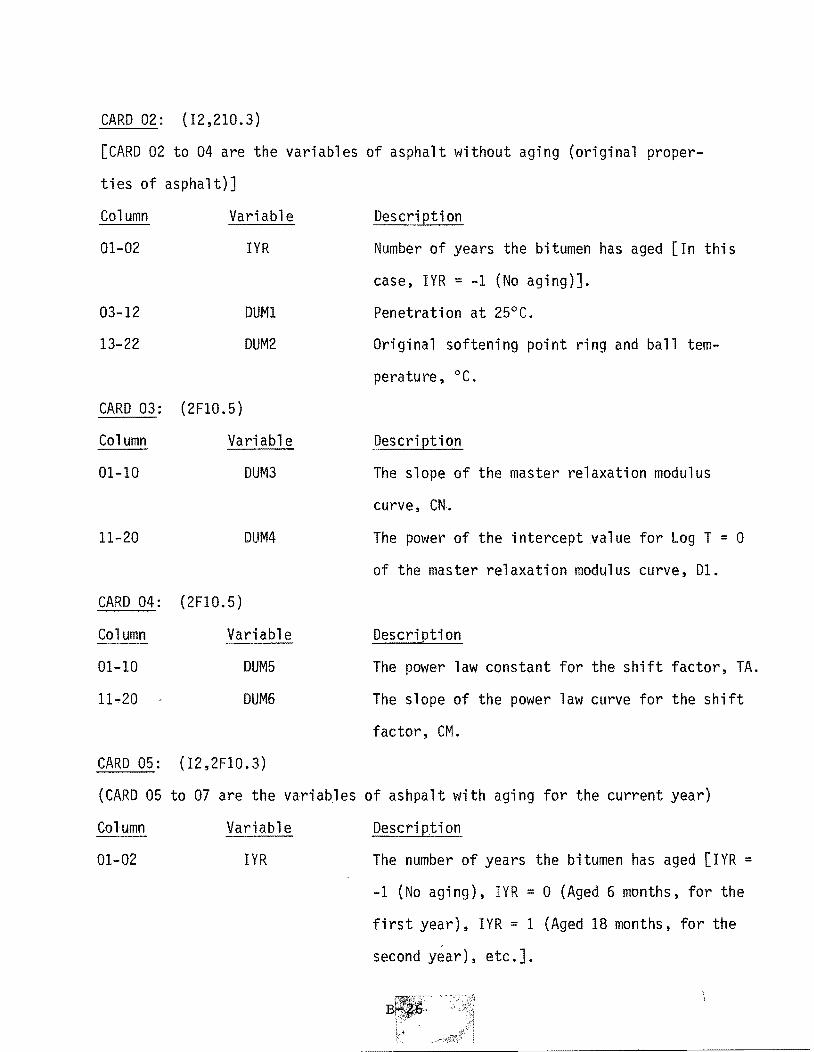
CARD 02: (12,210.3)
[CARD 02 to 04 are the variables of asphalt without aging (original proper
ties of asphalt)]
Col unm
01-02
03-12
13-22
Variable
IYR
DUMI
DUM2
CARD 03: (2FI0.5)
Column
01-10
11-20
Variable
DUM3
DUM4
CARD 04: ( 2 F1 0 . 5 )
Column
01-10
Ih20
Variable
DUM5
DUM6
CARD 05: (I2,2FI0.3)
Description
Number of years the bitumen has aged [In this
case, IYR = -1 (No aging)].
Penetration at 25°C.
Original softening point ring and ball tem
perature, °C.
Description
The slope of the master relaxation modulus
curve, CN.
The power of the intercept value for Log T = 0
of the master relaxation modulus curve, 01.
Description
The power law constant for the shift factor, TA.
The slope of the power law curve for the shift
factor, CM.
(CARD 05 to 07 are the variables of ashpalt with aging for the current year)
Column
01-02
Variable
IYR
Description
The number of years the bitumen has aged [IYR =
-1 (No aging), IYR = 0 (Aged 6 months, for the
first year), IYR = 1 (Aged 18 months, for the
second year), etc.].
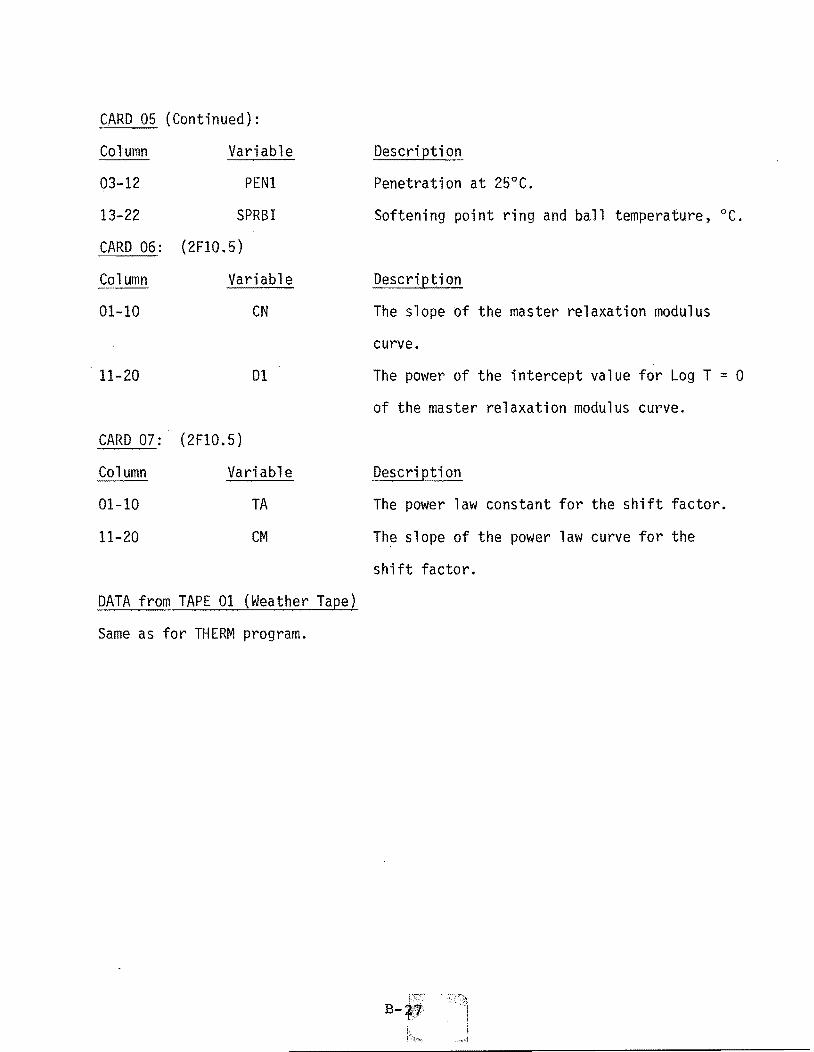
CARD 05 (Continued) :
Column Variable
03-12 PEN1
13-22 SPRBI
CARD 06: (2F10.5)
Column Variable
01-10 CN
. 11-20 D1
CARD 07: (2F10.5)
Column
01-10
11-20
Variable
TA
CM
DATA from TAPE 01 (Weather Tape)
Same as for THERM program.
Description
Penetration at 25°C.
Softening point ring and ball temperature, °C.
Description
The slope of the master relaxation modulus
curve .
The power of the intercept value for Log T = 0
of the master relaxation modulus curve.
Description
The power law constant for the shift factor.
Th~ slope of the power law curve for the
shift factor.
B-

C******************************************************************* C* * C* COMPUTER PROGRAM ( VISCO ) * C* TO DETERMINE * C* VISCOELASTIC PROPERTIES OF ASPHALT CONCRETE * C* * c******************************************************************* C* EXPLANATION OF INPUT VARIABLES * C* C* C* C* C* C* C* C* C* C* C* C* C* C* C* C* C* C*
PINIT PENETRATION INDEX, (PII)
SPINIT SOFTENING POINT RING & BALL, DEGREES C. (SPRBI)
P1INIT PENETRATION AT 25 DEGREES c, (PEN1)
P2INIT REFERENCE PENETRATION AT TPEN2, (PEN2)
TPEN2 TEMPERATURE Of REF. PENETRATION, DEGREES C
CV [AGGREGATE VOL]/( [AGGREGATE VOL]+[ASPHALT VOL])
IYRS NUMBER OF YEARS ASPHALT IS TO BE AGED
* * * * * * * * * * * * * * * * * *
C* THIS PROGRAM CAN OPERATE IN THREE DIFFERENT MODES. SELECTED * C* BY THE INPUT VARIABLE MODE. INPUT REQUIRED FOR EACH MODE IS AS * C* FOLLOWS: * C* C* C* C* C* C* C* C* C* C', C* C'" C* C* C* C* C*· C* C* C'" C*
CARD 01
CARD 02
MODE
1 2 3
DATA ENTERED
MODE
DATA ENTERED
PINIT,SPINIT,CV,IYRS P1INIT,SPINIT,CV,IYRS P1INIT,P2INIT,TPEN2,CV,IYRS
INPUT FORMAT
(I 1)
INPUT FORMAT
(3f10.2,I5) (3F10.2,I5) (4F10.2,I5)
* * * * * * * * * * * * * * * * * * * * *
C* * C* NOTE: A BLANK CARD SHOULD BE INSERTED AT THE END OF ALL * C* DATA CARDS * C* * C* * C* SEE COMMENTS IN FUNCTION POEL FOR FURTHER INFORMATION. * C* * C*******************************************************************
DIMENSION X(20),Y(20),E1(20),E2(20),E3(20) REAL TEMPS(3)/O.O,25.,60./

C********** NTT c
NTO =
DEFINE INPUT AND OUTPUT UNITS ********** 5 6
C********** KPI=l KSPRBoo1 KTEMP=1
INITIALIZE CONSTANTS **********
TIMOLI = 1 .OE+05 KTIMOL=7 FTIMOL=.1 KPEN1=1 TPEN1=25. CONTINUE NN = 0
C********** INPUT MODE 1.2. OR 3 ********** 10 READ(NTT,S010.END=9999)MODE
C********** WRITE PAGE HEADER ********** C********** PERFORM SELECTED MODE CALCULATIONS **********
GO TO( 100. 200.300) .MODE WRITE (NTO, 9050) STOP 1
c*************** MOD E ***************************** C* * C* PII AND SPRBI ARE READ IN DIRECTLY * C* * C************************************************************
100 READ(NTT.S210)PINIT.SPINIT,CV.IYRS WRITE (1.1001) MODE, IYRS. CV. SPINIT, PINIT
1001 FORMAT ( 212, 3F10.3, 10X, '<-- MODE, YRS. CV, SPRB, PI' ) DO 102 IY=1,IYRS IYR=IY-1 PII=PINIT SPRBI=SPINIT NN=O
C***** AGE ASPHALT ***** CALL CONV(MODE.IYR,PII,SPRBI,TPEN1,O.)
C********** LOOP FOR :3 TEMPERATURES ********** DO 10 1 1101 = 1 ,3 ' TEMPI=TEMPS(I101) IWRITE=O WRITE (NTO, 9030) WRITE(NTO,9040)MODE
C********** WRITE OUT INPUTS ********** WRITE (NTO, 9070) PINIT. IYR, PI! WRITE(NTO,9090)SPINIT,IYR,SPRBI WRITE (NTO, 9110 )TEMPI ,KTEMP WRITE(NTO,9140)TIMOLI,KTIMOL WRITE(NTO,9150)FTIMOL PI=PI! SPRB=SPRBI TEMP=TEMPI TIMOL=TIMOLI CALL CALC(NP,PI,SPRB,TEMP,TIMOL,X,Y,MODE,IWRITE.FTIMOL,NN,
+ E1.E2,E3,KTIM~L.CV) 101 CONTINUE 102 CALL FINDTA(NN,E1,E2.E3)
GO TO 1 C*************** MOD E c*
2 ***************************** *
C* PII CALCULATED FROM PENETRATION VALUE AND SPRBI
B-~9 f _ i
*

C* * C************************************************************
200 READ(NTT,9210)P1INIT,SPINIT,CV,IYRS WRITE (1.1002) MODE, IYRS. CV, SPINIT, PlINIT
1002 FO'RMAT ( 212, 3F10.3, 10X, '<-- MODE, YRS, CV, SPRB, PEN1' C*** AGE ASPHALT ***
DO 202 I202=1,IYRS IYR=I202-1 PENlI=PlINIT SPRBI =SPINIT NN=O CALL AGE(IYR,'PEN1I,TPEN1,SPRBI)
C********** LOOP FOR 3 TEMPERATURES ********** DO 201 1201=1,3 TEMPI=TEMPS(I201) IWRITE=O WR ITE (NTO, 9030) WRITE(NTO,9040)MODE WRITE(NTO,9160)P1INIT,IYR,PEN11 WRITE(NTO,91S0)TPEN1 WRITE( NTO, 9090 )SPINIT , IYR, SPRBI WRITE(NTO.9110)TEMPI,KTEMP WRITE(NTO,9140)TIMOLI,KTIMOL WRITE (NTO, 9150 )FTIMOL PEN1=PEN1I SPRS=SPRBI A=(ALOG10(SOO.)-ALOG10(PEN1»/(SPRB-TPEN1) PI=(20.-S00.*A)/(1.+50.*A) TEMP=TEMPI TIMOL=TIMOLI CALL CALC(NP,PI,SPRB,TEMP,TIMOL.X,Y,1,IWRITE,FTIMOL,NN,
+ E1,E2,E3,KTIMOL.CV) 201 CONTINUE 202 CALL FINDTA(NN,E1,E2,E3)
GO TO 1 C************~ MOD E 3 ***************************************** C * C PI AND SOFTENING POINT RING & BALL ARE CALCULATED FROM THE TWO* C GIVEN PENETRATION VALUES AND CORRESPONDING TEMPERATURES. * C * C********************************************************************
300 READ(NTT,9211)P1INIT,P2INIT,TPEN2,CV,IYRS WRITE (1,1003) MODE, IYRS, CV, TPEN2, PlINIT, P2INIT
1003 FORMAT ( 212, 4F10.3, '<-- MODE, YRS, CV. TPEN2, PEN1, PEN2' ) C*** AGE ASPHALT ***
DO 302 I302=1,IYRS IYR=I302-1 PEN1=PlINIT PEN2=P2INIT NN=O CALL CONV(MODE,IYR,PEN1,PEN2,TPEN1,TPEN2) SPRB=PEN2 A=(ALOG10(SOO.)-ALOG10(PEN1»/(SPRB-TPEN1) PI=(20.-S00.*A)/(1.+50.*A)
C********** LOOP FOR 3 TEMPERATURES ********** DO 301 1301=1,3 TEMPI=TEMPS(I301) IWRITE=O WRITE(NTO.9030) WRITE(NTO,9040)MODE
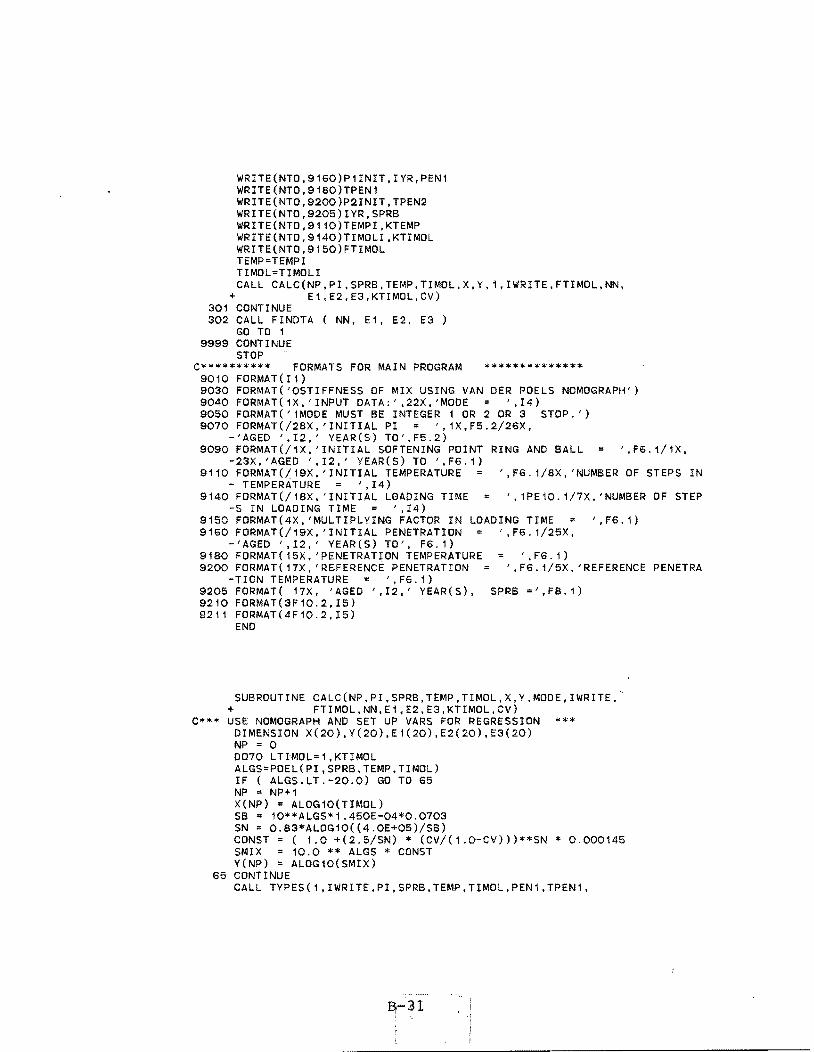
WRITE(NTO,9160)P1INIT,IYR,PEN1 WRITE(NTO,9180)TPEN1 WRITE(NTO,9200)P2INIT,TPEN2 WRITE(NTO,9205)IYR,SPRB WRITE(NTO,9110)TEMPI,KTEMP WRITE(NTO,9140)TIMOLI,KTIMOL WRITE(NTO,9150)FTIMOL TEMP=TEMPI TI MOL =TI MOLl CALL CALC(NP,PI,SPRB,TEMP,TIMOL,X,Y,1,IWRITE,FTIMOL,NN,
+ E1,E2,E3,KTIMOL,CV) 301 CONTINUE 302 CALL FINDTA ( NN, E1, E2, E3 )
GO TO 1 9999 CONTI NUE
STOP c********** FORMATS FOR MAIN PROGRA.M **************
9010 FORMAT(I1) 9030 FORMAT('OSTIFFNESS OF MIX USING VAN DER POELS NOMOGRAPH') 9040 FORMAT(1X,'INPUT DATA:' ,22X, 'MODE ',14) 9050 FORMAT('1MODE MUST BE INTEGER 1 OR 2 OR 3 STOP.') 9070 FORMAT(/28X,'INITIAL PI ',1X,F5.2/26X,
-'AGED ',12,' YEAR(S) TO',F5.2) 9090 FORMAT(/1X,'INITIAL SOFTENING POINT RING AND BALL = ',F6.1/1X,
-23X,'AGED ',12,' YEAR(S) TO ',F6.1) 9110 FORMAT(j19X, 'INITIAL TEMPERATURE ',F6.1/8X,'NUMBER OF STEPS IN
- TEMPERATURE ',14) 9140 FORMAT(/18X,'INITIAL LOADING TIME ',1PE10.1/7X,'NUMBER OF STEP
-S IN LOADING TIME ',14) 9150 FORMAT(4X,'MULTIPLYING FACTOR IN LOADING TIME ',F6.1) 9160 FORMAT(/1eX,'INITIAL PENETRATION ',F6.1/25X,
-'AGED ',12,' YEAR(S) TO', F6.1) 9180 FORMAT(15X,'PENETRATION TEMPERATURE ',F6.1) 9200 FORMAT( 17X, 'REFERENCE PENETRATION ' ,F6. 1/5X, 'REFERENCE PENETRA
-TION TEMPERATURE ',FG.1) 9205 FORMAT( 17X, 'AGED ',12,' YEAR(S), SPRB =',F8.1) 9210 FORMAT(3F10.2,I5) 9211 FORMAT(4F10.2,I5)
END
SUBROUTINE CALC(NP,PI,SPRB,TEMP,TIMOL,X,Y,MODE,IWRITE,' + FTIMOL,NN,E1,E2,E3,KTIMOL,CV)
C*** USE NOMOGRAPH AND SET UP VARS FOR REGRESSION *** DIMENSION X(20),Y(20),E1(20),E2(20),E3(20) NP = 0 0070 LTIMOL=1,KTIMOL ALGS=POEL(PI,SPRB,TEMP,TIMOL) IF ( ALGS.LT.-20.0) GO TO 65 NP '" NP+1 X(NP) = ALOG10(TIMOL) SB = 10**ALGS*1.450E-04*0.0703 SN '" 0.83*ALOG10«4.0E+05)/SB) CONST = ( 1.0 +(2.5/SN) * (CV/(1.0-CV»)**SN * 0.000145 SMIX = 10.0 ** ALGS * CONST Y(NP) ALOG10(SMIX)
65 CONTINUE CALL TYPES(1,IWRITE,PI,SPRB,TEMP,TIMOL,PEN1,TPEN1,
B!- 1

+ PEN2,TPEN2,ALGS,CONST) TIMOL"'TIMOL*FTIMOL
70 CONTINUE CALL LINEAR(NP.X,Y.EA.EB) NN = NN + 1 E 1(NN) '" EB E2(NN) = EA E3(NN) ., TEMP WRITE (6,666) NN, E3(NN), E2(NN), E1(NN)
C**** SAVE CN AND 01 AT MASTER TEMPERATURE ****** IF(TEMP.NE.25.)RETURN WRITE (1,100)E2(NN),E1(NN)
100 FDRMAT(2F10.5.' <---- CN, D1') RETURN
666 FORMAT (' NN', 15, I TEMP', E14.7, ' SLOPE, M' E14.7, 1 INTERCEPT,E1', E14.7 )
END
SUBROUTINE CONV(MODE,IYR,VAR1,VAR2,VAR3,VAR4) C**** CONVERT TO MODE 2 TO USE AGE ROUTINE *****
IF(MODE.EQ.3)GOT02 C**** CONVERT FROM MODi 1 TO MODE 2 AND AGE *****
PII=VAR1 SPRBI=VAR2 TPEN1=VAR3 A=(20.-PII)/(500.+50.*PII) DELTA=A*(SPRBI-25.) PEN1I=10.**(ALOG10(aOO. )-DELTA)
C***** NOW AGE ***** CALL AGE(IYR,PEN1I,TPEN1.SPRBI)
C***** CONVERT BACK TO MODE 1 AFTER AGING ***** A=(ALOG10(aOO.)-ALOG10(PEN1I»/(SPRBI-TPEN1) PII=(20.-500.*A)/(1.+50.*A) VAR1 =PII VAR2=SPRBI RETURN
c********** CONVERT FROM MODE 3 TO MODE 2 ********** 2 PEN1=VAR1
PEN2=VAR2 TPEN1=VAR3 TPEN2=VAR4 A=(ALOG10(PEN1)-ALOG10(PEN2»/(TPEN1-TPEN2) DPEN=ALOG10(SOO.)-ALOG10(PEN2) SPRB=TPEN2+DPEN/A
C*** NOW AGE *** CALL AGE(IYR,PEN1,TPEN1,SPRB)
C*** PASS BACK RESULTS TO MAIN IN MODE 2 FORM *** VAR1=PEN1 VAR2=SPRB RETURN END
SUBROUTINE AGE(IYR,PEN1I,TPEN1.SPRBI) C********** AGES PAVEMENT USING MODE 2 VARIABLES **********
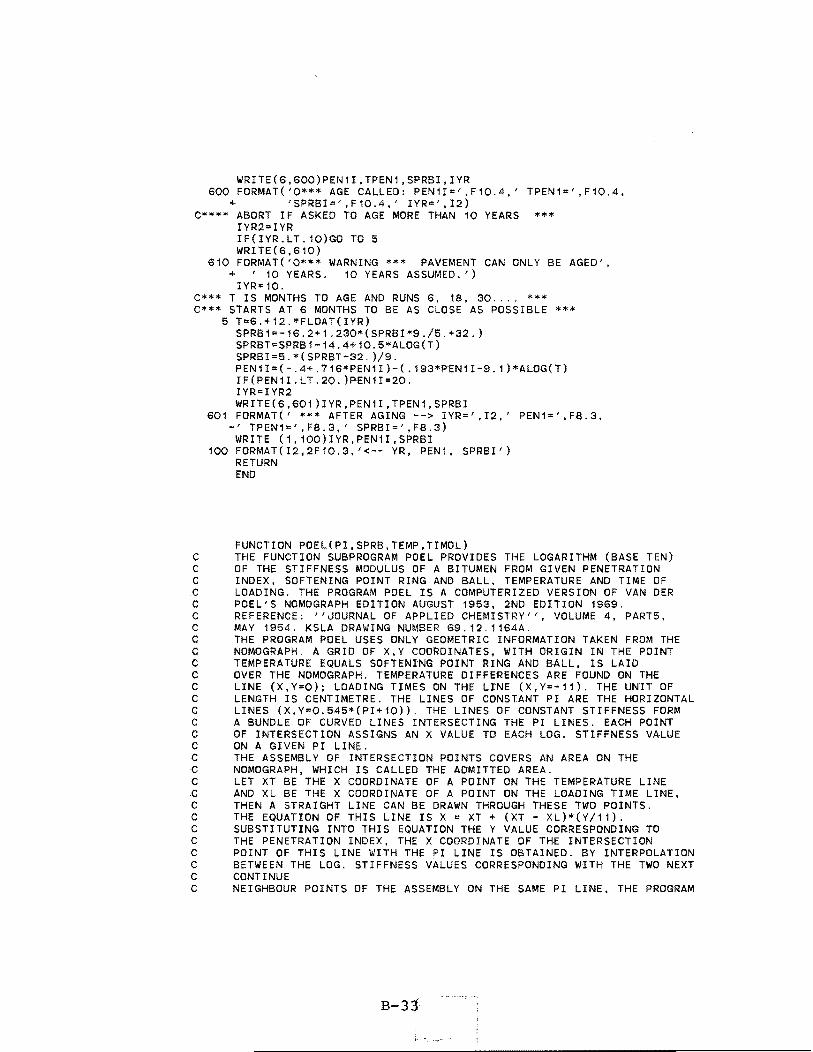
WRITE(6,600)PEN1I,TPEN1,SPRBI,IYR 600 FORMAT('O*** AGE CALLED: PEN1I=',F10.4,' TPEN1=',F10.4,
+ 'SPRBI"",F10.4,' IYR=',I2) C**** ABORT IF ASKED TO AGE MORE THAN 10 YEARS ***
IYR2=IYR IF(IYR.LT.10)GO TO 5 WRITE(6,610)
610 FORMAT('O*** WARNING *** PAVEMENT CAN ONLY BE AGED', + '10 YEARS. 10 YEARS ASSUMED.')
IYR=10. C*** T IS MONTHS TO AGE AND RUNS 6, 18, SO .... *** c*** STARTS AT 6 MONTHS TO BE AS CLOSE AS POSSIBLE ***
5 T=6.+12.*FLOAT(IYR) SPRB1=-16.2+1.2S0*(SPRBI*9./5.+S2.) SPRBT=SPRB1-14.4+10.5*ALOG(T) SPRBI=5.*(SPRBT-S2.)/9. PEN1I=(-.4+.716*PEN1I)-(.19S*P~N1I-9.1)*ALOG(T) IF(PEN1I.LT.20.)PEN1I=20. IYR=IYR2 WRITE(6,601 )IYR,PENlI, TPEN1,SPRBI
601 FORMAT(' *** AFTER AGING --> IYR=' ,12,' PEN1=',FS.S, -' TPEN1=' ,FS.S,' SPRBI=',FS.S)
WRITE (1,100)IYR,PEN1I,SPRBI 100 FORMAT(I2,2F10.S,'<-- YR, PEN1, SPRBI')
RETURN END
FUNCTION POEL(PI,SPRB,TEMP,TIMOL) C THE FUNCTION SUBPROGRAM POEL PROVIDES THE LOGARITHM (BASE TEN) C OF THE STIFFNESS MODULUS OF A BITUMEN FROM GIVEN PENETRATION C INDEX, SOFTENING POINT RING AND BALL, TEMPERATURE AND TIME OF C LOADING. THE PROGRAM POEL IS A COMPUTERIZED VERSION OF VAN DER C POEL'S NOMOGRAPH EDITION AUGUST t95S, 2ND EDITION 1969. C REFERENCE: "uOURNAL OF APPLIED CHEMISTRY", VOLUME 4, PART5, C MAY 1954. KSLA DRAWING NUMBER 69.12.1164A. C THE PROGRAM POEL USES ONLY GEOMETRIC INFORMATION TAKEN FROM THE C NOMOGRAPH. A GRID OF X.Y COORDINATES, WITH ORIGIN IN THE POINT C TEMPERATURE EQUALS SOFTENING POINT RING AND BALL. IS LAID C OVER THE NOMOGRAPH. TEMPERATURE DIFFERENCES ARE FOUND ON THE CLINE (X,Y=O); LOADING TIMES ON THE LINE (X,Y=-11). THE UNIT OF C LENGTH IS CENTIMETRE. THE LINES OF CONSTANT PI ARE THE HORIZONTAL CLINES (X,Y=0.545*(PI+10». THE LINES OF CONSTANT STIFFNESS FORM C A BUNDLE OF CURVED LINES INTERSECTING THE PI LINES. EACH POINT C OF INTERSECTION ASSIGNS AN X VALUE TO EACH LOG. STIFFNESS VALUE C ON A GIVEN PI LINE. C THE ASSEMBLY OF INTERSECTION POINTS COVERS AN AREA ON THE C NOMOGRAPH, WHICH IS CALLED THE ADMITTED AREA. C LET XT BE THE X COORDINATE OF A POINT ON THE TEMPERATURE LINE C AND XL BE THE X COORDINATE OF A POINT ON THE LOADING TIME LINE, C THEN A STRAIGHT LINE CAN BE DRAWN THROUGH THESE TWO POINTS. C THE EQUATION OF THIS LINE IS X = XT + (XT - XL)*(Y/11). C SUBSTITUTING INTO THIS EQUATION THE Y VALUE CORRESPONDING TO C THE PENETRATION INDEX. THE X COORDINATE OF THE INTERSECTION C POINT OF THIS LINE WITH THE PI LINE IS OBTAINED. BY INTERPOLATION C BETWEEN THE LOG. STIFFNESS VALUES CORRESPONDING WITH THE TWO NEXT C CONTINUE C NEIGHBOUR POINTS OF THE ASSEMBLY ON THE SAME PI LINE, THE PROGRAM
B-3~
C YIELDS THE REQUIRED LOG. STIFFNESS VALUE. C TO KEEP THE AMOUNT OF STORED DATA LIMITED, ONLY THE INTERSECTIONS C OF THE STIFFNESS LINES WITH INTEGER VALUE PI LINES ARE READ OUT. C C PI LINES ARE COUNTED FROM PI = -3 UP TO PI = +7, ~ITH VARIABLE I C RUNNING FROM 1 UP TO 11. C EQUI-STIFFNESS LINES ARE COUNTED FROM RIGHT TO LEFT, WITH VARIABLE C 0 RUNNING FROM 1 UP TO 46. C KSTIF(I) IS NUMBER OF INTERSECTION POINTS OF EQUI-STIFFNESS LINES C WITH NUMBER I PI LINE. C XSTIF(I,0) IS X COORDINATE OF INTERSECTION POINT OF NUMBER I PI C LINE WITH NUMBER 0 EQUI-STIFFNESS LINE. C THE ARRAY XTEMP CONTAINS THE X-COORDINATES OF THE 10-DEGREE C CALIBRATION MARKS ON THE TEMPERATURE LINE. C SMIN(I) IS SMALLEST LOG. STIFFNESS VALUE INTERSECTING NUMBER I C PI LINE. C TO KEEP STATEMENT LENGTH LIMITED TO 20 CARDS, THE X-COORDINATES C OF THE INTERSECTION POINTS OF EQUI-STIFFNESS LINES WITH PI LINES C ARE STORED IN THE ARRAYS XDUM1 AND XDUM2. THE EQUIVALENCE C STATEMENT IDENTIFIES THESE ARRAYS WITH THE ARRAY XSTIF(I.0). THE C VARIABLE I RUNNING FIRST, THE DATA SHOULD BE READ IN GROUPS OF C 11 NUMBERS.
POEL=-20. IF(PI.GT.7.) POEL=-21. IF(PI.LT.-3.) POEL=-22. IF (TIMOL. GT. 1 . E+ 10) POEL=-2.3. IF(TIMOL.LT.l.E-06) POEL=-24. IF(POEL.LT.-20.5.AND.POEL.GT.-24.5) GO T020
C XL IS X COORDINATE OF LOADING TIME; C XT IS X COORDINATE OF SPRB MINUS TEMP.
XL=(ALOG10(TIMOL)+3.953)*1.693 PI4=PI+4. IP=PI4 Yl=0.545*FLOAT(IP+6) XT=XDRT(SPRB.TEMP)
C XT=66. MEANS TEMPERATURE TOO LOW, WITH RESPECT TO S.P. RING & BALL C XT=67. MEANS TEMPERATURE TOO HIGH,WITH RESPECT TO S.P. RING & BALL
IF(XT.EQ.66.) POEL=-25. IF(XT.EQ.67.) POEL=-26. IF(XT.LT.68 .. AND.XT.GT.65.) GO T020 X=XT-(Y1/11.)*(XL-XT) SLOG 1 =SLOG(I p. X)
C SLOG=50. MEANS GLASSY STATE C SLOG=56. MEANS WHITE AREA
IF(SLOG1.EQ.50.) POEL=-27. IF(SLOG1.EQ.56.) POEL=-28. IF(SLOG1.LT.57 .. AND.SLOG1.GT.49.) GO T020 AIP=IP IF(PI4.EQ.AIP) GO T010 IP"'IP+l Y2=0.545*FLOAT(IP+6) X=XT-(Y2/11.)*(XL-XT) SLOG2=SLOG(IP,X) IF(SLOG2.EQ.50.) POEL=-27. IF(SLOG2.EQ.56.) POEL=-28. IF(SLOG2.LT.57 .. AND.SLOG2.GT.49.) GO T020-Y=0.545*(PI+l0.) SLOG3=SLOG1+(SLOG2-SLOG1)*«Y-Yl)/(Y2-Yl» SLOG1=SLOG3
10 POEL=SLOG1

20 CONTINUE RETURN END
BLOCK DATA COMMON/BLOCKT/XTEMP COMMON/BLOCKS/KSTIF,XSTIF,SMIN INTEGER KSTIF(11) REAL XSTIF( 11,46) ,XTEMP(34) ,SMIN( 11) ,XDUMl (209) ,XDUM2(297)
C EQUIVALENCE (XDUM1,XSTIF(1,1»,(XDUM2,XSTIF(1,20» EQUIVALENCE (XDUM1(1),XSTIF(1,1).(XDUM2(1),XSTIF(1,20» DATA XTEMP/-2.47,-2.37,-2.26,-2.14,-2.04.-1.89,-1.74,
--1 .. 6, -1 .42, -1 .2, - . 95, -.69, -.38,0. , .44, .97, 1 .55,2.21 , -2.88.3.61,4.42.5.23,6.09.6.98.7.98.8.81,9.72.10.62, -11 .53. 12.44, 13.34, 14.25, 15.15, 16.06/
DATA KSTIF/46,44,42,41,40,27,21,15,12,12.9/ DATA XDUM 1 /3.32,4.8,6.48,8. 19, 10. 1, 12. , 13.99, 16.3, 18.98,21 .
-81 ,25. 12,2. 15,3.49,5. 1,6.71 ,8.6, 10.42, 12.42, 14.68, 17. 13. 19. -81 .22.87. 1 .21 ,2. , 3 . 38,4.94,6.65,8.4. 10.26. t 2.21 , 14 . 5, 17.21 , -20.21, .91,1.49,2.52,3.75.5.3,6.9,8.61. 10.62,12.98, 15.54, 18. -52, .61, 1 . , 1 .71,2.75,3.98,5.33.6.8,8.7. 10.91, 13.43, 16.38, -.41 , .7. 1 .29.2.01 ,2.99,4. 13,5.48,7.24.9.49, 11 .9, 14.72,
. 18, .42, .8, 1 .4,2.26,3.23,4.44,5.99,7.81 , 10. 13. 13.08, --.1, .03, .29,.72,1.35,2.17,3.18,4.48,6.11,8.27,10.86, --.29. .21, - .01 , .31 , .81 , 1 .49,2.3,3.4,4.81 ,6.7,9. 17, -- .48, .42, - .3. - .08, .3, .8, 1 .41 ,2.31,3.51 , 5 . 2,0. , --.7,-.7,-.65,-.53,-.31,0., .45,1.11,2.09,3.41,0., --.86,-.9,-.92, .89,-.77,-.58.-.26 •. 27,1.03.2.16,0., --1.04,-1.13,-1.2,-1.2,-1.18,-1.08,-.88,-.53,3*0., - -1 .3, - 1 .42, -1 .54, - 1 .65, -1 .71, -1 .72, - 1 .65, -1 .5.3*0. , --1.46,-1.63.-1.82.-1.98,-2.09,-2.18,-2.2,-2.12,3*0., --1.66,-1.88,-2.07,-2.24,-2.43,-2.58,-2.69.4*0., --1.9,-2.15,-2.4,-2.62,-2.88,-3.1,-3.3,4*0. , --2.03,-2.31,-2.61,-2.91,-3.21,-3.5,-3.78,4*0., --2.2,-2.52,-2.88,-3.19,-3.57,-3.91,-4.24,4*0./
DATA XDUM2/-2 45,-2.79,-3.16,-3.52,-3.95,-4.37,-4.78,4*0., --2.63,-3.03,-3.45,-3.85,-4.3,-4.71,-5.18,4*0., --2.83,-3.26,-3,69,-4.12,-4.6,-5.04,5*0., --3.06,-3.5,-3.98,-4.46,-5.01,-5.51,5*0., --3.24,-3.71,-4.21,-4.72,-5.3,-5.89,5*0., --3.42.-3.95,-4.48,-5.02,-5.62,-6.2,5*0., --3.64,-4.2,-4.79,-5.38,-6.04,-6.7,5*0. , --3.81,-4.4,-5.02,-5.61,-6.3,-7.03,5*0. , --4.02,-4.6,-5.27,-5.9,-6.61,6*0.,-4.24,-4.89,-5.52,-6.20, --6.9,6*0.,-4.41,-5.08,-5.77,-6.46,-7.21,6*0. , --4.65,-5.31,-6.,-6.7,-7.48,6*0.,-4.85,-5.55,-6.31,-7.04, --7.79,6*0.,-5.03,-5.75,-6.53,-7.3,-8.15,6*0., --5.27,-6.,-6.81,-7.6,-8.43,6*0.,-5.49,-6.25,-7.09,-7.88, --8.72,6*0.,-5.65,-6.46,-7.28,-8.13,-9.06,6*0., --5.88,-6.67,-7.53,-8.4,-9.34,6*0.,-6.09,-6.92,-7.83, --8.71,-9.68,6*0.,-6.24,-7.18,-8.1,-9.,-10.;6*0., --6.88,-7.81,-8.8,-9.81,-10.91,6*0.,-7.49,-8.47,-9.57, --10.7,7*0.,-8.05,-9.14,-10.3,8*0.,-8.61,-9.77,9*0., --9.24,-10.38,9*0.,-9.8,10*0.,-10.41,10*0./
DATA SMIN/-10., -8., -6., -5., -4.,1. ,3.,5. ,6.,6.,7./ END
B-!:3S

C C
FUNCTION SLOG(IP,X) C RESULT IS LOG STIFFNESS (SLOG) FROM PI AND X. THE INTEGER VALUE C IP OF PI + 4. IS USED INSTEAD OF PI.
C C
INTEGER KSTIF(11) REAL XSTIF(11,46),SMIN(11) COMMON/BLOCKS/KSTIF.XSTIF, SMIN IF(X-XSTIF(IP ,1» 30,20.10
10 SLOG=50. GO T0140
20 SLOG=9.+ALOG10(2.5) GO T0140
SO IF(X-XSTIF(IP,KSTIF(IP») 40.50,60 40 SLOG=56.
GO T0140 50 SLOG=SMIN(IP)
GO T0140 60 KSTAF=KSTIF(IP)
D070 15=1,KSTAF M=I5 IF(X.GT.XSTIF(IP,I5» GO Toao
70 CONTINUE ao M1=M/3
M2=M-3*M1 AM1=M1 FRACT=(X-XSTIF(IP,M»/(XSTIF(IP,M-1)-XSTIF(IP,M» IF(M.EQ.2) GO T0130 IF(M.GT.39) GO T0120 IF(M2.EQ.0) GO T090 IF(M2.EQ.1) GO T0100 IF(M2.EQ.2) GO T0110
90 SLOG=10.-AM1+ALOG10(2.)*FRACT GO T0140
100 SLOG=9.-AM1+ALOG10(5.)+(1 .-ALOG10(5.»*FRACT GO T0140
110 SLOG=9. -AM1+ALOG10(2. )+(ALOG1O(5. )-ALOG10(2. ) )*FRACT GO T0140
120 M3=M-39 AM3=M3 SLOG=-3.-AM3+FRACT GO T0140
130 SLOG=9. +ALOG10( 2. )+( ALOGi0( 2.5) -ALOG1O(:2. ) )*FRACT 140 CONTINUE
RETURN END
FUNCTION XDRT(SPRB,TEMP) C RESULT IS HORIZONTAL COORDINATE XT CORRESPONDING TO TEMPERATURE C DIFFERENCE SPRB - TEMP.
REAL XTEMP(34) COMMON/BLOCKT/XTEMP DRT=SPRB-TEMP
C ADMITTED RANGE FOR DRT IS (-130,+2.00) Z=DRT+130.
B-

C
IF(Z-330.) 30.20,10 10 X=66.
GO T070 20 X=XTEMP(34)
GO T070 30 IF(Z) 40,50,60 40 X=67.
GO T070 50 X=XTEMP(1)
GO T070 60 N=INT(Z)/10
R=AMOD(Z. 10.) X=XTEMP(N+1)+(XTEMP(N+2)-XTEMP(N+1»*R/10.
70 XDRT=X RETURN END
SUBROUTINE TYPES(MODE,IWRITE,PI,SPRB,TEMP,TIMOL,PEN1,TPEN1,PEN2. - TPEN2,ALGS,CONST)
C***** SUBROUTINE TO PRODUCE OUTPUT DETAIL LINES ***** INTEGER NOTE(6, 8). LIST(6)
C
DATA NOTE/' * '. 'PI >', ' +7 '. ' 1 I * I P I < I. I -3 I J I » , ,
2 ' * 'LOAD'. 'lNG', 'TIME', ' > 1', 'E+10', 3 '* 'LOAD', 'lNG', 'TIME', '< 1', 'E-06', 4 ' * 'TEMP', 'ERAT', 'URE " 'TOO' 'LOW', 5 ' * 'TEMP'. 'ERAT', 'URE " 'TOO' 'HIGH', 6 ' * 'GLAS', 'SY S', 'TATE', ' 7 ' * 'WHIT', IE AR', 'EA
NTO 6 9000 FORMAT(1HO) 9010 FORMAT( 1H )
IF(IWRITE.GT.O) GO T010 ALG800=ALOG10(800.)
10 CONTINUE IF(MOD(IWRITE,35).EQ.0) GO T020 GO T060
20 CONTINUE WRITE(NTO.9000) WRITE TREE HEADLINES OF TABLE GO TO ( 30, 40. 50 ), MODE
30 WRITE(NTO,9020) 9020 FORMAT(' PI
-X ' ) WRITE (NTO ,9030)
9030 FORMAT('
SOFTENING
POINT R&B
TEMP.
WR ITE (NTO, 9040) 9040 FORMAT(' (DEG. C) (DEG. C)
-2) , ) GO TO 60
LOADING
TIME '
( S )
, '/
PEN.25
C . ,
40 WRITE(NTO,9050) 9050 FORMAT(' PI SOFTENING TEMP.
LOG. STIFFNESS COMPUTED ,) WR ITE (NTO , 9060)
9060 FORMAT ( , POINT R&B
B-17
I !.~
LOADING PEN.
TIME
SMI
(LB/IN**
PEN.
TEMP.

-STIFFNESS VISCOSITY ,) WRITE(NTO,9070)
9070 FORMAT ( I (DEG. C) (DEG. C) ( S ) (DEG. C) -(N/M**2) (N/M**2) (NS/M*"'2) I )
GO TO 60 C
50 WRITE(NTO,9080) 9080 FORMAT( f PI EPT 800 TEMP.
-FERENCE TEMP. OF PEN.RATIO LOG. WRITE(NTO,9090)
9090 FORMAT ( , -PEN. REF.PEN. (T+1S)/T STIFFNESS
WRITE(NTO,9100) 9100 FORMAT(' (DEG. C) (DEG. C)
(DEG. C) (N/M**2) 60 CONTINUE
ETA=S*TIMOL/S. ALGPR=(20.-PI)/«50./1S.)*(10.+PI» PENRAT=10.**ALGPR IF(MOD(IWRITE, S).EQ.O) WRITE(NTO,9010) IF(ALGS.GT.-20.) GO T070 GO T0110
70 CONTINUE SMIX = 10.0 ** ALGS * CONST
LOADING PEN. PEN. STIFFNESS COMPUTED I )
TIME TEMP. VISCOSITY' )
( S ) (DEG. C) (N/M**2) (NS/M**2)' )
C WRITE NUMERIC OUTPUT WITHOUT NOTE. GO TO ( 80. 90, 100 ), MODE
C CALCULATE IN CASE MODE = 1 PEN.2S FROM PI AND S.P. RING & BALL.
C
80 ALGP25=ALG800+«20.-PI)/(SOO.+SO.*PI»*(25.-SPRB) PEN:2S=10.**ALGP25 WRITE(NTO,9l10)PI,SPRB,TEMP,TIMOL,PEN2S,SMIX
9110 FORMAT(2X,FS.2,4X,F6.1,SX,F6.1,3X,1PE8.1,2X,OPF6.1,5X,1PE9.2,1X, - 1PE9.2,2X,1PE9.2)
GO T01GO 90 WRITE(NTO,9120)PI,SPRB,TEMP,TIMOL,PEN1,TPEN1,ALGS,S,ETA
9120 FORMAT(2X,FS.2,4X,FG.1,5X,F6.1,3X,1PEB.1,1X,OPF6.l,2X,FS.l,SX, - lPE9.2,1X,1PE9.2,2X,1PE9.2)
GO T0160 100 WRITE(NTO, 9130)PI ,SPRB, TEMP, TIMOL, PEN1, TPEN1, PEN2, TPEN2, PENRAT,
ALGS,S,ETA 9130 FORMAT(2X,FS.2,4X,F6.l,SX,F6.1,3X,lPE8.1,lX,OPF6.1,2X,FS.1.4X.
- F6.l,SX,FS.1,SX,F6.2,4X, lPE9.2.1X, lPE9.2,2X,1PE9.2) GO T0160
110 CONTINUE
RE
C WRITE NUMERIC OUTPUT WITH NOTE, DEPENDING ON (DUMMY) VALUE OF ALGS L=IABS(INT(ALGS-0.001»-20
C L HAS VALUE 1 UP TO 8 IF ALGS HAS VALUE -21. DOWN TO -28. D0120 1=1,6 LIST(I)-NOTE(I,L)
120 CONTINUE GO TO ( 130, 140, 150 ), MODE
130 ALGP2S=ALG800+«20.-PI)/(SOO.+SO.*PI»*(25.-SPRB) P~N2S=10.**ALGP25 WRITE(NTO,9140)PI,SPRB,TEMP,TIMOL,PEN2S,(LIST(I),I·1~G)
9140 FORMAT(2X,FS.2,4X,F6.l,SX,F6.1,3X,IPE8.1,2X,OPF6.1,2X,GA4) GO T01GO
140 WRITE(NTO,91S0)PI,SPRB,TEMP,TIMOL,PEN1-,TPEN1,(LI5T(I),I=1,G) 91S0 FORMAT(2X,FS.2,4X,F6.1,SX,F6.1,3X,1PE8.1,1X,OPFG.1,2X,FS.1,2X,GA4)
GO T01GO 1S0 WRITE(NTO. 9160)PI . SPRB, TEMP, TIMOL, PEN1 , TPEN1 ,PEN2. TPEN2. PENRAT,
B-r3lr i-'
- (LIST(I).I~1.6) 9160 FORMAT(2X,FS.2.4X,FG.1,SX,F6.1,3X,1PEB.1,1X,OPF6.1,2X,F5.1,4X,
- F6.1,SX,F5.1,SX.F6.2,1X,GA4) 160 CONTINUE
IWRITE=IWRITE+1 RETURN END
SUBROUTINE LINEAR ( N, X, Y. A. B ) C***** DO A SIMPLE LINEAR REGRESSION ON
DIMENSION X(N). yeN) X & Y ******
SUMN N SUMX 0.0 SUMY .. 0.0 SMX2 0.0 SMXY .. 0.0 DO 1100 I 1, N SUMX '" SUMX + XCI) SUMY SUMY + Y(I) SMX2 SMX2 + XCI) * XCI) SMXY .. SMXY + XCI) * Y(I)
1100 CONTINUE DETR A B RETURN END
'" ( SUMN * SMX2 - SUMX * SUMX ( SUMN * SMXY - SUMX *.SUMY
z ( SUMY * SMX2 - SUMX * SMXY
SUBROUTINE FINDTA ( NN, E1. E2, T )
/ DETR / OETR
C***** FIT LINE TO LOGLOG PLOT OF TEMP SHIFT VS TEMP DIFF ***** C***** TEMPERATURE IS VARIED TO PRODUCE BEST FIT *****
DIMENSION Ei(20). E2(20). T(20) DIMENSION X(20). Y(20), AT(20). TL(20)
SOO FORMAT ( 3F10.0 ) 5 1 0 FORMAT ( E 14 . 7 ) 600 FORMAT (' SMIX', E14.7,' TA'. F10.3,' BETA
1 E14.7,' INTERCEPT, B ,E14.7,' SOE2'. E14.7 C********** INITIALIZE SELECTION VARIABLES **********
ERRMIN:::999. TASEL;:999. ASEL=999. TM=2S. TA=-75. TINC=S. TAS
1000 CONTINUE SMIX IF ( SMIX TA DO 1200 I TL(I)
1200 CONTI NUE TLMC DO 1300 I
.. TA
;: 10.000 ** E1(2) / 2.0 .LE. O.OE+OO ) GO TO 1700
TAS 1, NN ( SMIX
::: TL(2) 1, NN
/10.0E+00 ** E1(I) ) ** ( 1.0E+00 / E2(I) )

AT(I) TL(I) / TLMC 1300 CONTINUE 1400 CONTINUE
TA TA + TINC DO 1500 I 1, NN XCI) ALOG10 ( T(I) - TA Y(I) ALOG10 ( AT(I)
1500 CONTINUE CALL LINEAR ( NN. X, Y, A. B SO.E2 '" O. OE+OO DO 1600 I 1, NN Z A * XCI) + B DIFF '" Z - Y(I) SOE2 '" SOE2 + DIFF * DIFF
1600 CONTINUE C********** SELECT TA AND B AT MINIMUM SOE2 **********
IF(ERRMIN.LT.SOE2)GOT02 ERRMIN=SOE2 TASEL"'TA ASEL=A WRITE (6,600) SMIX, TA. A, B. SOE2
2 IF ( TA .LE. -20.00E+00 ) GO TO 1400 1700 CONTINUE
C***** WRITE SELECTED TA AND BETA TO DISK FILE ******* WRITE (1,100)TASEL,ASEL
100 FORMAT(2F10.5,' <---- TA, CM') RETURN END

C C C C C C C C C C C C C C C C C C C C C C C C C C C C C C C C C C C C C C C C C C C C C C C C C C C C C C C C C C C C
*************************************************************
COMPUTER PROGRAM FOR THERMAL CRACKING MODEL (THERM) (USING THE RESULTS FROM VISCO)
*************************************************************
THE BITUMEN AGES WITH TIME.
*************************************************************
AUTHORS DR. ROBERT L. LYTTON MS. ULPALA L. SHANMUGHAM
TEXAS TRANSPORTATION INSTITUTE TEXAS A&M UNIVERSITY COLLEGE STATION, TEXAS 77843
*************************************************************
RESULTS PRINTED EVERY MONTH
*************************************************************
DESCRIPTION OF INPUT VARIABLES
*************************************************************
TITL W S
AK
B DO
OF VMPH NSEL SRi SRM IMODE IAGE
CV SPRB
TPEN2
PI PEN1 PEN2 IYR
SPRBI
CN
~ TITLE OF THE PROBLEM. DENSITY OF THE ASPHALT CONCRETE,PCF.
= SPECIFIC HEAT OF THE ASPHALT CONCRETE,BTU/LB, DEGREE FAHRENHEIT.
= THERMAL CONDUCTIVITY OF THE ASPHALT CONCRETE, BTU/SQUARE FOOT/HR, DEGREE FAHRENHEIT PER FOOT. THE ABSORBTIVITY OF THE ASPHALT CONCRETE. INITIAL CRACK LENGTH, INCHES (CRACK IS PROPAGATING DOWNWARDS). DEPTH OF THE ASPHALT CONRETE, INCHES. AVERAGE WIND VELOCITY, MPH. STARTING DATE: YR/MO/DY THE AVERAGE SOLAR RADIATION FOR JULY,LANGLEYS PER DAY. THE YEARLY AVERAGE·SOLAR RADIATION,LANGLEYS PER DAY.
= MODES, 1, 2,& 3 (NUMBER OF YEARS TO BE RUN) DR (THE NUMBER OF YEARS THE BITUMEN TO BE AGED), USUALLY BOTH ARE SAME. AGGREGATE VOLUME / ( AGGREGATE VOL + ASPHALT VOL) ORIGINAL SOFTENING POINT RING AND BALL TEMPERATURE, DEGREES C. ( IMODE = 1 OR 2 ) TEMPERATURE OF REFERENCE PENETRATION, DEGREES C. ( IMODE = 3 )~ ORIGINAL PENETRATION INDEX.( IMODE = 1 )
= PENETRATION AT 25 DEGREES C. ( IMODE • 2 OR 3 REFERENCE PENETRATION AT TPEN2. ( IMODE = :3 )
= THE NUMBER OF YEARS THE BITUMEN HAS AGED. ( IYR = 0 ( AGED 6 MONTHS, FOR FIRST YEAR ), IYR = 1 (AGED 18 MONTHS, FOR SECOND YEAR ), ETC
= SOFTENING POINT RING & BALL TEMPERATURE FOR THE CURRENT YEAR, DEGREES C. THE SLOPE OF THE MASTER RELAXATION MODULUS CURVE.
B+41

C C C C C C C C C C C C C C C C C C C C C C C C C C C C C C C C C C C C C C C C C C C C C C C C C C C C C C C C C C C C
D1
TA CM NDATE
NYEAR LL DAV(I ) TMAX( I) TMIN(I )
THE POWER OF THE INTERCEPT VALUE FOR LOG T=O OF THE MASTER RELAXATION MODULUS CURVE. THE POWER LAW CONSTANT FOR THE SHIFT FACTOR.
= THE SLOPE OF THE POWER LAW CURVE FOR THE SHIFT FACTOR. '" DATE, YR/MO/DY, IN THE WEATHER DATA TAPE.
(SCAN DOWN TAPE TO SELECTED DATE) YEAR. (2 DIGITS) MONTH. (2 DIGITS) DAY. (2 DIGITS) MAXIMUM TEMPERATURE DURING DAY(I),DEGREE FAHRENHEIT. MINIMUM TEMPERATURE DURING DAV(I),DEGREE FAHRENHEIT.
**************************************************************
INPUT DATA INFORMATION: -----------------------DATA FROM TAPE05 ----------------CARD COLUMNS/FORMAT VARIABLE NO. NAME
01 01-60 (15A4) TITL
02 01-10 F10.0 W 02 11-20 F10.0 S 02 21-30 F10.0 AK 02 31-40 F10.0 B
03 01-10 F10.0 DO 03 11-20 F10.0 DF 03 21-30 F10.0 VMPH
04 01-10 110 NSEL
05 01-10 F10.0 SRi 05 11-:20 F10.0 SRM
DATA FROM TAPE02 (RESULTS FROM VISCO PROGRAM)
CARD COLUMNS/FORMAT VARIABLE NO. NAME
01 01-02 12 IMODE 01 03-04 12 IAGE 01 05-14 F10.3 CV 01 15-24 F10.3 SPRB (IMODE=1,2) OR TPEN2 (IMODE=3) 01 25-34 F 10. 3 PI (IMODE=1) OR PENi (IMOOE=2,3) 01 35-44 F10.3 PEN2 ( FOR IMODE=3 ONLY )
02 01-02 12 IVR 02 03-12 F 10. 3 PEN1 02 13-22 Fi0.3 SPRBI
03 01-10 F10.5 CN 03 11-20 F10.5 01

C C C C C C C C C C C C C C C C C C C C C C C C C C C C C C C C C
04 04
01-10 11-20
Fi0.5 F10.5
TA CM
NOTE: CARDS 02-04 MUST BE REPEATED FOR EACH YEAR I, I = 1. . •• , IAGE
DATA FROM TAPEOi (WEATHER TAPE)
CARD COLUMNS/FORMAT VARIABLE NO. NAME
01 . 12-17 16 NDAH
02 12-13 12 NYEAR 02 14-15 12 LL 02 16-17 12 DAY(1) 02 20-22 F3.0 TMAX(1) 02 23-25 F3.0 TMIN(1)
03 12-13 12 NYEAR 03 16-17 12 DAY(I ) 03 20-22 F3.0 TMAX(I) 03 23-25 F3.0 TMIN(I )
NOTE: CARD 03 MUST BE REPEATED FOR EACH DAY OF THE ANALYSIS PERIOD. FORMAT OF THE CARDS 1, 2, & 3 MUST BE CHANGED ACCORDING TO THE FORMAT OF WEATHER DATA TAPE.
**************************************************************
IMPLICIT REAL*8 (A-H, O-Z) DIMENSION XX(3).TE(3,24),TI(3,24) DIMENSION TMAX(31),TMIN(31),AL(372),N(12) DIMENSION DAY(31) DIMENSION YC(2500), DYC(2500), K1(2500) DIMENSION NF(2500). DN(2500), TITL(i5), NFi(2500) COMMON /Ai/ CN, CM, TM, TR, TA, Ei, EE COMMON /A2/ SAi, SA2, SB1. SB2 COMMON /AS/ Mi, M2, MS, M4 COMMON /A4/ TC(12), TH(i2) INTEGER DAY INTEGER MOS(i2)/'JAN','FEB','MAR','APR','MAY','JUN',
1 'JUL', 'AUG', 'SEP', 'OCT'. 'NOV', 'DEC' / REAL*8 M1, M2, M3, M4, K1, NF, KTMX, KTMN, NFi
500 FORMAT ( 15A4 ) 520 FORMAT ( 8F10.0 530 FORMAT ( 8110 )
C********** INPUT DATA FOR NEW PROBLEM ********** 8 READ(5,500,END=999)TITL
READ (5,520) W, S, AK, B READ (5,520) DO, OF, VMPH READ (5,5S0)NSEL READ (5,520) SRi, SRM
C**************************************** C TM IS THE REFERENCE TEMPERATURE OF THE MASTER C RELAXATION CURVE, DEGREE FAHRENHEIT. C TR IS THE TEMPERATURE OF THE STRESS FREE STATE.
B .. {43
r i· ,X'·,·J

C DEGREE FAHRENHEIT. C****************************************
TM=77 . TR=75. DZ=1.0
C C*****READ ORIGINAL PROPERTIES OF BITUMEN FROM VISCO FOR C*****DIFFERENT MODES 1, 2, OR 3. C
READ (2,208) IMODE, IAGE, CV, SPRB, PI, PEN2 SPRB"(SPRB*S./5.)+32. TPEN2 = SPRB
208 FORMAT ( 212, 4Fi0.3 ) WRITE (6, 6oo)TITL
600 FORMAT('i', 10(/), i0X, 'THERMAL CRACKING ANALYSIS FOR ',i5A4) WRITE(6,601)NSEL,IAGE
601 FORMAT(/,10X,'THIS ANALYSIS BEGINS AFTER ',16,' AND RUNS FOR ',12. + 'YEARS.')
WRITE(6,602) 602 FORMAT(/, 10X, 'THE BITUMEN USED HAS THE FOLLOWING ORIGINAL '
1 'PROPERTIES:' ) IF(IMODE.EQ.1)WRITE(6,603)PI
603 FORMAT( i5X, 'PENETRATION INDEX IF (IMODE. EO. 2 )WRlTE (6,605 )PI
605 FORMAT( i5X, 'PENETRATION AT 77 DEG F IF ( IMDDE .EO. 3 ) WRITE (6,6051) PI.
6051 FORMAT (15X, 'PE~ETRATION AT 77.0 DEG 1 15X, 'PENETRATION AT', F6.i,'
IF (IMODE .LT. 3) WRITE(6,606)SPRB
= ',Fi0.3)
.. ',F10.3) TPEN2, PEN2 F"', Fi0.3, I, DEG F " " Fi0.3
606 FORMAT(i5X,'SOFTENING POINT RING & BALL TEMP" ',Fi0.3,' DEG F') IF ( IMODE .EO. 3 ) WRITE (6,6065) TPEN2
6065 FORMAT ( 15X, 'TEMPERATURE OF REFERENCE PENETRATION'" Fi0.3, 1 ' DEG F' ) WRITE(6,607)DF,DO
607 FORMAT(i0X,'THE ASPHALT CONCRETE LAYER IS ',FtO.a,' INCHES THICK' + I, i0X, 'AND IS ASSUMED TO HAVE AN INITIAL CRACK OF ',F10.a, + I i0X, 'INCHES EXTENDING FROM THE SURFACE.')
WR IT E ( 6 , 608 ) 608 FORMAT(10X,'THE ASPHALT CONCRETE HAS THE FOLLOWING MIX'
1 'PROPERTIES:' ) WRITE(6,60S)CV,W,S,AK,B
60S FORMAT(15X, 'AGGREGATE VOLUME CONCENTRATION" ',Fi0.3, +1, i5X, 'DENSITY = ',Fi0.3,' LBS/FT**3' +1, i5X, 'SPECIFIC HEAT" ',F10.3,' BTU/LB DEG F' +1. 15X,'THERMAL CONDUCTIVITY" ',Fi0.3,' BTU/FT**2/HR,DEG F/FT' +1, i5X,'ABSORPTIVITY ',Fi0.3)
WRITE(6,6i0)VMPH,SRM,SRi 610 FORMAT(/, i0X, 'THE PAVEMENT IS ASSUMED TO BE SUBJECTED TO THE'
+1, i0X, 'FOLLOWING AVERAGE ENVIRONMENTAL CONDITIONS:' +1, 15X,'WIND VELOCITY" ',Fi0.a,' MILES PER HOUR' +1, 15X,'AVERAGE ANNUAL SOLAR RADIATION" ',Fi0.3,' LANGLEYS/DAY' +1, 15X,'AVERAGE JULY SOLAR RADIATION" ',Fi0.3,' LANGLEYS/DAY')
C********** INITIALIZE CONSTANTS ********** ACON=i.0DO ID YC( 1) CDMG CDMG1 IKOUNT
o .. DO
O.ODO 0.000 1
C********** DAYS IN THE MONTH **********
N( 1)=31 N(2)=28 N(3)=31 N(4)=30 N(5)=31 N(6)=30 N(7)=31 N(8)=31 N(9)=30 N( 10)=31 N(11)=30 N(12)'"31 XYZTIM'" 14.0 XY ZT EM=80 . OD.O DZ=10.DO**DZ EE=DZ
t8 CONTINUE DO 109 I0K=1,360 F=I0K/57.2958 AL(IJK) = SRM + (SR1-SRM) * DCOS( F )/0.966
1 09 CONTI NU E DO 108 IJK=361 ,366 AL(IJK) =AL( 3GO)
108 CONTI NU E 138 CONTINUE
C****** THE UPPER LIMIT ON THE RELAXATION MODULUS CURVE IS SPECIFIED SBTMAX .. 3.625D+05 ESSM .. SBTMAX * (1..0DO + 2.52DO * (CV/(1.0-CV») ** 0.9923DO
C********** SCAN DOWN TAPE TO SELECTED DATE ************ 9 READ(1,101)NOATE
101 FORMAT(11X,I6) IF(NDATE.LT.NSEL)GOT09
C**********TAPE NOW IS AT STARTING POINT ************** C********** DO ONE YEAR AT A TIME **********
DO 3 13=1, IAGE C********** READ VARIABLES FROM VISCO *********
READ(2.201)IYR,PEN1,SPRBI SPRBI=(SPRBI*9./5.)+32
201 FORMAT(I2,2F10.3) REAO(2,200)CN,D1 READ(2,200)TA,CM
200 FORMAT(2F10.5) CNe-CN CM=-CM 01=10.000*"'01
16 E1=D1 I3M1=I3-1
C****** FATIGUE PARAMETERS, CA & FN, ARE CALCULATED ***** C SCFT IS THE SCALING FACTOR TO CALCULATE FN C AFAT AND BFAT ARE EMPIRICAL CONSTANTS THAT C RELATE CA ANO FN. C***********************************************
SCFT=2.5 FN=(1.+1./CN)*(2./SCFT) AFAT=0.69 BFAT=-0.511 CA=10.**«AFAT+FN)/BFAT) WRITE (6.667)
667 FORMAT ( // ) IF ( MOO(IYR,2) .EO. 0 ) WRITE (6,666)
. B-45

666 FORMAT ( 1H1, IIII ) WRITE(6,604)IYR,PEN1,SPRBI.CA,FN
604 FORMAT( 10X, ' *** YEAR ',12,' ***'1, 1 10X, ' IN PLACE BITUMIN PROPERTIES:', + I, 15X, 'PENETRATION AT 77 DEG F "'.F10.3 + 1,15X,'SOFTENING POINT RING & BALL TEMP" ',F10.3.' DEG F'. + II, 10X. ' FATIGUE PARAMETERS OF THE MIX:'. + I, 15X, 'A"', E10.3,' N" '. F8.3. II )
WRITE (6,3457) CALL CURVE(TH,TC) TC(12) " TC(11) TH( 12) " TH( 11)
C********** DO ONE MONTH AT A TIME ********** DO 1 Lv " 1. 12
997 READ (1.1233) NYEAR, LL, DAY(1), TMAX(1), TMIN(1) 1233 FORMAT (11X,3I2,2X,2F3.0)
IF(TMAX(1):EQ.999)GOT0997 M " MOD(NYEAR.4) N(2) 28 IF ( M .EQ. 0 ) N(2) = 29 vYR N(LL) DO 3333 I " 2.vYR READ (1.1234) NYEAR. DAY(I). TMAX(I), TMIN(I)
1234 FORMAT(11X.I2,2X,I2,2X.2F3.0) 3333 CONTINUE
C********** ADD A DAY IF LEAP YEAR ********** MAXDAY "365 + N(2) - 28
C********** TEMPORARY DEBUG OUTPUT ********** C********** DO ONCE FOR EACH DAY IN MONTH **********
DO 2 NI"1,vYR TRANG = O.ODO IF ( TMIN(NI) . GE. TR ) GO TO 2 TAVG=0.5*(DMIN1(TR,TMAX(NI»+DMIN1(TR,TMIN(NI») TRANG = DMIN1( TR,TMAX(NI) ) - DMIN1(TR,TMIN(NI» AH=1.3+0.62*(VMPH/24.)**0.75 H=AH/AK AC=AK/(s*W) C=(O 131/AC)**0.5 R=0.67*B*3 69*AL(IKOUNT)/(24.*AH)
C**************************************************** C SET UP TO CALCULATE TEMPERATURE OF TOP, MIDDLE, AND C BOTTOM OF PAVEMENT. C XX(1)= BOTTOM TEMPERATURE C XX(2)= MIDDLE TEMPERATURE C XX(3)" TOP TEMPERATURE C TEMPERATURE CALCULATED EACH HOUR FOR A COMPLETE DAY c****************************************************
DO 10 ITHCK= 1,3 XX(ITHCK)"DF/ITHCK IF(ITHCK.EQ.3)XX(3)=0.ODO Z2=(-XX(ITHCK»*C/12.0 Z3 = DEXP(Z2) * H/« H+C)**2. + C**2.) ** 0.5 DO 10 v=2,25 TIM=v IF(v.GT.9) GO TO 31 Z4=6.8176*( .0576*TIM+0. 144*Z2-0.288) GO TO 35
31 IF(v.GT.14) GO TO 32 Z4=+14.7534*(0.02057*TIM+0.075*Z2-0.2BB) GO TO 35
B-46

32 Z4=-G.94274*(0.02057*TIM+0.12*Z2-0.288) 35 Z5 = DSIN(Z4)
IF ( Z5) 21.22.22 21 TMEAN=TAVG+0.5*R
T\{=.5*TRANG GO TO 23
22 TV=.5*TRANG+3.*R TMEAN=TAVG+R
23 TEMP=TMEAN+TV*Z3*Z5 IF(J.GT.19) TIM=TIM-24 ITM .. TIM + 5 TE(ITHCK.ITM)=TEMP TI(ITHCK.ITM)=ITM
10 CONTINUE C********** 1 DAYS CALCULATIONS COMPLETE **********
20 IKOUNT=IKOUNT+1 IF( IKOUNT. EQ .MAXDAY) IKOUNT=1 DO 110 L 1 "'1 .3 DO 110 L=2. 23 IF(TE(L1,L).LE.TE(L1.L-1).AND.TE(L1,L).LE.TE(L1.L+1» GO TO 112 GO TO 118
112 CONTINUE C********** MINIMUM TEMPERATURES HAVE BEEN CALCULATED **********
IF(L1.EQ.1)TEMP1=TE(1.L) IF(L1.EQ.2)TEMP2=TE(2.L) IF(L1.EQ.3)TEMP3=TE(3,L)
C********** TIME FOR MINIMUM TEMPERATURES ********** IF(L1.EQ.1 )TIM1=TI( 1, L) IF(L1.EQ.2)TIM2=TI(2,L) IF(L1,EQ.3)TIM3=TI(3.L)
118 CONTINUE C********** NOW CALCULATE MAX TEMPERATURES **********
IF(TE(L1.L).GT.TE(L1,L-1).AND.TE(L1,L).GT.TE(L1.L+1» GO TO 113 GO TO 110
113 CONTINUE IF(L1.EQ.1)TEMP4=TE(L1;L) IF(L1,EQ.2)TEMP5=TE(L1.L) IF(L1.EQ.3)TEMP6=TE(L1.L) IF(L1.EQ,1)TEMP7=TE(L1.L+1) IF(L1.EQ,2)TEMP8=TE(L1.L+1) IF(L1.EQ.3)TEMP9=TE(L1.L+1)
C********** TIME FOR MAXIMUM TEMPERATURES ********** IF(L1.EQ.1)TIM4=TI(L1.L) IF(L1.EQ.2)TIM5=TI(L1,L) IF(L1.EQ.3)TIMG=TI(L1,L)
110 CONTINUE C********************************************************* C IF THE MAX TEMPERATURE IS ABOVE 75 F, FIND TIME AT WHICH C.75 F OCCURS. DEL IS TEMP DROP PER HOUR C*********************************************************
DEL1=(TEMP4-TEMP1)/(-TIM4+TIM1) DEL2= (TEMP5-TEMP2) / (-TIM5+TIM2) DEL3=(TEMP6-TEMP3)/(-TIM6+TIMS) IF(TEMP4.GT.TR) TIM4=TIM4+(TEMP4-TR)/DEL1 I~(TEMP5.GT.TR) TIM5=TIM5+(TEMP5-TR)/DEL2 rF(TEMPG.GT.TR) TIM6=TIM6+(TEMP6-TR)/DELS
c***** CALCULATE AVG MIN TEMP OF PAVEMENT****** TMEN=(1./S.)*(TEMP1+TEMP2+TEMPS) IF ( TMEN .LT. TR ) GO TO 231 TRANG '" O.ODO
B-

GO TO 2 231 CONTINUE
10 = 10 + 1 ON(IO) = 1.000
C**** CALCULATE AVG MAX TEMP OF PAVEMENT ****** TMEX=(1./3.)*(TEMP4+TEMP5+TEMP6) IF(TMEX.GT.TR) TMEX=TR
C**** CALCULATE AVG TIME FOR MIN TEMP AND MAX TEMP ******* TIMMIN=(TIM1+TIM2+TIM3)/3.0 TIMMAX=(TIM4+TIM5+TIM6)/3. PERIOO=24.0-XYZTIM+TIMMIN XYZTIM=TIMMAX OLTN=TMEN-TR OLTX=TMEX-TR XYZTEM=TMEX
1000 CONTI NUE KTMX .. 0.000 KTMN 0.000 TRMX OMAX1 ( 0.000. TR-TMAX(NI) ) TRMN TR - TMIN(NI)
C*** CALCULATE STRESS INTENSITY FACTOR FOR MIN & MAX TEMP **** CALL FACTOR OF, OLTX, PERIOD, TRMX. 10, YC. SA1, S61. KTMX.
* NYEAR. LJ. ESSM ) CALL FACTOR ( OF. OLTN. PERIO~. TRMN. 10. YC. SA2. S62. KTMN.
* NYEAR. LJ. ESSM ) K1 (IO) OYC( 10) IF (K1(I0) 10 = 10-1 GO TO 2
KTMN - KTMX 0.000
.GT. 0.000) GO TO 875
875 CONTINUE ZO = YC(IO) Z1 = OF Z01 " 0.000 IF ( ZO .LT. Z1 ) CALL Nf(IO) = ACON + Z01 ACON=O.OOO
SIMPSN CA. FN, ZOo Z1. Z01 )
IF ( NF(IO) .GT. 0.000 ) COMG COMG + ON(IO)/NF(ID) OYC(IO) .. ON(IO) * CA * (K1(IO) ** FN) IF(NF(IO).LE.O.OOO)OYC(IO)=O.
876 YC(IO+1) YC(IO) + OYC(IO) Z01 .. 0.000 CALL SIMPSN ( CA. FN. ~O. OF, Z01 ) NF1(IO) = 1.00 + Z01 COMG1 = COMG1 + ON(IO)/NF1(IO) IF ( YC(IO+1) .LE. OF ) GO TO 9880 WRITE (6.3456) IYR, MOS(LL). DAY(NI). NYEAR,
1 lD. NF(IO), NF1(I0), YC(ID), COMG, COMG1 IF ( YC( 10+1) . LE. OF ) GO TO 9880 YC(ID+1) = OF
9880 CONTINUE 2 CONTINUE
YCID " YC(ID) IF ( 10 . EO. 0 WRITE (6.3456)
) YClD = DO IYR. MOS(LL). JYR, NYEAR,
1 3456 FORMAT
1 3457 FORMAT
1
10. Nf(ID). NF1(IO). YCID, COMG, CDMG1 11X, 12. 2X. A4, 12, " 19'. 12. 1X. 15, 5E13.6 ) 11X, 'NO', 6X, 'DATE', 8X. '10', 6X, 'NF'. lOX. 'NF1', l1X,

2 'YC'. 10X, 'CDMG', 9X. 'CDMG1', / ) 1 CONTINUE 3 CONTINUE
C********** REWIND FILE AND PROCESS NEXT PROBLEM ********** REWIND 1 GOTO 8
999 STOP END
SUBROUTINE CURVE(TH,TC) C*** CURVE CALCULATES TH AND Te. HEATING AND COOLING TEMPS ***
IMPLICIT REAL*8 (A-H.O-Z) DIMENSION TH(11),TC(11) COMMON /Ai/ CN.CM.TM,TR.TA,E1,EE COMMON /GT/ GAB1 DIMENSION F(50) COMMON HH(11),ZZ COMMON /KK/ I
100 CONTI NU E INT=40 A=CM/(CM+1.0)+CN-2.0 B=-CN DM=(1.0-CN)/(CM+1.0)**(1.0-CN) GA=DGAMMA(A+i.0) GB1=DGAMMA(B+i.0) GAB1=GA*GB1/DGAMMA(A+B+2.0) TH(1)=1.0 TC(1)=1.0 TC( 11 )=O.ODO DO 40 INDEX=1,2 HH( 1) 1.0 AREA=O.ODO ZZ=O.ODO DTN=O.ODO DO 10 I" 1 , 1 0 DTN=DTN+O. 1 DTR=DABS(DTN) IF(INDEX.EQ.1) GO TO 21 H=(DTN+1.0)**(CM+1.0) HH(I+1)=H HS=(HH(I+1)-HH(I»/(INT-1) CALL HEAT(A,B,H,INT,F,AREA,HS) CONS=DM*(1.o+1.0/DTN)**(1.0-CN) TIl =CONS*AREA TH(I+ 1) =TI I GO TO 25
21 CONTINUE IF(I.EQ.10) GO TO 10 RR=-DTR H=(1.0+RR)**(CM+1.0) HH(I+1)=H HS=(HH(I)-HH(I+1»/(INT-1) CALL COOL(A,B,H,AREA) CONS=DM*(-1.0-i.0/RR)**(1.0-CN) TII=CONS*AREA TC(I+1)=TII
25 CONTINUE
B-49

10 CONTINUE 40 CONTINUE.
RETURN END
SUBROUTINE HEAT(A,B,H,INT,F,AREA,HS) IMPLICIT REAL*8 (A-H,O-Z) DIMENSION F(INT) COMMON HH(11),ZZ COMMON /KK/ I DA=H**(A+1.0)*(-1.0+H)**(B+1.0)/(B+1.0) DB=-(A+B+2 .0)/(B+1 .0)--DO 10 J=.1, INT XX=HH(I)+HS*(J-1)
10 F(J)=XX**A*(-1.0+XX)**(B+1.0) CALL INTGRT(INT,F,HS,AR) ZZ=ZZ+AR AREA=DA+ZZ*DB RETURN END
SUBROUTINE INTGRT(N,F,H,AREA) IMPLICIT REAL*8 (A-H.O-Z) DIMENSION F(N) AREA=O.ODO S=0.5*H DO 10 I=2,N AREA=AREA+S*(F(I-1)+F(I»
10 CONTINUE RETURN END
SUBROUTINE COOL (A,B.H,AREA) IMPLICIT REAL*8 (A-H,O-Z) REAL*4 SH,SA1.SB2,SP REAL*4 SNGL COMMON /GT/ GAB1 A1=A+1.0 B1=B+1.0. P=O.ODO SH=SNGL(H) SA1 = SNGL(A1) SB2=SNGL(B1) SP=SNGL(P)
10 CONTINUE P=DBLE(SP) H=DBLE(SH) A1=DBLE(SA1) B2=DBLE(SB2) AREA=GAB1*(1.DO-P) RETURN
B-50.

END
SUBROUTINE FACTOR ( DF, DELT, PERIOD, TRG, 10, YC, SA, SB, XXX. * NYEAR, Lv, ESSM )
C*************************************************************** C* CALCULATES STRESS INTENSITY FACTOR FOR A GIVEN PAVEMENT * C* C* C* C* C* C* C* C* C*
OF = DEPTH OF ASPHALT LAYER DELT = PAVEMENT TEMP - STRESS FREE TEMP PERIOD LOADING TIME TRG "STRESS FREE TEMP - MAX AIR TEMP 10 DAY COUNTER YC CRACK LENGTH SA,SB" CONSTANTS TO CALCULATE STRESS INTENSITY FACTOR XXX STRESS INTENSITY FACTOR
* * * * * * * * *
C*************************************************************** IMPLICIT REAL*8 (A-H.O-Z) REAL*8 M1, M2, M3, M4 DIMENSION YC(2500) COMMON IA11 CN. CM, TM, TR, TA. E1. EE COMMON IA31 M1, M2. M3, M4 COMMON IA41 TC(12), TH(12) SA O.ODO SB O.ODO XXX O.ODO DT"DELT IF (PERIOD.LT.1.0) PERIOD=1.0 TIME"PERIOD*3600. TTN=TIME** (-CN) T=TR+DT AT=«TM-TA)/(T-TA»**CM ATN=AT**CN DTN=OT/(TR-TA) DTR=DABS(DTN*10.0) NN=IDINT(DTR) DIF"DTR-NN NG .. NN + 1 IF ( NG . LE. 11 ) GO TO 99 WRITE (6.654)
654 FORMAT ( 5X, 'NG IS GREATER THAN 11. SET NG .. 11', II NG .. 11
99 CONTINUE C** CALCULATION OF EFF MODULUS. SEE P. 17, REPORT 18-3 ***
IF(DELT) 90,29.30 90 RATIO = (TC(NG+1) - TC(NG» * DIF + TC(NG)
"'=1 GO TO 120.
29 RATIO=1.DO "'=3 GO TO 120
30 RATIO" (TH(NG+1) - TH(NG» * DIF + TH(NG) "'=2
120 CONTINUE ESS=ATN*E1*TTN/(1.DO-CN) IF (ESS .GT. ESSM) ESS ESSM EEF .. EE + RATIO * ( ESS - EE ) M1 = 8.8988D+00
B-SI

M2 M3 M4
= 2.05990+00 = 0.84810+00 =-0.001570+00
.GE. 1.0000+05 ) GO TO 978 IF ( EEF M1
1 M2
1
M1 + ( 29.10630+00 - OF ) * ( 1.35730+00 - 0.0135730+00 * ( EEF / 1000.000) ) = M2 - ( 129.32150+00 - Of ) * ( 0.01687+00 - 0.00016870+00 * ( EEF / 1000.000) )
.GT. 4.000 ) GO TO 988
1
IF ( OF M3 M3 + ( 2.78110+00 - OF ) * ( 0.27380+00
- 0.0027380+00 * ( EEF / 1000.000) ) GO TO 987
988 CONTINUE M3
1 = M3 - ( 6.58350+00 - OF ) * ( 0.129190+00 -0.00129190+00 * ( EEF / 1000.000»
987 CONTINUE M4
1 978 IF ( TRG
SA SB XXX RETURN END
= M4 + ( 5.04720+00 - OF - 0.000011290+00 * ( EEF
.LE. M1 ) RETURN M2 * ( TRG - M1 )
= M3 + M4 * TRG = SA * YC(IO) ** 5B
) * ( 0.0011290+00 / 1000.000) )
SUBROUTINE SIMPSN ( CA. FN. XF. XL, AREA) IMPLICIT REAL*8 (A-H,O-Z) REAL*8 KMIN. KMAX OIMENSION Y(7) COMMON /A2/ SA1. SA2. SB1, 5B2 NS 6 NP 7 XINC = ( XL - XF ) / 6.0000+00 X XF DO 1100 = 1, NP F SA2 * X ** 5B2 - SA1 * X ** SB1 YI CA * DABS(F) ** FN Y(I) 1.0000+00 / VI X = X + XINC
1100 CONTINUE AREA = 0.000 00 1200 I 1, NS. 2 A Y(I) + 4.0000+00 * Y(I+1) + Y(I+2) A A * XINC / 3.0000+00 AREA AREA + A
1200 CONTINUE RETURN END
B-52 -."

C******************************************************************* C* * C* COMPUTER PROGRAM ( VISC01 * C* TO DETERMINE * C* VISCOELASTIC PROPERTIES OF ASPHALT CONCRETE * C* * C******************************************************************* C* EXPLANATION OF INPUT VARIABLES * C* ------------------------------ * C* * C* C* C* C* C* C* C* C* C* C* C* C* C* C* C* C*
PINIT
SPINIT
P1INIT
P2INIT
TPEN2
CV
IYRS
PENETRATION INDEX. (PI I) * *
SOFTENING POINT RING & BALL, DEGREES c, (SPRBI) * *
PENETRATION AT 25 DEGREES c, (PEN1) * *
REFERENCE PENETRATION AT TPEN2, (PEN2) * *
TEMPERATURE OF REF. PENETRATION, DEGREES C * *
[AGGREGATE VOLJ/([AGGREGATE VOL]+[ASPHALT VOL) * *
NUMBER OF YEARS ASPHALT IS TO BE AGED * * * *
C* THIS PROGRAM CAN OPERATE IN THREE DIFFERENT MODES, SELECTED * C* BY THE INPUT VARIABLE MODE. INPUT REQUIRED FOR EACH MODE IS AS * c* FOLLOWS: * C* C*
'C* C* C* C* C* C* c* C* c* C* C* C* C* c* C* C* C* C* C* C*
CARD 01
CARD 02
MODE
1 2 3
DATA ENTERED
MODE
DATA ENTERED
PINIT,SPINIT,CV,IYRS P1INIT,SPINIT,CV,IYRS P 1 INIT, P2INIT, TPEN2, CV, IYRS
INPUT FORMAT
(I 1)
INPUT FORMAT
(3 F 1 0 . 2 , I 5 ) (3F10.2,I5) (4F10.2,I5)
* * * * * * * * * * * * * * * * * * * * * *
C* NOTE: A BLANK CARD SHOULD BE INSERTED AT THE END OF ALL * C* DATA CARDS * c* * C* * C* SEE COMMENTS IN FUNCTION POEL FOR FURTHER INFORMATION. * C* * C*******************~********************************* **************
DIMENSION X(20),Y(20),E1(20),E2(20),E3(20) REAL TEMPS(3)/0.0,25. ,60./

C********** NTT " NTO .,
DEFINE INPUT AND OUTPUT UNITS ********** 5 6
C********** INITIALIZE CONSTANTS ********** KPI=1 KSPRB=1 KTEMP=1 TIMOLI"1.0E+05 KTIMOL=7 FTIMOL=. 1 KPEN1=1 TPEN1=25. CONTINUE NN = 0
C********** INPUT MOOE 1.2, OR 3 ********** 10 READ(NTT.S010.END=SSSS)MODE
C********** W~ITE PAGE HEADER ********** C********** PERFORM SELECTED MODE CALCULATIONS **********
GO TO(100,200,300) ,MODE WRITE (NTO. 9050) STOP 1
C*************** MOD E ***************************** C* * C* PII AND SPRSI ARE READ IN DIRECTLY * C* * C************************************************************
100 READ(NTT,9210)PINIT.SPINIT,CV,IYRS WRITE (1,1001) MODE. IYRS, CV, SPINIT, PINIT
1001 FORMAT ( 212. 3F10.3. lOX, '<-- MODE. YRS. CV. SPRS. PI' ) IYRT "IYRS + 1 DO 102 IY=1,IYRT IYR=IY-2 PII=PINIT SPRSI=SPINIT NN=O
C***** AGE ASPHALT ***** CALL CONV(MODE,IYR,PII,SPRBI.TPEN1,O.)
C********** LODP FOR 3 TEMPERATURES ********** DO 101 1101=1.3 TEMPI=TEMPS(I101) IWRITE=O WRITE (NTO, S030) WRITE(NTO,S040)MODE
c********** WRITE OUT INPUTS ********** WRITE(NTO,S070)PINIT.IYR,PII WRITE(NTO,SOSO)SPINIT.IYR,SPRBI WRITE(NTO.S110)TEMPI,KTEMP WRITE(NTO,S140)TIMOLI,KTIMOL WRITE(NTO.S150)FTIMOL PI=PII SPRB=SPRBI TEMP=TEMPI TIMOL=TIMOLI CALL CALC(NP,PI,SPRB,TEMP,TIMOL,X,Y,MODE,IWRITE,FTIMOL,NN,
+ E1,E2,E3,KTIMOL,CV) 101 CONTINUE 102 CALL FINDTA(NN,E1,E2.E3)
GO TO 1 C*************** MOD E C*
2 *~***************************
*

C* PII CALCULATED FROM PENETRATION VALUE AND SPRBI C*
* *
C************************************************************ 20.0. READ(NTT,921C)P1INIT,SPINIT,CV,IYRS
WRITE (1,10.0.2) MODE, IYRS, CV, SPINIT., P1INIT 10.0.2 FORMAT ( 212, 3F1C.3, 1CX, '<-- MODE, YRS, CV, SPRB, PEN1'
c*** AGE ASPHALT *** IYRT = IYRS + 1 DO 20.2 I2C2=1.IYRT IYR=I20,2-2 PEN1 I"P1 INIT SPRBI=SPINIT NN=C CALL AGE(IYR,PEN1I.TPEN1,SPRBI)
C********** LDDP FDR 3 TEMPERATURES ********** DO 20.1 120.1=1,3 TEMPI=TEMPS(I2C1) IWRITE=C WRITE (NTO. 90.30.) WRITE(NTC~~C4C)MODE WRITE (NTD, 916C)P 1 INIT • IYR, PEN 1 I WRITE (NTO. 91·8C)TPEN1 WRITE(NTD.9C9C)SPINIT.IYR,SPRBI WRITE(NTD,911C)TEMPI.KTEMP WRITE(NTO,914C)TIMOLI,KTIMOL WR ITE (NTO, 9150.) FTIMOL PEN1=PENlI SPRB=SPRBI A=(ALOG1D(8DD.)-ALOG1D(PEN1»/(SPRB-TPEN1) PI=(20.-5o.o..*A)/(1.+5o..*A) TEMP=TEMPI TIMOL=TIMOLI CALL CALC(NP. PI. SPRB, TEMP, TIMOL, X. Y, 1, IWRITE. FTIMOL, NN,
+ E1.E2.E3.KTIMDL,CV) 20.1 CONTINUE 20.2 CALL FINDTA(NN,E1.E2,E3)
GO TO. 1 C************* MaD E 3 ***************************************** C * C PI AND SOFTENING POINT RING & BALL ARE CALCULATED FROM THE TWD* C GIVEN PENETRATION VALUES AND CDRRESPONDING TEMPERATU.RES. * C * c********************************************************************
30.0. READ (NTT, 9211 )p 1INIT . P2INIT , TPEN2, CV, IYRS WRITE (1,10.0.3) MODE, IYRS, CV, TPEN2, P1INIT. P2INIT
10.03 FDRMAT ( 212, 4F1C.3, '<-- MDDE. YRS. CV, TPEN2, PEN1, PEN2' c*** AGE ASPHALT ***
IYRT = IYRS + 1 DO. 30.2 13D2=1.IYRT IYR=I3D2-2 PEN1=PlINIT PEN2=P2INIT NN=D CALL CONV(MODE.IYR,PEN1.PEN2.TPEN1.TPEN2) SPRB=PEN2 A=(ALOG1C(8DD.)-ALOG1D(PEN1»/(SPRB-IPEN1) PI (2D.-5DD.*A)/(1.+5D.*A)
C********** LOOP FOR 3 TEMPERATURES ***~****** DO. 3D 1 130. 1 = 1 • 3 TEMPI=TEMPS(I3D1)

IWRITE=O WR ITE (NTO, 9030) WRITE(NTO,9040)MODE WRITE(NTO,9160)P1INIT.IYR,PEN1 WRITE(NTO,9180)TPEN1 WRITE(NTO,9200)P2INIT,TPEN2 WRITE(NTO,9205)IYR,SPRB WRITE(NTO,9110)TEMPI,KTEMP WRITE(NTO,9140)TIMOLI,KTIMOL WRITE(NTO,9150)FTIMOL TEMP"'TEMPI TIMOL=TIMOLI CALL CALC(NP,PI,SPRB,TEMP,TIMOL,X,Y,1,IWRITE.FTIMOL,NN,
+ . E1,E2,E3,KTIMOL,CV) 301 CONTINUE 302 CALL FINDTA ( NN, E1. E2, E3 )
GO TO 1 9999 CONTINUE
STOP c********** FORMATS FOR MAIN PROGRAM **************
9010 FORMAT (I 1) 9030 FORMAT ( 'OSTIFFNESS OF MIX USING VAN DER POELS NOMOGRAPH') 9040 FORMAT ( 1X, 'INPUT DATA:' ,22X, 'MODE = ',14) 9050 FORMAT('1MODE MUST BE INTEGER 1 OR :2 OR 3 STOP.') 9070 FORMAT(/28X, 'INITIAL PI '. 1X,FS.2/26X,
-'AGED ',12,' YEAR(S) TO',FS.2) 9090 FORMAT(j1X,'INITIAL SOFTENING POINT RING AND BALL ',F6.1/1X,
-23X,'AGED ',12,' YEAR(S) TO ',F6.l} 9110 FORMAT(/19X,'INITIAL TEMPERATURE ',F6.1/8X,'NUMBER OF STEPS IN
- TEMPERATURE ',14) 9140 FORMAT(j18X,'INITIAL LOADING TIME ',1PE10.1/7X,'NUMBER OF STEP
-S IN LOADING TIME ',14) 91S0 FORMAT(4X,'MULTIPLYING FACTOR IN LOADING TIME ',F6.1) 9160 FORMAT(/19X,'INITIAL PENETRATION ',F6.1/25X,
-'AGED ',12,' YEAR(S) TO', F6.1 ) 9180 FORMAT(1SX,'PENETRATION TEMPERATURE ',F6.1) 9200 FORMAT( 17X, 'REFERENCE PENETRATION ' ,F6 .1/SX, 'REFERENCE PENETRA
-TION TEMPERATURE ',F6.1) 920S FORMAT( 17X, 'AGED ',12,' YEAR(S). SPRB ·',F8.1) 9210 FORMAT(3F10.2,IS) 9211 FORMAT(4F10.2,IS)
END
SUBROUTINE CALC(NP,PI,SPRB,TEMP,TIMOL,X,Y,MOOE.IWRITE, + FTIMOL,NN,E1,E2,E3,KTIMOL,CV)
C*** USE NOMOGRAPH AND SET UP VARS FOR REGRESSION *** DIMENSION X(20),Y(20),E1(20),E2(20),E3(20) NP = 0 0070 LTIMOL=1,KTIMOL ALGS=POEL(PI~SPRB,TEMP,TIMOL) IF ( ALGS.LT.-20.0) GO TO 65 NP '" NP+1 X(NP) = ALOG10(TIMOL) SB = 10**ALGS*1.4S0E-04*0.0703 SN = 0.83*ALOG10«4.0E+OS)/SB) CONST = ( 1.0 +(2.5/SN) * (CV/( 1.0-CV»)**SN * 0.00014S SMIX = 10.0 ** ALGS * CONST

Y(NP) = ALo.G10(SMIX) 65 Co.NTINUE
CALL TYPES(1,IWRITE,PI,SPRB,TEMP,TIMo.L,PEN1,TPEN1, + PEN2,TPEN2,ALGS,CDNST)
TIMo.L=TIMOL*FTIMo.L 70 CONTINUE
CALL LINEAR(NP,X,Y,EA,EB) NN = NN + 1 E1(NN) " EB E2(NN) " EA E3(NN) = TEMP WRITE (6,666) NN, E3(NN), E2(NN). E1(NN)
C**** SAVE CN AND 01 AT MASTER TEMPERATURE ****** IF(TEMP.NE.25.)RETURN WRITE (1,100)E2(NN),E1(.NN)
100 FDRMAT(2F10.5.' <---- CN, 01') RETURN
666 Fo.RMAT (, NN', 15. ' TEMP', E14.7. ' SLo.PE, M' E14.7, 1 INTERCEPT.E1', E14.7 )
END
SUBRo.UTINE Co.NV(Mo.DE, IYR, VAR 1. VAR2. VAR3, VAR4) C**** Co.NVERT TO. Mo.DE 2 TO. USE AGE Ro.UTINE *****
IF(Mo.DE.EQ.3)Go.To.2 C**** Co.NVERT FRo.M Mo.DE 1 TO. Mo.DE 2 AND AGE *****
PII=VAR1 SPRBI=VAR2 TPEN1=VAR3 A=(20.-PII)/(500.+50.*PII) DELTA=A*(SPRBI-25. ) PEN1I=10.**(ALo.G10(SOO.)-DELTA)
C***** No.W AGE ***** CALL AGE(IYR.PEN1I,TPEN1.SPRBI)
C***** Co.NVERT BACK TO. Mo.DE 1 AFTER AGING ***** A=(ALo.G10(SOO.)-ALo.G10(PEN1I»/(SPRBI-TPEN1) PII=(20.-500.*A)/(1.+50.*A) VAR1=PII VAR2=SPRBI RETURN
C********** Co.NVERT FRo.M MODE 3 TO. MODE 2 ********** 2 PEN1=VAR1
PEN2=VAR2 TPEN1=VAR3 TPEN2=VAR4 A=(ALOG10(PEN1)-ALo.G10(PEN2»/(TPEN1-TPEN2) DPEN=ALo.G10(SOO.)-ALo.G10(PEN2) SPRB=TPEN2+DPEN/A
c*** Nnw AGE *** CALL AGE(IYR,PEN1,TPEN1,SPRB)
C*** PASS BACK RESULTS TO. MAIN IN MODE 2 Fo.RM *** VAR1=PEN1 VAR2=SPRB RETURN END

SUBROUTINE AGE(IYR,PEN1I,TPEN1,SPRBI) IF ( IYR .GE. 0 ) GO TO 1234 WRITE (6,200)
200 FORMAT ( 'OUSING ORIGINAL PROPERIES OF BITUMEN (WITHOUT AGING)') WRITE (1,100) IYR, PEN1I. SPRBI RETURN
1234 CONTI NUE c********** AGES PAVEMENT USING MODE 2 VARIABLES **********
WRITE(6,600)PEN1I,TPEN1.SPRBI,IYR 600 FORMAT('O*** AGE CALLED: PENlI=',F10.4,' TPEN1=',F10.4,
+ 'SPRBI=' ,F10.4,' IYR"', 12) c**** ABORT IF ASKED TO AGE MORE THAN 10 YEARS ***
IYR2"IYR IF(IYR.LT.fO)GO TO 5 WRITE(6,610)
610 FORMAT('O*** WARNING *** PAVEMENT CAN ONLY BE AGED', + '-10 YEARS. 10 YEARS ASSUMED. ,)
IYR=10. c*** T IS MONTHS TO AGE AND RUNS 6, 18, 30 .... *** c*** STARTS AT 6 MONTHS TO BE AS CLOSE AS POSSIBLE ***
5 T=6.+12.*FLOAT(IYR) SPRB1=-16.2+1.230*(SPRBI*9./5.+32.) SPRBT=SPRB1-14.4+10.5*ALOG(T) SPRBI=5.*(SPRBT-32.)/9. PEN1I=( - .4+. 716*PEN1I )-(. 193*PEN1I-9. 1 )*ALOG(T) IF(PENtI.LT.20.)PEN1I=20. IYR=IYR2 WRITE(G.601)IYR,PEN1I,TPEN1,SPRBI
601 FORMAT(' *** AFTER AGING --> IYR=',I2,' PEN1='.F8.3, -' TPEN1=',F8.3,' SPRBI=',F8.3)
WRITE (1,100)IYR,PEN1I,SPRBI 100 FORMAT(I2,2F10.3,'<-- YR, PEN1, SPRBI')
RETURN END
FUNCTION POEL(PI,SPRB,TEMP.TIMOL) C THE FUNCTION SUBPROGRAM POEL PROVIDES THE LOGARITHM (BASE TEN) C OF THE STIFFNESS MODULUS OF A BITUMEN FROM GIVEN PENETRATION C INDEX, SOFTENING POINT RING AND BALL. TEMPERATURE AND TIME OF C LOADING. THE PROGRAM POEL IS A COMPUTERIZED VERSION OF VAN DER C POEL'S NOMOGRAPH EDITION AUGUST 1953, 2ND EDITION 1969. C REFERENCE: I 'JOURNAL OF APPLIED CHEMISTRY", VOLUME 4, PART5, C MAY 1954. KSLA DRAWING NUMBER 69.12.1164A. C THE PROGRAM POEL USES ONLY GEOMETIHC INFORMATION TAKEN FROM THE C NOMOGRAPH. A GRID OF X,Y COORDINATES, WITH ORIGIN IN THE POINT C TEMPERATURE EQUALS SOFTENING POINT RING AND BALL, IS LAID C OVER THE NOMOGRAPH. TEMPERATURE DIFFERENCES ARE FOUND ON THE CLINE (X,Y=O); LOADING TIMES ON THE LINE (X,Y=-11). THE UNIT OF C LENGTH IS CENTIMETRE. THE LINES OF CONSTANT PI ARE THE HORIZONTAL CLINES (X,Y=0.545*(PI+10». THE LINES OF CONSTANT STIFFNESS FORM C A BUNDLE OF CURVED LINES INTERSECTING THE PI LINES. EACH POINT C OF INTERSECTION ASSIGNS AN X VALUE TO EACH LOG. STIFFNESS VALUE C ON A GIVEN PI LINE. C THE ASSEMBLY OF INTERSECTION POINTS COVERS AN AREA ON THE C NOMOGRAPH, WHICH IS CALLED THE ADMITTED AREA. C LET XT BE THE X COORDINATE OF A POINT ON THE TEMPERATURE LINE C AND XL BE THE X COORDINATE OF A POINT ON THE LOADING TIME LINE,
B-(58 I'
C THEN A STRAIGHT LINE CAN BE DRAWN THROUGH THESE TWO POINTS. C THE EQUATION OF THIS LINE IS X = XT + (XT - XL)*(Y/11). C SUBSTITUTING INTO THIS EQUATION THE Y VALUE CORRESPONDING TO C THE PENETRATION INDEX. THE X COORDINATE OF THE INTERSECTION C POINT OF THIS LINE WITH THE PI LINE IS OBTAINED. BY INTERPOLATION C BETWEEN THE LOG. STIFFNESS VALUES CORRESPONDING WITH THE TWO NEXT C CONTINUE C NEIGHBOUR POINTS OF THE ASSEMBLY ON THE SAME PI LINE, THE PROGRAM C YIELDS THE REQUIRED LOG. STIFFNESS VALUE. C TO KEEP THE AMOUNT OF STORED DATA LIMITED, ONLY THE INTERSECTIONS C OF THE STIFFNESS LINES WITH INTEGER VALUE PI LINES ARE READ OUT. C C PI LINES ARE COUNTED FROM PI = -3 UP TO PI '" +7, WITH VARIABLE I C RUNNING FROM 1 UP TO 11. C EQUI-STIFFNESS LINES ARE COUNTED FROM RIGHT TO LEFT. WITH VARIABLE C J RUNNING FROM 1 UP TO 46. C KSTIF(I) IS NUMBER OF INTERSECTION POINTS OF EQUl-STIFFNESS LINES C WITH NUMBER I PI LINE. C XSTIF(I,J) IS X COORDINATE OF INTERSECTION POINT OF NUMBER I PI C LINE WITH NUMBER J EQUI-STIFFNESS LINE. C THE ARRAY XTEMP CONTAINS THE X-COORDINATES OF THE 10-DEGREE C CALIBRATION MARKS ON THE TEMPERATURE LINE. C SMIN(I) IS SMALLEST LOG. STIFFNESS VALUE INTERSECTING NUMBER I C PI LINE. C TO KEEP STATEMENT LENGTH LIMITED TO 20 CARDS. THE X-COORDINATES C OF THE INTERSECTION POINTS OF EQUI-STIFFNESS LINES WITH PI LINES C ARE STORED IN THE ARRAYS XDUM1 AND XDUM2. THE EQUIVALENCE C STATEMENT IDENTIFIES THESE ARRAYS WITH THE ARRAY XSTIF(I,J). THE C VARIABLE I RUNNING FIRST. THE DATA SHOULD BE READ IN GROUPS OF C 11 NUMBERS.
POEL=-20. IF(PI.GT.7.) POEL=-21. IF(PI.LT.-3.) POEL=-22. IF(TIMOL.GT.1.E+10f POEL=-23. IF(TIMOL.LT.1.E-06) POEL=-24. IF(POEL.LT.-20.5.AND.POEL.GT.-24.5) GO T020
C XL IS X COORDINATE OF LOADING TIME; C XT IS X COORDINATE OF SPRB MINUS TEMP.
XL=(ALOG10(TIMOL)+3.953)*1.G93 PI4=PI+4. IP=PI4 V1=0.545*FLOAT(IP+G) XT=XDRT(SPRB,TEMP)
C XT=66. MEANS TEMPERATURE TOO LOW. WITH RESPECT TO S.P. RING & BALL C XT=67. MEANS TEMPERATURE TOO HIGH.WITH RESPECT TO S.P. RING & BALL
IF(XT.EQ.G6.) POEL=-25. IF(XT.EQ.67.) POEL=-26. IF(XT.LT.68 .. AND.XT.GT.G5.) GO T020 X=XT-(Y1/11.)*(XL-XT) SLOG1=SLOG(IP,X)
C SLOG=50. MEANS GLASSY STATE C SLOG=56. MEANS WHITE AREA
IF(SLOG1.EQ.50.) POEL=-27. IF(SLOG1.EQ.56.) POEL=-28. IF(SLOG1.LT.57 .. AND.SLOG1.GT.49.) GO T020 AIP=IP IF(PI4.EQ.AIP) GO T010 IP"'IP+1 Y2=0.545*FLOAT(IP+6) X=XT-(Y2/11.)*(XL-XT)

SLOG2=SLOG(IP,X) IF(SLOG2.EQ.50.) POEL=-27. IF(SLOG2.EQ.56.) POEL=-28. IF(SLOG2.LT.57 .. AND.SLOG2.GT.49.) GO T020 V=0.545*(PI+10.) SLOG3=SLOG1+(SLOG2-SLOG1 )*( (V-V1 )/(V2-V1» SLOG1=SLOG3
10 POEL=SLOG1 20 CONTINUE
RETURN END
BLOCK DATA COMMON/BLOCKT/XTEMP COMMON/BLOCKS/KSTIF, XSTIF. SMIN INTEGER KSTIF(11) REAL XSTIF ( 11 .46) ,XTEMP( 34), SMIN( 11 ) ,XDUM 1(209), XDUM2(297)
C EQUIVALENCE (XDUM1 ,XSTIF( 1,1». (XDUM2,XSTIF( 1,20» EQUIVALENCE (XDUM1(1),XSTIF(1.1»,(XDUM2(1),XSTIF(1,20» DATA XTEMP/-2.47,-2.37,-2.26,-2.14,-2.04,-1.89,-1.74,
- -1 .6, -1 .42. -1 .2, - .95. - .69, -.38,0. , .44, .97. 1 .55,2.21, -2.88,3.61,4.42,5.23,6.09,6.98,7.98,8.81,9.72,10.62, -11.53,12.44,13.34,14.25,15.15,16.06/
DATA KSTIF/46,44,42,41,40,27,21,15,12,12,9/ DATA XDUM1/3.32,4.8,6.48,8.19, 10.1,12.,13.99,16.3,18.98,21.
-81 , 25. 12, 2 . 15,3.49,5. 1 ,6.71 ,8 .6, 10.42, 12.42, 14.68, 17 . 13, 19. -81 .22.87, 1 .21 ,2. ,3.38,4.94,6.65,8.4, 10.26, 12.21, 14.5, 17.21, -20.21, .91, 1.49,2.52,3.75,5.3,6.9,8.61,10.62,12.98, 15.54,18. -52, .61, 1 . , 1 .71 ,2.75,3.98,5.33,6.8,8.7, 10.91 , 13.43, 16.38, -.41,.7,1.29,2.01,2.99,4.13,5.48,7.24,9.49,11.9,14.72, -.18, .42, .8,1.4,2.26,3.23,4.44,5.99,7.81,10.13,13.08, - - . 1 , . 03, . 29, . 72, 1 . 35 , 2 . 17 , 3. 18 , 4 . 48 , 6 . 1 1 , 8 . 27 , 10. 86 , - - . 29, - . 21 • - .01 , .31 , .81 , 1 .49,2 .3, 3 .4,4 .81 ,6.7,9. 17, - - .48, .42, - .3, - .08 • . 3, .8, 1 .41 ,2.31 ,3.51 .5.2,0., . - - . 7 , - . 7 , - . 65 , - . 53 , - . 31 ,0 . , . 45 , 1 . 11 , 2 . 09 , 3 . 4 1 , O. , --.86,-.9,-.92,-.89,-.77,-.58,-.26,.27,1.03,2.16,0., - -1 .04, - 1 . 13, -1 .2, -1 .2, -1 . 18, -1 .08, - . 88, - .53,3*0. , --1 .3, -1 .42, -1 .54, -1 .65, - 1 .71 ,-1 .72, -1 .65, -1 .5,3*0. , --1.46,-1.63,-1.82,-1.98,-2.09,-2.18,-2.2,-2.12,3*0., --1.66,-1.88,-2.07,-2.24,-2.43,-2.58,-2.69,4*0., --1.9,-2.15,-2.4,-2.62,-2.88,-3.1,-3.3,4*0., - - 2 . 03 , - 2 . 3 1 , - 2 . 61 , - 2 . 9 1 , - 3 . 2 1 , - 3 . 5 , -:9 . 78 , 4 *0. , --2.2,-2.52,-2.88,-3.19,-3.57,-3.91,-4.24,4*0./
DATA XDUM2/-2.45,-2.79,-3.16,-3.52,-3.95,-4.37,-4.78,4*0., --2.63,-3.03,-3.45,-3.85,-4.3,-4.71,-5.18,4*0., --2.83,-3.26,-3.69,-4.12,-4.6,-5.04,5*0., --3.06,-3.5,-3.98,-4.46,-5.01,-5.51,5*0., --3.24,-3.~1,-4.21,-4.72,-5.3,-5.89,5*0., --3.42,-3.95,-4.48,-5.02,-5.62,-6.2,5*0. , --3.64,-4.2,-4.79,-5.38,-6.04,-6.7,5*0. , --3.81, -4.4, -5.02, -5.61, -6 .. 3, -7 .03,5*0. , --4.02,-4.6,-5.27,-5.9,-6.61,6*0. ,-4.24,-4.89,-5.52,-6.20, --6.9,6*0.,-4.41,-5.08,-5.77,-6.46,-7.21,6*0., --4.65,-5.31,-6.,-6.7,-7.48,6*0. ,-4.85,-5.55,-6.31,-7.04, --7.79,6*0.,-5.03,-5.75,-6.53,-7.3,-8.15,6*0., --5.27,-6.,-6.81,-7.6,-8.43,6*0. ,-5.49,-6.25,-7.09,-7.88, --8.72,6*0.,-5.65,-6.46,-7.28,-8.13,-9.06,6*0.,

C C
--5.88,-6.67,-7.53,-8.4,-9.34,6*0.,-6.09,-6.92,-7.83, --8.71,-9.68,6*0.,-6.24,-7.18,-8.1,-9.,-10.,6*0., --6.88,-7.81,-8.8,-9.81,-10.91,6*0. ,-7.49,-8.47,-9.57, --10.7,7*0.,-8.05,-9.14,-10.3,8*0.,-8.61,-9.77,9*0. , --9.24,-10.38,9*0.,-9.8,10*0.,-10.41,10*0./
DATA SMIN/-10., -8., -6., -5., -4.,1. ,3. ,5. ,6. ,6.,7./ END
FUNCTION SLOG(IP,X) C RESULT IS LOG STIFFNESS (SLOG) FROM PI AND X. THE INTEGER VALUE C IP OF PI + 4. IS USED INSTEAD OF PI.
INTEGER KSTIF(11) REAL XSTIF(11,46),SMIN(11) COMMON/BLOCKS/KSTIF,XSTIF, SMIN IF(X-XSTIF(IP,1» 30,20,10
10 SLOG=50. GO T0140
20 SLOG=9.+ALOG10(2.5) GO T0140
30 IF(X-XSTIF(IP,KSTIF(IP») 40,50,60 40 SLOG=56.
GO T0140 50 SLOG=SMIN(IP)
GO T0140 60 KSTAF=KSTIF(IP)
0070 15=1.KSTAF M=I5 IF(X.GT.XSTIF(IP,I5» GO T080
70 CONTINUE 80 M1=M/3
M2=M-3*M1 AM1=M1 FRACT=(X-XSTIF(IP,M»/(X5TIF(IP,M-1)-XSTIF(IP,M» IF(M.EQ.2) GO T0130 IF(M.GT.39) GO T0120 IF(M2.EQ.0) GO T090 IF(M2.EQ.1) GO T0100 IF(M2.EQ.2) GO T0110
90 SLOG=10.-AM1+ALOG10(2. )*FRACT GO T0140
100 SLOG=9.-AM1+ALOG10(5.)+(1.-ALOG10(5.»*FRACT GO T0140
110 SLOG=9.-AM1+ALOG10(2.)+(ALOG10(5.)-ALOG10(2.»*FRACT GO T0140
120 M3=M-39 AM3=M3 SLOG=-3.-AM3+FRACT GO T0140
130 SLOG=9.+ALOG10(2.)+(ALOG10(2.5)-ALOG10(2.»*FRACT 140 CONTINUE
RETURN END

C C
FUNCTION XDRT(SPRB,TEMP) C RESULT IS HORIZONTAL COORDINATE XT CORRESPONDING TO TEMPERATURE C DIFFERENCE SPRB - TEMP.
REAL XTEMP(34) COMMON/BLDCKT/XTEMP DRT=SPRB-TEMP
C ADMITTED RANGE FOR DRT IS (-130,+200) Z=DRT+130.
C
IF(Z-330~) 30,20,10 10 X=66.
GO T070 20 X=XTEMP(34)
GO T070 30 IF(Z) 40,50,60 40 X=67.
GO T070 50 X=XTEMP(1)
GO T070 60 N=INT(Z)/10
R=AMOD(Z, 10.) X=XTEMP(N+1)+(XTEMP(N+2)-XTEMP(N+1»*R/10.
70 XDRT=X RETURN END
SUBROUTINE TYPES(MODE, IWRITE, PI, SPRB, TEMP, TIMOL, PEN1, TPEN1, PEN2, - TPEN2,ALGS,CONST)
c**··· SUBROUTINE T6 PRODUCE OUTPUT DETAIL LINES •• * •• INTEGER NOTE(6,S),LIST(6)
C
DATA NOTE/' .. " 'PI >', ' +7 " ' 1 I * 'PI <', I -3 " ' 2 • * 'LOAD', 'ING " 'TIME', ' > 1', 3 '.. 'LOAD', 'lNG', 'TIME', '< 1', 4 ' • 'TEMP', 'ERAT', 'UR£ " 'TOO' 5 ' • 'TEMP', 'ERAT', 'URE " 'TOO' 6 ' * 'GLAS', 'SY 5', 'TATE', ' 7 ' • "WHIT','E AR', 'EA
NTO 6 9000 FORMAT(1HO) 9010 FORMAT(1H )
IF(IWRITE.GT.O) GO T010 ALG800=ALOG10(SOO.)
10 CONTINUE IF(MOD(IWRITE,35).EQ.0) GO T020 GO T060
20 CONTINUE WRITE(NTO,9000) WRITE TREE HEADLINES OF TABLE GO TO ( ~O, 40, 50 ), MODE
30 WRITE(NTO,9020) 9020 FORMAT(' PI
-x ' ) WRITE(NTO, 9030)
9030 FORMAT('
SOFTENING
POINT R&B
B-6f2 i
TEMP. LOADING
TIME '
, , E+10' , 'E-06' • 'LOW' , 'HIGH' ,
, ,/
PEN.25 SMI
I

WRlTE(NTO,S040) S040 FORMAT ( , (DEG. C) (DEG. C) ( S ) (LB/IN**
-2) , ) GO TO 60
C 40 WRlTE(NTO,S050)
S050 FORMAT(' PI SOFTENING TEMP. LOADING PEN. PEN. LOG. STIFFNESS COMPUTED ' )
WRlTE(NTO,S060) S060 FORMAT ( , POINT R&B TIME TEMP.
-STIFFNESS VI SCOS ITY , ) WRITE (NTO, S070)
S070 FORMAT ( , (DEG. C) (DEG. C) ( S ) (DEG. C) -(N/M**2) (N/M**2) (NS/M**2)' )
GO TO 60 C
50 WRITE(NTO,SOBOY SOBO FORMAT(' PI
-FERENCE TEMP. OF WRITE (NTO, SOSO)
soso FORMAT(' -PEN. REF.PEN.
WRITE (NTO, S100) S100 FORMAT('
(DEG. 60 CONTINUE
ETA=S*TIMOL/3.
C)
EPT BOO TEMP. PEN.RATIO LOG.
(T+15)/T STIFFNESS
(DEG. C) (DEG.C) (N/M**2)
ALGPR=(20. -PI )/( (50./15. )*( 10.+PI» PENRAT=10.**ALGPR IF(MOD(IWRITE, 5).EQ.0) WRITE(NTO,S010) IF(ALGS.GT.-20.) GO T070 GO T0110
70 CONTINUE SMIX = 10.0 ** ALGS * CONST
LOADING PEN. PEN. STIFFNESS COMPUTED. ,)
TIME TEMP. VISCOSITY' )
( S ) (DEG. C) (N/M**2) (NS/M**2)')
C WRITE NUMERIC OUTPUT WITHOUT NOTE. GO TO ( BO, SO, 100 ), MODE
C CALCULATE IN CASE MODE = 1 PEN.25 FROM PI AND S.P. RING & BALL.
C
BO ALGP25=ALGBOO+«20.-PI)/(500.+50.*PI»*(25.-SPRB) PEN25=10.**ALGP25 WRITE(NTO,S110)PI,SPRB,TEMP,TIMOL,PEN25,SMIX
S110 FORMAT(2X,F5.2,4X,F6.1,5X,F6.1,3X,1PEB.1,2X,OPF6.1,5X,1PES.2,1X, - 1PES.2,2X,1PES.2)
GO T0160 SO WRITE(NTO,S120)PI,SPRB,TEMP,TIMOL,PEN1,TPEN1,AlGS,S,ETA
S120 FORMAT(2X,F5.2,4X,F6.1,5X,F6.1,3X,1PEB.1,1X,OPF6.1,2X,F5.1,5X, - 1PES.2,1X,1PES.2,2X,1PES.2)
GO T0160 100 WRITE(NTO,S130)PI,SPRB,TEMP,TIMOL,PEN1,TPEN1,PEN2,TPEN2,PENRAT,
ALGS,S,ETA S130 ~ORMAT(2X,F5.2,4X,F6.1,5X,F6.1,3X, 1PEB.1,1X,OPF6.1,2X,F5.1,4X,
- F6.1,5X,F5.1,5X,F6.2,4X,1PES.2,1X,1PES.2,2X,1PES.2) GO T0160
110 CONTINUE
RE
C WRITE NUMERIC OUTPUT WITH NOTE, DEPENDING ON (DUMMY) VALUE OF ALGS L=IABS(INT(ALGS-0.001»-20
C L HAS VALUE 1 UP TO B IF ALGS HAS VALUE -21. DOWN TO -2B. DO 120 1=1,6 LIST(I)=NOTE(I,L)
120 CONTINUE

GO TO ( 130, 140, 150 ), MODE 130 ALGP2S=ALG800+«20.-PI)/(SOO.+SO.*PI»*(2S.-SPRB)
PEN2S=10.**ALGP2S WRITE(NTO,9140)PI.SPRB.TEMP,TIMOL,PEN25,(LIST(I),I=1,6)
9140 FORMAT(2X,FS.2,4X,F6.1,SX,F6.1,3X,1PE8.1,2X,OPF6.1,2X,6A4) GO T0160
140 WRITE(NTO,91S0)PI,SPRB,TEMP,TIMOL,PEN1,TPEN1,(LIST(I),1:1,6) 91S0 FORMAT(2X,FS.2,4X,F6.1,5X,F6.1,3X,1PE8.1,1X,OPF6.1,2X,FS.1,2X,6A4)
GO T0160 1S0 WRITE(NTO,9160)PI,SPRB,TEMP,TIMOL,PEN1,TPEN1,PEN2,TPEN2,PENRAT,
- (LIST(I),I=1,6) 9160 FORMAT(2X,FS.2,4X,F6.1,5X.F6.1,3X,1PE8. 1,1X,OPF6.1,2X,FS.1,4X,
- F6.1,SX,FS.1,SX,F6.2,1X,6A4) 160 CONTINUE
IWRITE=IWRITE+1 RETURN END
SUBROUTINE LINEAR ( N, X, Y. A. B C***** DO A SIMPLE LINEAR REGRESSION ON
DIMENSION X(N), yeN) SUMN N SUMX 0.0 SUMY 0.0 SMX2 0.0 SMXY = 0.0 DO 1100 I 1, N SUMX SUM X + XCI) SUMY SUMY + Y(I) SMX2 SMX2 + XCI) * XCI) SMXY SMXY + XCI) * Y(I)
) X 8. Y ******
1100 CONTINUE DETR SUMN * SMX2 - SUMX * SUMX ) A B RETURN END
SUMN * SMXY - SUMX * SUMY ) / DETR SUMY * SMX2 - SUMX * SMXY ) / DETR
SUBROUTINE FINDTA ( NN, E1, E2, T ) c***** FIT LINE TO LOG LOG PLOT OF TEMP SHIFT VS TEMP DIFF ***** c***** TEMPERATURE IS VARIED TO PRODUCE BEST FIT *****
DIMENSION E1(20). E2(20), T(20) DIMENSION X(20), Y(20), AT(20), TL(20)
500 FORMAT ( 3F10.0 ) S10 FORMAT ( E14.7 ) 600 FORMAT ( f SMIX', E14.7,' TA', F10.3,' BETA
1 E14.7,' INTERCEPT, B . E14.7.' SOE2', E14 .. 7 c********** INITIALIZE SELECTION VARIABLES **********
ERRMIN=999. TASEL=999. ASEL=999. TM=2S. TA=-75. TINC=5.
B-64

TAS 1000 CONTI NUE
SMIX IF ( SMIX TA
= TA
= 10.000 ** E1(2) .LE. O.OE+OO ) GO
TAS
/ 2.0 TO 1700
DO 1200 I = TL( I)
1. NN ( SMIX /10.0E+00 ** E1(I) ) ** ( 1.0E+00 / E2(I) )
1200 CONTINUE TLMC DO 1300 I =0
AT( n 1300 CONTINUE 1400 CONTINUE
TA DO 1500 I X( n-YO)
1500 CONTI NU E
TL(2) 1. NN TL(I) / TLMC
TA + TINC 1, NN ALOG10 ( T(I) - TA AlOG10 ( AT(I)
CALL LINEAR ( NN, X, Y, A, B SOE2 O.OE+OO DO 1600 Z DIFF SOE2
1600 CONTINUE
I = 1, NN A * X(I) + B Z - YO) SOE2 + DIFF * DIFF
C********** SELECT TA AND B AT M1NIMUM SOE2 IF(ERRMIN.LT.SOE2)GOT02 ERR1IIIIN=SOE2 TASEL=TA ASEL=A WRITE (6,600) SMIX, TA, A, B. SOE2
2 IF ( TA .LE. -20.00E+00 ) GO TO 1400 1700 CONTINUE
C***** WRITE SELECTED TA AND BETA TO DISK FILE WRITE (1.100)TASEL,ASEL
100 FORMAT(2F10.5,' <---- TA. CM') RETURN END
**********
*******

C C C C C C C C C C C C C C C C C C C C C C C C C C C C C C C C C C C C C C C C C C C C C C C C C C C C C C C C C C C C
*************************************************.***********
COMPUTER PROGRAM FOR THERMAL CRACKING MODEL (THERM1) (USING THE RESULTS FROM VISCOn .
*************************************************************
NO AGING WHEN CRACK LENGTH, YC, IS GREATER THAN 1.0 IN.
*************************************************************
AUTHORS DR. ROBERT L. LYTTON MS. ULPALA L. SHANMUGHAM
TEXAS TRANSPORTATION INSTITUTE TEXAS A&M UNIVERSITY COLLEGE STATION, TEXAS 77843
*************************************************************
RESULTS PRINTED EVERY MONTH
*************************************************************
DESCRIPTION OF INPUT VARIABLES
*************************************************************
TITL W S
AK
B DO
DF VMPH NSEL SR1 SRM IMODE IAGE
.CV SPRB
TPEN2
PI PEN1 PEN2 IYR
CN
TITLE OF THE PROBLEM. DENSITY OF THE ASPHALT CONCRETE, PCF . SPECIFIC HEAT OF THE ASPHALT CONCRETE,BTU/LB, DEGREE FAHRENHEIT. THERMAL CONDUCTIVITY OF THE ASPHALT CONCRETE, BTU/SQUARE FOOT/HR, DEGREE FAHRENHEIT PER FOOT. THE ABSORBTIVITY OF THE ASPHALT CONCRETE. INITIAL CRACK LENGTH, INCHES (CRACK IS PROPAGATING DOWNWARDS) . DEPTH OF THE ASPHALT CONRETE, INCHES. AVERAGE WIND VELOCITY, MPH. STARTING DATE: YR/MO/DY THE AVERAGE SOLAR RADIATION FOR ,JULY. LANGLEYS PER DAY.
• THE YEARLY AVERAGE SOLAR RADIATION,LANGLEYS PER DAY. MODES. 1, 2.& 3
= (NUMBER OF YEARS TO BE RUN) OR (THE NUMBER OF YEARS THE BITUMEN TO BE AGED), USUALLY BOTH ARE SAME. AGGREGATE VOLUME / ( AGGREGATE VOL + ASPHALT VOL) ORIGINAL SOFTENING POINT RING AND BALL TEMPERATURE. DEGREES C. ( IMODE = 1 OR 2 ) TEMPERATURE OF REFERENCE PENETRATION. DEGREES C. ( IMODE= 3 ) ORIGINAL PENETRATION INDEX. ( IMODE '" 1 )
'" PENETRATION AT 26 DEGREES C. ( IMODE • 2 OR 3 REFERENCE PENETRATION AT TPEN2. ( IMODE = 3 ) NUMBER OF YEARS THE BITUMEN HAS AGED. ( IYR = -1 ( NO AGING ), IYR = 0 ( AGED 6 MONTHS, FOR FIRST YEAR ), IYR = 1 ( AGED 18 MONTHS. FOR SECOND YEAR ), ETC) THE SLOPE OF THE MASTER RELAXATION MODULUS CURVE.

C C C C C C C C C C C C C C C C C C C C C C C C C C C C C C C C C C C C C C C C C C C C C C C C C C C C C C C C C
D1
TA CM SPRBI
DUM1 DUM2 DUM3 DUM4 DUM5 DUM6 NDATE
NYEAR LL
THE POWER OF THE INTERCEPT VALUE FOR LOG T=O OF THE MASTER RELAXATION MODULUS CURVE.
=: THE POWER LAW CONSTANT FOR THE SHIFT FACTOR. '" THE SLOPE OF THE POWER LAW CURVE FOR THE SHIFT FACTOR. = SOFTENING POINT RING & BALL TEMPERATURE FOR THE
CURRENT YEAR, DEGREES C. PEN1 SPRB
'" CN D1
'" TA '" CM
DATE, YR/MO/DY. IN THE WEATHER DATA TAPE. ( SCAN DOWN TAPE TO SELECTED DATE ) YEAR.( 2 DIGITS) MONTH. ( 2 OIGITS )
DAY( I) TMAX( I) TMIN( I)
DAY. ( 2 DIGITS ) MAXIMUM TEMPERATURE DURING DAY(I). DEGREE FAHRENHEIT.
'" MINIMUM TEMPERATURE DURING DAY(I),DEGREE FAHRENHEIT.
**************************************************************
INPUT DATA INFORMATION:
DATA FROM TAPE05
CARD NO.
01
02 02 02 02
03 03 03
04
05 05
COLUMNS/FORMAT
01-60
01-10 11-20 21-30 31-40
01-10 11-20 21-30
01-10
01-10 11-20
(15A4)
F10.0 F10.0 F10.0 F10.0
FlO.0 F10.0 F10.0
110
F10.0 F10.0
'VARIABLE NAME
TITL
w S AK B
DO OF VMPH
NSEL
SRi SRM
DAT.t\ FROM TAPE02 (RESULTS FROM VISC01 PROGRAM)
CARD NO.
01 01
COLUMNS/FORMAT
01-02 03-04
12 12
VARIABLE NAME
IMODE IAGE
C*****ORIGINAL PROPERTIES C
OF BITUMEN
C 01 05-14 F10.3 CV

e 01 15-24 F10.3 SPRB (IMODE=1,2) OR TPEN2 (IMODE=3) C 01 25-34 F10.3 PI (IMODE '" 1) OR PEN1 (If,mDE =. 2, e 01 35-44 F 10. 3 PEN2 ( FOR IMODE=3 ONLY j e C*****VARIABLES OF BITUMEN WITHOUT AGING e C 02 01-02 12 IYR C 02 03-12 F10.3 DUMl(PEN1) e 02 13-22 F10.3 DUM2(SPRB) e e 03 01~10 F10.5 DUM3(eN) C 03 11-20 F10.5 DUM4(D1) C e 04 01-10 F10.5 DUM5(TA) C 04 11-20 F 10. 5 DUM6(CM) e C*****VARIAeLES OF BITUMEN FOR THE CURRENT YEAR C e e e C C e e e C C e e e C
05 01-02 12 IYR 05 03-12 F10.3 PEN1 05 13-22 F10.3 SPRBI
06 01-10 F 10. 5 eN 06 11-20 F10.5 01
01 01-10 F10.5 TA 01 11-20 F10.5 CM
NOTE: CARDS 05-01 MUST BE REPEATED FOR EACH YEAR I, I = 1 , ... , IAGE
DATA FROM TAPE01 (WEATHER TAPE)
CARD NO.
01
02 02 02 02 02
03 03 03 03
COLUMNS/FORMAT
12-11 IS
12-13 I2 14-15 12 16-11 12 20-22 F3.0 23-25 F3.0
12-13 12 16-17 I2 20-22 F3.0 23-25 F3.0
VARIABLE NAME
NDATE
NYEAR LL DAY(1) TMAX ( 1) TMIN(1)
NYEAR OAY(I) TMAX(I) TMIN(I)
NOTE: CARD 03 MUST BE REPEATED FOR EACH DAY OF THE ANALYSIS PERIOD. FORMAT OF THE CARDS 1, 2, 8< 3 MUST BE CHANGED ACCORDING TO THE FORMAT OF WEATHER DATA TAPE. .
3)
e e e C C C e e C C e C C C C C C C C C C C C C C C
**************************************************************
IMPLICIT REAL*8 (A-H, o-z) LOGICAL FLAG, FLG1
l

DIMENSION XX(3),TE(3.24),TI(3.24) DIMENSION TMAX(31),TMIN(31),AL(372),N(12) DIMENSION DAY(31) DIMENSION YC(2S00), DYC(2500). K1 (2S00) DIMENSION NF(2S00), DN(2S00). TITL(1S), NF1(2S00) COMMON IA11 CN, CM, TM. TR. TA. E1, EE COMMON IA21 SA1, SA2, SB1, SB2 COMMON IASI M1. M2, MS. M4 COMMON IA41 TC(12), TH(12) INTEGER DAY INTEGER MOS( 12)/'JAN', 'FEB'. 'MAR' ,'APR' ,'MAY', 'JUN',
1 'JUL', 'AUG'. 'SEP'. 'OCT'. 'NOV'. 'DEC'I REAL*B M1. M2. M3, M4. K1, NF, KTMX. KTMN. NF1
500 FORMAT ( 1SA4 ) 520 FORMAT ( BF10.0 ) S30 FORMAT ( BI10 )
C********** INPUT DATA FOR NEW PROBLEM ********** 8 READ(5.S00.END=999)TITL
READ (S,S20) W, S, AK,B READ (5.S20) DO, OF, VMPH READ (S.S30)NSEL READ (S,S20) SRi, SRM
C**************************************** C TM IS THE REFERENCE TEMPERATURE OF THE MASTER C RELAXATION CURVE. DEGREE FAHRENHEIT. C TR IS THE TEMPERATURE OF TH~ STRESS FREE STATE, C DEGREE FAHRENHEIT. C****************************************
TM"'77. TR=75. DZ= 1.0
C C*****READ ORIGINAL PROPERTIES OF BITUMEN FROM VISC01 FOR C*****DIFFERENT CASES OF MODES 1, 2. AND 3 C
READ (2,208) IMODE. IAGE. CV. SPRB, PI, PEN2 SPRB=(SPRB*9./S. )+32. TPEN2 " SPRB
208 FORMAT ( 212, 4F10.3 ) WRITE (6,600 )TITL
600 FORMAT('1', 10(/), 10X, 'THERMAL CRACKING ANALYSIS FOR '.1SA4) WRITE(6,601)NSEL,IAGE
601 FORMAT(/ .10X. 'THIS ANALYSIS BEGINS AFTER', 16.' AND RUNS FOR'. 12. , YEARS.') +
WR IT E ( 6 • 602 ) 602 FORMAT(I.10X, 'THE BITUMEN USED HAS THE FOLLOWING ORIGINAL'
1 'PROPERTIES:' ) IF (IMODE. EQ. 1 )WRITE (6,603 )PI
603 FORMAT( 1SX, 'PENETRATION INDEX IF(IMODE.EQ.2)WRITE(6,60S)PI
60S FORMAT( 15X, 'PENETRATION AT 77 DEG F IF ( IMODE .EQ. 3 ) WRITE (6,6051) PI,
60S 1 FORMAT (1SX, 'PENETRATION AT 77.0 DEG 1 1SX, 'PENETRATION AT', F6.1. '
IF ( IMODE .LT. 3 ) WRITE(6.606)SPRB
'" ',F10.3)
= ',F10.S) TPEN2, PEN2 F = " F 10. 3, I. DEG F " " Fi0.3
606 FORMAT(15X,'SOFTENING POINT RING & BALL TEMP'" ',Fi0.3.' DEG F') IF ( IMODE .EQ. 3 ) WRITE (6,606S) TPEN2
6065 FORMAT ( 1SX, 'TEMPERATURE OF REFERENCE PENETRATION'" F10.3, 1 ' DEG F' ) WRITE(6,607)DF,DO
607 FORMAT(i0X.'THE ASPHALT CONCRETE LAYER IS ',Fi0.3,' INCHES THICK' + /, 10X, 'AND IS ASSUMED TO HAVE AN INITIAL CRACK OF ',F10.3, + /10X. 'INCHES EXTENDING FROM THE SURFACE.')
WR IT E ( 6 • 608 ) 608 FORMAT(10X.'THE ASPHALT CONCRETE HAS THE FOLLOWING MIX'
1 'PROPERTI ES;' ) WRITE(6.609)CV.W.S,AK,B
609 FORMAT(1SX, 'AGGREGATE VOLUME CONCENTRATION: ',F10.3, +/. 1SX, 'DENSITY == ',F1O.3.' LBS/FT**3' +/, 1SX. 'SPECIFIC HEAT = ',F10.3,' BTU/LB DEG F' +/. 1SX. 'THERMAL CONDUCTIVITY = '.F10.3,' BTU/FT**2/HR.DEG F/FT' +/. 15X. 'ABSORPTIVITY = '.F10.3)
WRITE(6.610)VMPH.SRM.SR1 610 FORMAT(/, 10X, 'THE PAVEMENT IS ASSUMED TO BE SUBJECTED TO THE'
+/. 10X, 'FOLLOWING AVERAGE ENVIRONMENTAL CONDITIONS:' +/. 1SX,'WIND VELOCITY = '.F10.3,' MILES PER HOUR' +/. 1SX,'AVERAGE ANNUAL SOLAR RADIATION == '.F1O.3,' LANGLEYS/DAY' +/, 1SX.'AVERAGE JULY SOLAR RADIATION = ',F10.3,' LANGLEYS/OAY')
C********** INITIALIZE CONSTANTS ********** ACON=1.0DO 10 YC( 1) YC1 CDMG CDMG1 IKOUNT
== 0 .. DO
DO : 0.000 .. 0.000
1 C********** DAYS
N(1)=31 N(2)=28
IN THE
N(3)=31 N(4)=30 N(S)=31 N(6)=30 N(7)=31 N(8)=31 N(9)=30 N( 10)=31 N(11)=30 N(12)=31 XYZT 1M: 14.0 XYZTEM=80.000 OZ=10.DO**OZ EE=OZ
18 CONTINUE DO 109 1JK: 1,360 F=1JK/S7.29S8
MONTH
AL(IJK) = SRM + (SR1-SRM) 109 CONTINUE
DO 108 IJK=361.366 AL(IJK)=AL(360)
108 CONTINUE 138 CONTI NU E
**********
* DCOS( F )/0.966
C****** THE UPPER LIMIT ON THE RELAXATION MODULUS CURVE IS SPECIFIED SBTMAX = 3.62S0+0S ESSM = SBTMAX * (1.000 + 2.S2DO * (CV/(1.0-CV») ** 0.992300
C********** SCAN DOWN TAPE TO SELECTED DATE ~*********** 9 READ(1,101)NDATE
101 FORMAT(11X.I6) IF(NDATE.LT.NSEL)GOT09
C********** TAPE NOW IS AT STARTING POINT **************
B-70

READ (2,201) IYR, DUM1, OUM2 OUM2 - {DUM2 • 9.0 I 5.0) + 32.0 READ (2,200) DUM3, DUM4 READ (2,200) DUM5, DUM6 FLAG = "FALSE" FLG1 .FALSE.
C···*······ 00 ONE YEAR AT A TIME ••••• *.**. DO 3 I3-1,IAGE
C···*** ••• * READ VARIABLES FROM VISC01 * •• *** ••• READ(2,201)IYR,PEN1,SPRBI SPRBI=(SPRBI·S./5.)+32
201 FORMAT(I2,2F10.3) READ(2,200)CN,D1 READ(2,200)TA,CM
200 FORMAT(2F10.5) C C*···*USE ORIGINAL PROPERTIES OF BITUMEN WHEN CRACK LENGTH, C·****YC, IS GREATER THAN 1.0 IN. C
IF (YC1 . LE. 1.000) GO TO 1701 PEN1 = DUM1 SPRBI OUM2 CN DUM3 01 DUM4 TA DUM5 CM DUM6
170 1 CONTINUE CN--CN CM=-CM 01=10.000·*D1
16 E1=D1 I3M1=I3-1
C···*·* FATIGUE PARAMETERS, CA & FN, ARE CALCULATED ••• ** C SCFT IS THE SCALING FACTOR TO CALCULATE FN C AFAT AND BFAT ARE EMPIRICAL CONSTANTS THAT C RELATE CA ANO FN. C****·****·*********··*************.*.**********
SCFT=2.5 FN=( 1.+1 ./CN)*(2 ./sCFT) AFAT=0.69 BFAT=-0.511 CA=10.*·«AFAT+FN)/BFAT) IF ( FLG1 ) GO TO 1702 CAO '" CA FNO = FN FLG1 = .TRUE.
1702 CONTI NUE WRITE (6,667)
667 FORMAT ( II ) IF ( MOO(IYR,2) .EQ. 0 ) WRITE (6.666)
666 FORMAT ( 1H1, IIII ) WRITE(6,604)IYR,PEN1,SPRBI,CA,FN, CAO, FNO
604 FORMAT( 10X, ' .** YEAR ',12,' .**'1, 1 10X. ' IN PLACE BITUMIN PROPERTIES:'. + I, 15X, 'PENETRATION AT 77 OEG F .. ',F10.3 + I, 15X,'SOFTENING POINT RING & BALL TEMP'" ',F10.3,' OEG F', + II. 10X, ' FATIGUE PARAMETERS OF THE MIX:'. + 2(/. 15X, 'A .. '. E10.3. " N .. '. Fa.3). + 4X, '(VALUES USED WHEN YC IS GREATER THAN 1.0 INCH)', II )
WRITE (6,3457)
B ~11

CALL CURVE(TH,TC) TC( 12) = TC( 11) TH( 12) = TH( 11)
C********** DO ONE MONTH AT A TIME ********** 00 1 LI.l = 1, 12
997 READ (1,1233) NYEAR. LL, DAY(1). TMAX(1), TMIN(1) 1233 FORMAT (11X.3I2,2X,2F3.0)
IF(TMAX(1).EQ.999)GOT0997 M = MOD(NYEAR,4) N(2) 28 IF ( M .EQ. 0 ) N(2) = 29 I.lYR = N(LL) DO 3333 I = 2,I.lYR READ (1,1234) NYEAR. DAY(I). TMAX(I), TMIN(I)
1234 FORMAT(11X,I2.2X,I2,2X.2F3.O) 3333 CONTINUE
C********** ADD A DAY IF LEAP YEAR ********** MAXDAY = 365 + N(2) - 28
c********** TEMPORARY DEBUG OUTPUT ********** C********** DO ONCE FOR EACH DAY IN MONTH **********
DO 2 NI=1.JYR TRANG = 0.000 IF ( TM I N (N I) . GE. TR ) GO TO 2 TAVG=0.5*(DMIN1(TR,TMAX(NI»+DMIN1(TR,TMIN{NI») TRANG • DMIN1( TR,TMAX(NI) ) - DMIN1(TR.TMIN(NI» AH=1.3+0.62*(VMPH/24.)**O.75 H=AH/AK AC=AK/(S*W) C=(0.131/AC)**0.5 R=O. 67*B*3. 69*AL(IKOUNT) / (24. *AH)
C**************************************************** C SET UP TO CALCULATE TEMPERATURE OF TOP, MIDDLE, AND C BOTTOM OF PAVEMENT. C XX(1)= BOTTOM TEMPERATURE C XX(2)= MIDDLE TEMPERATURE C XX(3)= TOP TEMPERATURE C TEMPERATURE CALCULATED EACH HOUR FOR A COMPLETE DAY C****************************************************
DO 10 ITHCK= 1,3 XX(ITHCK)=DF/ITHCK IF(ITHCK.EQ.3)XX(3)=0.ODO Z2=(-XX(ITHCK»*C/12.0 Z3 = DEXP(Z2) * H/« H+C)**2. + C**2.) ** 0.5 DO 10 1.1=2,25 TIM=J IF(J.GT.9) GO TO 31 Z4=6.8176*(.0576*TIM+0.144*Z2-0.288) GO TO 35
31 IF(I.l.GT.14) GO TO 32 Z4=+14.7534*(0.02057*TIM+O.075*Z2-0.288) GO TO 35
32 Z4=-6.94274*(O.02057*TIM+0.12*Z2-0.288) 35 Z5 = DSIN(Z4)
IF(Z5) 21.22,22 21 TMEAN=TAVG+0.5*R
TV=.5*TRANG GO TO 23
22 TV=.5*TRANG+3.*R TMEAN=TAVG+R
23 TEMP-TMEAN+TV*Z3*Z5
B-'+'2 , .
!

IF(~.GT.19) TIM=TIM-24 ITM = TIM + 5 TE(ITHCK,ITM)=TEMP TI(ITHCK,ITM)=ITM
10 CONTINUE C********** 1 DAYS CALCULATIONS COMPI,.ETE **********
20 IKOUNT=IKOUNT+1 IF(IKOUNT.EQ.MAXDAY) IKOUNT=1 DO 110 L1=1,3 DO 110 L=2, 23 IF(TE(L1.L).LE.TE(L1,L-1).AND.TE(L1,L).LE.TE(L1,L+1» GO TO 112 GO TO 118
112 CONTINUE C********** MINIMUM TEMPERATURES HAVE BEEN CALCULATED **********
IF(L1.EQ.1)TEMP1=TE(1.L) IF(L1.EQ.2)TEMP2=TE(2.L) IF(L1.EQ.3)TEMP3~TE(3~L)
C********** TIME FOR MINIMUM TEMPERATURES ********** IF(L1.EQ.1)TIM1~TI(1,L) IF(L1.EQ.2)TIM2=TI(2.L) IF(L1.EQ.3)TIM3=TI(3.L)
118 CONTINUE C********** NOW CALCULATE MAX TEMPERATURES **********
IF(TE(L1.L).GT.TE(L1.L-1).AND.TE(L1,L).GT.TE(L1.L+1» GO TO 113 GO TO 110
113 CONTINUE IF(L1.EQ.1)TEMP4=TE(L1,L) IF(L1.EQ.2)TEMP5=TE(L1.L) IF(L1.EQ.3)TEMP6=TE(L1,L) IF(L1.EQ.1)TEMP7=TE(L1.L+1) IF(L1.EQ.2)TEMP8=TE(L1.L+1) IF(L1.EQ.3)TEMP9=TE(L1,L+1)
c********** TIME FOR MAXIMUM TEMPERATURES ********** IF(L1.EQ.1)TIM4=TI(L1.L) IF(L1.EQ.2)TIM5=TI(L1.L) IF(L1.EQ.3)TIM6=TI(L1.L)
110 CONTINUE C********************************************************* C IF THE MAX TEMPERATURE IS ABOVE 75 F. FIND TIME AT WHICH C 75 F OCCURS. DEL IS TEMP DROP PER HOUR C*********************************************************
OEL1=(TEMP4-TEMP1)/(-TIM4+TIM1) DEL2=(TEMP5-TEMP2)/(-TIM5+TIM2) DEL3"(TEMP6-TEMP3)1 (-TIM6+TIM3) IF(TEMP4.GT.TR) TIM4=TIM4+(TEMP4-TR)/DEL1 IF(TEMP5.GT.TR) TIM5=TIM5+(TEMP5-TR)/DEL2 IF(TEMP6.GT.TR) TIM6=TIM6+(TEMP6-TR)/DEL3
C***** CALCULATE AVG MIN TEMP OF PAVEMENT****** TMEN=(1·/3.)*(TEMP1+TEMP2+TEMP3) IF ( TMEN .LT. TR ) GO TO 231 TRANG 0.000 GO TO 2
231 CONTINUE ID 10 + 1 ON(ID) = 1.000
C**** CALCULATE AVG MAX TEMP OF PAVEMENT ****** TMEX=(1./3.)*(TEMP4+TEMP~+TEMP6) IF(TMEX.GT.TR) TMEX=TR
C**** CALCULATE AVG TIME FOR MIN TEMP AND MAX TEMP ******* TIMMIN"(TIM1+TIM2+TIM3)/3.0
1000
C***
TIMMAX=(TIM4+TIM5+TIMG)/S. PERIOO=24.0-XYZTIM+TIMMIN XYZTIM=TIMMAX OLTN=TMEN-TR OLTX=TMEX-TR XYZTEM=TMEX CONTINUE KTMX 0.000 KTMN 0.000 TRMX OMAX1 ( 0.000. TR-TMAX(NI) ) TRMN TR - TMIN(NI)
CALCULATE STRESS INTENSITY FACTOR FOR MIN & MAX TEMP **** CALL FACTOR OF, OLTX. PERIOD, TRMX. 10, YC, SA1, SB1. KTMX,
* NYEAR, LJ, ESSM ) CALL FACTOR ( OF. OLTN, PERIOD, TRMN, 10, YC. SA2. S82, KTMN,
* NYEAR, LJ. ESSM ) K1(IO) KTMN - KTMX OYC(IO) = 0.000 IF (K1(IO) .GT. 0.000) GO TO 875 10 = 10-1 GO TO 2
875 CONTINUE ZO .. YC(IO)
= OF Z1 Z01 .. 0.000
. LT. Z 1 ) CALL ACON + Z01
IF ( ZO NF(IO) ACON-O.OOO
SIMPSN CA, FN, ZOo Z1, Z01 )
IF ( NF(IO) .GT. 0.000 ) COMG COMG + ON(IO)/NF(IO) OYC(IO) "ON(IO) * CA * (K1(ID) ** FN) IF(NF(IO).LE.O.OOO)OYC(IO)=O.
876 YC(IO+1) "YC(IO) + OYC(IO) YC1 = YC(IO+1) IF(YC(IO).LE.1.000)GOTO 877 IF(FLAG)GOTO 877 FLAG .TRUE. PEN1 "OUM1 SPR8I OUM2 CN OUM3 D1 DUM4 TA = OUM5 CM DUM6 CN '" -CN CM -CM 01 10.000**01 E 1 01
c****** FATIGUE PARAMETERS. CA & FN, ARE CALCULATEO ***** C seFT IS THE SCALING FACTOR TO CALCULATE FN C AFAT AND BFAT ARE EMPIRICAL CONSTANTS THAT C 'RELATE CA AND FN. c***********************************************
SCFT=2.5 FN=(1.+1./CN)*(2./SCFT) AFAT=O.GS SFAT=-0.511 CA-10.**«AFAT+FN)/SFAT) CALL CURVE(TH,TC) TC(12) = TC(11) TH(12) = TH(11)
877 CONTINUE
B-74
._------- ---_.
Z01 O.ODO CALL SIMPSN ( CA, FN, DO. DF, Z01 ) NF1(ID) .. 1.00 + Z01 CDMG1 .. CDMG1 + DN(ID)/NF1(ID) IF ( YC(ID+1) .LE. DF ) GO TO 9880 WRITE (6,3456) IYR, MOS(LL), DAY(NI), NYEAR.
1 ID, NF(ID), NF1(ID), YC(ID). CDMG, IF ( YC(ID+1) .LE. OF ) GO TO 9880 YC( ID+1) .. OF
9880 CONTINUE 2 CONTINUE
YCID .. YC(ID) IF ( 10 . EO. 0 WRITE (6,3456)
) YCID .. DO IYR, MOS(Ll), JYR. NYEAR,
CDMG1
1 3456 FORMAT
1
ID, NF(ID), NF1(ID). YCID, COMG. CDMG1 11X, 12, 2X. A4, 12. '. 19', 12,
3457 FORMAT 1 2
1 CONTINUE 3 CONTINUE
1 X. 15, 5E 13.6 ) 11X, 'NO', 6X, 'DATE', 8X, '10', 6X, 'NF'. 10X, 'NF1', 11X. 'YC'. 10X. 'CDMG'. 9X, 'CDMG1', / )
C********** REWIND FILE AND PROCESS NEXT PROBLEM ********** REWIND 1 GOTO 8
999 STOP END
SUBROUTINE CURVE(TH.TC) C*** CURVE CALCULATES TH AND TC, HEATING AND COOLING TEMPS ***
IMPLICIT REAL*8 (A-H,O-Z) DIMENSION TH(11).TC(11) COMMON /A1/ CN.CM,TM,TR,TA.E1,EE COMMON /GT/ GAB1 DIMENSION F(50) COMMON HH(11),ZZ COMMON /KK/ I
100 CONTINUE INT=40 A=CM/(CM+1.0)+CN-2.0 B=-CN DM=(1.0-CN)/(CM+1.0)**(1.0-CN) GA=DGAMMA(A+1.0) GB1=DGAMMA(B+1.0) GAB1=GA*GB1/DGAMMA(A+B+2.0) TH( 1 )= 1.0 TC( 1 )= 1.0 TC( 11 )=0.000 DO 40 INDEX=1.2 HH( 1 )=1.0 AREA=O.ODO ZZ=O.ODO DTN=O.ODO DO 10 1= 1,10 DTN=DTN+O. 1 DTR=DABS(DTN) IF(INDEX.EQ.1) GO TO 21
H=(DTN+1.0)**(CM+1.0) HH( 1+1 )=H HS=(HH(I+1)-HH(I»/(INT-1) CALL HEAT(A,B,H,INT,F,AREA,HS) CONS=DM*(1.0+1.0/DTN)**(1.0-CN) TI I =CONS*AREA TH(I+1 )=TII GO TO 25
21 CONTINUE IF(I.EQ.10) GO TO 10 RR=-DTR H=(1.0+RR)**(CM+1.0) HH(I+1 )=H HS=(HH(I)-HH(I+1»/(INT-1) CALL COOL(A,B,H,AREA) CONS=DM*(-1.0-1.0/RR)**(1.0-CN) TI I =CONS*AREA TC(I+1)=TII
25 CONTINUE 10 CONTINUE 40 CONTINUE
RETURN END
SUBROUTINE HEAT(A,B,H,INT,F,AREA,H5) IMPLICIT REAL*8 (A-H,O-Z) DIMENSION F(INT) COMMON HH(11),ZZ COMMON /KK/ I DA=H**(A+1.0)·*( -1 .0+H)**(B+1.0)/(B+1.0) DB=-(A+B+2.0)/(B+1.0) DO 10 ')=1, INT XX=HH(I)+HS*(.)-1)
10 F(u)=XX**A*(-1.0+XX)**(B+1.0) CALL INTGRT(INT,F,HS,AR) ZZ=ZZ+AR AREA=DA+ZZ*DB RETURN END
SUBROUTINE INTGRT(N,F,H,AREA) IMPLICIT REAL*8 (A-H,O-Z) DIMENSION F(N) AREA=O.ODO 5=0.5*H DO 10 I=2,N AREA=AREA+5*(F(I-1)+F(I»
10 CONTINUE RETURN END
, L

SUBROUTI~E COOL (A,B,H,AREA) IMPLICIT REAL*8 (A-H,O-Z) REAL*4 SH.SA1.SB2.SP REAL*4 SNGL COMMON /GT/ GABl A1=A+1.0 B1=B+1.0 P=O.ODO SH=SNGL(H) SA 1 = SNGL ( Ai) SB2=SNGL(B1) SP=SNGL(P)
10 CONTINUE P=DBLE(SP) H=DBLE(SH) A1=DBLE(SA1) 62=DBLE(SB2) . AREA=GAB1*(1.DO-P) RETURN END
SUBROUTINE FACTOR ( OF. DELT. PERIOD, TRG, 10, YC. SA, SB. XXX. * NYEAR, Lv. ESSM )
C*************************************************************** C* CALCULATES STRESS INTENSITY FACTOR FOR A GIVEN PAVEMENT * C* * C* OF DEPTH OF ASPHALT LAYER * C* DELT PAVEMENT TEMP - STRESS FREE TEMP * C* PERIOD LOADI~G TIME * C* TRG STRESS FREE TEMP - MAX AIR TEMP * C* 10 DAY COUNTER * C* YC CRACK LENGTH * C* SA,S6= CONSTANTS TO CALCULATE STRESS INTENSITY FACTOR * C* XXX STRESS INTENSITY FACTOR * C***************************************************************
IMPLICIT REAL*8 (A-H,O-Z) REAL*8 M1, M2, M3, M4 DIMENSION YC(2500) COMMON /A1/ CN, CM, TM, TR, TA, E1, EE COMMON /A3/ M1. M2. M3. M4 COMMON /A4/ TC(12). TH(12) SA 0.000 SB = 0.000 XXX = 0.000 DT=DELT IF (PERIOD.LT.1.0) PERIOD=1.0 TIME=PERIOD*3600. TTN=TIME ** (-CN) T=TR+DT AT=«TM-TA)/(T-TA»**CM ATN=AT**CN DTN=DT/(TR-TA) DTR=DABS(DTN*10.0) NN=IDINT(DTR) DIF=DTR-NN NG NN + l' IF ( NG .LE. 11 ) GO TO 99

WRITE (6,654) 654 FORMAT ( 5X. 'NG IS GREATER THAN 11. SET NG .. 11', II
NG .. 11 99 CONTINUE
C** CALCULATION OF EFF MODULUS. SEE P. 17, REPORT 18-3 *** IF(OELT) 90.29,30
90 RATIO" (TC(NG+l) - TC(NG» * OIF + TC(NG) ..1=1 GO TO 120
29 RATIO= 1. DO ..1=3 GO TO 120
30 RATIO" (TH(NG+1) - TH(NG» * OIF + TH(NG) ..1=2
120 CONTINUE ESS=ATN*E1*TTN/(1.00-CN) IF (ESS .GT. ESSM) ESS .. ESSM EEF EE + RATIO * ( ESS - EE ) Ml .. 8.89880+00 M2 .. 2.05990+00 M3 .. 0.84810+00 M4 =-0.001570+00 IF ( EEF .GE. 1.0000+05 ) GO TO 978 Ml Ml + ( 29.10630+00 - OF ) * ( 1. 35730+00
1 - 0.0135730+00 * ( EEF / 1000.000) ) M2 .. M2 - ( 129.3215D+00 - OF ) * ( 0.01687+00
1 - 0.00016870+00 * ( EEF / 1000.000) ) IF ( OF . GT. 4.000 ) GO TO 988 M3 M3 + ( 2.78110+00 - OF ) * ( 0.27380+00
1 - 0.0027380+00 * ( EEF / 1000.000) ) GO TO 987
988 CONTINUE M3
1 = M3 - ( 6.58350+00 - OF ) * ( 0.129190+00 -0.00129190+00 * ( EEF / 1000.000»
987 CONTINUE M4
1 978 IF ( TRG
SA S8 XXX RETURN END
.. M4 + ( 5.04720+00 - OF - 0.000011290+00 * ( EEF
.LE. Ml ) RETURN . M2 * ( TRG - M 1 ) M3 + M4 * TRG
= SA * YC(IO) ** S8
) * ( 0.0011290+00 / 1000.000) )
SUBROUTINE SIMPSN ( CA, FN. XF, XL, AREA) IMPLICIT REAL*8 (A-H,O-Z) REAL*8 OIMENSION COMMON /A2/ NS .. NP .. XINC :: X DO 1100 I F YI Y(I)
KMIN, KMAX Y(7) SAl, SA2, SB1, S82 6 7 (XL XF) / 6.0000+00 XF 1, NP
SA2 * X ** SB2 - SAl * X ** SB1 CA * OABS(F) ** RN 1.0000+00 / YI

X 1100 CONTINUE
AREA DO 1200 I A A AREA
1200 CONTI NUE RETURN END
" X + XINC
= 0.000 :: 1, NS, 2
V(I) + 4.0000+00 * V(I+1) + V(I+2) A * XINC / 3.0000+00 AREA + A

*** AGE CAllED: PEN1I= 149.032S TPEN1= 25. OOOOSPRBI = 43.0000 IYR= 0 *** AFTER AGING --> IYR= 0 PEN1= 71.075 TPEN1= 2S.000 SPRBI= 50.431 STIFFNESS OF MIX USING VAN DER POElS NOMOGRAPH INPUT DATA: MODE 1
INITIAL PI -0.09 AGED 0 YEAR(S) TO-0.22
INITIAL SOFTENING POINT RING AND BALL 43.0 AGED 0 YEAR(S) TO SO.4
INITIAL TEMPERATURE NUMBER OF STEPS IN TEMPERATURE
INITIAL LOADING TIME NUMBER OF STEPS IN LOADING TIME
MULTIPLYING FACTOR IN LOADING TIME
PI SOFTENING TEMP. LOADING POINT R&B TIME
0.0 1
1.0E+OS 7 0.1
PEN.2S SMIX
(DEG. C) (DEG. C) ( S ) (LB!IN**2)
-0.22 SO.4 0.0 1.0E+OS 71.1 3. 27E+03 -0.22 SO.4 0.0 1.0E+04 71.1 1. 50E+04 -0.22 SO.4 0.0 1.0E+03 71.1 S.84E+04 -0.22 SO.4 0.0 1.0E+02 71.1 1.92E+OS -0.22 SO.4 0.0 1.0E+01 71 . 1 S.33E+OS
-0.22 SO.4 0.0 1.0E+00 71.1 1.12E+06 -0.22 SO.4 0.0 1.0E-01 71.1 1.9SE+06 NN 1 TEMP 0.0
STIFFNESS OF MIX USING VAN DER INPUT DATA:
SLOPE. M -0.4654609E+00 INTERCEPT,E1 POElS NOMOGRAPH
MODE 1
INITIAL PI -0.09 AGED 0 YEAR(S) TO-0.22
INITIAL SOFTENING POINT RING AND BALL 43.0 AGED o YEAR(S) TO 50.4
INITIAL TEMPERATURE 2S.0 NUMBER OF STEPS IN TEMPERATURE 1
INITIAL LOADING TIME = 1.0E+05 NUMBER OF STEPS IN LOADING TIME 7
MULTIPLYING FACTOR IN LOADING TIME 0.1
0.6046534E+01
'"0 -S o lO -S P> :3
VI ("') o

____ ttL " f i leo : -~!
PI SOFTENING TEMP. LOADING PEN.25 SMIX POINT R&B TIME
(DEG. C) (DEG. C) ( S )' (LB/IN**2)
-0.22 50.4 25.0 1.0E+05 71.1 2.18E+01 -0.22 50.4 25.0 1.0E+04 71.1 1.26E+02 -0.22 50.4 25.0 1.0E+03 71 . 1 7.28E+02 -0.22 50.4 25.0 1.0E+02 71.1 3.54E+03 -0.22 50.4 25.0 1.0E+01 71.1 1.S2E+04
-0.22 50.4 25.0 1.0E+00 71.1 6.20E+04 -0.22 50.4 25.0 1.0E-01 71.1 2.02E+05 NN 2 TEMP 0.2500000E+02 SLOPE, M ··0.6655233E+00 INTERCEPT,E1 0.4782354E+01
STIFFNESS OF MIX USING VAN DER POElS NOMOGRAPH INPUT DATA: MODE 1
INITIAL PI -0.09 AGED 0 YEAR(S) TO-0.22
INITIAL SOFTENING POINT RING AND BALL 43.0 AGED o YEAR(S) TO 50.4
INITIAL TEMPERATURE 60.0 NUMBER OF STEPS IN TEMPERATURE 1
INITIAL lOADING TIME = 1.0E+05 NUMBER OF STEPS IN lOADING TIME 7
MULTIPLYING FACTOR IN LOADING TIME 0.1
PI SOFTENING TEMP. lOADING PEN.25 SMIX POINT R&B TIME
(DEG. C) (DEG. C) ( S ) (LB/IN**2)
-0.22 50.4 60.0 1.0E+05 71.1 6.62E-02 -0.22 50.4 60.0 1.0E+04 71.1 4.83E-01 -0._22 50.4 60.0 1.0E+03 71.1 3.36E+00 -0.22 50.4 60.0 1.0E+02 71.1 2.26E+01 -0.22 50.4 60.0 1.0E+01 71.1 1.28E+02
-0.22 50.4 60.0. 1,OE+OO 71.1 7.47E+02 -0.22 50.4 60.0 1.0E-01 71.1 3.63E+03 NN 3 TEMP 0.6000000E+02 SLOPE, M -0.7920183E+00 INTERCEPT,E1 0.2859218E+01 SMIX 0.3029166E+05 TA -70.000 SETA -0.2011975E+02 INTERCEPT, B 0.3995209E+02 SMIX 0.3029166E+05 TA -65.000 BETA -0. 1904903E+02 INTERCEPT. B 0.3737157E+02 SMIX 0.3029166E+05 TA -60.000 BETA -0. 1797690E+02 INTERCEPT. S 0.3481262E+02 SMIX 0.3029166E+05 TA -55.000 BETA -0. 1689684E+02 INTERCEPT. S 0.3226402E+02 SMIX 0.3029166E+05 TA -50.000 BETA -0. 1580934E+02 INTERCEPT, S 0.2972871E+02 SMIX 0.3029166E+05 TA -45.000 SETA -0. 1471123E+02 INTERCEPT. 8 0.2720287E+02 SMIX 0.3029166E+05 TA -40.000 BETA -0. 1360094E+02 INTERCEPT, S 0.2468622E+02 SMIX 0.3029166E+05 TA -35.000 BETA -0. 1247640E+02 INTERCEPT. S 0.2217807E+02
SOE2 0.3877208E-01 SOE2 0.3161228E-01 SOE2 0.2443966E-01 SOE2 0.1744193E-01 SOE2 0.1090100E-01 SOE2 0.5263560E-02 SOE2 0.1255732E-02 SOE2 0.7058751E-04

*** AGE CAllED: PEN1I~ 149.0325 TPEN1~ 25.0000SPRBI= 43.0000 IYR= *** AFTER AGING --> IYR~ 1 PEN1= 49.473 TPEN1= 25.000 SPRBI= 56.839 STIFFNESS OF MIX USING VAN DER POElS NOMOGRAPH INPUT DATA: MODE 1
INITIAL PI -0.09 AGED 1 YEAR(S) TO 0.35
INITIAL SOFTENING POINT RING AND BALL AGED 1 YEAR(S) TO
INITIAL TEMPERATURE NUMBER OF STEPS IN TEMPERATURE
INITIAL lOADING TIME NUMBER OF STEPS IN LOADING TIME
MULTIPLYING FACTOR IN lOADING TIME
PI SOFTENING TEMP. LOADING POINT R&B TIME
43.0 56.8
0.0 1
1.0E+05 7 0.1
PEN.25 SMIX
(DEG. C) (DEG. C) ( S ) (LS/IN**2)
0.35 56.8 0.0 1.0E+05 49.5 8.38E+03 0.35 56.8 0.0 1.0E+04 49.5 3.40E+04 0.35 56.8 0.0 1.0E+03 49.5 1. 10E+05 0.35 56.8 0.0 1.0E+02 49.5 3.07E+05 0.35 56.8 0.0 1.0E+01 49.5 7.00E+05
0.35 56.8 0.0 1.0E+00 49.5 1.29E+06 0.35 56.8 0.0 1.0E-01 49.5 2.03E+06
NN 1 TEMP 0.0 STIFFNESS OF MIX USING VAN DER INPUT DATA:
SLOPE, M -0.3969445E+00 INTERCEPT,E1 0.6114758E+01 POElS NOMOGRAPH
MODE 1
INITIAL PI -0.09 AGED 1 YEAR(S) TO 0.35
INITIAL SOFTENING POINT RING AND BALL AGED 1 YEAR(S) TO
INITIAL TEMPERATURE NUMBER OF STEPS IN TEMPERATURE
INITIAL LOADING TIME NUMBER OF STEPS IN LOADING TIME
MULTIPLYING FACTOR IN LOADING TIME
43.0 56.8
25.0 1
1.0E+05 7 0.1

ttl I
!,;Q Wi
PI SOFTENING TEMP. LOADING PEN.25 SMIX POINT R&B TIME
(DEG. C) (DEG. C) ( S ) (LB/IN**2)
0.35 56.8 25.0 1.0E+05 49.5 7. 10E+01 0.35 56.8 25.0 1.0E+04 49.5 3.85E+02 0.35 56.8 25.0 1.0E+03 49.5 1.86E+03 0.35 56.8 25.0 1.0E+02 49.5 B.61E+03 0.35 56.8 25.0 1.0E+01 49.5 3.48E+04
0.35 56.8 25.0 1.0E+00 49.5 1.12E+05 0.35 56.8 25.0 1.0E-01 49.5 3.12E+05
NN 2 TEMP 0.2500000E+02 SLOPE, M -0.6117365E+00 INTERCEPT,E1 0.5041730E+01 STIFFNESS OF MIX USING VAN DER POELS NOMOGRAPH INPUT DATA: MODE 1
INITIAL PI -0.09 AGED 1 YEAR(S) TO 0.35
INITIAL SOFTENI,NG POINT RING AND SALL 43.0 AGED 1 YEAR(S) TO 56.8
INITIAL TEMPERATURE = 60.0 NUMBER OF STEPS IN TEMPERATURE 1
INITIAL LOADING TIME 1.0E+05 NUMBER OF STEPS IN LOADING TIME 7
MULTIPLYING FACTOR IN LOADING TIME 0.1
PI SOFTENING TEMP. LOADING PEN.25 SMIX POINT R&B TIME
(DEG. C) (DEG. C) ( S ) (LS/IN**2)
0.35 56.8 60.0 1.0E+05 49.5 1.92E-01 0.35 56.8 60.0 1.0E+04 49.5 1.25E+00 0.35 56.8 60.0 1.0E+03 49.5 9.29E+00 0.35 56.8 60.0 1.0E+02 49.5 5.72E+01 0.35 56.8 60.0 1.0E+01 49.5 3.08E+02
0.35 56.8 60.0 1.0E+00 49.5 1.49E+03 0.35 56.B 60.0 1.0E-01 49.5 7.14E+03
NN 3 TEMP 0.6000000E+02 SLOPE, M -0.7636267E+00 INTERCEPT,E1 0.31B7518E+01 SMIX 0.S504259E+05 TA -70.000 BETA -0.2043449E+02 INTERCEPT, S 0.4058609E+02 SMIX 0.5504259E+05 TA -65.000 BETA -0. 1934731E+02 INTERCEPT, B 0.3796574E+02 SMIX 0.5504259E+05 TA -60.000 BETA -0. 1825867E+02 INTERCEPT, B 0.3536728E+02 SMIX 0.5504259E+05 TA -55.000 BETA -0. 1716200E+02 INTERCEPT, B 0,3277936E+02 SMIX 0.5504259E+05 TA -50.000 BETA -0. 1605775E+02 INTERCEPT, S 0.3020485E+02 SMIX 0.5504259E+05 TA -45.000 BETA -0. 1494275E+02 INTERCEPT, S 0.2763997E+02
, SMIX 0.5504259E+05 TA -40.000 SETA -0. 13B1536E+02 INTERCEPT, S 0.2508441E+02 SMIX 0.5504259E+05 TA -35.000 BETA -0. 1267351E+02 INTERCEPT, S 0.2253745E+02
SOE2 0.4453669E-01 SOE2 0.3671252E-01 SOE2 0.2883490E-01 SOE2 0.2107830E-01 SOE2 0.1370536E-01 SOE2 0.7176872E-02 SOE2 0.2211459E-02 SOE2 0.6232895E-05

THERMAL CRACKING ANALYSIS FOR HOUGHTON ( MICHIGAN AREA 3 )
THIS ANALYSIS BEGINS AFTER 710630 AND RUNS FOR 2 YEARS.
THE BITUMEN USED HAS THE FOLLOWING ORIGINAL PROPERTIES: PENETRATION INDEX -0.090 SOFTENING POINT RING & BALL TEMP = 109.400 DEG F
THE ASPHALT CONCRETE LAYER IS 2.500 INCHES THICK AND IS ASSUMED TO HAVE AN INITIAL CRACK OF 0.200 INCHES EXTENDING FROM THE SURFACE. THE ASPHALT CONCRETE HAS THE FOLLOWING MIX PROPERTIES:
AGGREGATE VOLUME CONCENTRATION'" 0.880 DENSITY = 140.000 LBS/FT**3 SPECIFIC HEAT = 0.220 BTU/LB DEG F THERMAL CONDUCTIVITY = 0.700 BTU/FT**2/HR,OEG F/FT ABSORPTIVITY 0.950
THE PAVEMENT IS ASSUMED TO BE SUBJECTED TO THE FOLLOWING AVERAGE ENVIRONMENTAL CONDITIONS:
WIND VELOCITY = 9.000 MILES PER HOUR AVERAGE ANNUAL SOLAR RADIATION 294.000 LANGLEYS/OAY AVERAGE JULY SOLAR RADIATION = 518.000 LANGLEYS/DAY

*** YEAR o *** IN PLACE BITUMIN PROPERTIES:
PENETRATION AT 77 OEG F 71.075 SOFTENING POINT RING & BALL TEMP 122.776 OEG F
FATIGUE PARAMETERS OF THE MIX: A = 0.5390-05 N = 2.002
NO OATE ID NF NFl YC COMG COMG1
..... J:O .. 0 JUL 31, 1971 o 0.0 0.0 0.2000000+00 0.0 0.0 <.11 0 AUG 31, 1971 o 0.0 0.0 0.2000000+00 0.0 0.0
CO[ 0 SEP 30, 1971 o 0.0 0.0 0.2000000+00 0.0 0.0 . U11 0 OCT 31, 1971 o 0.0 0.0 0.2000000+00 0.0 0.0 0 NOV 30, 1971 10 0.1343480+05 O. 1360530+05 0.2019280+00 0.7283130-02 0.7237630-02 0 OEC 31, 1971 34 0.3441790+02 0.3621040+02 0.2058770+00 0.4997270-01 0.4820490-01 0 JAN 31. 1972 65 0.4798000+03 0.7294140+03 0.2924150+00 0.2462600+00 0.2123140+00 0 FEB 29, 1972 93 0.4497880+07 O. 1236690+08 0.4345600+00 0.5322140+00 0.3953680+00 0 MAR 31, 1972 113 0.5439420+07 0.3355120+08 0.7901390+00 0.1089250+010.6301210+00 0 APR 30, 1972 119 0.6097980+05 0.3812440+06 0.7902860+00 0.1089530+010.6301670+00 0 MAY 31, 1972 119 0.6097980+05 0.3812440+06 0.7902860+000.1089530+010.6301670+00 0 JUN 30, 1972 119 0.6097980+05 0.3812440+06 0.7902860+00 0.1089530+01 0.6301670+00

*** YEAR 1 *** IN PLACE BITUMIN PROPERTIES:
PENETRATION AT 77 OEG F 49.473 SOFTENING POINT RING & BALL TEMP 134.310 OEG F
FATIGUE PARAMETERS OF THE MIX: A 0.3350-05 N = 2.108
NO DATE 10 NF NFl YC COMG COMGl
tIl JUL 31. 1972 119 0.6097980+05 0.3812440+06 0.7902860+00 0.1089530+01 0.6301670+00 1 AUG 31, 1972 119 0.6097980+05 0.3812440+06 0.7902860+00 0.1089530+01 0.6301670+00
'00 SEP 30, 1972 119 0.6097980+05 0.3812440+06 0.7902860+000.1089530+01 0.6301670+00 0'\ OCT 31. 1972 132 0.4051060+08 0.2719520+09 0.7903240+000.1089590+01 0.6301750+00 NOV 30, 1972 151 0.4039320+05 0.2666000+06 0.7910110+00 0.1090880+01 0.6303800+00 DEC 31, 1972 182 0.5101050+06 0.5553640+07 0.1067580+01 0.1481440+01 0.7194840+00 JAN 31, 1973 211 0.1422920+02 0.1106140+03 0.1294000+010.1855490+01 0.7807600+00 FEB 26, 1973 237 0.5832430+00 0.3060060+02 0.2258340+01 0.5374360+01 0.9324230+00 FEB 28, 1973 239 0.0 0.5011010+07 0.2500000+01 0.5374360+01 0.9703000+00 MAR 31, 1973 250 0.0 0.3382850+09 0.2500000+01 0.5374360+01 0.9703050+00 APR 30, 1973 256 0.0 0.3719830+07 0.2500000+01 0.5374360+01 0.9703060+00 MAY 31, 1973 256 0.0 0.3719830+07 0.2500000+01 0.5374360+01 0.9703060+00 JUN 30, 1973 256 0.0 0.3719830+07 0.2500000+01 0.5374360+01 0.9703060+00

USING ORIGINAL PROPERIES OF BITUMEN (WITHOUT AGING) STIFFNESS OF MIX USING VAN DER POELS NOMOGRAPH INPUT DATA: MODE 1
INITIAL PI -0.09 AGED -1 YEAR(S) TO-0.09
INITIAL SOFTENING POINT RING AND BALL 43.0 AGED -1 YEAR(S) TO 43.0
INITIAL TEMPERATURE 0.0 NUMBER OF STEPS IN TEMPERATURE 1
INITIAL LOADING TIME NUMBER OF STEPS IN LOADING TIME
MULTIPLYING FACTOR IN LOADING TIME
PI SOFTENING TEMP. LOADING POINT R&B TIME
1.0E+05 7 0.1
PEN.25 SMIX
(DEG. C) (DEG. C) ( S ) (LB!IN**2)
-0.09 43.0 0.0 1.0E+05 149.0 7.29E+02 -0.09 43.0 0.0 1.0E+04 149.0 3.55E+03 -0.09 43.0 0.0 1.0E+03 149.0 1.60E+04 -0.09 43.0 0.0 1.0E+02 149.0 6.0SE+04 -0.09 43.0 0.0 1.0E+01 149.0 1.94E+05
-0.09 43.0 0.0 1.0E+00 149.0 5.32E+05 . -0.09 43.0 0.0
NN 1 TEMP 0.0 STIFFNESS OF MIX USING VAN DER INPUT DATA:
1.0E-01 149.0 1.11E+06 SLOPE, M -0.5349426E+00 INTERCEPT,E1 0.5706578E+01
POELS NOMOGRAPH MODE 1
INITIAL PI -0.09 AGED -1 YEAR(S) TO-0.09
INITIAL SOfTENING POINT RING AND BALL 43.0 AGED -1 YEAR(S) TO 43.0
INITIAL TEMPERATURE 2S.0 NUMBER OF STEPS IN TEMPERATURE = 1
INITIAL LOADING TIME NUMBER OF STEPS IN LOADING TIME
MULTIPLYING FACTOR IN LOADING TIME
1.0E+OS 7 0.1
-< ....... C/) n a .......

PI SOFTENING TEMP. LOADING PEN.25 SMIX POINT R&B TIME
(DEG. C) (DEG. C) ( S ) (LB/IN**2)
",0.09 43.0 25.0 1.0E+05 149.0 5.02E+00 -0.09 43.0 25.0 1.0E+04 149.0 3.49E+01 -0.09 43.0 25.0 1.0E+03 149.0 1.88E+02 -0.09 43.0 25.0 1.0E+02 149.0 1.01E+03 -0.09 43.0 25.0 1.0E+01 149.0 5.02E+03
-0.09 43.0 25.0 1.0E+00 149.0 2.28E+04 -0.09 43.0 25.0 1.0E-01 149.0 7.87E+04 NN 2 TEMP 0.2500000E+02 SLOPE, M -0.7015494E+00 INTERCEPT,E1 0.4328370E+01
STIFFNESS OF MIX USING VAN DER POELS NOMOGRAPH INPUT DATA: MODE 1
INITIAL PI -0.09 AGED -1 YEAR(S) TO-0.09
INITIAL SOFTENING POINT RING AND BALL 43.0 AGED -1 YEAR(S) TO 43.0
INITIAL TEMPERATURE NUMBER OF STEPS IN TEMPERATURE
INITIAL LOADING TIME NUMBER OF STEPS IN LOADING TIME
MULTIPLYING FACTOR IN LOADING TIME
PI SOFTENING TEMP. LOADING POINT R&B TIME
60.0 1
1.0E+05 7 0.1
PEN.25 SMIX
(DEG. C) (DEG. C) ( S ) (LB/IN**2)
-0.09 43.0 60.0 1.0E+05 149.0 3.07E-02 -0.09 43.0 60.0 1.0E+04 149~0 2.42E-01 -0.09 43.0 60.0 1.0E+03 149.0 1.50E+00 -0.09 43.0 60.0 1 .OE+02 149.0 1.11E+01 -0.09 43.0 60.0 1.0E+01 149.0 6.73E+01
-0.09 43.0 60.0 1.0E+00 149.0 3.70E+02 -0.09 43.0 60.0 1.0E-01 149.0 1.81E+03 NN 3 TEMP 0.6000000E+02 SLOPE, M -0.7976673E+00 INTERCEPT,E1 0.2559314E+01 SMIX 0.1064974E+05 TA -70.000 BETA -0. 1851500E+02 INTERCEPT, B 0.3678659E+02 SMIX 0.1064974E+05 TA -65.000 BETA -0. 1753035E+02 INTERCEPT, B 0.3441319E+02 SMIX 0.1064974E+05 TA -60.000 BETA -0. 1654437E+02 INTERCEPT. B 0.3205956E+02 SMIX 0.1064974E+05 TA -55.000 BETA -0. 1555110E+02 INTERCEPT, B 0.2971542E+02 SMIX 0.1064974E+05 TA -50.000 BETA -0. 1455097E+02 INTERCEPT, B 0.2738347E+02 SMIX O. 106497 4E +05 TA -45.000 BETA -0.1354111E+02 INTERCEPT, B 0.2506020E+02 SMIX 0.1064974E+05 TA -40.000 BETA -0. 1252001E+02 INTERCEPT, B 0.2274533E+02 SMIX 0.1064974E+05 TA -35.000 BETA -0. 1148581E+02 INTERCEPT, B 0.2043820E+02
SOE2 0.4285266E-01 SOE2 0.3588247E-01 SOE2 0.2878901E-01 SOE2 0.2171302E-01 SOE2 O. 1485654E -0 1 SOE2 0.8567978E-02 SOE2 0.3409549E-02 SOE2 0.3256090E-03

*** AGE CALLED; PENH= 149.0325 TPEN1= 25.0000SPRBI 43.0000 IYR= 0 *** AFTER AGING --> IYR= 0 PEN1= 71.075 TPEN1= 25.000 SPRBI= 50.431 STIFFNESS OF MIX USING VAN DER POELS NOMOGRAPH INPUT DATA: MODE 1
INITIAL PI -0.09 AGED 0 YEAR(S) TO-0.22
INITIAL SOFTENING POINT RING AND BALL AGED 0 YEAR(S) TO
INITIAL TEMPERATURE NUMBER OF STEPS IN TEMPERATURE
INITIAL LOADING TIME NUMBER OF STEPS IN LOADING TIME
MULTIPLYING FACTOR IN LOADING TIME
PI SOFTENING TEMP. LOADING POINT R&B TIME
43.0 50.4
0.0 1
1.0E+05 7 0.1
PEN.25 SMIX
(DEG. C) (DEG. C) ( S ) (L8/IN**2)
-0.22 50.4 0.0 1.0E+05 71.1 3.27E+03 -0.22 50.4 0.0 1.0E+04 71 . 1 1.50E+04 -0.22 50,4 0.0 1.0E+03 71.1 5.84E+04 -0.22 50.4 0.0 1.0E+02 71.1 1.92E+05 -0.22 50.4 0.0 1.0E+01 71.1 5.33E+05
-0.22 50.4 0.0 1.0E+00 71.1 1. 12E+06 -0.22 50 4 0.0 1.0E-01 71.1 1.95E+06 NN TEMP 0.0
STIFFNESS OF MIX USING VAN DER INPUT DATA:
SLOPE, M -0.4654609E+00 INTERCEPT,E1 POELS NOMOGRAPH
MODE 1
INITIAL PI -0.09 AGED 0 YEAR(S) TO-0.22
INITIAL SOFTENING POINT RING AND BALL 43.0 AGED o YEAR(S) TO 50.4
INITIAL TEMPERATURE 25.0 NUMBER OF STEPS IN TEMPERATURE 1
INITIAL LOADING TIME 1.0E+05 NUMBER OF STEPS IN LOApING TIME ,. 7
MULTIPLYING FACTOR IN LOADING TIME 0.1
0.6046534E+01
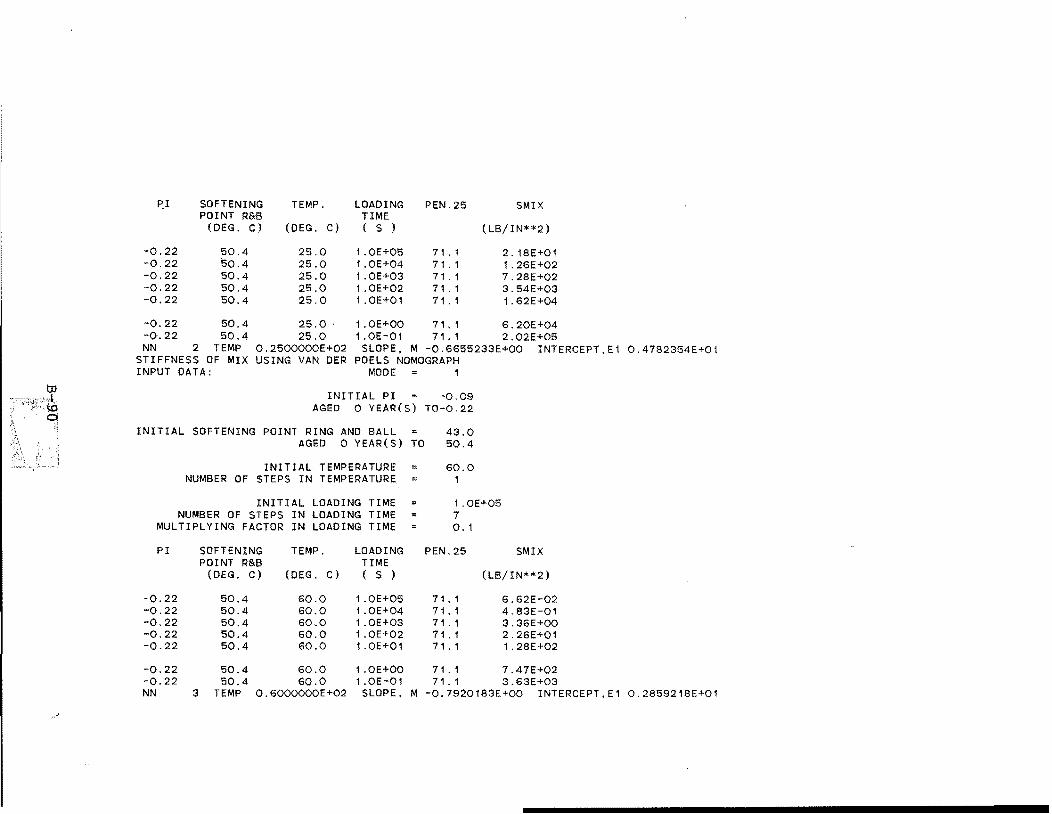
!='I SOFTENING TEMP. LOADING PEN.25 SMIX POINT R&B TIME
(DEG. C) (DEG. C) ( S ) (LB/IN**2)
-0.22 50.4 25.0 1.0E+05 71.1 2.18E+01 -0.22 50.4 25.0 1.0E+04 71.1 1.26E+02 -0.22 50.4 25.0 1 .OE+03 71 . 1 7.28E+02 -0.22 50.4 25.0 1 .OE+02 71 . 1 3.54E+03 -0.22 50.4 25.0 1 .OE+01 71.1 1.62E+04
-0.22 50.4 25.0 . 1.0E+00 71.1 6.20E+04 -0.22 50.4 25.0 1.0E-01 71.1 2.02E+05 NN 2 TEMP 0.2500000E+02 SLOPE, M -0.6655233E+00 INTERCEPT.E1
STIFFNESS OF MIX USING VAN DER POELS NOMOGRAPH INPUT DATA: MODE 1
INITIAL PI -0.09 AGED 0 YEAR(S) TO-0.22
INITIAL SOFTENING POINT RING AND BALL AGED 0 YEAR(S) TO
INITIAL TEMPERATURE NUMBER OF STEPS IN TEMPERATURE
INITIAL LOADING TIME NUMBER OF STEPS IN LOADING TIME
MULTIPLYING FACTOR IN LOADING TIME
PI SOFTENING TEMP. LOADING POINT R&B TIME
43.0 50.4
60.0 1
1.0E+05 7 0.1
PEN.25 SMIX
(DEG. C) (DEG. C) ( S ) (LB/IN**2)
-0.22 50.4 60.0 1.0E+05 71.1 6.62E-02 -0.22 50.4 60.0 1.0E+04 71.1 4.83E-01 -0.22 50.4 60.0 1.0E+03 71 . 1 3.36E+00 -0.22 50.4 60.0 1.0E+02 71.1 2.26E+01 -0.22 50.4 60.0 1.0E+01 71.1 1.28E+02
-0.22 50.4 60.0 1.0E+00 71 . 1 7.47E+02 -0.22 50;4 60.0 1.0E-01 71 . 1 3.63E+03 NN 3 TEMP 0.6000000E+02 SLOPE, M -0. 7920183E+00 INTERCEPT,E1
0.4782354E+01
0.2859218E+01

SMIX 0.3029166E+05 TA -70.000 BETA -0.2011975E+02 INTERCEPT, SMIX 0.3029166E+05 TA -65.000 BETA -0. 1904903E+02 INTERCEPT, SMIX 0.3029166E+05 TA -60.000 BETA -0. 1797690E+02 INTERCEPT, SMIX O.3029166E+05 TA -55.000 BETA -0. 1689684E+02 INTERCEPT. SMIX 0.3029166E+05 TA -50.000 BETA -0. 1580934E+02 INTERCEPT, SMIX 0.3029166E+05 TA -45.000 BETA -0. 1471123E+02 INTERCEPT, SMIX 0.3029166E+05 TA -40.000 BETA -0. 1360094E+02 INTERCEPT, SMIX 0.3029166E+05 TA -35.000 BETA -0. 1247640E+02 INTERCEPT,
*** AGE CALLED: PEN1I= 149.0325 TPEN1= 25.0000SPRBI= 43.0000 IYR= 1 *** AFTER AGING --> IYR= 1 PEN1= 49.473 TPEN1= STIFFNESS OF MIX USING VAN DER POELS NOMOGRAPH INPUT DATA: MODE 1
INITIAL PI -0.09 AGED 1 YEAR(S) TO 0.35
INITIAL SOFTENING POINT RING AND BALL AGED 1 YEAR(S) TO
INITIAL TEMPERATURE NUMBER OF STEPS IN TEMPERATURE
43.0 56.8
0.0 1
25.000 SPRBI=
INITIAL LOADING TIME NUMBER OF STEPS IN LOADING TIME
MULTIPLYING FACTOR IN LOADING TIME
1.0E+05 7 0.1
PI SOFTENING TEMP. LOADING PEN.25 SMIX POINT RIlB TIME
(DEG. C) (DEG. C) ( S ) (LB/IN**2)
0.35 56.8 0.0 1.0E+05 49.5 8.38E+03 0.35 56.8 0.0 1.0E+04 49.5 3.40E+04 0.35 56.S 0.0 1.0E+03 49.5 1.10E+05 0.35 56.S 0.0 1.OE+02 49.5 3.07E+05 0.35 56.8 0.0 1.0E+01 49.5 7.00E+05
0.35 56.8 0.0 1.0E+00 49.5 1.29E+06 0.35 56.8 0.0 1.0E-01 49.5 2.03E+06
56.839
B 0.3995209E+02 B 0.3737157E+02 B 0.3481262E+02 B 0.3226402E+02 B ,o.2972871E+02 B 0.2720287E+02 B 0.2468622E+02 B 0.2217807E+02
NN TEMP 0.0 SLOPE. M -0. 3969445E+00 INTERCEPT,E1 0.6114758E+01
SOE2 0.3877208E-01 SOE2 0.3161228E-01 SOE2 0.2443966E-01 SOE2 0.1744193E-01 SOE2 0.1090100E-01 SOE2 0.5263560E-02 SOE2 0.1255732E-02 SOE2 0.7058751E-04

~.-,."
STIFFNESS OF MIX USING VAN DER POELS NOMOGRAPH INPUT DATA: MODE 1
INITIAL PI -0.09 AGED 1 YEAR(S) TO 0.35
INITIAL SOFTENING POINT RING AND BALL AGED 1 YEAR(S) TO
INITIAL TEMPERATURE NUMBER OF STEPS IN TEMPERATURE
INITIAL LOADING TIME NUMBER OF STEPS IN LOADING TIME
MULTIPLYING FACTOR IN LOADING TIME
PI SOFTENING TEMP. LOADING POINT R&B TIME
43.0 56.S
25.0 1
1.0E+05 1 0.1
PEN.25 SMIX
(DEG. C) (DEG. C) ( S ) (LB/IN"'*2)
0.35 56.8 25.0 1 . OE+05 49.5 1.10E+01 0.35 56.8 25.0 1.0E+04 49.5 3.85E+02 0.35 56.8 25.0 1.0E+03 49.5 1.86E+03 0.35 56.8 25.0 1.0E+02 49.5 8.61E+03 0.35 56.8 25.0 1.0E+01 49.5 3.48E+04
0.35 56.8 25.0 1.0E+00 49.5 1.12E+05 0.35 56.8 25.0 1.0E-01 49.5 3. 12E+05
NN 2 TEMP 0.2500000E+02 SLOPE, 1\11 -0.6117365E+00 INTERCEPT,El 0.5041730E+01

to '+, \.0"" '-w,l
STIFFNESS OF MIX USING VAN DER POElS NOMOGRAPH INPUT DATA: MODE 1
INITIAL PI -0.09 AGED 1 YEAR(S) TO 0 35
INITIAL SOFTENING POINT RING AND BALL = AGED 1 YEAR(S) TO
INITIAL TEMPERATURE NUMBER OF STEPS IN TEMPERATURE
INITIAL LOADING TIME NUMBER OF STEPS IN LOADING TIME
MULTIPLYING FACTOR IN LOADING TIME
PI SOFTENING TEMP. LOADING POINT R&B TIME
43.0 56.8
60.0 1
1.0E+05 7 0.1
PEN.25 SMIX
(DEG. Cr (DEG. C) ( S ) (lB/IN**2)
0.35 56.8 60.0 1.0E+05 49.5 1.92E-01 0.35 56.8 60.0 1 .OE+04 49.5 1.25E+00 0.35 56.8 60.0 1.0E+03 49.5 9.29E+00 0.35 56.8 60.0 1.0E+02 49.5 5.72E+01 0.35 56.8 60.0 1.0E+01 49.5 3.08E+02
0.35 56.8 60.0 1.0E+00 49.5 1.49E+03 0.35 56.8 60.0 1.0E-01 49.5 7. 14E+03
NN 3 TEMP 0.6000000E+02 SLOPE, M -0.7636267E+00 INTERCEPT,E1 0.3187518E+01 SMIX 0.5504259E+05 TA -70.000 BETA -0.2043449E+02 INTERCEPT, B 0.4058609E+02 SMIX 0.5504259E+05 TA -65.000 BETA -0. 1934731E+02 INTERCEPT, B 0.3796574E+02 SMIX 0.5504259E+05 TA -60.000 BETA -0. 1825867E+02 INTERCEPT, B 0.3536728E+02 SMIX 0.5504259E+05 TA -55.000 BETA -0. 1716200E+02 INTERCEPT, B 0.3277936E+02 SMIX 0.5504259E+05 TA -50.000 BETA -0. 1605775E+02 INTERCEPT, B 0.3020485E+02 SMIX 0.5504259E+05 TA -45.000 BETA -0. 1494275E+02 INTERCEPT, B 0.2763997E+02 SMIX 0.5504259E+05 TA -40.000 BETA -0. 1381536E+02 INTERCEPT, B 0.2508441E+02 SMIX 0.5504259E+05 TA -35.000 BETA -0. 1267351E+02 INTERCEPT, B 0.2253745E+02
SOE2 0.4453669E-01 SOE2 0.3671252E-01 SOE2 0.2883490E-01 SOE2 0.2107830E-01 SOE2 0.1370536E-01 SOE2 0.7176872E-02 SOE2 0.2211459E-02 SOE2 0.6232895E-05

THERMAL CRACKING ANALYSIS FOR HOUGHTON ( MICHIGAN AREA 3 )
THIS ANALYSIS BEGINS AFTER 710630 AND RUNS FOR 2 YEARS.
THE BITUMEN USED HAS THE FOLLOWING ORIGINAL PROPERTIES: PENETRATION INDEX -0.090 SOFTENING POINT RING & BALL TEMP = 109.400 DEG F
THE ASPHALT CONCRETE LAYER IS 2.500 INCHES THICK AND IS ASSUMED TO HAVE AN INITIAL CRACK OF 0.200 INCHES EXTENDING FROM THE SURFACE. THE ASPHALT CONCRETE HAS THE FOLLOWING MIX PROPERTIES:
AGGREGATE VOLUME CONCENTRATION = 0.880 DENSITY ~ 140.000 LBS/FT**3 SPECIFIC HEAT = 0.220 BTU/LB DEG F THERMAL CONDUCTIVITY = 0.700 BTU/FT**2/HR,DEG F/FT ABSORPTIVITY = 0.950
THE PAVEMENT IS ASSUMED TO BE SUBuECTED TO THE FOLLOWING AVERAGE ENVIRONMENTAL CONDITIDNS;
WIND VELOCITY 9.000 MILES PER HOUR AVERAGE ANNUAL SOLAR RADIATION 294.000 LANGLEYS/DAY AVERAGE uULY SOLAR RADIATION = 518.000 LANGLEYS/DAY

*** YEAR 0 *** IN PLACE BITUMIN PROPERTIES:
PENETRATION AT 77 OEG F 71.075 SOFTENING POINT RING & BALL TEMP 122.776 OEG F
FATIGUE PARAMETERS OF THE MIX: A 0.5390-05 N 2.002 A 0.5390-05 N = 2.002 (VALUES USED WHEN YC IS GREATER THAN 1.0 INCH)
NO
o tJUL o AUG o SEP o OCT o NOV o DEC o tJAN o FEB o MAR o APR o MAY o tJUN
DATE
31, 31, 30, 31, 30, 31, 31, 29, 31, 30, 31, 30,
1971 1971 1971 1971 1971 1971 1972 1972 1972 1972 1972 1972
ID NF
o 0.0 o 0.0 o 0.0 o 0.0
10 0.1343480+05 34 0.3441790+02 65 0.4798000+03 93 0.4497880+07
113 0.5439420+07 119 0.6097980+05 119 0.6097980+05 119 0.6097980+05
0.0 0.0 0.0 0.0
NF1
O. 1360530+05 0.3621040+02 0.7294140+03 O. 1236690+08 0.3355120+08 0.3812440+06 0.3812440+06 0.3812440+06
YC COMG COMG1
0.2000000+00 0.0 0.0 0.2000000+00 0.0 0.0 0.2000000+00 0.0 0.0 0.2000000+00 0.0 0.0 0.2019280+00 0.7283130-02 0.7237630-02 0.2058770+00 0.4997270-01 0.4820490-01 0.2924150+00 0.2462600+00 0.2123140+00 0.4345600+00 0.5322140+00 0.3953680+00 0.7901390+00 0.1089250+01 0.6301210+00 0.7902860+000.1089530+010.6301670+00 0.7902860+000.1089530+010.6301670+00 0.7902860+00 0.1089530+010.6301670+00

*** YEAR 1 *** IN PLACE BITUMIN PROPERTIES:
PENETRATION AT 77 OEG F 49.473 SOFTENING POINT RING & BALL TEMP 134.310 OEG F
FATIGUE PARAMETERS OF THE MIX: A 0.3350-05 N 2.108 A = 0.5390-05 N = 2.002 (VALUES USED WHEN YC IS GREATER THAN 1.0 INCH)
'~O" NO OATE 10 NF NF1 YC COMG COMG1
tD· ';1 JUL 31. 1972 119 . O. 609798D+05 0.3812440+06 0, 79.o286D+00 0.1089530+01 0.6301670+00 \D AUG 31. 1972 119 0.6097980+05 0.3812440+06 0.79.02860+00 0.1089530+01 0.6301670+00 0lI SEP 30, 1972 119 0.6097980+05 0.3812440+06 0.7902860+000.1089530+01 0.6301670+00
OCT 31, 1972 132 0.4051060+08 0.2719520+09 0.7903240+000.1089590+01 0.6301750+00 NOV 30, 1972 151 0.4039320+05 0.2666000+06 0.7910110+00 0.1090880+01 0.6303800+00 DEC 31. 1972 168 0.1928200+03 0.1417840+04 0.1046140+01 0.1457900+01 0.7155540+00 JAN 31. 1973 184 0.2537010+04 0.3556710+05 0.1361060+01 0.1852150+01 0.7972540+00 FEB 28, 1973 201 0.3264720+02 O. 1304840+04 0.1985230+010.2822920+01 0.9038700+00 MAR 31, 1973 201 0.3264720+02 O. 1304840+04 0.1985230+01 0.2822920+01 0.9038700+00 APR 30. 1973 201 0.3264720+02 O. 1304840+04 0,1985230+01 0.2822920+01 0,9038700+00 MAY 31, 1973 201 0.3264720+02 O. 1304840+04 0.1985230+010.2822920+01 0.9038700+00 JUN 30. 1973 201 0.3264720+02 . O. 1304840+04 0.1985230+01 0.2822920+01 0.9038700+00

APPENDIX C
Pattern Search Program To Find Optimum Pavement Design Quantities
C-l

APPENDIX C
Pattern Search Program to Find Optimum Values
A computer program for function optimization using pattern search and
gradient is modified to find the optimum values of penetration index, PI,
softening point ring and ball temperature, TRB, depth of asphalt concrete
layer, OF, and the volumetric concentration of aggregate, CV, for given
values of the age of pavement, T, the average annual amplitude of solar ra
diation, SA, and the minimum ~onthly temperature, TM. The inputs to this
program are the initial values of PI, TRB, CV, and OF, and T, SA, and TM.
The lower and upper limits of PI, TRB, CV, and OF applicable to this model
are:
PI = -1.00 to 2.00,
TRS = 100.4°F to 125.6°F,
CV = 0.85 to 0.90, and
OF = 2.00" to 8.00".
These values are set in the program.
THE GUIDE FOR INPUT DATA
CARD 01: (4FlO.0)
Column
01-10
11-20
21-30
31-40
Variable
PI
TRB
CV
OF
Description
Penetration index.
Softening point ring and ball temperature, of.
(Aggregate volume)/(aggregate volume + asphalt
vol ume).
Depth of the asphalt concrete layer, in.

The values of PI, TRB, CV, and DF are the initial values assumed.
CARD 02: (';3F10. 0)
Column
01-10
11-20
Variable
T
SA
TM
Description
The age of the pavement.
The average annual amplitude of solar ra
diation, Langleys/day.
The minimum monthly temperature, of.

C**************************************************************** C C PATTERN S~ARCH PROGRAM TO DETERMINE OPTIMAL VALUES OF C C PI, TR8, CV, AND OF C C****************************************************************
C C C
C
C
C
C
C C
IMPLICIT REAL*8 (A-H, O-Z) DIMENSION X(11).XBASE(11),XTEMP(11),XTEST(11),PARTZ(11),PARTH(11) COMMON KC, IFEAS. C(10), ISTOP, LACT. CFSC, CASS, ADAF, M, N COMMON !VALUES! VLO(5),VHI(5),A(4),AO, NC
LAST = 0
20 CONTI NU E • ZTEST '" 0.0 Z8ASE '" 0.0 ZP .. 0.0 ZM .. 0.0 Z 0.0 ISW 0 CALL INPUT (LAST) IF ( LAST .EO. 1 ) GO TO 9999
22 CONTINUE
M '" NC N = NC
DO 10 I '" 1, N 10 X(I) = .A(I)
o :: 0.05 ADAF = 1.0 CFSC ::: 0.03 CASS = CFSC ISTOP ::: 2 lFEAS '" 1 KC = a LACT '" 0
C x = 1
C
C
X(11) '" 1.0
CALL SUMS(X, ZBASE) ZTEMP '" Z8ASE DO 110 I .. 1, N XTEMP(I) '" X(I)
110 XBASE(I) = X(I) IF (IFEAS .EO. 1) GO TO 111
C x = 2
C X(11) = 2.0
CALL SUMC(X, CBASE) CTEMP = CBASE CFSCI '" CFSC
c**** THIS IS POINT A WHICH APPEARS IN FLOWCHART, FIG. 8.
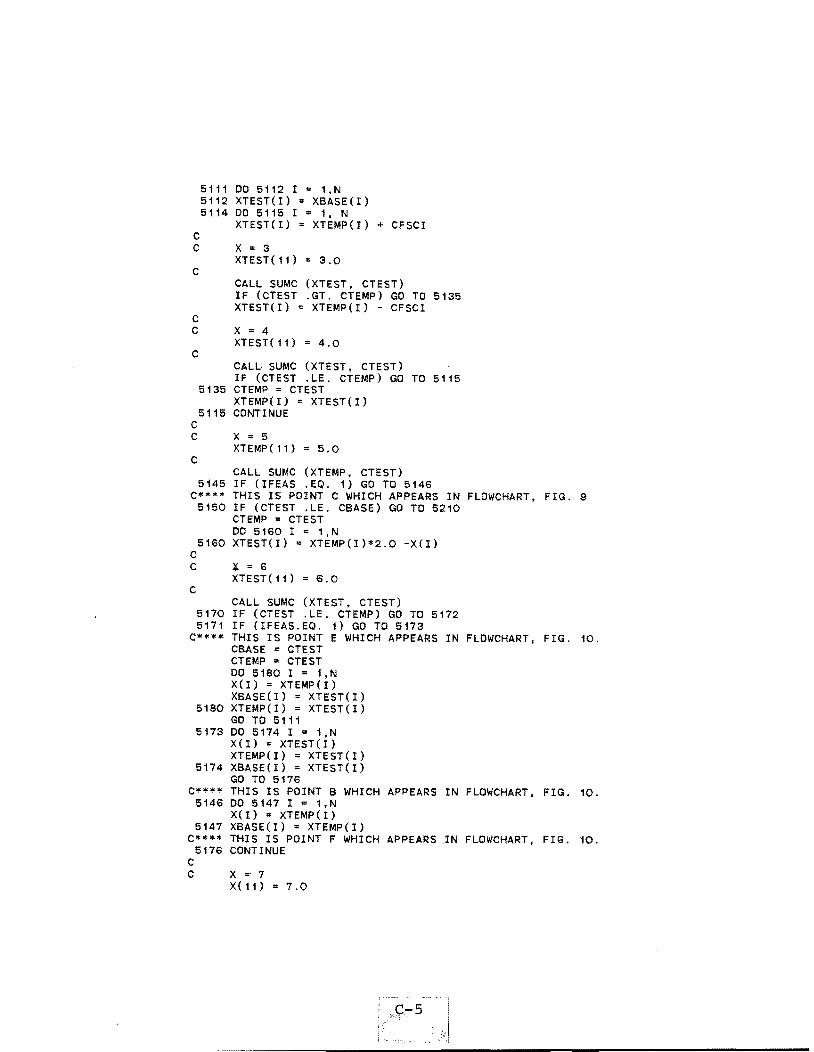
5111 DO 5112 I = 1,N 5112 XTEST(I) '" XBASE(I) 5 114 DO 5 1 1 5 I '" 1, N
XTEST(I) '" XTEMP(I) + CFSCI C C X '" 3
XTEST(11) ., 3.0 C
CALL SUMC (XTEST, CTEST) IF (CTEST .GT. CTEMP) GO TO 5135 XTEST(I) '" XTEMP(I) - CFSCI
C C X = 4
XTEST(11) = 4.0 C
CALL SUMC (XTEST, CTEST) IF (CTEST .LE. CTEMP) GO TO 5115
5135 CTEMP = CTEST XTEMP(I) '" XTEST(I)
5115 CONTINUE C C X '" 5
XTEMP(11) = 5.0 C
CALL SUMC (XTEMP, CTEST) 5145 IF (IFEAS .EQ. 1) GO TO 5146
c**** THIS IS POINT C WHICH APPEARS IN FLOWCHART, FIG. 9 5150 IF (CTEST .LE. CBASE) GO TO 5210
CTEMP '" CTEST DO 5 160 I = 1, N
5160 XTEST(I) '" XTEMP(I)*2.0 -XCI) C C ¥ = 6
XTEST(11) '" 6.0 C
CALL SUMC (XTEST, CTEST) 5170 IF (CTEST .LE. CTEMP) GO TO 5172 5171 IF OFEAS.EQ. 1) GO TO 5173
C**** THIS IS POINT E WHICH APPEARS IN FLOWCHART. FIG. 10. CBASE '" CTEST CTEMP ., CTEST DO 5 180 I = 1. N X (I) = XTEMP (I) XBASEO) '" XTEST(I)
5180 XTEMP(I) = XTEST(I) GO TO 5111
5173 DO 5174 I = 1,N X (I) = XTEST(I) XTEMP(I) '" XTEST(I)
5174 XBASE(I) = XTEST(I) GO TO 5176
c**** THIS IS POINT B WHICH APPEARS IN FLOWCHART, FIG. 10. 5146 DO 5147 I = 1,N
X( 1) = XTEMP (I) 5147 XBASE(I) '" XTEMP(I)
C**** THIS IS POINT F WHICH APPEARS .IN FLOWCHART, FIG. 10. 5176 CONTINUE
C C X = 7
X(1i) = 7.0
5

C CALL VAL (X, ZBASE) ZTEMP = ZBASE GO TO 111
5210 CONTINUE CTEMP I: CBASE DO 5216 I = 1,N
5216 XTEMP(I) I: XBASE(I) CFSCI I: CFSCI/3.0 IF(CFSCI .GE. 10.**(-6» GO TO 5111 WRITE(6,5270)
5270 FORMAT( 10X, 'NO FEASIBLE SOLUTION FOUND. PROBLEM ENDEO.' GO TO 8888
C**** THIS IS POINT 0 WHICH APPEARS IN FLOWCHART, FIG. 10. 5172 CONTINUE
CBASE I: CTEMP DO 5195 I I: 1,N X(I) I: XTEMP(I)
5195 XBASf(I) = XTEMP(I) GOT05111
C**** THIS IS POINT 111 WHICH APPEARS IN FLOWCHART, FIG. 11. 111 DO 112 I = 1, N
XTEMP(I) I: XBASE(I) 112 XTfST(I) I: XBASE(I)
ZTEMP = ZBASE 114 DO 115 I 1, N
XTEST(I) = XTEMP(I) + CFSC C C X = 8
C
C
XTEST( 11) = 8.0
CALL SUMS(XTEST, ZTEST) IF (ZTEST .GT. ZTEMP) GO TO 135 XTEST(I) = XTEMP(I) - CFSC
C X I: 9
C XTEST(11) = 9.0
CALL SUMS (XTEST, ZTEST) IF (ZTEST .LE. ZTEMP) GO TO 115
135 ZTEMP = ZTEST XTEMP(I) I: XTEST(I)
115 CONTINUE· C**** THIS IS POINT G WHICH APPEARS IN FLOWCHART, FIG. 12. C C X " 10
C
C
XTEMP(11) .. 10.0
CALL SUi\'IS(XTEMP. ZTEST) 145 IF (IFEAS .EO. 2) GO TO 146 150 IF( ZTEST .LE. ZBASE + 10.0 ** (-20» GO TO 149
ZTEMP II: ZTEST CASS '" CFSC ISTOP I: :2 ADAF = 1.0 DO 160 I .. 1.N
160 XTEST(I) I: XTEMP(I)*2. -Xli)
C X '" 11 XTEST(11) = 11.0
C-6

C CALL SUMS (XTEST, ZTEST)
170 IF( ZTEST .LE. ZTEMP + 10.0 ** (-20» GO TO 172 171 IF (IFEAS .EQ. 2) GO TO 173
ZBASE " ZTEST ZTEMP '" ZTEST ADAF '" 1.0 DO 180 I = 1.N X( I) = XTEMP( I)
180 XBASE(I) " XTEST(I) GO TO 111
173 CONTINUE GO TO 190
c**** THIS IS POINT K WHICH APPEARS IN FLOWCHART, FIG. 13. 172 CONTI NUE
C**** THIS IS POINT L WHICH APPEARS IN FLOWCHART, FIG. 13. 190 ZBASE c ZTEMP
DO 195 I c 1, N xCI) = XTEMP(I)
195 XBASE(I) = XTEMP(I) GO TO 111
151 CONTINUE GO TO 220
C**** THIS IS POINT H WHICH APPEARS IN FLOWCHART, FIG. 13. 146 ZTEMP '" ZBASE
DO 147 I ,. 1, N 147 XTEMP(I) " XBASE(I)
IF (KC .NE. 1) GO TO 151 148 CONTI NUE
C**** THIS IS POINT 210 WHICH APPEARS IN FLOWCHART, FIG. 14. 210 IF (ISTOP .EQ. 2) GO TO 409
c**** THIS IS POINT M WHICH APPEARS IN FLOWCHART. FIG. 14. 220 CFSC '" CFSC/3.0
IF (CFSC .GE. 10.**(-6» GO TO 231 C C X " 12
C
C
C
XTEMP(11) " 12.0
CALL SUMS (XTEMP, ZTEMP)
ISW '" ISW + 1 GO TO ( 40, 50, 60 ), ISW GO TO 8888
40 DO 42 ICX = 1, NC 42 A(ICX) " XTEMP(ICX)
CALL OUTPUT( XTEMP, ZTEMP, ISW ) GO TO 20
C
C
C
50 DO 52 ICX = 1, NC 52 A(ICX) ,. XTEMP(ICX)
CALL OUTPUT( XTEMP, ZTEMP, ISW GO TO 22
60 CALL OUTPUT( XTEMP, ZTEMP, ISW GO TO 22
c**** THIS IS POINT N WHICH APPEARS 149 CONTINUE
C**** THIS IS POINT oJ WHICH APPEARS
C-7
IN
IN
FLOWCHART,
FLOWCHART,
FIG. 13.
FIG. 13.

215 ZTEMP .. ZBASE DO 216 I ,. 1,N
216 XTEMP(I) .. XBASE(I) GO TO 220
231 CONTINUE GO TO 111
C**** THIS IS POINT 310 WHICH APPEARS IN FLOWCHART, FIG. 17. 310 CONTINUE 329 DO 330 I '" 1, N 330 XTEST(I) ,. XBASE(I) + AOAF*CASS*PARTH(I)
C C X '" 13
C XTEST(11) .. 13.0
CALL SUMS (XTEST, ZTEST) 350 GO TO (355. 380),IFEAS 355 CONTINUE 360 IF (ZTEST .GT. ZBASE) GO TO 370
IF (ADAF . LE. 1.1) GO TO 362 ADAF .. 1.0 GO TO 329
362 CONTINUE GO TO 381
380 CONTINUE AOAF .. 1.0
381 CASS '" CASS/3.0 385 IF (CASS .GT. 10.**(-6» GO TO 310 390 ISTOP .. 1
GO TO 215 370 ADAF .. ADAF + 1.0
ZBASE .. ZTEST ZTEMP .. ZTEST DO 375 I " 1, N xCI) .. XTEST(I) XBASE(I) ,. XTEST(I)
375 XTEMP(I) .. XBASE(I) GO TO 111
C**** THIS IS POINT P WHICH APPEARS IN FLOWCHART. FIG. 15. 409 DO 410 I .. '1. N
C
410 XCI) .. XBASE(I) CASS .. CFSC DO 426 I .. 1.N X(I) .. x(I) + 0
ex .. 14
C
C
X(11) .. 14.0
CALL VAL(X, Zp) CP .. C(LACT) XCI) .. X(I) - 2.0 * 0
C X .. 15
C X(11) .. 15.0
CALL VAL(X, ZM) CM .. C(LACT)
422 PARTZ(I) .. (ZP-ZM) PARTH(I) .. (CP-CM) xCI) =XBASE(I)
426 CONTINUE

DENOM .. 0.0 DO 430 I '" 1. N
430 DENOM .. DENOM + PARTZ(I)**2 DENOM .. DSQRT(DENOM) IF (DENOM .LT. 10.**(-6» DENOM '" 10.**(-6') IF( DENOM .EQ. 0.0 ) DENOM .. 10.0 ** (-6) DO 440 I '" 1.N PARTZ(I) .. PARTZ(I)!DENOM
440 CONTINUE • C**** THIS IS POINT Q WHICH APPEARS IN FLOWCHART. FIG. 16.
DENOM .. 0.0 DO 460 I .. 1, N
460 DENOM .. DENOM + PARTH(I)**2 DENOM =DSQRT(DENOM) IF( DENOM .EQ. 0.0 ) DENOM 10.0 ** (-6) DO 470 I .. 1, N
470 PARTH(I) .. PARTH(I)!DENOM DENOM '" 0.0 DO 480 I .. 1. N PARTH(I) '" PARTH(I) + PARTZ(I)
480 DENOM .. DENOM ... PARTH(I)**2 DENOM =DSQRT(OENOM) IF (DENOM .LT. 10.**(-6» DENOM .. 10.**(-6) IF( DENOM .EQ. 0.0 ) DENOM .. 10.0 ** (-6) DO 490 I .. 1. N
490 PARTH(I) .. PARTH(I)!DENOM IF (DENOM .GT. 0.03) GO TO 310 ISTOP .. 1 GO TO 111
8888 CONTINUE GO TO 20
9999 CONTI NUE RETURN END
SUBROUTINE SUMS(X, Z) IMPLICIT REAL*8 (A-H, O-Z)
C**** THIS SUBROUTINE APPEARS IN FLOWCHART, FIG. 4. DIMENSION X(11) COMMON KC, IFEAS, C(10). ISTOP. LACT, CFSC,CASS.ADAF, M, N CALL VAL(X. Z) KC " 0 IFEAS .. 1 IF (M . LT. 1) GO TO 11 DO 10 I .. 1. M IF (C(I) .GE. 0.0) GO TO 10
40 IFEAS .. 2 LACT .. I
50 KC .. KC + 10 CONTINUE 11 CONTINUE
RETURN END
q-9

SUBROUTINE SUMC(X, CON) IMPLICIT REAL*B (A-H, O-Z)
C**** THIS SUBROUTINE APPEARS IN FLOWCHART, FIG. 5. OIMENSION X( 11) COMMON KC, IFEAS, C(10), ISTOP. LACT, CFSC, CASS, AOAF, M, N CALL VAL (X. Z) CON" 0.0 IFEAS .. 1 DO 10 I = 1, M IF(C(I) .GE. 0.0) GO TO 9 IFEAS :: 2 CON'" CON + C(l)
9 CONTINUE 10 CONTINUE 11 CONTINUE
RETURN END
SUBROUTINE OUTPUT ( X, Z, ISW ) IMPLICIT REAL*B (A-H, O-Z)
C**** THIS SUBROUTINE APPEARS IN FLOWCHART, FIG. 6.
C
C
C
COMMON IVALUESI VLO(5), VHI(5), A(4). AO, NC COMMON IERRI ER COMMON KC, IFEAS. C(10), ISTOP, LACT, CFSC, CASS, ADAF, M, N DIMENSION X(11), EX(11)
EX(1) :: 4.0 * X(1) - 2.0 EX(2) :: 125.6 * X(2) EX(3) = X(3) EX(4) .. B.O * X(4) WRITE (6,600)
600 FORMAT ( I I, 10X, 'SOLUTION', I I ) WRITE (6,700) (EX(I), I :: 1,NC)
700 FORMAT ( 10X, 'FINAL VALUES', I, 10X. 'PI F10.6,3X, 1 'TRB ',F10.6, 3X, 'ev ',F10.6, 3X, 'DF ',F10.6, I )
WRITE (6,720) ER 720 FORMAT ( I, 10X, 'ERROR
RETURN END
SUBROUTINE VAL(X, Z) IMPLICIT REAL*B (A-H, O-Z)
',F10.6, 5(/)
COMMON KC, IFEAS, C(10), ISTOP, LACT, CFSC, CASSo ADAF, M. N COMMON IVALUESI VLO(5), VHI(5) , A(4). AO, NC COMMON IERR/ ER DIMENSION X(11), EX(4) EX(1) = 4.0 * X(1) - 2.0 EX(2) .. 125.6 * X(2) EX(3) .. X(3) EX(4) B.O * X(4) uSW c 0
DO 200 I :: 1, M
..
C-IO

CO) = 0.01 IF(EX(I) .LT. VLO(I) C(l) -1.0 IF(EX(I) .GT. VHI(I) C(I) = -1.0 IF (C(I).LT.O.O) JSW 1
200 CONTI NUE IF (JSW.EQ.1) RETURN ER '" -1.163 + ( AO * X(1) ** 0.257 * X(2) ** 0.122 *
1 X(3) ** 24.50 * X(4) ** (-0.410) ) Z = ER * ER Z .. -z RETURN END
SUBROUTINE INPUT (LAST) IMPLICIT REAL*B (A-H. O-Z) COMMON /VALUES/ VLO(5). VHI(5), A(4). AO. NC NC .. 4 RE.AD (5,5oo.END=50) PI,TRB.CV,DF
500 FORMAT (4F10.0) A(1) 0.25 * (PI + 2.0) A(2) = TR8/125.' A(3) = CV A(4) = DF/B.O VLO ( 1 ) -1 .00 VHI (1).. 2.00 VLO(2) = 100.40 VHI(2) 125.60 VLO(3.) 0.85 VHI(3)" 0.90 VLO(4) 2.00 VHI(4)" B.OO WRITE (6. GOO)
600 FORMAT ( 1H1, 14(/), 10X, 'PATTERN SEARCH PROGRAM'. 3(/). 1 10X, 'INPUT DATA', / / )
READ (5,520) T. SA, TM 520 FORMAT (3F10.0)
WRITE (G,G20) T, SA, TM G20 FORMAT ( 10X, 'T " F10.G, 3X, 'SA F10.G,
1 3X, 'TM ',F 10 . 6. / / ) T1 .. T / 10.0 SA1 = SA / 240.0 TM1 = (TM + 20.0) / 55.70 AO .. 0.519 * T1 ** 1.GG * SA1 ** 1.97 * TM1 ** (-7.43) WRITE (G,BOO) PI,TR8,CV,DF
800 FORMAT ( 10X. 'INITIAL VALUES', /. 1 10X. 'PI '. F10.G. 3X, 'TRB ',F10.6. 2 3X, 'CV I, F10.G. 3X, 'OF ',F10.6)
WRITE (6.700) 700 FORMAT ( //, 10X, 'BOUNDS ON PI, TRB, CV, AND DF', // )
WRITE (6.B10) (VLO(I). 1= 1, NC) 810 FORMAT ( i0X, 'LOWER LIMITS', /,
1 10X, 'PI ',F10.G, 3X, 'TRB ',F10.G, 2 3X, 'CV ',F10.G, 3X, 'DF • F10.G )
WRITE (G,820) ( VHI(I). I .. 1, NC ) 820 FORMAT ( /,10X, 'HIGHER LIMITS', /,
1 10X, 'PI '. F10.G, 3X, 'TR8 ',F10.G. 2 ax. 'cv ',F10.G, 3X. 'OF '. Fi0.G, /
·C:":'fli , ).

RETURN 50 LAST = 1
RETURN END
C-12

APPENDIX D
Results of Computations in Michigan and Texas Using Program THERMI
D-l

TABLE 0-1. Computation of CMDGI Using Thennal Cracking Program for Mi chi gan .,. Area 1 (Marquette)
The Average Annual Solar Radiation, SR = 330.0 Langleys/day. Th.e Average Annual Amplitude of Solar Radiation, SA = 240.0 Langleys/day. Tne Minimum Monthly Temperature, MMT = 9.8 0 F.
- -Penetration Softening Volumetric Pavement Number Crack
Index Point Concentration Thickness of Length P. I. Ring & Ball of the OF Years iy
Temperature Aggregate (i n) c
TR + B Cv (i n)
(oF)
2.00 125.6 0.85 2.0 4.000 0.4550
8.000 1.4045
0.90 5.581 2.00
8.000 -100.4 0.85 4.000 0.9931
8.000 1.0315
0.90 4.000 1. 0170
8.000· 1.0645
125.6 0.85 5.0 4.000 0.4822
8.000 1.4208
0.90 6.573 5.00
8.000 -100.4 0.85 4.000 0.9655
8.000 1.0296
0.90 4.000 1.0039
8.000 1.0410
125.6 0.85 8.0 4.000 0.4668
8.000 1.3116
i 0.90 7.435 8.0
8.000 -
0-2
CMDGI
0.4863
0.8528
0.9275
1. 2127
0.7409
0.7525
0.7495
0.7585
0.3475
0.5814
0.6803
0.7765
0.5146
0.5150
0.5176
0.5265
O~24371
0.4098
0.5260
0.5360

TABLE D-1. Computation of CMDG1 Using Thermal Cracking Program for Michigan - Area 1 (Marquette) - continued
The Average Annual Solar Radiation, SR = 330.0 Langleys/day. The Average Annual Amplitude of Solar Radiation, SA = 240.0 Langleys/day. The Minimum Monthly Temperature, MMT = 9.8 ° F.
Penetration Softening Volumetric Pavement Number Crack Index Point Concentration Thickness of ~ength P .t. Ri ng & Ball of the OF Years 'Y
Temperature Aggregate (in) c
TR + B Cv (i n)
(oF)
100.4 0.85 4.000 0.8775
8.000 1.0024
0.90 4.000 1. 0122
8.000 '1.0456
-1.0 125.6 0.85 2.0 5.473 2.00
8.000 -
0.90 3.595 2.00
8.000' -1QO.4 0.85 7.435 2.00
8.000 -0.90 4.622 2.00
8.000 -
125.6 0.85 5.0 5.565 5.00
8.000 -
0.90 4.511 5.00
8.000 -100.4 0.85 4.000 1.0
8.000 1. 9673
0.90 6.598 5.00
8.000 -
D-3
CMDG1
0.3673
0.3900
10.3892
0.3951
0.9369
2.0199
0.9455
2 .. 7909
0.9528
0.9532
0.9499
1.2422
0.7902
1.4827
0.7287
1.9238
0.5175
0.6709
0.8059
0.8488

TABLE 0-1. Computation of CMOGI Using Thennal Cracking Program for Michigan - Area 1 (Marguette) - continued
The Average Annual Solar Radiation, SR = 330.0 Langleys/day. The Average Annual Amplitude of Solar Radiation, SA = 240.0 Langleys/day. The Minimum Monthly Temperature, MMT = 9.8 ° F.
Penetration Softening Volumetric Pavement Number ~rack Index Point Concentration Thickness of ~ength P.1. Ring & Ba11 of the DF Years IV
Temperature Aggregate (i n) . c
(i n) TR + B Cv
(oF)
125.6 0.85 8.0 6.513 8.000
8.000 -0.90 4.559 8.000
8.000 -100.4 0.85 4.000 1.0028
8.000 1.8109
0.90 4.000 1,1897
8.000 , 4.4956
0.0 125.6 0.85 2.0 6.573 2.0
8.000 -0.90 4.589 2.0
8.000 -100.4 0.85 4.00 1.0020'
8.000 1.2056
0.90 4.00 1.0074
8.000 1.8687
125.6 0.85 5.0 7.435 5.0
8.000 -0.90 4.658 I 5.0
8.00 -
0-4
CMOGI
10.6360
1.0200
p.5541
1. 3416
10.3933
p.5021
~.4185
~~6043
0.9507
11. 1963
0.9256
1.8873
0.7332
0.7929
0.7554
p.9280
0.8016
p.8329
0.7157
1.3300

TABLE 0-1. Computation of CMDG1 Using Thennal Cracking Program for Michigan - Area 1 (Marguette) - continued
The Average Annual Solar Radiation, SR =330.0 Langleys/day. The Average Annual Amplitude of Solar Radiation, SA =240.0 Langleys/day. THe Mi nimum Monthly Temperature, MMT = 9.8 ° F .
Penetration Softening Volumetric Pavement Number ~rack Index Point Concentration Thickness of ~ength P. I. Ring & Ball of the DF Years 'Y
Temperature Aggregate ( in) c (in)
TR + B Cv (oF)
100.4 0.85 4.00 1. 0329
8.00 1.2339
0.90 4.00 1.0820
8.00 1.9438
125.6 0.85 8.0 4.00 0.5999
8.00 5.0709
0.90 5.604 8.0
8.00 -100.4 0.85 .00 1.0390
8.00 1. 2322
0.90 4.00 1.0308
8.00 1.7453
D-5
CMOGI
0.5233
0.5681
0.5296
0.6538
0.2883
0.5887
0.5496
0!8990
0.4008
p.4340
p.3934
p.4812

TABLE 0-2. Computation of CMOGI Using Thennal Cracking Program for Michigan - Area 2 (Sault Ste. Marie)
The Average Annual Solar Radiation, SR = 283.0 Langleys/day. The Average Annual Amplitude of Solar Radiation, SA = 215.2 Langleys/day. THe Minimum Monthly Temperature, MMT = 6.40 0 F.
Penetration Softening Volumetric Pavement Number Crack Index Point Concentration Thickness of ~ength P. I. Ri ng & Ball of the DF Years )Y
Temperature Aggregate (in) . c
(i n) TR + B C v
(oF)
2.00 125.6 0.85 2.0 3.573 2.0
8.00 -
0.90 4.565 2.0
8.00 -
100.4 0.85 4.00 1.0832
8.00 1.4089
0.90 4.622 2.0
8.00 -
125.6 0.85 5.0 5.532 5.0
8.00 -
0.90 4.640 5.0
8.00 -100.4 0.85 4.00 1.1297
8.00 1.2940
0.90 4.00 1.2814
8.00 3.2350
125.6 0.85 8.0 6.641 8.0
8.00 .-
0.90 5.519 8.0
8.00 -
D-6
CMOGl
0.9512
1. 6622
0.9467
2.1009
0.7663
0.8429
0.9659
1. 0582
0.7846
1.1020
0.6970
1. 3891
0.5410
0.5745
0.5736
0.7290
0.6324
0.7244
0.5395
0.9572

TABLE D-2. Computation of CMDGI Using Thennal Cracking Program for Michigan - A~ea 2 (Sault Ste. Marie) - continued
The Average Annual Solar Radiation, SR = 283.0 Langleys/day. The Average Annual Amplitude of Solar Radiation, SA = 215.2 Langleys/day. THe Minimum Monthly Temperature, MMT = 6.40 f!j F .
Penetration Softening Volumetric Pavement Number Crack Index Point Concentration Thickness of ,Length P.1. Ri n9 & Ball of the DF Years Yc Temperature Aggregate (in) (i n)
TR + B Cv (oF)
100.4 0.85 4.00 1.0443
8.00 1.1449
0.90 4.00 1.3040
8.00 2.8706
-1.0 125.6 0.85 2.0 2.638 2.00
8.000 -0.90 2.683 2.00
8.000
100.4 0.85 .2.522
8.000 -
0.90 2.632 2.00
8.000 -
125.6 0,85 5.0 2.699 5.00
8.00 -
0.90 3.417 5.00
8.00 -100.4 0.85 3;573 5.00
8.00 -0.90 3.522 5.00
8.00 -
D-7
. CMOG1
b.4018
b.4200
b.4357
b.5405
b.9891
~.9194
p.9630
~.6364
P.9623
D.3853
b.9858
2.7921
p.8146
~.7352
p.7366
~.4913
b.8530
1.5576
p.8063
1.8744

TABLE D-2. Computation of CMDG1 Using Thermal Cracking Program for Michigan - Area 2 (Sault Ste. Marie) - continued
The Average Annual Solar Radiation, SR = 283.0 Langleys/day. The Average Annual Amplitude of Solar Radiation, SA =215.2 Langleys/day. THe Minimum Monthly Temperature, MMT = 6.40 0
Penetration Softening Volumetric Pavement Number Crack Index Point Concentration Thickness of ~ength P.l. Ring & Ball of the DF Years f Y
c Temperature Aggregate (in) (i n) TR + B Cv
(oF)
125.6 0.85 8.0 3.575 8.00
8.00 -0.90 3.613 8.00
8.00 -100.4 0.85 4.622 8.00
8.00 -0.90 4.522 8.00
8.00 -"
0.0 125.6 0.85 2.0 2.609 2.0
8.00 -0.90 3.604 2.0
8.00 -100.4 0.85 2.618 2.0
8.00 -0.90 2.644 2.0
8.00 -
125.6 0.85 5 .. 0 3.527 5.0
8.00 -0.90 3.696 5.0
8.00 -
0-8
CMDG1
0.6649
.9439
0.5832
.7334
0.7235
.1052
0.6645
1.3550
0.9870
3.1955
p.9424
~.9520
0.9671
.5526
0.9779
.9637
0.8003
~. G923
0.7263
~. 0072

TABLE 0-2. Computation of CMDGl Using Thennal Cracking Program for Michigan - Area 2 (Sault Ste. Marie) - continued
The Average Annual Solar Radiation, SR = 283.0 Langleys/day. The Average Annual Amplitude of Solar Radiation, SA = 215.2 Langleys/day. THe Minimum Monthly Temperature, MMT = 6.40 0 F •
Penetration Softening Volumetric Pavement Number ~rack Index Point Concentration Thickness of ~ength P. I. Ri ng & Ball of the DF Years 1 Yc Temperature Aggregate ( in) (i n)
TR + B Cv (oF)
100.4 0.85 4.622 5.0
8.00 -0.90 4.562 5.0
8.00 -125.6 0.85 8.0 4.524 8.0
8.00 -0.90 4.505 8.0
8.00 -100.4 0.85 6.641 8.0
8.00 -0.90 5.532 8.0
8.00 -
D-9
CMDGI
0.8612
1.0427
0.8123
1.3376
0.6496
1.4470
0.5575
1.4326
0.7178 .
0.7446
0.6798
0.9459

TABLE 0-3. Computation of CMDG1 Using Thennal Cracking Program for Michigan ~ Area 3 (HonghtQn)
The Average Annual Solar Radiation, SR = 272.0 Langleys/day. The Average Annual Amplitude of Solar Radiation, SA = 226.2 Langleys/day. THe Minimum Monthly Temperature, MMT = 7.1 0 F.
-Penetration Softening Volumetric Pavement Number Crack
Index Point Concentration Thickness of ~ength P.1. Ri n9 & Ball of the DF Years i Y
c Temperature Aggregate (in) ( in) TR + B Cv
(oF)
2.0 125.6 0.85 2.0 4.5565 2.00
8.00 -0.90 4.5215 2.00 -
8.00 -100.4 0.85 4.00 1.022
8.00 1.033
0.90 6.6034 2.00
8.00 -125.6 0.85 5.0 5.5806 5.00
8.00 -0.90 5.4866 S.OO
8.00 -100.4 0.85 4.00 1.0253
8AOO 1.0339
0.90 4.00 1.280
8.00 1.6237
125.6 . 0.85 8AO 6.6063 8.00
8.00 -0.90 5.5511 8.00
8.00 -
D-10
CMDG1
10.9354
11.6041
10.9071
1.9566
10.7580
~L 7596
p.8931
p.9008
10.8006
1.0358
0.7213
1.230
0.5234
b.5258
0.5716
0.6236
0.6357
0.7035
0.5576
0.8321

TABLE 0-3. Computation of CMDGI Using Thermal Cracking Program for Michigan - Area 3 (Honghton) - continued
The Average Annual Solar Radiation, SR ="272.0 Langleys/day. The Average Annual Amplitude of Solar Radiation, SA = 226.2 Langleys/day. THe Minimum Monthly Temperature, MMT = 7.1 OF.
. Penetration Softening Volumetric Pavement Number Crack
Index Point Concentration Thickness of ~ength P.1. Ri ng & Ball of the DF Years I Yc Temperature Aggregate ( in) (in)
TR + B Cv (oF)
100.4 0.85 4.00 1.006
8.00 1.016
0.90 4.00 1.1564
- 8.00 ~1. 3768
-1.0 125.6 0.85 2.0 2.652 2.0
8.00 -0.90 2.669 2.0
8.00 -100.4 0.85 3.481 2.0
8.00 -0.90 2.0
8.00 -125.6 0.85 5.0 3.462 5.0
8.00 -0.90 3.497 5.0
8.00 -100.4 0.85 4.565 5.0
8.00 -
0.90 4.479 5.0
8.00 -
D-ll
CMOGl
0.3967
0.3987
0.4166
0.4467
p.9867
3.6729
0.9628
3.8025
0.9561
2.1605
0.9616
2.4048
0.8047
2.5164
0.7412
2.4883
0.8695
1.3628
0.8155
1.5946
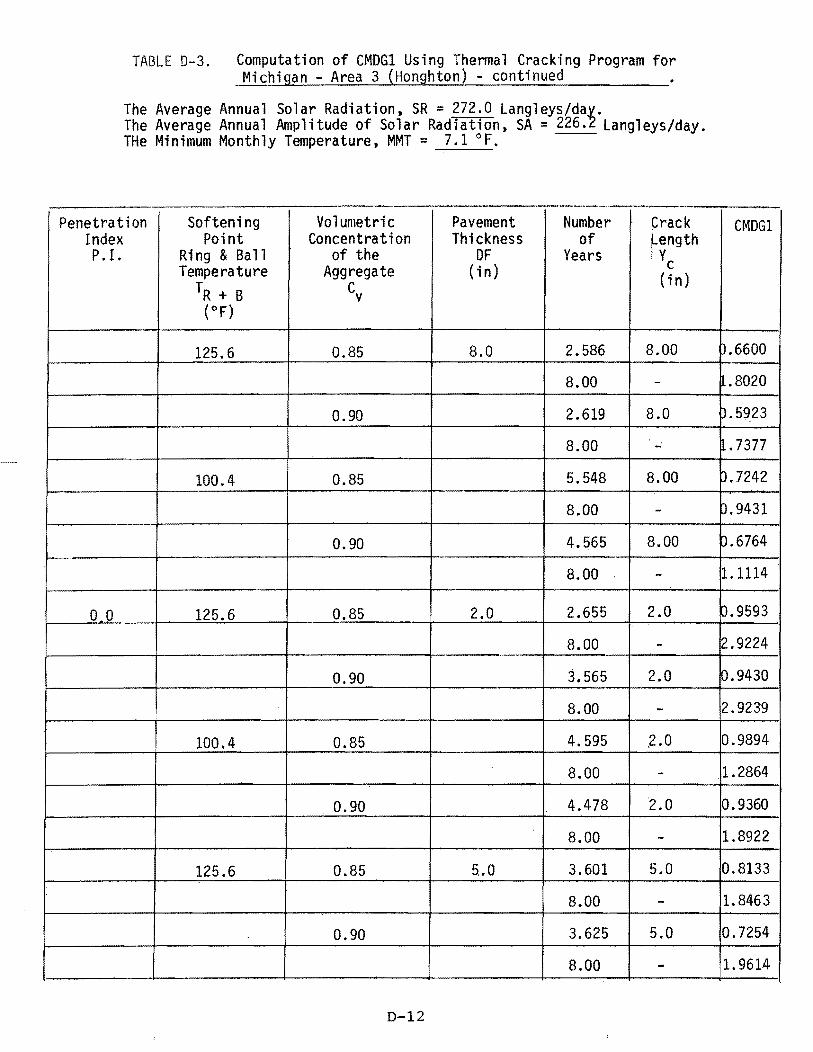
TABLE D-3. Computation of CMDGI Using Thenna 1 Crack'j ng Program for Michigan - Area 3 (Honghton) - continued
The Average Annual Solar Radiation, SR = 272.0 Langleys/day. The Average Annual Amplitude of Solar Radiation~ SA = 226.2 Langleys/day. THe Minimum Monthly Temperature, MMT = 7.1°F.
Penetration Softening Volumetric Pavement Number Crack Index Point Concentration Thickness of ~ength P.1. Ring & Ball of the DF Years iy
Temperature Aggregate (i n) c
TR + B Cv (i n)
(oF)
125.6 0.85 8.0 2.586 8.00
8.00 -0.90 2.619 8.0
8.00 -' 100.4 0.85 5.548 8.00
8.00 -0.90 4.565 8.00
8.00 -
o 0 125.6 0.85 2.0 2.655 2.0
8.00 -0.90 :1.565 2.0
8.00 -100.4 0.85 4.595 ,2.0
8.00 -0.90 4.478 2.0
8.00 -125.6 0.85 5 .. 0 3.601 5.0
8.00 -
0.90 3.625 5.0
8.00 -
D-12
CMDG1
).6600
.8020
~. 59,23
~. 7377
p.7242
p.9431
p.6764
1.1114
0.9593
2.9224
p.9430
2.9239
0.9894
,1. 2864
0.9360
1.8922
0.8133
1.8463
0.7254
1. 9614

TABLE D-3. Computation of CMDG1 Using Thermal Cracking Program for Michigan - Area 3 (Houghton) - continued
The Average Annual Solar Radiation, SR = 272.0 Langleys/day. The Average Annual Amplitude of Solar Radiation, SA = 226.2 Langleys/day. THe Minimum Monthly Temperature, MMT = 7.1 0 F.
Penetration Softening Volumetric Pavement Number Crack Index Point Concentration Thickness of ~ength P. I- Ring & Ball of the DF Years i Yc Temperature Aggregate (i n) (in)
TR + B Cv (OF)
100.4 0.85 4.00 1. 3267
8.00 4.0279
0.90 4.622 5.0
8.00 -125.6 0.85 8.0 4.559 8.0
8.00 -0.90 4.408 8 . .0
8.00 -100.4 0.85 4.00 1.2818
8.00 3.1911
0.90 5.589 8.0
8.00 -
D-13
CMDGl
0.5811
0.8251
0.8287
1. 2100
0.6558
1. 2469
0.5685
1.3776
0.4406
0.6003
0.6821
0.8369

TABLE D-4. Computation of CMDGl Using Thennal Cracking Program for Michigan - Area 4 (Grand Rapids)
The Average Annual Solar Radiation, SR = 308.0 Langleys/day. The Average Annual Amplitude of Solar Radiation, SA = 222.8 Langleys/day. THe Minimum Monthly Temperature, MMT = 16.0 of.
Penetration Soften1ng Volumetric Pavement Number Crack Index Point Concentration Thickness of ~ength P. I. Ri ng & Ball of the Of Years 'Y
Temperature Aggregate (in) . c
(i n) TR + B Cv
(oF)
2.0 125.6 0.85 2.0 4.00 0.5271
8.00 1.3285
0.90 4.625 2.0
8.00 -
100.4 0.85 4.00 0.9348
8.00 1.0016
0.90 4.00 1.0218
8.00 1.0592
125.6 0.85 5.0 4.00 0.5120
8.00 1. 3074
0.90 6.609 5.0
8.00 -100.4 0.85 4.00 0.9486
8.00 1.0147
0.90 4.00 1.0027
8.00 1.0337
125.6 0.85 8.0 4.00 0.4701
8.00 1.2262
0.90 4.00 0.7510
8.00 6.0045
D-14
CMDGl
0.5512
0.8503
0.9259
1.226
0.7250
0.7467
0.7636
0.7714
0.3586
0.5639
0.6874
0.7678
0.4998
0.5147
0.5108
0.5181
0.2432
0.3996
0.2987
0.5095

TABLE 0-4. Computation of CMOG1 Using Thermal Cracking Program for Michigan - Area 4 (Grand Rapids) - continued
The Average Annual Solar Radiation, SR ::: 308.0 Langleys/day. The Average Annual Amplitude of Solar Radiation, SA::: 222.8 Langleys/day. THe Minimum Monthly Temperature, MMT ::: 16.0 of •
Penetration Softening Volumetric Pavement Number ~rack Index Point Concentration Thickness of ~ength P.1. Ring & Ball of the OF Years 1\
Temperature Aggregate (in) (i n) TR + B Cv
(oF)
100.4 0.85 4.00 0.8188
8.00 1.0093
0.90 4.00 1.0015
8.00 1.0290
-1.0 125.6 0.85 2.0 4.562 2.0
8.00 -0.90 4.508 2.0
8.00 -100.4 0.85 4.00 1.0091
8.00 1. 7023
0.90 5.551 2.0
8.00 -125.6 0.85 5.0 5.546 5.0
8.00 -0.90 4.667 5.0
8.00 -100.4 0.85 4.00 1.0132
8.00 1.5052
0.90 4.00 1.0553
8.QO 4.1327
0-15
CMOG1
b.3556
b.3925
b.3835
b.3884
p.9528
.8039
b.9133
.9596
P.7424
b.9533
b.9538
.1858
).7876
.1839
).7257
.3.075
).5110
).6277
).5251
0.7867

TABLE 0-4. Computation of CMDG1 Using Thermal Cracking Program for ~1ichigan - Area 4 (Grand Rapids) - continued
The Average Annual Solar Radiation, SR = 308.0 Langleys/day. The Average Annual Amplitude of Solar Radiation~ SA = 222.8 Langleys/day. THe Min'imum Monthly Temperature, MMT = 16.0 of.
Penetration Softening Volumetric Pavement Number Crack Index Point Concentration Thickness of ~ength P.1. Ring & Ball of the DF Years i\
Temperature Aggregate (in) (i n) TR + B Cv
(oF)
125.6 0.85 8.0 6.601 8.0
8.00 -0.90 5.487 8.0
B.OO -
100.4 0.85 4.00 1.0079
8.00 1.4940
0.90 4.00 1.0597
8.00 3.3128
0.0 125.6 0.85 2.0 6.513 2.0
8.00 -0.90 4.595 2.0
8.00 -,
100.4 0.85 4.00 1.0005 ..
8.00 1.1323
0.90 4.00 1.0110
8.00 1. 5786
125.6 0.85 5.0 7.634 5.0
8.00 -0.90 5.524 5.0
8.00 -
0-16
CMOGl
0.6365
0.7772
0.5563
0.9072
0.3913
0.4670
0.3966
0.5705
0.9480
1.2034
0.9439
1.5558
0.7441
0.7855
0.7486
0.9069
0.7935
0.7936
0.7182
1.0462

TABLE D~4. Computation of CMDG1 Using Thermal Cracking Program for Michigan - Area 4 (Grand Rapids) - continued
The Average Annual Solar Radiation, SR = 308.0 Langleys/day. The Average Annual Amplitude of Solar Radiations SA = 222.8 Langleys/day. THe Minimum Monthly Temperature, MMT = 16.0 of.
Penetration Softeni ng Volumetric Pavement Number Crack Index Point Concentration Thickness of ~ength P. I. Ri ng & Ball of the DF Years i Y
c Temperature Aggregate (in) ( in) TR + B Cv
(oF)
100.4 0.85 4.00 1.0108
8.00 1.1347
0.90 4.00 1.0172
8.00 1.5147
125.6 0.85 8.0 4.00 0.5511
8.00 3.6576
0.90 5.573 8.0
8.00 -100.4 0.85 4.00 1.0014
8.00 1.1203
0.90 4.00 1.0120
8.00 1.3998
0-17
CMDG1
0.5110
0.5408
0.5181
0.6104
0.2708
0 .. 5549
0.5434
0.7516
0.3900 .
0.4118
0.3878
0.4459

TABLE 0-5. Computation of CMDGI Using Thennal Cracking Program for Amari 11 0
The Average Annual Solar Radiation, SR = 450.0 Langleysjday. The Average Annual Amplitude of Solar Radiation, SA = 199.1 Langleysjday. THe Minimum Monthly Temperature, MMT = 22.5 of.
Penetration Softening Volumetric Pavement Number Crack Index Point Concentration Thickness of ~ength P. I. Ring & Ball of the DF Years ; Y c
Temperature Aggregate (in) (i n) TR + B Cv
(0 F)
2.0 125.6 0.85 2.0 4.00 0.2197
8.00 0.2583
0.90 4.00 0.2954
8.00 1.0243
100.4 0.85 4.00 0.2382
8.00 0.5233
0.90 4.00 0.3133
8.00 1. 0195
125.6 0.85 5.0 4.00 0.2206
8.00 0.2661
0.90 4.00 0.3125
8.00 1.0305
100.4 0.85 4.00 0.2420
8.00 0.5428
0.90 4.00 0.3155
8.00 1.0240
125.6 0.85 8 .. 0 4.00 0.2193
8.00 0.2-587
0.90 4.00 0.2873
8.00 1.0094
D-18
CMDGI
0.0774
).2053
).3338
).7981
).1097
).5242
).2889
).7784
).05284
p.1431
p.2165
p.4886
).07878
).3592
).1950
).5229
).0357
).0938
p.1270
p.3271
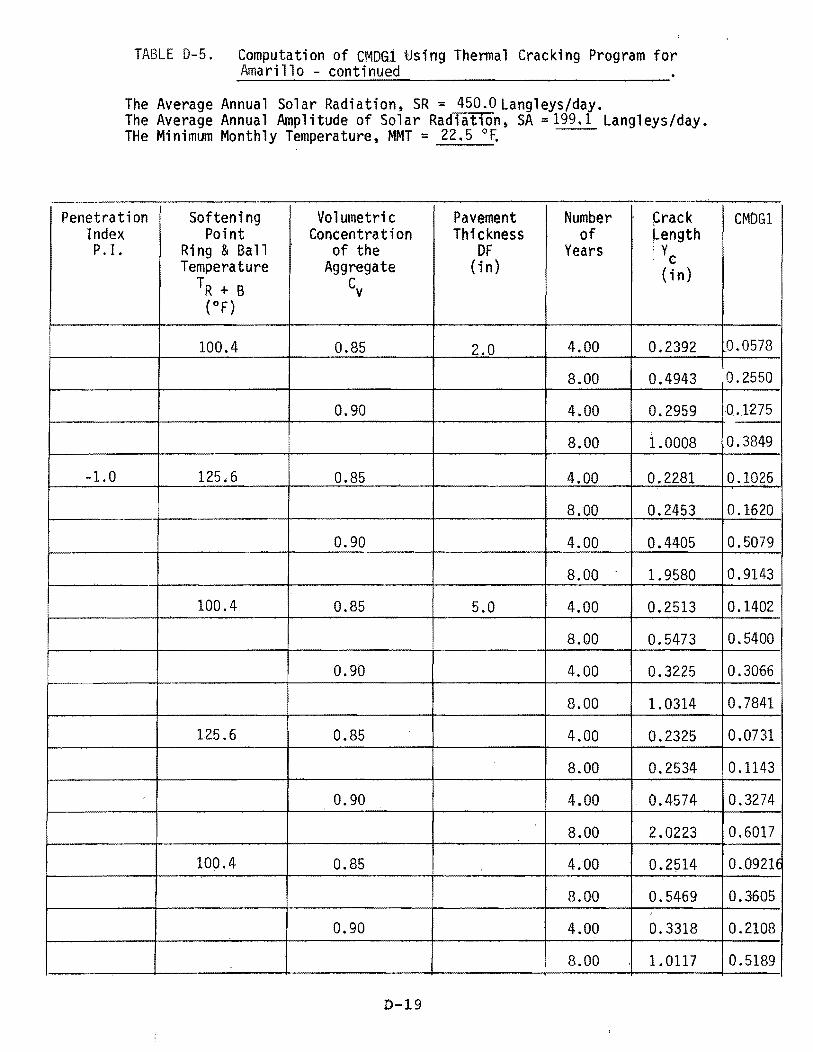
TABLE D-5. Computation of CMDG1 'Using Thennal Cracking Program for Amari 110 - continued
The Average Annual Solar Radiation, SR = 450.0 Langleys/day. The Average Annual Amplitude of Solar Radiation, SA = 199.1 Langleys/day. THe Minimum Monthly Temperature, MMT = 22.5 of.
Penetration Softening Volumetric Pavement Number Crack Index Point Concentration Thickness of ~ength P.1. Ring & Ball of the DF Years iY
Temperature Aggregate {i n} . c
(i n) TR + B Cv
(oF)
100.4 0.85 2.0 4.00 0.2392
8.00 0.4943
0.90 4.00 0.2959
8.00 1.0008
-1.0 125.6 0.85 4.00 0.2281
8.00 0.2453
0.90 4.00 0.4405
8.00 1.9580
100.4 0.85 5.0 4.00 0.2513
8.00 0.5473
0.90. 4.00 0.3225
8.00 1.0314
125.6 0.85 4.00 0.2325
8.00 0.2534
0.90 4.00 I 0.4574
8.00 2.0223
100.4 0.85 4.00 0.2514
8.00 0..5469
0.90 4.00 0.3318
8.00 1.0117
D-19
CMDG1
0.0578
0.2550
0. • .1275
0.3849
0.1026
0..1620
0.5079
0.9143
0.1402
0.5400
0.3066
0.7841
10.0731
0.1143
0.3274
0.6017
o .. 0921E
0.3605
0.2108
0.5189

TABLE 0-5. Computation of CMDG1 Using Thennal Cracking Program for Amari 11 0 - conti n.ued
The Average Annual Solar Radiation, SR = 450.0 Langleys/day. The Average Annual Amplitude of Solar Radiation, SA = 199.1 Langleys/day. THe Minimum Monthly Temperature, MMT = 22.5 of.
Penetration Softening Volumetric Pavement Number Crack Index Point Concentration Thickness of ~ength P. I. Ring & Ball of the OF Years fy
Temperature Aggregate ( in) c
TR + B Cv (i n)
(oF)
125.6 0.85 8.0 4.00 0.2291
8.00 0.2446
0.90 4.00 0.3908
8.00 1.4096
100.4 0.85 4.00 0.2447
8.00 0.4792
0.90 4.00 0.3152
8.00 1.0042
0.0 125.6 0.85 2.0 4.00 0.2215
8.00 0.2432
0.90 4.00 0.3375
8.00 1.0909
100.4 0.85 4.00 0.2431
8.00 0.5245
0.90 4.00 0.3174
8.00 1. 0559
125.6 0.85 5.0 4.00 0.2239
8.00 0.2496
0.90 4.00 0.3593
8.00 1.2751
D-20
CMDG1
0.04967
0.07279
0.2003
0.3752
0.0639
0.2468
0.1452
0,3851
0.0848
0.1620
(J. 4031
0.7917
p.1220
p.5241
0.2973
0.7917
0.05882
0.1121
0.2601
0.5233

TABLE 0-5. Computation of CMDG1 Using Thermal Cracking Program for Amari 11 0 - conti nued
The Average Annual Solar Radiation, SR = 450.0 Langleys/day. The Average Annual Amplitude of Solar Radiation, SA = 199.1 Langleys/day. THe Minimum Monthly Temperature, MMT = 22.5 of.
--
Penetration Softening Volumetric Pavement Number ~rack Index Point Concentration Thickness of ~ength P.1. Ri ng & Ball of the OF Years j Y
c Temperature Aggregate (i n) ( in) TR + B C v
( oF)
100.4 0.85 4.00 0.2461
8.00 0.5374
0.90 4.00 0.3225
8.00 1.010
125.6 0.85 8.0 4.00 0.2218
8.00 0.2422
0.90 4.00 0.3166
8.00 - 0.9426
100.4 0.85 4.00 0.2415
8.00 0.4890 ,
0.90 4.00 0.3079
8.00 1.0138
,
D-21
CMDG1
0.0843,
0.3557
0.2019
0.5202
0.0394E
- 0.a71l~
0.1517
0.3177
0.0602
0.2520
0.1390
0.3879

TABLE D-6. Computation of CMOG1 Using Thennal Cracking Program for Abilene
The Average Annual Solar Radiation, SR = 422.0 Langleys/day. The Average Annual Amplitude of Solar Radiation, SA = 177.5 Langleys/day. THe Minimum Monthly Temperature, MMT = 31. 7 OF.
Penetration Softening Volumetric Pavement Number Crack Index Point Concentration Thickness of ~ength P. I. Ri ng & Ball of the OF Years ' V c
Temperature Aggregate (in) (in) TR + B Cv
(oF)
2.0 125.6 0.85 2.0 6.0 0.2005
12.n 0.2008
0.90 6.0 0.2409
12.0 0.3630
100.4 0.85 6.0 0.2103
12 .. 0 0.2122
0.90 6.0 0.2492
12.0 0.2966
125.6 0.85 5.0 6.0 0.2016
12.0 0.2031
0.90 6.0 0.2461
12.0 0.4314
100.4 0.85 6.0 0.2128
12.0 0.2172
0.90 6.0 0.2520
12.0 0.3092
125.6 0.85 8.0 6.0 0.2012
12.0 0.2023
0.90 6.0 0.2374
12.0 0.3667
D-22
. CMOGI
10.0028
7
0.1801
0.4698
0.0345
0.0421
0.1576
10.2748
0.0040
0.0078
0.1154
0.3250
0.0258
0.0334
0.1043
0.1871
0.0024
0.0046
0.0669
0.1873

TABLE 0-6. Computation of CMOGI Using Thermal Cracking Program for Abilene - continued
The Average Annual Solar Radiation, SR = 422.0 Langleys/day. The Average Annual Amplitude of Solar Radiation, SA = 177.5 Langleys/day. THe Minimum Monthly Temperature, MMT = 31. 7 OF.
Penetration Softening Volumetric Pavement Number Crack Index Point Concentration Thickness of ~ength P.1. Ring & Ball of the DF Years iY
Temperature Aggregate ( in) c (i n)
TR + B Cv (oF)
100.4 0.85 2.0 6.0 0.2112
12.0 0.2145
0.90 6.0 0.2400
12.0 0.2816
-1.0 125.6 0.85 4.0 0.2000
8.0 0.2000
0.90 4.0 0.2050
8.0 0.2102
100.4 0.85 5.0 4.0 0.2000
8.0 0.2002
0.90 4.0 0.2018
8.0 0.2144
125.6 0.85 4.0 0.2002
8.0 0.2003
0.90 4.0 0.2098
8.0 0.2204
100.4 0.85 4.0 0.2002
8.0 0.2012
0.90 4.0 0.2032
8.0 0.2204
D-23
CMOGI
0.0182
0.0234
0.0633
0.1146
0.0002
0.0002
0.0261
0.0549
0.0002
0.0012
0.0079
0.0590
0.0004
0.0006
0.0259
0.0534
0.0004
0.0021
0.0068
0.0431

TABLE D-6. Computation of CMDGl Using Thermal Cracking Program for Abilene - continued
The Average Annual Solar Radiation, SR = 422.0 Langleys/day. The Average Annual Amplitude of Solar Radiation, SA = 177.5 Langleys/day. THe Minimum Monthly Temperature, MMT = 31.7 of.
Penetration Softening Volumetric Pavement Number Crack Index Point Concentration Thickness of I-ength P.1. Ring & Ball of the DF Years ;y
Temperature Aggregate (in) c (i n)
TR+ B Cv (oF)
125.6 0.85 8.0 4.0 0.2002
8.0 0.2003
0.90 4.0 0.2075
8.0 0.2150
100.4 0.85 4.0 0.2003
8.0 0.2011
0.90 4.0 0.2025
8.0 0.2147
0.0 125.6 0.85 2.0 4 0 0.2000
8.0 0.2000
0.90 4.0 0.2051
8.0 0.2150
100.4 0.85 4.0 0.2000
8.0 0.2002
0.90 4.0 0.2011
8.0. 0.2145
125.0 0.85 5 .. 0 4.0 0.2002
8.0 0.2003
0.90 4.0 0.2093
8.0 0.2248
D-24
CMDGI
10.00039
10.0006
10.0149
10_0293
0.0004
0.0018
0.0045
0.0256
b.0002
b.0002
0.0283
0.0799
b.0002
P.0012
p.0050
b.0595
0.0004
b.oo07
b.0259
0.0658

TABLE D-6. Computation of CMDGI Using Thennal Cracking Program for Abilene - continued
The Average Annual Solar Radiation, SR = 422.0 Langleys/day. The Average Annual Amplitude of Solar Radiatiol'\, SA = 177.5 Langleys/day. THe Mi nimum Monthly Temperature, MMT = 31. 7 OF.
Penetration Softening Volumetric Pavement Number Crack Index Point Concentration Thickness of ~ength P.1. Ri ng& Ball of the DF Years i Yc Temperature Aggregate (i n) (i n)
TR + B Cv (oF)
100.4 0.85 4.0 0.2002
8 .. 0 0.2012
0.90 4.0 0.2024
8.0 0.2206
125.6 0.85 4.0 0.2002
8.0 0.2003
0.90 4.0 0.2069
8.0 0.2180
100.4 0.85 4.0 0.2002
8.0 0.2011
0.90 4.0 0.2019
8.0 0.2148
D-25
CMDGI
0.0003 -~
0.0021
0,0050
O,0~36
0.000)
'0.0006
0.014·1 -0.0351
0.0003
0,0018
0.n033
0.0259

TABLE D-7. Computation of CMDG1 Using Thennal Cracking Program for E1 Paso
The Average Annual Solar Radiation, SR = 516.0 Lang1eys/day. The Average Annual Amplitude of Solar Radiation, SA = 212.3 Langleys/day. THe Minimum Monthly Temperature, MMT = 30.2 of.
Penetration Softening Volumetric Pavement Number Crack Index Point Concentration Thickness of ~ength p .1. Ring & Ball of the OF Years ~\
Temperature Aggregate ( in) (in) TR + B Cv -
(oF)
2.0 125.6 0.85 2.0 6.0 0.2062
12.0 0.2064
0.90 6.0 0.2208
12.0 0.3338
100.4 0.85 6.0 0.2130
12.0 0.2135
0.90 6.0 0.2305
12.0 0.2714
125.6 0.85 5.0 6.0 0.2054
12.0 0.2066
0.90 6.0 0.2366
12.0 0.4251
100.4 0.85 6.0 0.2102
12.0 0.2120
0.90 6.0 0.2370
12.0 0.2807
125.6 0.85 $.0 6.0 0.204
12.0 0.2049
0.90 6.0 0.2282
12.0 0.3445
D-26
CMDGI
0.02743
0.0289
0.1282
0.4315
0.0409
0.0431
0.1042
0.2196
0.0142
0.01707
0.0939
0.3201
0.01945
0.02261
0.07550
0.1474
0.0077
0.00947
0.0524
0.1731

TABLE 0-7. Computation of CMOGl Using Thennal Cracking Program for E1 Paso - continued
The Average Annual Solar Radiation, SR = 516.0 Langleys/day. The Average Annual Amplitude of Solar Radiation, SA = 212.3 Langleys/day. THe Minimum Monthly Temperature, MMT = 30.2 of.
Penetration Softening Volumetric Pavement Number Crack Index Point Concentration Thickness of ~ength P.1. Ring & Ball of the DF Years ty
Temperature Aggregate (i n) c
TR + B Cv (i n)
(0 F)
100.4 0.85 6.0 0.2072
12.0 0.2087
0.90 6.0 0.2294
12.0 0.2606
-1.0 125.6 0.85 2.0 4.0 0.2000
8.0 0.2001
0.90 4.0 0.2029
8.0 0.2159
100.4 0.85 4.0 0.2000
8.0 0.2014
0.90 4.0 0.2002
8.0 0.2314
125.6 0.85 5.0 4.0 0.2001
8.0 0.2002
0.90 4.0 0.2079
8.0 0.2231
100.4 0.85 4.0 0.2000
8.0 0.2035
0.90 4.0 0.2010
8.0 0.2346
'0-27
CMOG1
0.01131
0.01377
0.04784
0.09037
0.0001
0.0001
).0181
).0822
P·OOOI
b.0066
b.OO11
0.1077
p.0002
0.0005
0.0210
0.0614
0.0001
0.0065
0.0019
0.0765

TABLE D~7. Computation of CMDGI Using Thennal Cracking Program for El Paso - continued
The Average Annual Solar Radiation, SR = 516 .. 0 Langleys/day. The Average Annual Amplitude of Solar Radiation, SA = 212.3 Langleys/day. THe Minimum Monthly Temperature, MMT = 30.2 °
Penetration Softening Volumetric Pavement Number Crack Index Point Concentration Thickness of ~ength P.1. Ring & Ball of the DF Years ty
Temperature Aggregate (in) c (i n)
TR + B Cv (oF)
125 6 0.85 8.0 4~0 0.2001
8.0 0.2003
o 90 4.0 0.2054
8.0 0.2168
100.4 0.85 4.0 0.2001
8.0 0.2026
0.90 4.0 0.2008
I 8.0 0.2319
0.0 125.6 0.85 2.0 4.0 0.2
8.0 0.2
0.90 4.0 0.2028
8.0 0.2167
100.4 0.85 4.0 0.2
8.0 0.2014
0.90 4.0 0.2002
8.0 0.2315
125.6 0.85 5.0 4.0 0.2
. 8.0 0.2002
0.90 4.0 0.2073
8.0 0.2267
D-2B
CMDGI
0.0002
0.0005
0.0111
0.0330
0.0002
0.0043
0.0015
0.0533
10.0001
0.0002
0.0176
0.0861
0.0001
0.0066
0.0012
0.1079
0.0001
0~0006
0.0202
0.0712

TABLE 0-7. Computation of CMDG1 Using Thermal Cracking Program for El Paso ~ continued
The Average Annual Solar Radiation, SR = 516.0 Langleys/day. The Average Annual Amplitude of Solar Radiation~ SA = 212.3 Langleys/day. THe Minimum Monthly Temperature, MMT = 30.2 of.
-Penetration Softening Volumetric Pavement Number Crack
Index Point Concentration Thickness of Length P. I- Ring & Ball of the DF Years ;y
Temperature Aggregate (i n) c
TR + B Cv (i n)
( oF)
100.4 0.85 4.0 0.2
8.0 0.2035
0.90 4.0 0.201
8.0 0.2348
125.6 0.85 8.0 4.0 0.2
8.0 0.2002
0.90 4.0 0.2050
8.0 0.2211
100.4 0.85 4.0 0.2
8.0 0.2026
0.90 4.0 0.2008
8.0 0.2320
D-29
CMDGl
0.0001
0.0065
0.0018
0.0769
0.0001
0.0005
0.0104
0.0409
001
p.0043
b.0015
~.0535

TABtE D-8. Computation of CMOG1 Using Thennal Cracking Program for
The Average Annual Solar Radiation, SR = 399.0 Langleys/day. The Average Annual Amplitude of Solar Radiation, SA = 181.0 Langleys/day. THe Minimum Monthly Temperature, MMT = 35.70°F.
Penetration Soften; ng Volumetric Pavement Number Crack Index Point Concentration Thickness of Length P.1. Ring & Ball of the OF Years iy
Temperature Aggregate (in) c (i n)
TR + B Cv (oF)
2.0 125.6 0.85 2.0 6.0 0.2
12.0 0.2007
0.90 6.0 0.2149
12.0 0.2584
100.4 0.85 6.0 0.2003
12.0 0.2094
0.90 6.0 0.2074
12.0 0.2275
125.6 0.85 5.0 6.0 0.2003
I 12.0 0.2018
0.90 6.0 0.219
12.0 0.2767
100.4 0.85 6.0 0.2011
12.0 0.2112
0.90 6.0 0.2122
12.0 0.2396
125.6 0.85 8.0 6.0 0.2002
12.0 0.2014
0.90 6.0 0.2149
12.0 0.2569
D-30
CMDGI
0.0002
0.004
0.0746
0.2459
0.00142
0.0330
0.0304
0.09977
0.0006 .
0.00465
0.0530
0.1706
0.00194
0.02327
0.02643
0.08270
0.00044
0.00272
0.0295
0.0935

TABLE D-8. Computation of CMDG1 Using Thennal Cracking Program for Dallas - continued
The Average Annual Solar Radiation, SR = 399.0 Langleys/day. The Average Annual Amplitude of Solar Radiation, SA = 181.0 Langleys/day. THe Minimum Monthly Temperature, MMT = 35.70°F.
Penetration Soften; ng Volumetric Pavement Number Crack Index Point Concentra t i on Thickness of ~ength P.1. Ring & Ball of the DF Years IV
Temperature Aggregate (in) c
TR + B Cv (i n)
(oF)
100.4 0.85 6.0 0.2009
12.0 0.2095
0.90 6.0 0.21
12.0 '0.2347
-1.0 125.6 0.85 2.0 4.0 0.2000
8.0 0.2000
0.90 4.0 0.2021
8.0 0.2093
100.4 0.85 4.0 0.2000
8.0 0.2005
0.90 4.0 0.2001
8.0 0.2195
125.6 0.85 5.0 4.0 0.2002
8.0 0.2003
0.90 4.0 0.2051
8.0 0.2143
100.4 0.85 4.0 0.2000
8.0 0.2016
0.90 4.0 0.2004
8.0 0.2232
D-31
CMDGI
0.00151
0.01594
0.01764
0.05704
0.0001
0.0002 ,
0.0112
0.0484
0.0001
0.0023
0.0004
0.0735
0.0003
0.0005
0.0125
0.0383
0.0001
0.0030
0.0008
0.0518

TABLE D-8. Computation of CMDGI Using Thennal Cracking Program for Dallas - continued
The Average Annual Solar Radiation, SR = 399.0 Langleys/day. The Average Annual Amplitude of Solar Radiation, SA = 18l.0 Langleys/day. THe Minimum Monthly Temperature, MMT = 35.70°F.
Penetrati on Softening Volumetric Pavement Number Crack Index Point Concentration' Thickness of ~ength P.1. Ring & Ball of the OF Years ;y
Temperature Aggregate (i n) c (i n)
TR + B Cv (oF)
125.6 0.85 8.0 4.0 0.2001
8.0 0.2002
0.90 4.0 0.2036
8.0 0.2105
100.4 0.85 4.0 0.2000
8.0 0.2012
0.90 4.0 0.2004
8.0 0.2178
0.0 125.6 0.85 2.0 4.0 0.2
8.0 0.2
0.90 4.0 0.2013
8.0 0.2108
100.4 0.85 4.0 0.20
8.0 0.2005
0.90 4.0 0.2
8.0 0.2223
125.6 0.85 ~.O 4.0 0.2
8.0 0.2002
0.90 4.0 0.2035
8.0 0.2155
D-32
C~1DG1
0.0003
0.0004
0.0070
0.0208
0.0001
0.0021
0.0007
0.0313
0.0001
0.0001
0.0079
0.0566
0.0004
0.0025
0.0002
0.0816
0.0001
0.0004
0.0094
0.0433

TABLE D-8. Computation of CMDGI Using Thennal Cracking Program for Dallas - continued
The Average Annual Solar Radiation, SR = 399.0 Langleys/day. The Averagf:! Annual Amplitude of Solar Radiation~ SA = 181.0 Langleys/day. THe Minimum Monthly Temperature, MMT = 35.70°F.
Penetration Softening Volumetric Pavement Number Crack Index Point Concentration Thickness of ~ength P. I- Ring & Ball of the DF Years 'Y
Temperature Aggregate ( in) c (i n)
TR + B CV
C'F)
100.4 0.85 4.0 0.2
8.0 0.2017
0.90 4.0 0.2003
8.0 ;.,. "''''47
125.6 0.85 8.0 4.0 0.2001
8.0 0.2002
0.90 4.0 0.2026
8.0 0.2121
100.4 0.85 4.0 0.2
8.0 0.2013
0.90 4.0 0.2003
8.0 0.2191
D-33
CMDG1
p.0001
p.0032
b.ooos P.0552
b.OO01
b.OO03
0.0052
D~02434
b.OOO1
D.0023
b.oOOS
).03326
APPENDIX E
Solar Radiation and Minimum Temperature Maps for Texas
E-l.

APPENDIX E
Thermal fatigue of asphalt concrete pavement occurs
because of daily variations in temperature and annual
variations of solar radiation. The pavement design equation
that was developed in this report represents these two
effects with a minimum temperature and an "amplitude" of
solar radiation.
The amplitude of solar radiation is the difference
between the maximum and the mean solar radiation. In order
to help in estimating this quantity for design purposes, two
solar radiation maps are presented. Figure El gives the
mean annual solar radiation and Figure E2 gives the maximum
solar radiation which occurs in June in Texas. Both figures
were taken from Reference El.
For some areas of Texas, temperature data are not
readily available and, at the present time, normal monthly
minimum temperatures have not been compiled for many of the
weather stations in the State that do collect temperature
data. However, in (Ref. E2) normal monthly minimum
temperatures are recorded for weather stations in 144 of
Texas' counties. Those 144 countieg are. scattered generally
over the State and offer a reasonable representation of the
monthly minimum temperatures throughout the State. In each
of those 144 counties, the lowest normal monthly minimum
temperature is for January. Thus a map of January normal
monthly minimum temperatures for Texas would serve as a map
E-2

475
FIGURE E1. Average Annual Solar .Radiation in Texas (langleys/Day)
E-3

FIGURE E2. Mean Daily Solar Radiation For June. in Langleys per Day.
E-4

of lowest monthly minimum temperatures. The
E3 was developed from a map (Ref. E3)
minimum monthly temperatures based on data
1931-1952.
E-5
map in Figure
of January mean
in the period

20
FIGURE D. Lowest Normal Monthly Minimum Temperatures in Texas
40
5254

REFERENCES
El. Carpenter, S. H., R. L. Lytton and J. A. Epps,
E2.
"Environmental Factors Relevant to Pavement Cracking in
West Texas", Research Report 18-1, Texas Transportation
Institute, Texas A&M university, College Station,
Texas, January, 1974.
Climotography of the
National Oceanic
united States,
and Atmospheric
No. 81, Texas",
Administration,
Environmental Data and Information Service, National
Climatic Center, Ashville, North Carolina.
E3. "Climatological Data", National Oceanic and Atmospheric
Administration, Environomental Data and Information
Service, National Climatic Center, Ashville,
Carolina.
E-7
North