Embed Size (px)
Citation preview
Design of an Experimental Apparatus for Studying the Flow of Refrigerant R-134a
in a Capillary Tube Refrigeration System
M. F. G. Johnson and W. E. Dunn
ACRC TR-Sl
For additional information:
Air Conditioning and Refrigeration Center University of Illinois Mechanical & Industrial Engineering Dept. 1206 West Green Street Urbana,IL 61801
(217) 333-3115
September 1993
Prepared as part of ACRC Project 21 Validation and Improvement of Capillary-tube Model
W. E. Dunn, Principal Investigator
The Air Conditioning and Refrigeration Center was founded in 1988 with a grant from the estate of Richard W. Kritzer, the founder of Peerless of America Inc. A State of Illinois Technology Challenge Grant helped build the laboratory facilities. The ACRC receives continuing support from the Richard W. Kritzer Endowment and the National Science Foundation. Thefollowing organizations have also become sponsors of the Center.
Acustar Division of Chrysler Allied-Signal, Inc. Amana Refrigeration, Inc. Carrier Corporation Caterpillar, Inc. E. I. du Pont de Nemours & Co. Electric Power Research Institute Ford Motor Company General Electric Company Harrison Division of GM ICI Americas, Inc. Johnson Controls, Inc. Modine Manufacturing Co. Peerless of America, Inc. Environmental Protection Agency U. S. Anny CERL Whirlpool Corporation
For additional information:
Air Conditioning & Refrigeration Center Mechanical & Industrial Engineering Dept. University of Illinois 1206 West Green Street Urbana IL 61801
2173333115
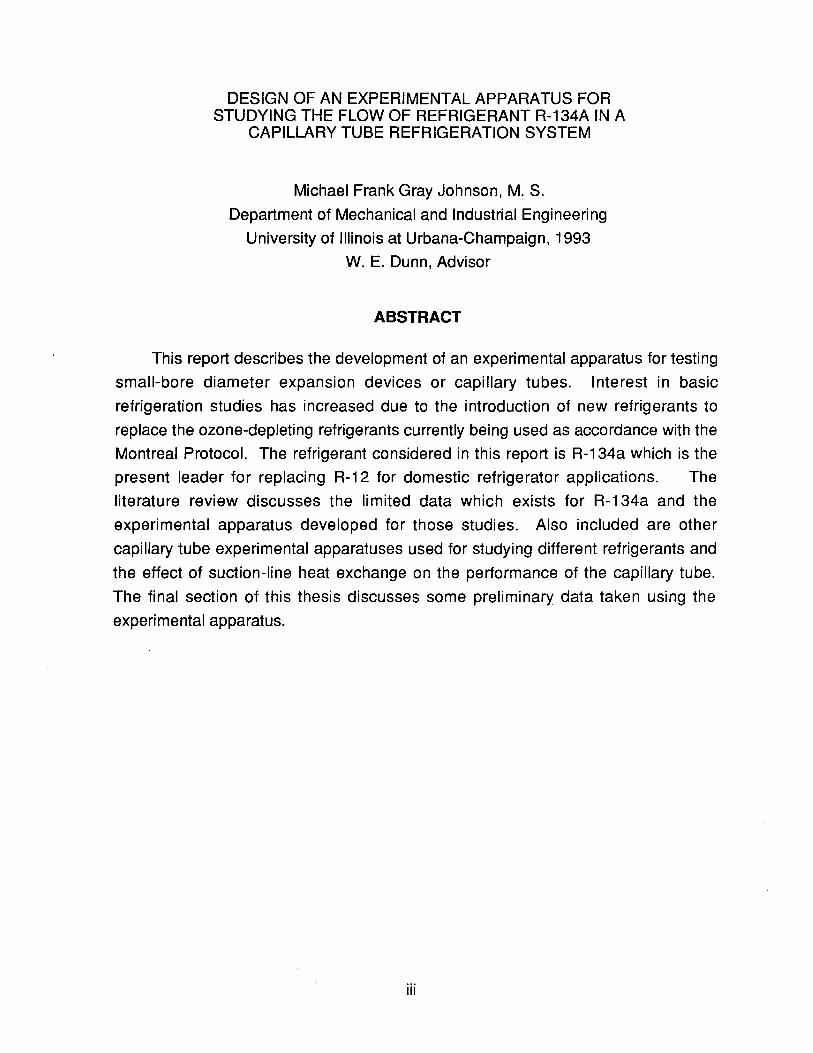
DESIGN OF AN EXPERIMENTAL APPARATUS FOR STUDYING THE FLOW OF REFRIGERANT R-134A IN A
CAPILLARY TUBE REFRIGERATION SYSTEM
Michael Frank Gray Johnson, M. S.
Department of Mechanical and Industrial Engineering
University of Illinois at Urbana-Champaign, 1993
W. E. Dunn, Advisor
ABSTRACT
This report describes the development of an experimental apparatus for testing
small-bore diameter expansion devices or capillary tubes. Interest in basic
refrigeration studies has increased due to the introduction of new refrigerants to
replace the ozone-depleting refrigerants currently being used as accordance with the
Montreal Protocol. The refrigerant considered in this report is R-134a which is the
present leader for replacing R-12 for domestic refrigerator applications. The
literature review discusses the limited data which exists for R-134a and the
experimental apparatus developed for those studies. Also included are other
capillary tube experimental apparatuses used for studying different refrigerants and
the effect of suction-line heat exchange on the performance of the capillary tube.
The final section of this thesis discusses some preliminary data taken using the
experimental apparatus.
iii

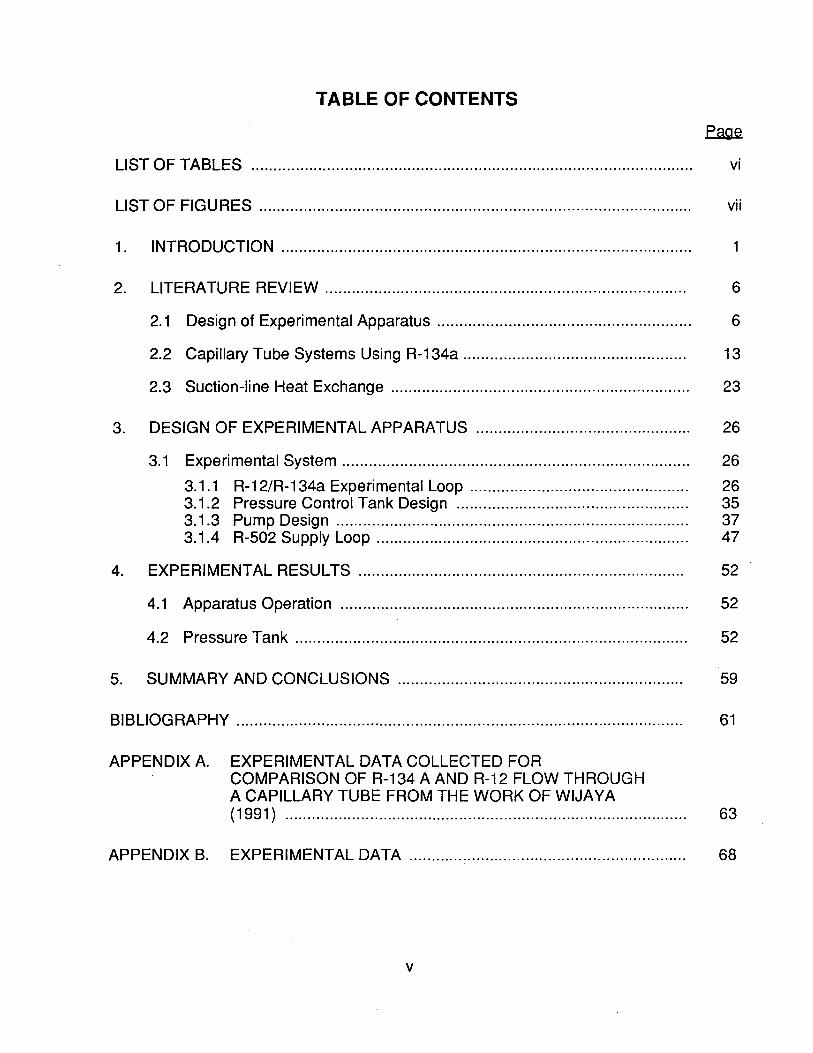
TABLE OF CONTENTS
LIST OF TABLES ................................................................................................... vi
LIST OF FIGURES ................................................................................................. vii
1 . INTRODUCTION............................................................................................ 1
2. LITERATURE REVIEW ................................................................................. 6
2.1 Design of Experimental Apparatus ......................................................... 6
2.2 Capillary Tube Systems Using R-134a .................................................. 13
2.3 Suction-line Heat Exchange ................................................................... 23
3. DESIGN OF EXPERIMENTAL APPARATUS ................................................ 26
3.1 Experimental System ...... ......................... ...... ...... ...... ....... ..... ...... ........... 26
3.1.1 R-12/R-134a Experimental Loop .. ............. ...... ....... ..... ...... .......... 26 3.1.2 Pressure Control Tank Design ....... ...... ............. ... ........ ...... ......... 35 3.1.3 Pump Design ..... .... ... .... ......... ... ........ ... ........ ...... ..... ............... ...... 37 3.1.4 R-502 Supply Loop ...................................................................... 47
4. EXPERIMENTAL RESULTS ......................................................................... 52
4.1 Apparatus Operation .............................................................................. 52
4.2 Pressure Tank ...... .......... ........... ..... ...... ..... ...... ......... ........... .............. ..... 52
5. SUMMARY AND CONCLUSIONS ................................................................ 59
BIBLIOGRAPHY .................................................................................................... 61
APPENDIX A. EXPERIMENTAL DATA COLLECTED FOR COMPARISON OF R-134 A AND R-12 FLOW THROUGH A CAPILLARY TUBE FROM THE WORK OF WIJAYA (1991) .......................................................................................... 63
APPENDIX B. EXPERIMENTAL DATA .............................................................. 68
v
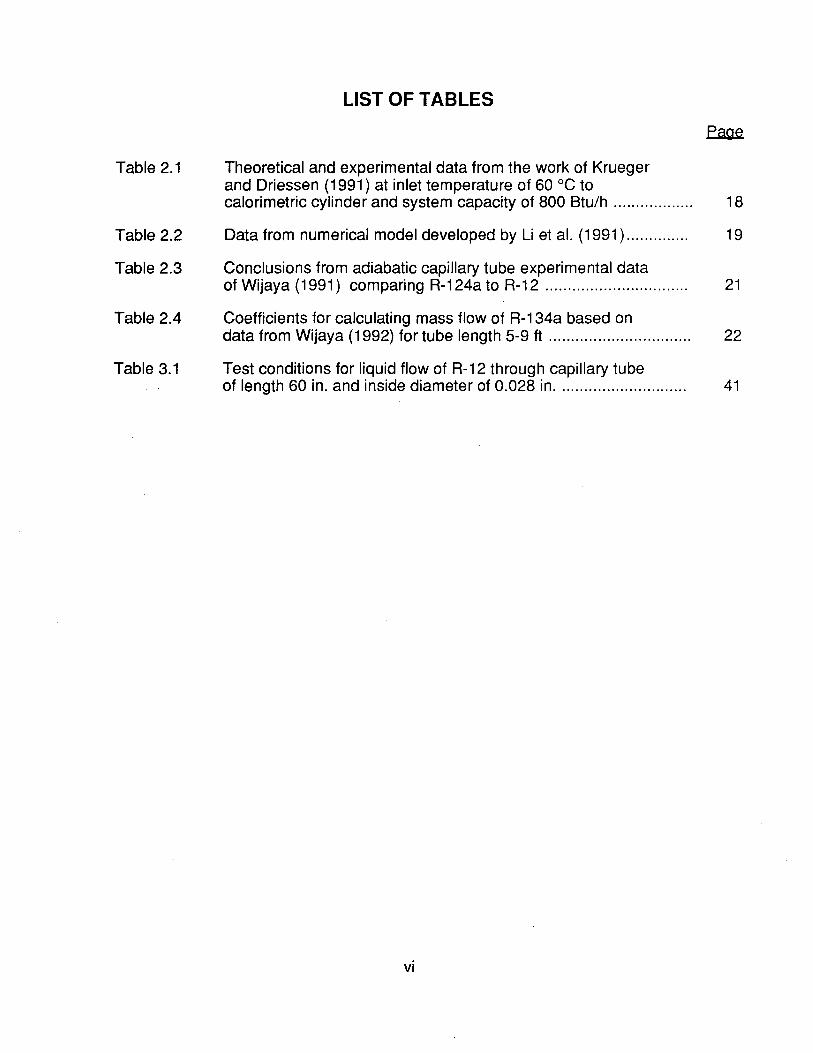
Table 2.1
Table 2.2
Table 2.3
Table 2.4
Table 3.1
LIST OF TABLES
Theoretical and experimental data from the work of Krueger and Driessen (1991) at inlet temperature of 60°C to calorimetric cylinder and system capacity of 800 Btu/h ................. .
Data from numerical model developed by Li et al. (1991) ............. .
Conclusions from adiabatic capillary tube experimental data of Wijaya (1991) comparing R-124a to R-12 ............................... .
Coefficients for calculating mass flow of R-134a based on data from Wijaya (1992) for tube length 5-9 ft .............................. ..
Test conditions for liquid flow of R-12 through capillary tube of length 60 in. and inside diameter of 0.028 in ........................... ..
vi
18
19
21
22
41
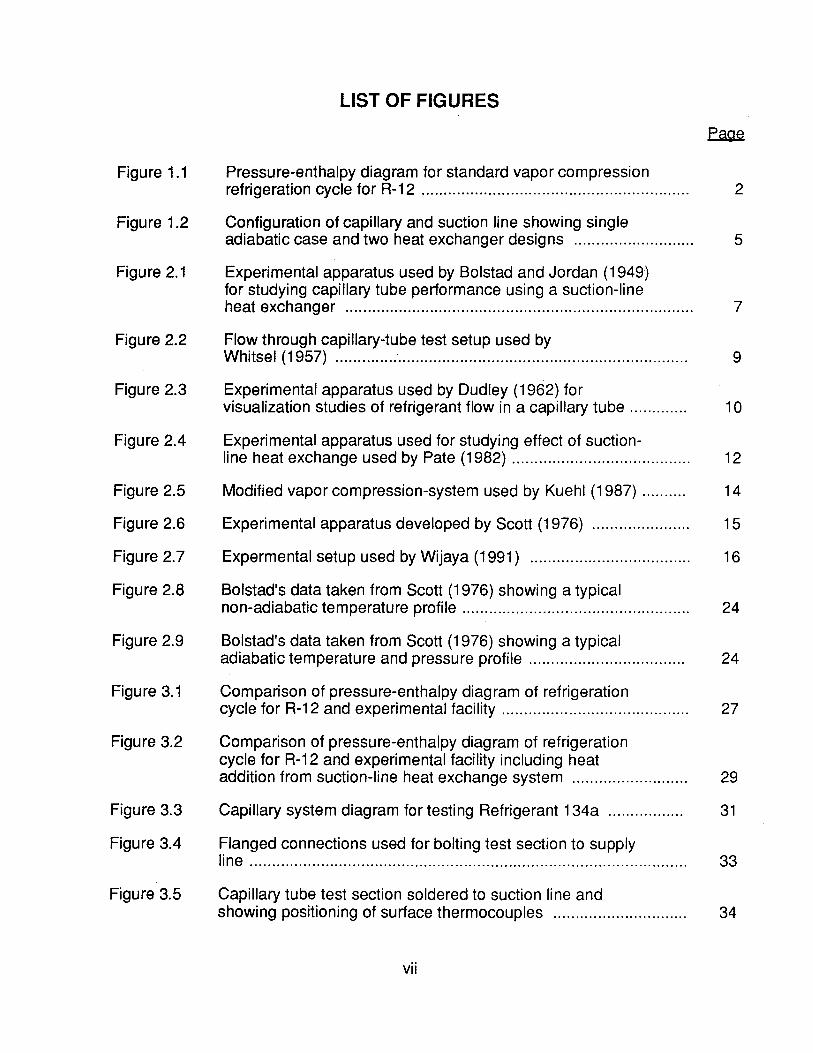
LIST OF FIGURES
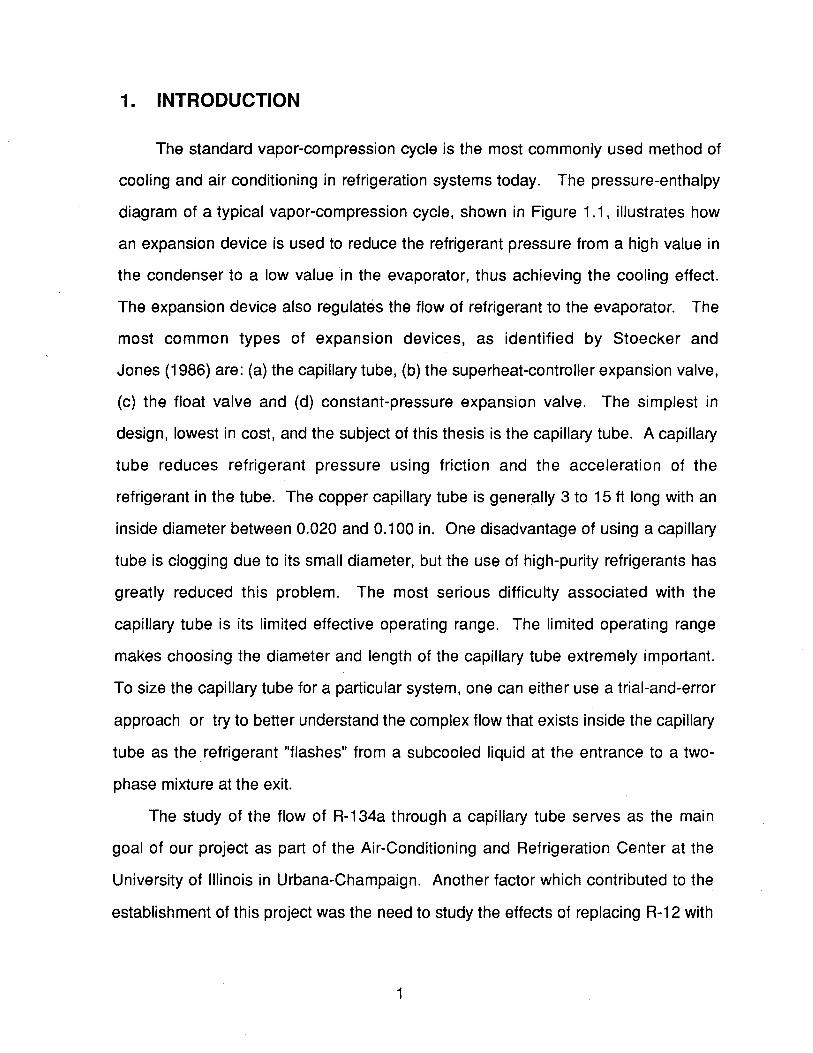
Figure 1.1 Pressure-enthalpy diagram for standard vapor compression refrigeration cycle for R-12 ............................................................ 2
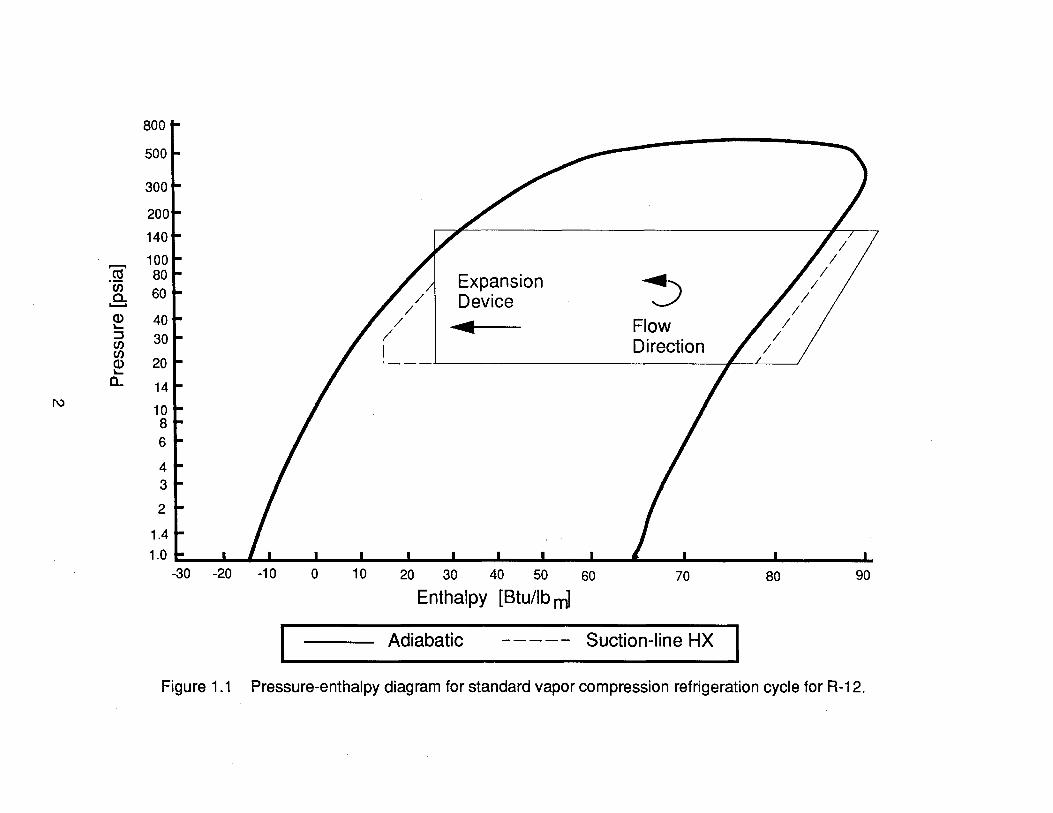
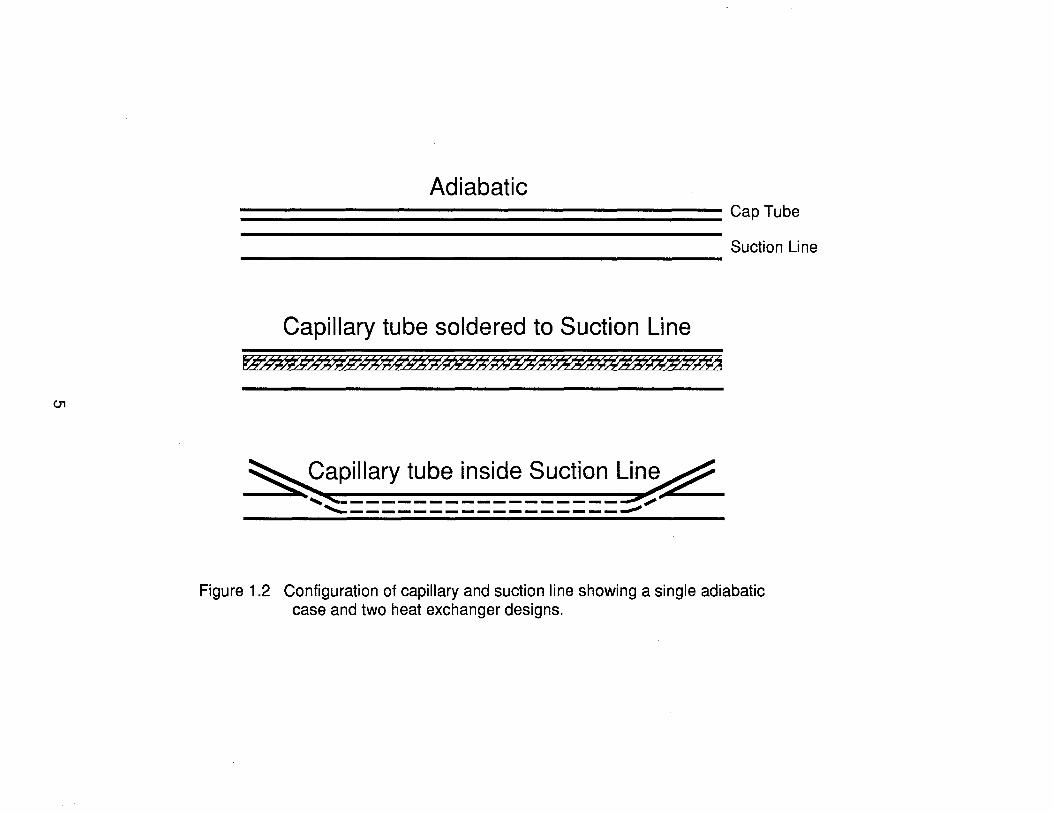
Figure 1.2 Configuration of capillary and suction line showing single adiabatic case and two heat exchanger designs ...... ...... ........ ....... 5
Figure 2.1 Experimental apparatus used by Bolstad and Jordan (1949) for studying capillary tube performance using a suction-line heat exchanger .............................................................................. 7
Figure 2.2 Flow through capillary-tube test setup used by Whitsel (1957) ............................................................................... 9
Figure 2.3 Experimental apparatus used by Dudley (1962) for visualization studies of refrigerant flow in a capillary tube ............. 10
Figure 2.4 Experimental apparatus used for studying effect of suction-line heat exchange used by Pate (1982) ........................................ 12
Figure 2.5 Modified vapor compression-system used by Kuehl (1987) .......... 14
Figure 2.6 Experimental apparatus developed by Scott (1976) ......... ........ ..... 15
Figure 2.7 Expermental setup used by Wijaya (1991) .................................... 16
Figure 2.8 Bolstad's data taken from Scott (1976) showing a typical non-adiabatic temperature profile ................................................... 24
Figure 2.9 Bolstad's data taken from Scott (1976) showing a typical adiabatic temperature and pressure profile ... ....... ..... ..... ....... ........ 24
Figure 3.1 Comparison of pressure-enthalpy diagram of refrigeration cycle for R-12 and experimental facility.......................................... 27
Figure 3.2 Comparison of pressure-enthalpy diagram of refrigeration cycle for R-12 and experimental facility including heat addition from suction-line heat exchange system ....................... ... 29
Figure 3.3 Capillary system diagram for testing Refrigerant 134a ................. 31
Figure 3.4 Flanged connections used for bolting test section to supply line .................................................................................................. 33
Figure 3.5 Capillary tube test section soldered to suction line and showing positioning of surface thermocouples ..... ................. ........ 34
vii
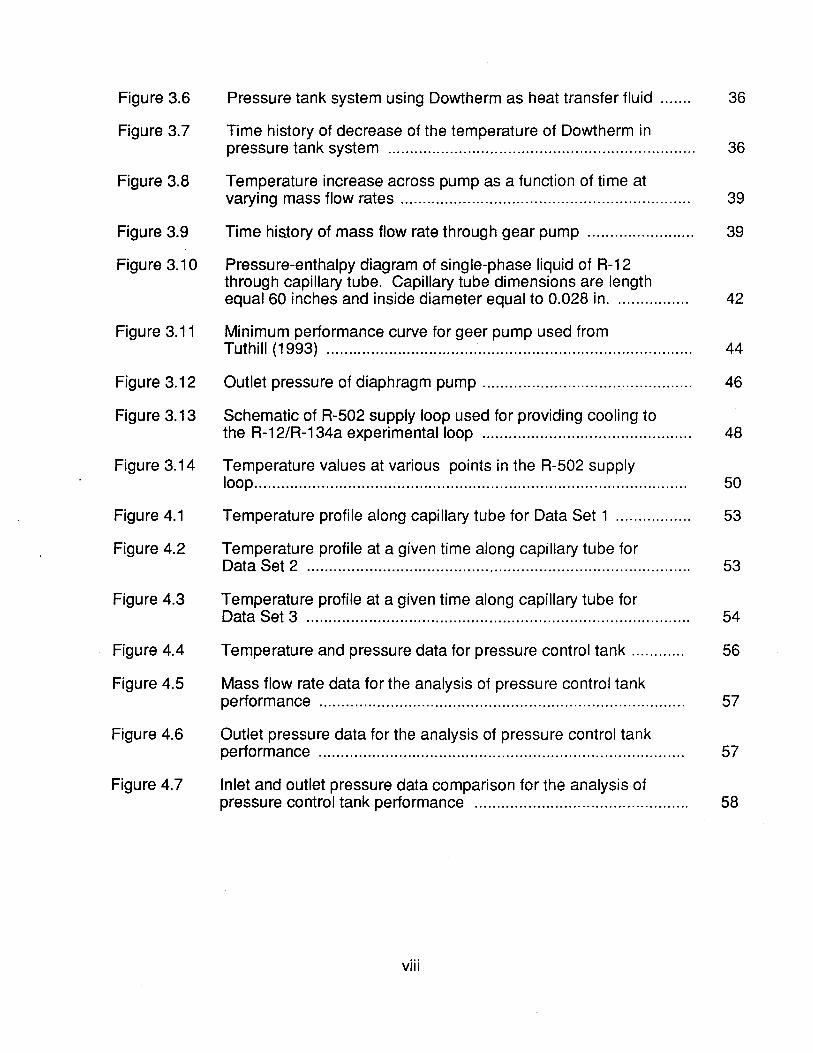
Figure 3.6 Pressure tank system using Dowtherm as heat transfer fluid ....... 36
Figure 3.7 Time history of decrease of the temperature of Dowtherm in pressure tank system ....................... ...... ...... ....... ................ ........... 36
Figure 3.8 Temperature increase across pump as a function of time at varying mass flow rates ................................................................. 39
Figure 3.9 Time history of mass flow rate through gear pump .. ...... ........ ........ 39
Figure 3.10 Pressure-enthalpy diagram of single-phase liquid of R-12 through capillary tube. Capillary tube dimensions are length equal 60 inches and inside diameter equal to 0.028 in. ................ 42
Figure 3.11 Minimum performance curve for geer pump used from Tuthill (1993) .................................. ....... ..... ........ ...... .... ....... ........ ... 44
Figure 3.12 Outlet pressure of diaphragm pump ........ ..... ............. .............. ....... 46
Figure 3.13 Schematic of R-502 supply loop used for providing cooling to the R-12/R-134a experimental loop ............................................... 48
Figure 3.14 Temperature values at various points in the R-502 supply loop................................................................................................. 50
Figure 4.1 Temperature profile along capillary tube for Data Set 1 ................. 53
Figure 4.2 Temperature profile at a given time along capillary tube for Data Set 2 ...................................................................................... 53
Figure 4.3 Temperature profile at a given time along capillary tube for Data Set 3 ...................................................................................... 54
Figure 4.4 Temperature and pressure data for pressure control tank ............ 56
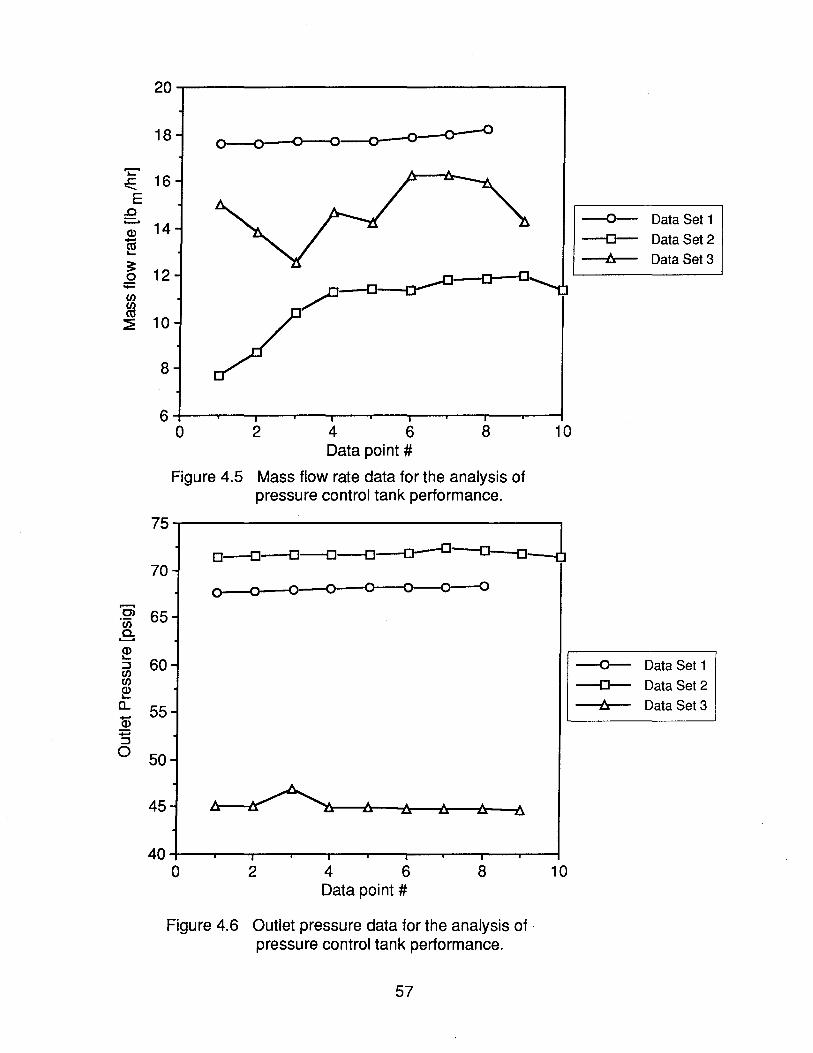
Figure 4.5 Mass flow rate data for the analysis of pressure control tank performance .................................................................................. 57
Figure 4.6 Outlet pressure data for the analysis of pressure control tank performance "................................................................................ 57
Figure 4.7 Inlet and outlet pressure data comparison for the analysis of pressure control tank performance ................................................ 58
viii
1. INTRODUCTION
The standard vapor-compression cycle is the most commonly used method of
cooling and air conditioning in refrigeration systems today. The pressure-enthalpy
diagram of a typical vapor-compression cycle, shown in Figure 1.1, illustrates how
an expansion device is used to reduce the refrigerant pressure from a high value in
the condenser to a low value in the evaporator, thus achieving the cooling effect.
The expansion device also regulates the flow of refrigerant to the evaporator. The
most common types of expansion devices, as identified by Stoecker and
Jones (1986) are: (a) the capillary tube, (b) the superheat-controller expansion valve,
(c) the float valve and (d) constant-pressure expansion valve. The simplest in
design, lowest in cost, and the subject of this thesis is the capillary tube. A capillary
tube reduces refrigerant pressure using friction and the acceleration of the
refrigerant in the tube. The copper capillary tube is generally 3 to 15 ft long with an
inside diameter between 0.020 and 0.100 in. One disadvantage of using a capillary
tube is clogging due to its small diameter, but the use of high-purity refrigerants has
greatly reduced this problem. The most serious difficulty associated with the
capillary tube is its limited effective operating range. The limited operating range
makes choosing the diameter and length of the capillary tube extremely important.
To size the capillary tube for a particular system, one can either use a trial-and-error
approach or try to better understand the complex flow that exists inside the capillary
tube as the refrigerant "flashes" from a subcooled liquid at the entrance to a two
phase mixture at the exit.
The study of the flow of R-134a through a capillary tube serves as the main
goal of our project as part of the Air-Conditioning and Refrigeration Center at the
University of Illinois in Urbana-Champaign. Another factor which contributed to the
establishment of this project was the need to study the effects of replacing R-12 with
1
I\)
~ en a. .......... (]) '-
800
500
300
60 Expansion Device ----
~ Flow Direction
::J (fJ (fJ (J) 20 I '-a..
10 8 6
4 3
2
1.0 r , , •
-30 -20 -10 o 10 20 30 40 50 60 70
Enthalpy [Btu/lb ml
I Adiabatic ----- Suction-line Hx:-I
80 90
Figure 1.1 Pressure-enthalpy diagram for standard vapor compression refrigeration cycle for R-12.
alternative refrigerants, and of using different configurations and geometry's of the
capillary tube, on the performance of a capillary-tube system.
Studies of R-12 in various capillary-tube configurations have been conducted
by a variety of researchers since the 1940's. This work is well documented in
Scott's (1976) Ph.D. thesis from the University of Michigan. However, due to the
adoption of the Montreal Protocol, which calls for the phase out of R-12, the need
exists for experimental data from capillary-tube systems using alternative
refrigerants. A publication from the Air-Conditioning and Refrigeration
Institute (1992) reports that the revisions to the Montreal Protocol, as agreed to at
the meeting of UNEP (United Nations Environmental Program) in Copenhagen,
stated that the production of all CFC's like R-12 must be eliminated by 1996.
Presently, R-134a has the most potential for replacing R-12 for use in domestic
refrigerators. The data for R-134a flow inside a capillary tube are limited at present,
however, and more data are needed for design purposes. This need is the basis for
our experimental work. The main goal is to design an experimental apparatus for
studying the flow of R-134a and R-134a1lubricant mixtures in capillary tubes. Data
will also be taken with R-12 for comparison with R-134a. The main reason for this
approach is that the small amount of data existing for R-134a studies is in this
format, thus allowing for comparison of the data collected by our experimental
apparatus. The data collected will be for both adiabatic and non-adiabatic operation
of a capillary tube. The data that exists for R-134a in a capillary tube is for adiabatic
operation with a well insulated test section to prevent heat transfer to the ambient or
any other source. Non-adiabatic operation is accomplished with the use of a
suction-line heat exchanger which improves the thermal performance of the
refrigerant cycle by placing the capillary tube in contact with the suction line between
the compressor and evaporator. The contact is made by either soldering the two
tubes together in a side-by-side configuration or by placing the capillary tube inside
3
the suction line, as shown in Figure 1.2. The experimental apparatus was designed
to study and to compare performances of the three types of configurations for both
R-12 and R-134a. The scope of this project studies the performance of a capillary
tube refrigeration system using R-134a for varying geometry's for the capillary tube
and suction-line heat exchangers at operating conditions similar to those of a
domestic refrigerator.
4
(J1
Adiabatic -------------------------------------------- Cap Tube
Capillary tube soldered to Suction Line ~.
~apillary tube inside Suction Lin~ ""_ c: » ~-" ~------------------..,.,."",.-",....."--------------------~
Suction Line
Figure 1.2 Configuration of capillary and suction line showing a single adiabatic case and two heat exchanger designs.
2. LITERATURE REVIEW
2.1 Design of Experimental Apparatus
The purpose of this project is to develop an experimental apparatus for studying
the flow of R-134a a~d R-134a/lubricant mixtures in a variety of capillary-tube
configurations. The design process was begun by reviewing the experimental
facilities used by previous researchers with an eye toward combining the best
aspects from these studies with the specific requirements of our project to build a
working apparatus. Our reviews place an emphasis on (a) aspects incorporated into
our design and (b) the variety of designs previously used. The types of designs
referred to in this paper are (a) the standard vapor-compression cycle, (b) the blow
down system and (c) the closed-loop pump system. A vapor-compression system
uses a compressor, evaporator and condenser in the standard configuration. A
blow-down system uses a reservoir of refrigerant at high pressure connected to a
low-pressure reservoir through the capillary tube. The closed-loop pump system
uses a pump to circulate the refrigerant from the low pressure exit of the test section
to the high pressure at the entrance.
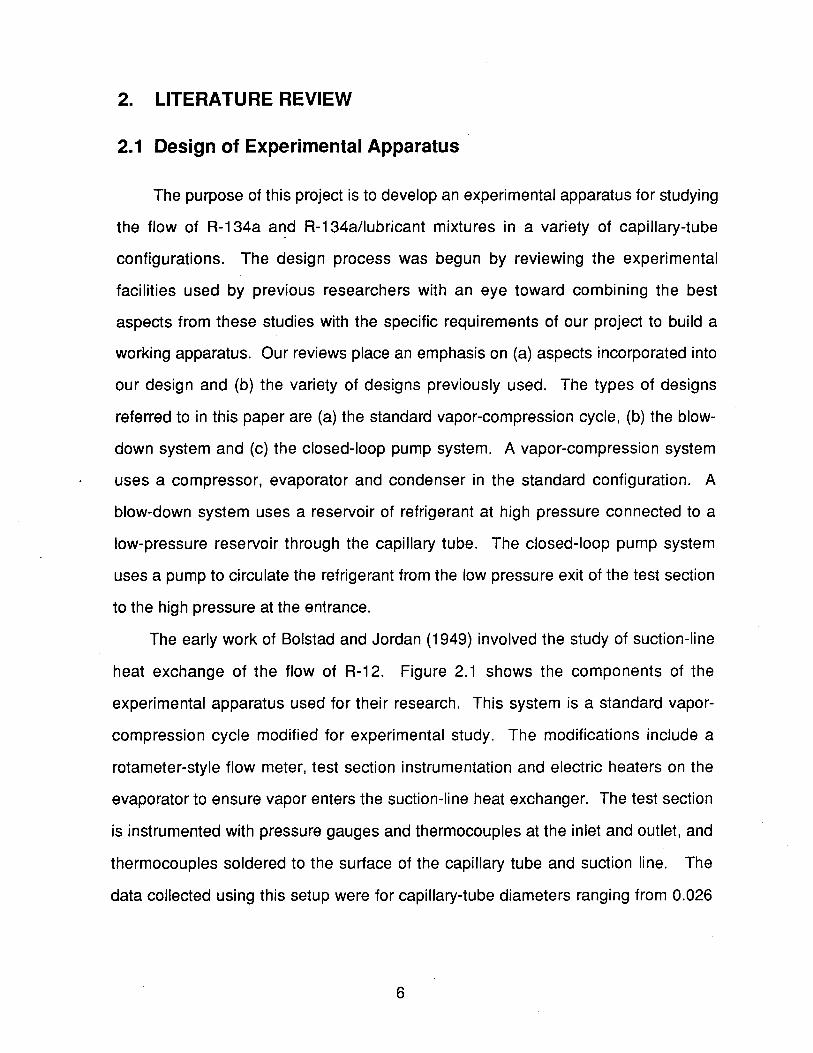
The early work of Bolstad and Jordan (1949) involved the study of suction-line
heat exchange of the flow of R-12. Figure 2.1 shows the components of the
experimental apparatus used for their research. This system is a standard vapor
compression cycle modified for experimental study. The modifications include a
rotameter-style flow meter, test section instrumentation and electric heaters on the
evaporator to ensure vapor enters the suction-line heat exchanger. The test section
is instrumented with pressure gauges and thermocouples at the inlet and outlet, and
thermocouples soldered to the surface of the capillary tube and suction line. The
data collected using this setup were for capillary-tube diameters ranging from 0.026
6
""-l
Gage
I Sight glass
/ ~----~/ / \ . Heat exchanger Suction line
Capillary tube
~Flow meter
/ By-pass valve
Air-cooled ~ condensing unit
/ Subcooler
I........--Gage
Evaporator and electric heaters
Figure 2.1 Experimental apparatus used by Bolstad and Jordan (1949) for studying capillary-tube preformance using a suction-line heat exchanger.
to 0.055 in., lengths of 6, 12, and 18 ft, and inlet pressures of 120, 140, and
160 psia. The results of this study are presented in Section 2.3.
Although Bolstad's work only considered subcooled conditions at the entrance
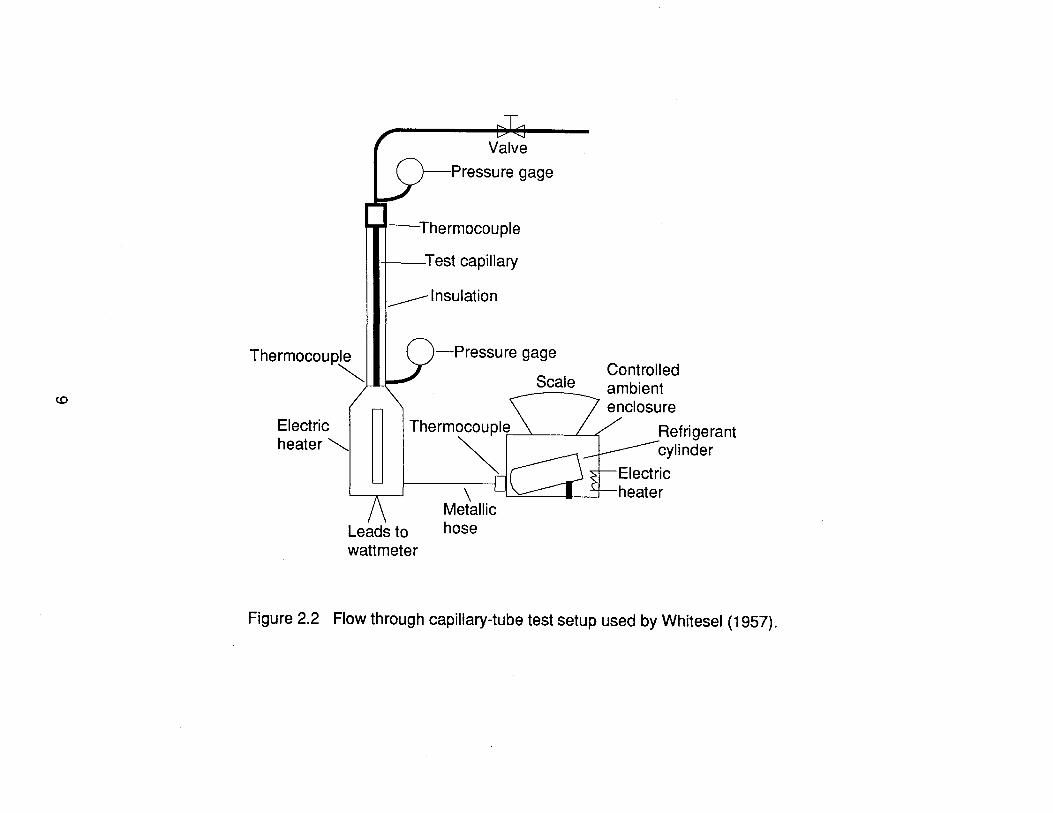
of the test section, Whitesel (1957) used the test setup shown in Figure 2.2 to study
capillary-tube flow with two-phase inlet conditions. Whitesel's experimental
apparatus is a blow-down system. A cylinder containing refrigerant sits on a scale
used for determining the mass flow rate. Refrigerant was discharged through an
electric heater to the test section and then vented to the atmosphere. The heaters
were used to set the inlet quality. Pressure and temperature measurements were
taken at the inlet and exit of the capillary tube for 5-ft long capillary tubes with
diameters of 0.036, 0.070, and 0.090 in. Additional data were recorded for a
capillary tube 1 ft long with a diameter of 0.090 in. The data collected were used in
the development of two-phase flow formulas for R-22 and R-12 and friction-factor
equations for two-phase flow. Unlike Bolstad, Whitesel did not instrument the test
section.
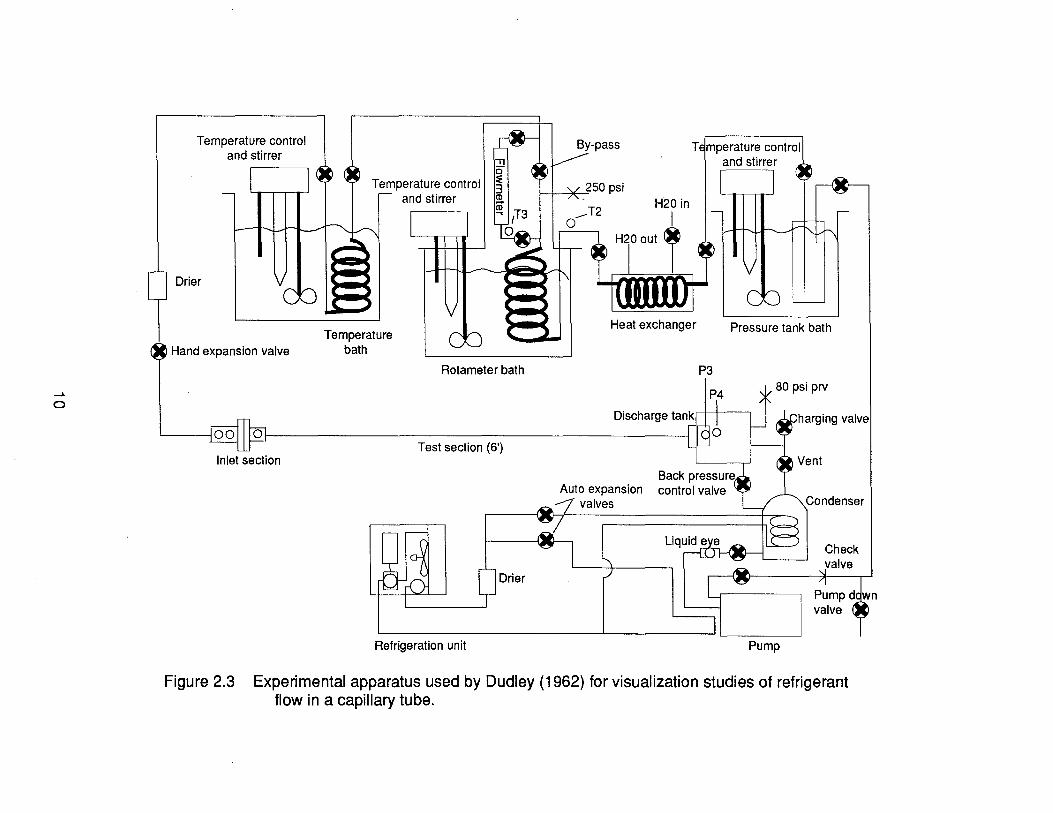
The method of controlling pressure in our apparatus is similar to that used in
the experimental apparatus described by Dudley (1962). The purpose of Dudley's
apparatus, shown in Figure 2.3, is to improve the understanding of the metastable
effect through a visual and photographic study of two-phase flow in a capillary tube.
In this study, the capillary tube was made of glass to facilitate flow visualization.
However, a fine wire was inserted in the test section to produce an artificial
roughness to compensate for the glass tube having a smoother interior surface than
a copper capillary tube, as was done by Cooper (1957). The system operated by
pressurizing the refrigerant (R-12) in a cylinder immersed in a temperature-controlled
water bath. Check valves were employed to prevent the refrigerant flow from
reversing. The refrigerant in the cylinder was at a two-phase condition, thus allowing
the temperature of the bath to control the refrigerant pressure. A hand actuated
8
(0
Thermocouple ~
Electric I heater ""-
Valve
Pressure gage
-Thermocouple
-t--Test capillary
~
____ Insulation
-Pressure gage
Scale
\ Metallic
Leads to hose wattmeter
Controlled ambient enclosure
Refrigerant cylinder
Electric heater
Figure 2.2 Flow through capillary-tube test setup used by Whitesel (1957).
...... o
Temperature control and stirrer
Drier
Hand expansion valve
Inlet section
Temperature control and stirrer
Temperature bath
Rotameter bath
Test section (6')
Drier
Refrigeration unit
By-pass
Heat exchanger Pressure tank bath
P3
Back pressure Auto expansion control valve
valves
Check
Pump
Figure 2.3 Experimental apparatus used by Dudley (1962) for visualization studies of refrigerant flow in a capillary tube.
valve was opened to permit refrigerant flow. The throttled refrigerant was then
cooled to a liquid to measure the flow rate. A third temperature bath was used to set
the inlet temperature of the test section. A secondary refrigerant loop cooled the
condenser downstream of the discharge tank located at the exit of the test section.
The saturation temperature of the condenser set the two-phase refrigerant pressure
at the exit of the test section, thus controlling the operating back pressure of the
system. This system was designed to control the inlet temperature and pressure
and the outlet pressure of the system while measuring the mass flow rate. This
study is limited to the adiabatic case.
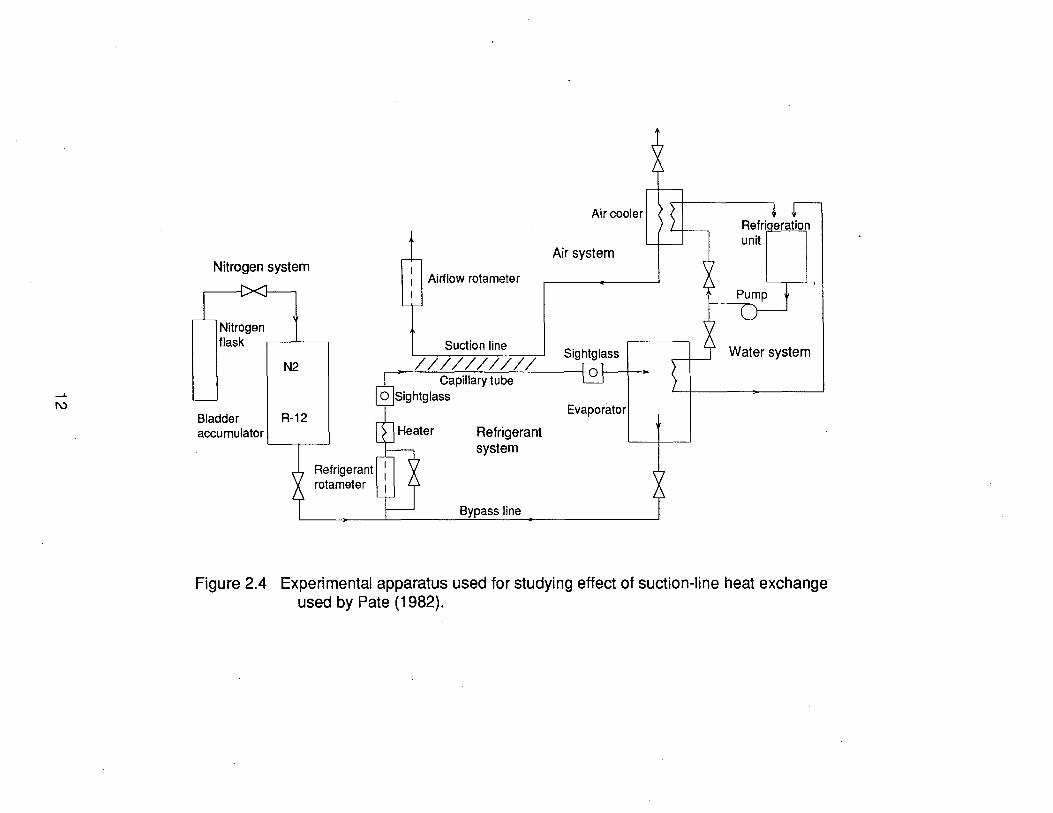
The blow-down system, using a bladder accumulator shown in Figure 2.4, was
used by Pate (1982) to study the effect of suction-line heat exchange. Pate
employed a blow-down system to avoid the lubricant required by a compressor
driven system. The inlet temperature of the refrigerant is controlled by an electrical
immersion heater and the inlet pressure was controlled by a bladder accumulator.
The operation of the bladder accumulator was explained in greater detail in the
experimental apparatus design section of this thesis. A water-cooled reservoir
controled the outlet pressure of the system by setting the saturation temperature of
the refrigerant using the same basic method as used by Dudley (1962). The
interchanger in Pate's design used air to simulate the refrigerant vapor present in a
standard-refrigeration cycle. Air was used because of better flow control, and the
mounting of thermocouples inside the tubing is easier than with R-12. Other
advantages of air are that temperature control is easier than with a refrigerant, and
air can be vented directly into the atmosphere. The same system, but without the air
suction-line heat exchanger, was used by Kuehl (1987). The data Kuehl took were
used to help in the development of a capillary-tube-selection algorithm using R-22 as
the working fluid. Along with the open flow-through loop, Kuehl used a modified
vapor-compression loop similar to the design used by Scott (1976), as seen in
11
....... I\)
Nitrogen system
Nitrogen flask
N2
Bladder R-12 accumulator
Refrigerant rotameter
Air cooler
Air system
Airflow rotameter
Suction line I • / / / / / / / / / / I Sightglass
Capillary tube 101 I· o ISightglass
Refrigerant system
Bypass line
Evaporator
unit
Water system
Figure 2.4 Experimental apparatus used for studying effect of suction-line heat exchange used by Pate (1982).
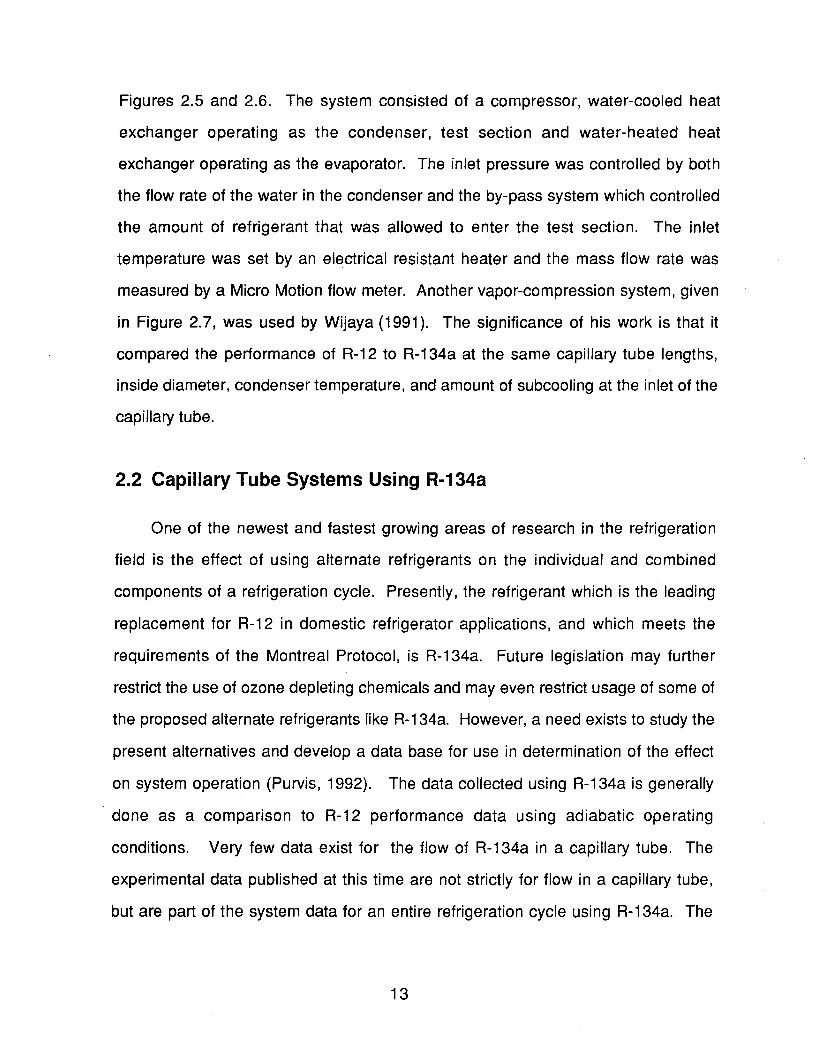
Figures 2.5 and 2.6. The system consisted of a compressor, water-cooled heat
exchanger operating as the condenser, test section and water-heated heat
exchanger operating as the evaporator. The inlet pressure was controlled by both
the flow rate of the water in the condenser and the by-pass system which controlled
the amount of refrigerant that was allowed to enter the test section. The inlet
temperature was set by an electrical resistant heater and the mass flow rate was
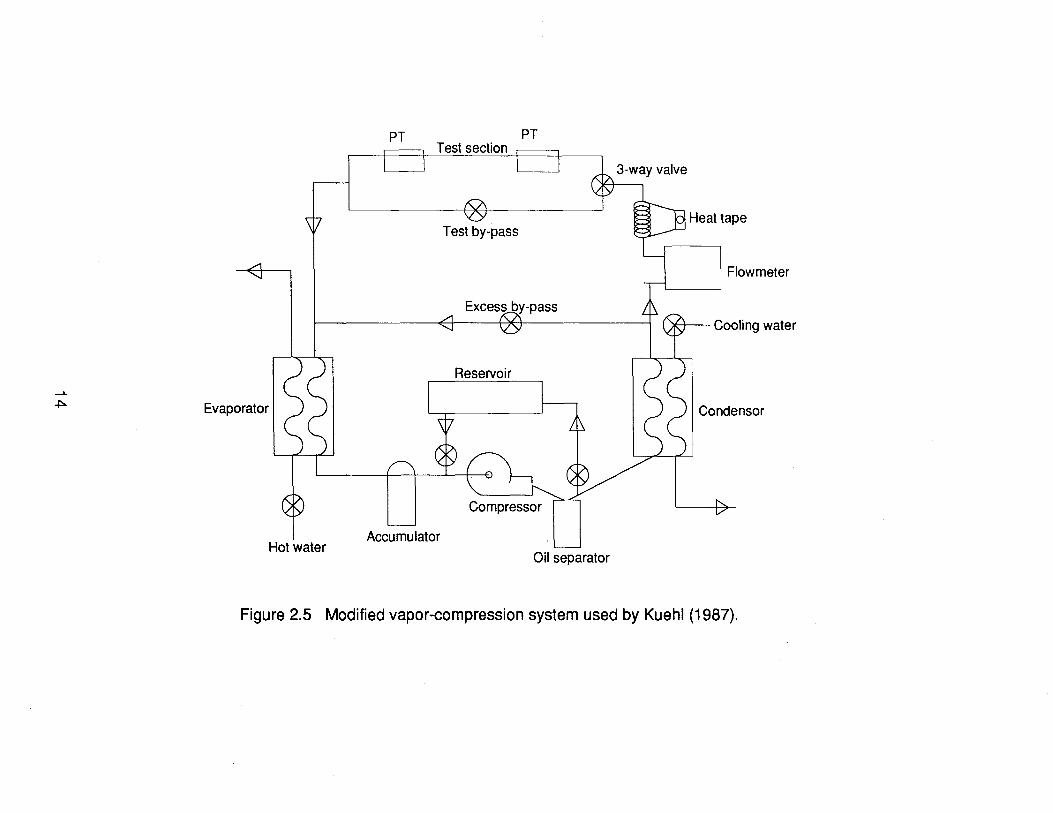
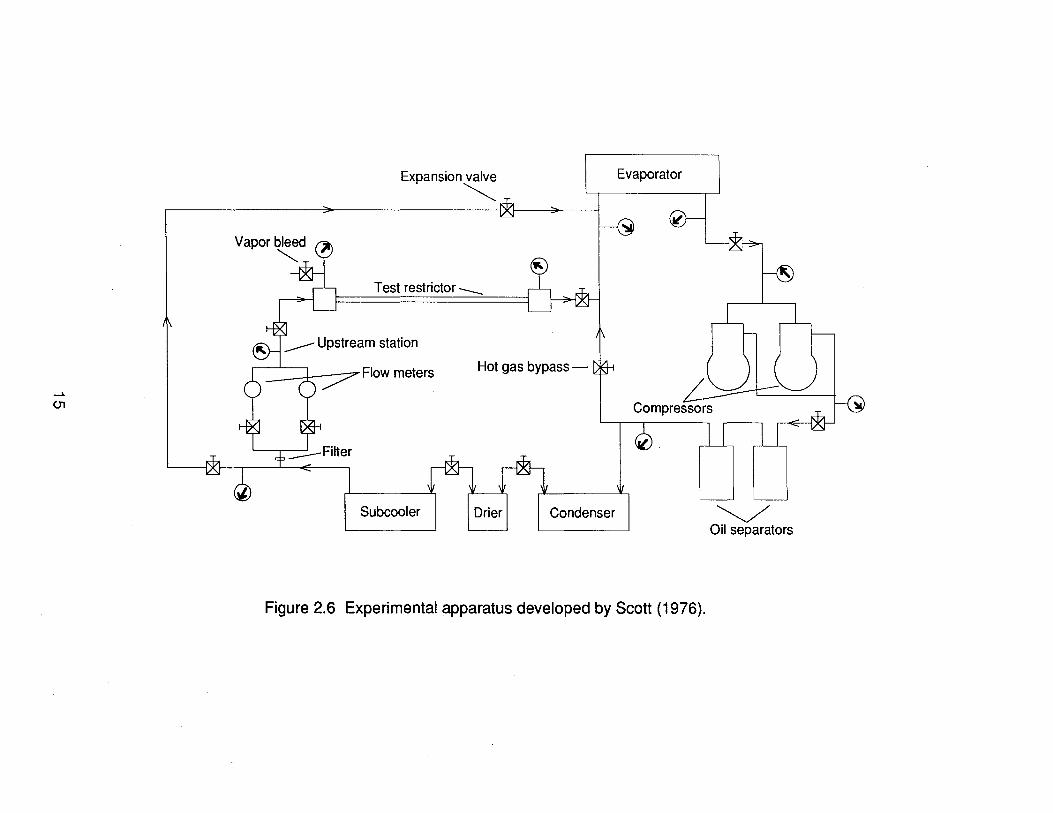
measured by a Micro Motion flow meter. Another vapor-compression system, given
in Figure 2.7, was used by Wijaya (1991). The significance of his work is that it
compared the performance of R-12 to R-134a at the same capillary tube lengths,
inside diameter, condenser temperature, and amount of subcooling at the inlet of the
capillary tube.
2.2 Capillary Tube Systems Using R-134a
One of the newest and fastest growing areas of research in the refrigeration
field is the effect of using alternate refrigerants on the individual and combined
components of a refrigeration cycle. Presently, the refrigerant which is the leading
replacement for R-12 in domestic refrigerator applications, and which meets the
requ'irements of the Montreal Protocol, is R-134a. Future legislation may further
restrict the use of ozone depleting chemicals and may even restrict usage of some of
the proposed alternate refrigerants like R-134a. However, a need exists to study the
present alternatives and develop a data base for use in determination of the effect
on system operation (Purvis, 1992). The data collected using R-134a is generally
done as a comparison to R-12 performance data using adiabatic operating
conditions. Very few data exist for the flow of R-134a in a capillary tube. The
experimental data published at this time are not strictly for flow in a capillary tube,
but are part of the system data for an entire refrigeration cycle using R-134a. The
13
PT PT Test section
3-way valve
Heat tape Test by-pass
Flowmeter
)H--- Cooling water
Reservoir ....... ~ Evaporator Condensor
Hot water Accumulator
Oil separator
Figure 2.5 Modified vapor-compression system used by Kuehl (1987).
Expansion valve ~
Evaporator
Test restrictor __
1 :.?' Flow meters Hot gas bypass -
...... 01
Subcooler Condenser ~ Oil separators
Figure 2.6 Experimental apparatus developed by Scott (1976).
..... en
c:: o .f5 Q) (/)
U5 Q) f-
Electric heater
P.T
P.T
meter
Refrigerated circulator bath
Water
Condenser
By-pass valve
Electric heater
Oil
Figure 2.7 Expermental setup used by Wijaya (1991).
Compresor
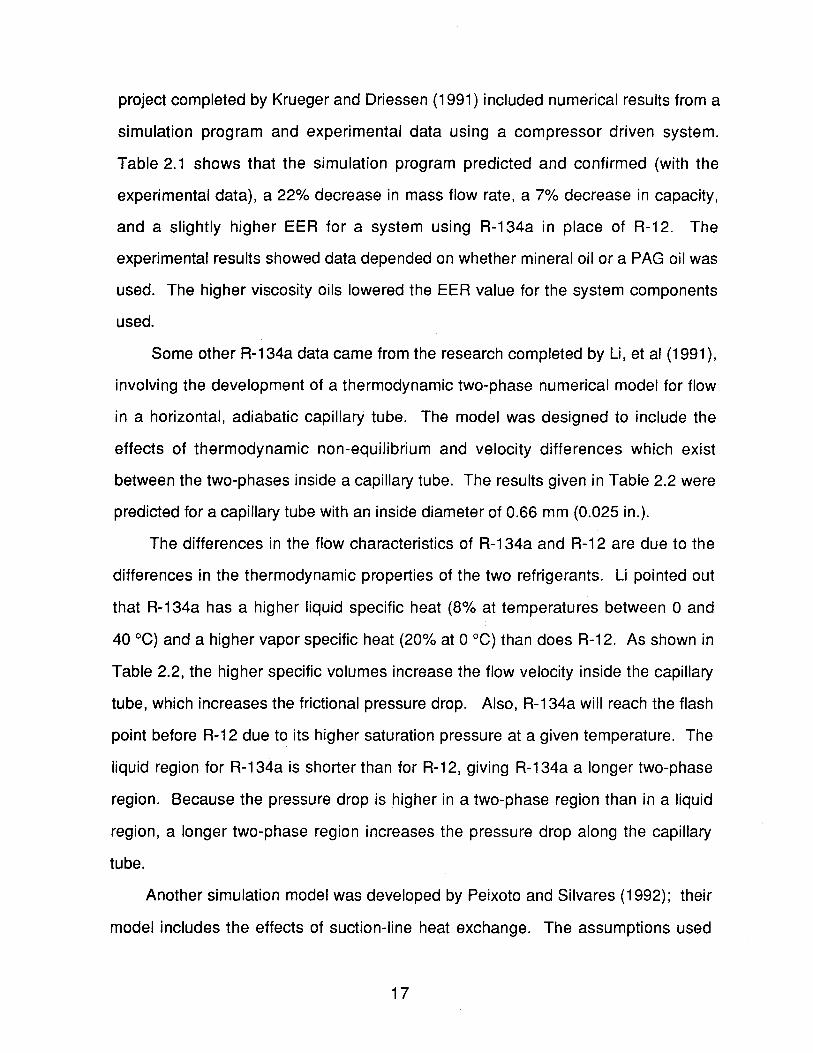
project completed by Krueger and Driessen (1991) included numerical results from a
simulation program and experimental data using a compressor driven system.
Table 2.1 shows that the simulation program predicted and confirmed (with the
experimental data), a 22% decrease in mass flow rate, a 7% decrease in capacity,
and a slightly higher EER for a system using R-134a in place of R-12. The
experimental results showed data depended on whether mineral oil or a PAG oil was
used. The higher viscosity oils lowered the EER value for the system components
used.
Some other R-134a data came from the research completed by Li, et al (1991),
involving the development of a thermodynamic two-phase numerical model for flow
in a horizontal, adiabatic capillary tube. The model was designed to include the
effects of thermodynamic non-equilibrium and velocity differences which exist
between the two-phases inside a capillary tube. The results given in Table 2.2 were
predicted for a capillary tube with an inside diameter of 0.66 mm (0.025 in.).
The differences in the flow characteristics of R-134a and R-12 are due to the
differences in the thermodynamic properties of the two refrigerants. Li pointed out
that R-134a has a higher liquid specific heat (8% at temperatures between 0 and
40°C) and a higher vapor specific heat (20% at 0 DC) than does R-12. As shown in
Table 2.2, the higher specific volumes increase the flow velocity inside the capillary
tube, which increases the frictional pressure drop. Also, R-134a will reach the flash
point before R-12 due to its higher saturation pressure at a given temperature. The
liquid region for R-134a is shorter than for R-12, giving R-134a a longer two-phase
region. Because the pressure drop is higher in a two-phase region than in a liquid
region, a longer two-phase region increases the pressure drop along the capillary
tube.
Another simulation model was developed by Peixoto and Silvares (1992); their
model includes the effects of suction-line heat exchange. The assumptions used
17
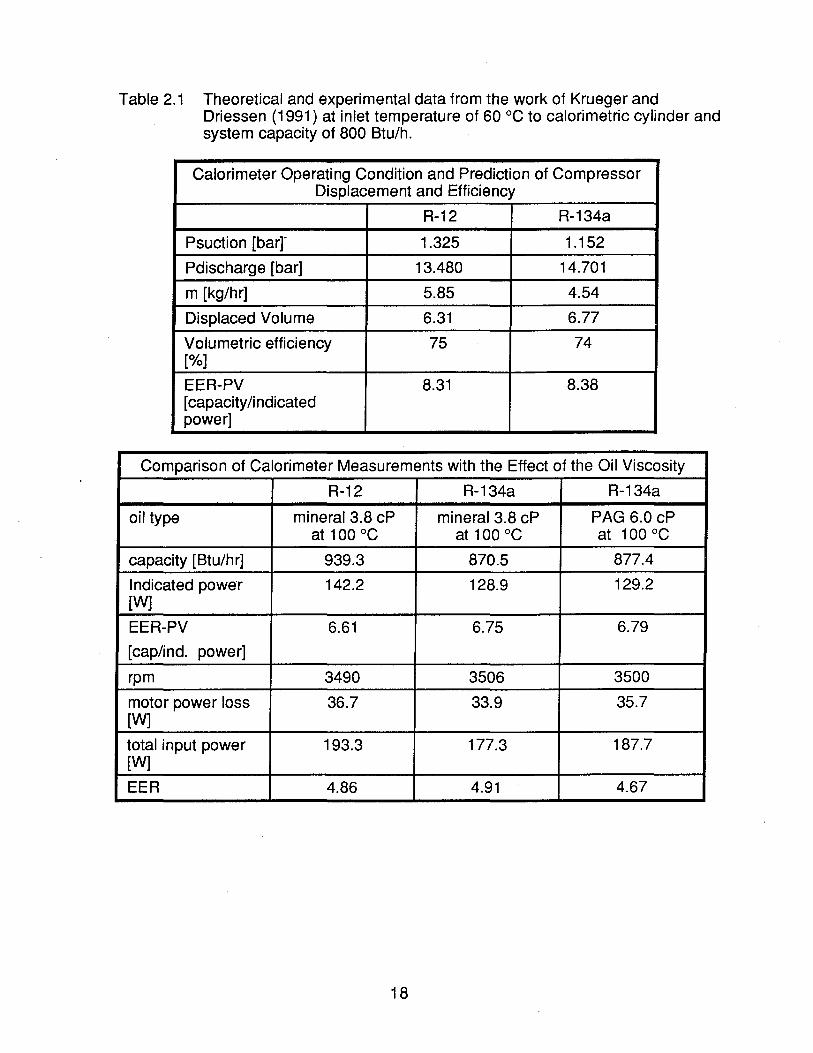
Table 2.1 Theoretical and experimental data from the work of Krueger and Driessen (1991) at inlet temperature of 60°C to calorimetric cylinder and system capacity of 800 Btu/h.
Calorimeter Operating Condition and Prediction of Compressor Displacement and Efficiency
R-12 R-134a
Psuction [barr 1.325 1.152
Pdischarge [bar] 13.480 14.701
m [kg/hr] 5.85 4.54
Displaced Volume 6.31 6.77
Volumetric efficiency 75 74 [%]
EER-PV 8.31 8.38 [capacity /i ndicated power]
Comparison of Calorimeter Measurements with the Effect of the Oil Viscosity
R-12 R-134a R-134a
oil type mineral 3.8 cP mineral 3.8 cP PAG 6.0 cP at 100°C at 100 °C at 100°C
capacity [Btu/hr] 939.3 870.5 877.4
Indicated power 142.2 128.9 129.2 [W]
EER-PV 6.61 6.75 6.79
[cap/indo power]
rpm 3490 3506 3500
motor power loss 36.7 33.9 35.7 [W]
total input power 193.3 177.3 187.7 [W]
EER 4.86 4.91 4.67
18
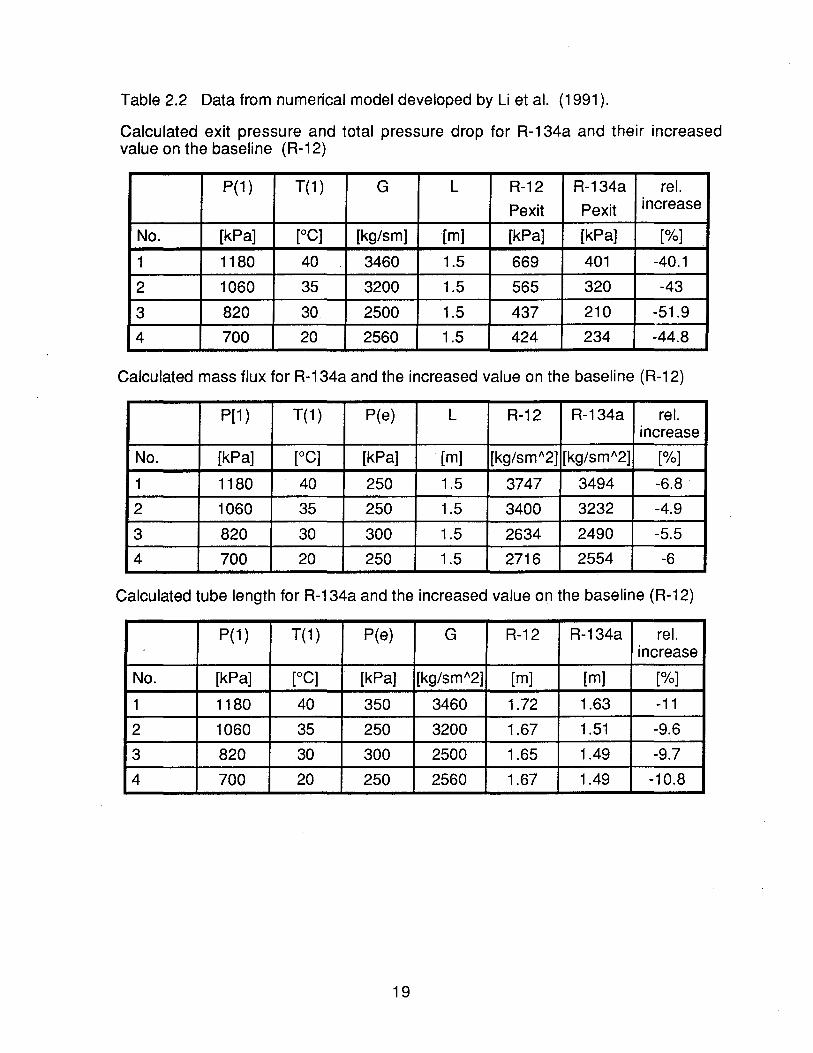
Table 2.2 Data from numerical model developed by Li et al. (1991).
Calculated exit pressure and total pressure drop for R-134a and their increased value on the baseline (R-12)
P(1 ) T(1 ) G L R-12 R-134a reI.
Pexit Pexit increase
No. [kPa] rOC] [kg/sm] [m] [kPa] [kPa] [%]
1 1180 40 3460 1.5 669 401 -40.1
2 1060 35 3200 1.5 565 320 -43
3 820 30 2500 1.5 437 210 -51.9
4 700 20 2560 1.5 424 234 -44.8
Calculated mass flux for R-134a and the increased value on the baseline (R-12)
P[1 ) T(1 ) P(e) L R-12 R-134a reI. increase
No. [kPa] [0C] [kPa] [m] [kg/smA2] [kg/smA2] [%]
1 1180 40 250 1.5 3747 3494 -6.8
2 1060 35 250 1.5 3400 3232 -4.9
3 820 30 300 1.5 2634 2490 -5.5
4 700 20 250 1.5 2716 2554 -6
Calculated tube length for R-134a and the increased value on the baseline (R-12)
P(1 ) T(1 ) P(e) G R-12 R-134a reI. increase
No. [kPa] [0C] [kPa] [kg/smA2] [m] [m] [%]
1 1180 40 350 3460 1.72 1.63 -11
2 1060 35 250 3200 1.67 1.51 -9.6
3 820 30 300 2500 1.65 1.49 -9.7
4 700 20 250 2560 1.67 1.49 -10.8
19
include: steady flow, pure refrigerant, thermodynamic equilibrium, homogeneous
two-phase flow and no heat exchange with the ambient. The suction-line heat
exchange effect was handled by dividing the capillary tube into three regions and
deriving equations for each. These regions include inlet and outlet regions not
soldered to the suction line, and the non-adiabatic region in contact with the suction
line. The mass flow is calculated as a function of the operating conditions and
geometric values for the capillary tube. The operating conditions include inlet and
outlet pressures, inlet subcooling or quality, and the geometric values which are
length and diameter of the capillary tube and suction line, and heat exchanger
location. The results show the mass flow of R-134a to be 5.0 % lower than R-12.
This result compares favorably to that of Li (1991), whose results showed an
approximate 10% decrease for cases not including suction-line heat exchange. The
Peixoto and Silvares (1992) model showed the effect of the suction-line heat
exchange to account for a 20% increase in mass flow rate for both refrigerants.
The conclusion that R-134a requires a lower mass flow rate for the same
cooling capacity as R-12 was also reported in the work by Wijaya (1991). Wijaya's
work represents the largest and possibly the only published data for R-134a flow
inside a capillary tube. Wijaya also observed that the differences in mass flow rate
became less obvious for shorter test sections and smaller inside tube diameters.
The testing apparatus was a compressor driven cycle using mineral oil with R-12
and modified PAG with R-134a. The following test conditions were used to generate
data: adiabatic (no suction-line heat exchange), sonic exit conditions, capillary tube
inside diameter equal to 0.031 in. and lengths of 5,6, 7, 8 and 10ft, and condensing
temperatures of 100 of to 130 of with 10°F to 30 of subcooling. The data collected
for these conditions is located in Appendix A. Table 2.3 represents Wijaya's
conclusions based on condensing temperature, inlet subcooling, and refrigerant
mass flow from his experimental data. The experimental data given in Table 2.4
20
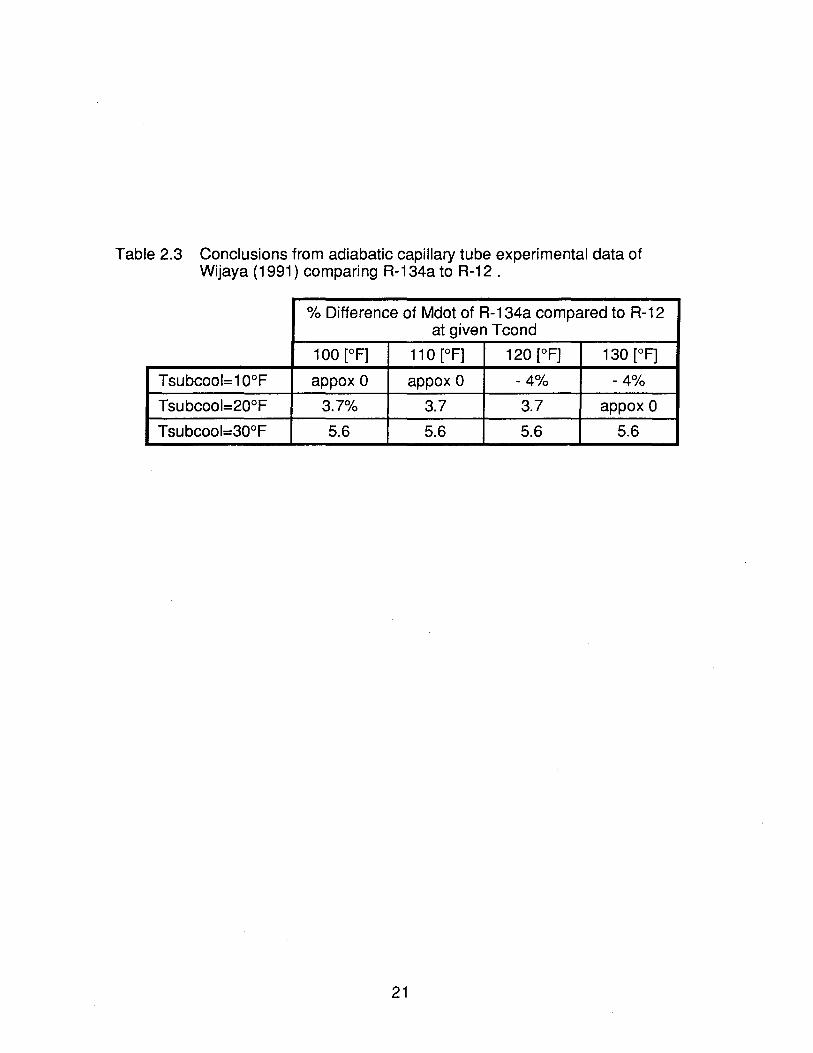
Table 2.3 Conclusions from adiabatic capillary tube experimental data of Wijaya (1991) comparing R-134a to R-12 .
% Difference of Mdot of R-134a compared to R-12 at given Tcond
100 [OF] 110 [OF] 120 [OF] 130 [OF]
Tsubcool=10°F appox 0 appox 0 - 4% - 4%
Tsubcool=20°F 3.7% 3.7 3.7 appox 0
Tsubcool=30°F 5.6 5.6 5.6 5.6
21
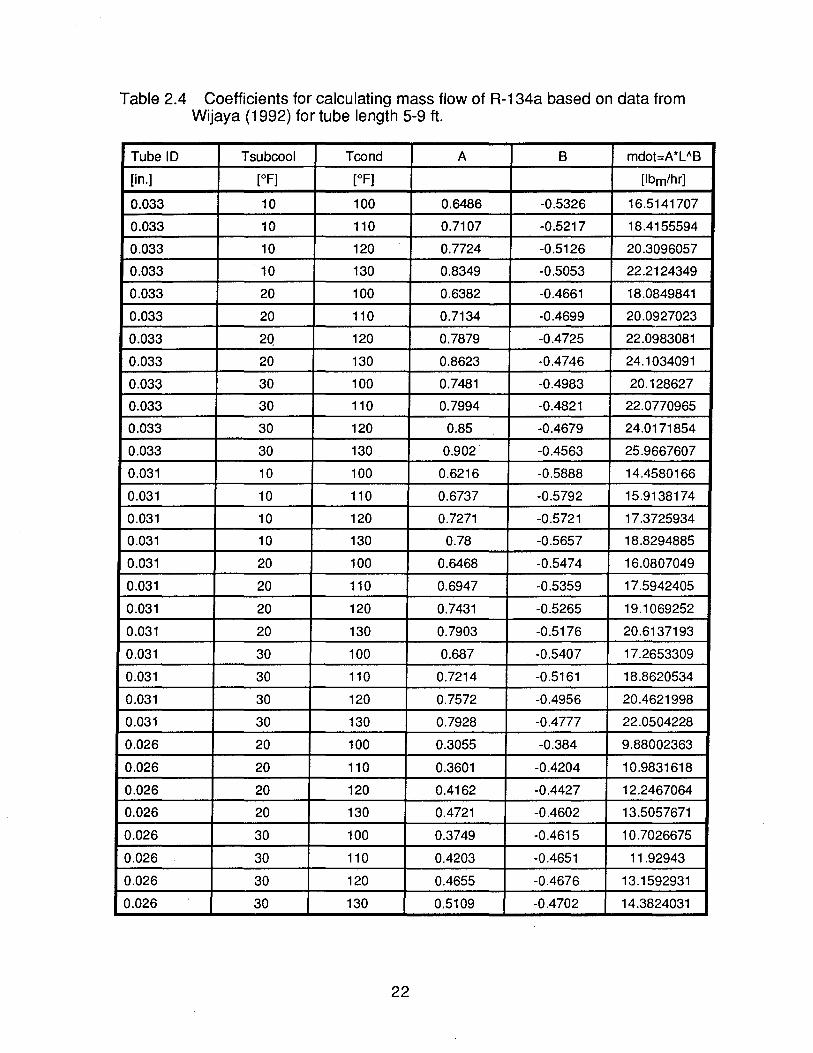
Table 2.4 Coefficients for calculating mass flow of R-134a based on data from Wijaya (1992) for tube length 5-9 ft.
TubelD Tsubcool Tcond A B mdot=A*L"B
[in.] [OF] [OF] [Ibm/hr]
0.033 10 100 0.6486 -0.5326 16.5141707
0.033 10 110 0.7107 -0.5217 18.4155594
0.033 10 120 0.7724 -0.5126 20.3096057
0.033 10 130 0.8349 -0.5053 22.2124349
0.033 20 100 0.6382 -0.4661 18.0849841
0.033 20 110 0.7134 -0.4699 20.0927023
0.033 20 120 0.7879 -0.4725 22.0983081
0.033 20 130 0.8623 -0.4746 24.1034091
0.033 30 100 0.7481 -0.4983 20.128627
0.033 30 110 0.7994 -0.4821 22.0770965
0.033 30 120 0.85 -0.4679 24.0171854
0.033 30 130 0.902· -0.4563 25.9667607
0.031 10 100 0.6216 -0.5888 14.4580166
0.031 10 110 0.6737 -0.5792 15.9138174
0.031 10 120 0.7271 -0.5721 17.3725934
0.031 10 130 0.78 -0.5657 18.8294885
0.031 20 100 0.6468 -0.5474 16.0807049
0.031 20 110 0.6947 -0.5359 17.5942405
0.031 20 120 0.7431 -0.5265 19.1069252
0.031 20 130 0.7903 -0.5176 20.6137193
0.031 30 100 0.687 -0.5407 17.2653309
0.031 30 110 0.7214 -0.5161 18.8620534
0.031 30 120 0.7572 -0.4956 20.4621998
0.031 30 130 0.7928 -0.4777 22.0504228
0.026 20 100 0.3055 -0.384 9.88002363
0.026 20 110 0.3601 -0.4204 10.9831618
0.026 20 120 0.4162 -0.4427 12.2467064
0.026 20 130 0.4721 -0.4602 13.5057671
0.026 30 100 0.3749 -0.4615 10.7026675
0.026 30 110 0.4203 -0.4651 11.92943
0.026 30 120 0.4655 -0.4676 13.1592931
0.026 30 130 0.5109 -0.4702 14.3824031
22
was also used to develop a series of curves fits for predicting the mass flow rate of
R-134a through capillary tubes of diameters of 0.033, 0.031 and 0.026 in. inside
diameters. The coefficients A and B from the following table are inserted in the
equation
m=ALB
to calculate the mass flow.
2.3 Suction-line Heat Exchange
Another objective of this project is to produce data using R-134a with suction
line heat exchange. Presently, the author is not aware of any existing data that
show the difference between adiabatic and non-adiabatic flow using R-134a. The
data that exist are for R-12, the standard refrigerant used in domestic refrigeration
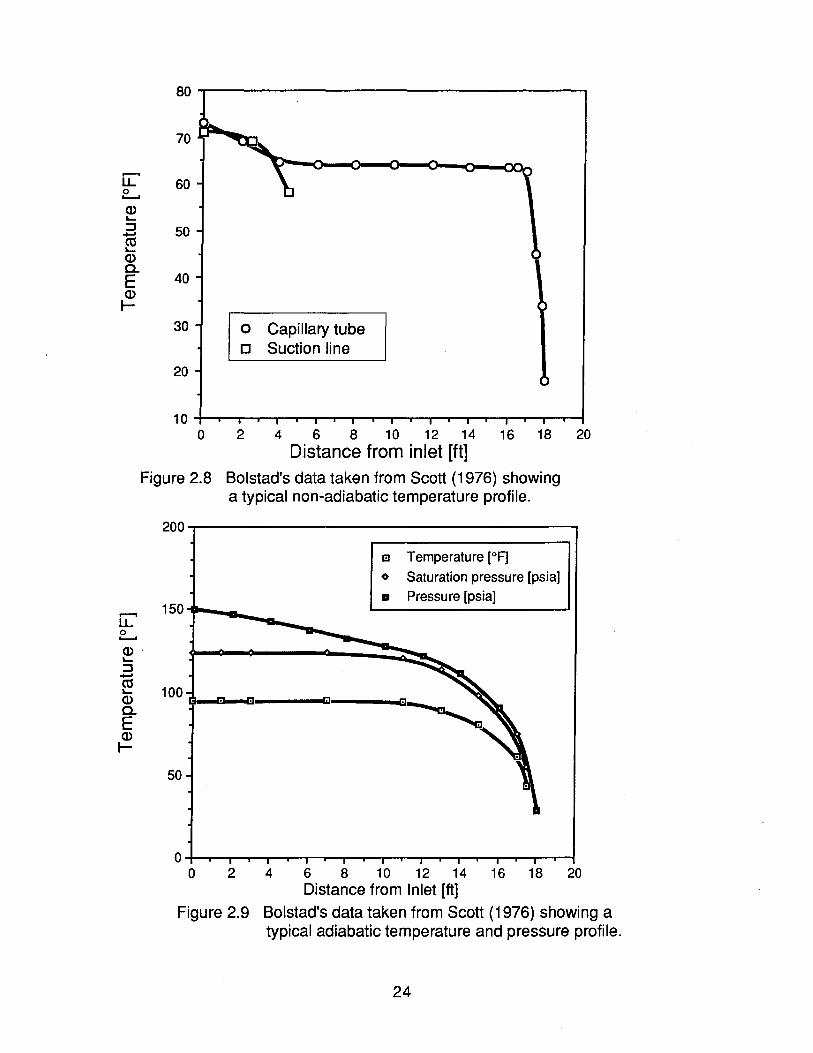
today. Figures 2.8 and 2.9 show the typical temperature profiles recorded by
Bolstad (1949) and presented by Scott (1976) for non-adiabatic and adiabatic flow.
Bolstad's data were taken using capillary tube diameters of 0.026 to 0.055 in. and
lengths of 6, 12 and 18 ft with a 28 in. of the capillary tube soldered to the suction
line to create the heat exchanger.
An extensive experimental and theoretical analysis of suction-line heat
exchange was presented in the Ph.D. thesis by Pate (1982) and in a report by Pate
and Tree (1983). The latter data were taken for a suction-line heat exchanger of
varying lengths and locations along the capillary tube, varying inlet pressures and
varying inlet subcooling. The results given show a 20% increase in flow rate due to
the cooling provided by the heat exchange. This is due to a lower flow restriction
associated with delayed flashing of the liquid refrigerant to two-phase. Locating a
heat exchanger of half the length of the original heat exchanger (which was the
same length at the capillary tube) at the inlet of the capillary tube resulted in no
23
80
70
........ LL 60 0 ........ 0) "-::J 50 -CU "-0) 0-E 40 0)
r-30 o Capillary tube
o Suction line
20
10 0 2 4 6 8 10 12 14 16 18 20
Distance from inlet [ttl Figure 2.8 Bolstad's data taken from Scott (1976) showing
a typical non-adiabatic temperature profile.
[L o ........ 0)' "-::J
200
150, ........... _
III Temperature [oF] o Saturation pressure [psia]
• Pressure [psia]
CtS "- 1 00 0) ~~~~-----~]----__ ~, 0-E 0)
r-50
O~~,-~~~.-r-r-r-~~~-,~-,~~~-;
o 2
Figure 2.9
4 6 8 10 12 14 16 18 20 Distance from Inlet [ft]
Bolstad's data taken from Scott (1976) showing a typical adiabatic temperature and pressure profile.
24
apparent change in mass flow. However, the same heat exchanger located at the
outlet of the capillary tube resulted in a 10 to 15% decrease in mass flow from the
original heat exchanger. Virtually no effect on the mass flow rate was observed for
heat exchanger lengths ranging from full length to half the full length. The mass flow
rate decreased for heat exchange length less than half the tube length.
25
3. DESIGN OF EXPERIMENTAL APPARATUS
3.1 Experimental System
3.1.1 R-12/R-134a Experimental Loop
The experimental apparatus designed to acquire data on capillary-tube flow
consists of three different interconnected loops. The three loops are (a) the main
loop which uses R-12 or R-134a, (b) the pressure tank loop which uses ethylene
glycol, and (c) the cooling loop which uses R-502. The main loop is designed to
simulate the inlet and outlet refrigerant conditions typically seen in a domestic
refrigerator. However, the main loop differs from a standard refrigeration cycle in the
methods used to achieve these conditions. A standard vapor-compression
refrigeration cycle uses a compressor to produce mass flow and create the needed
pressure difference across the capillary tube. The experimental apparatus
developed for this project uses a pump instead of a compressor to accomplish the
desired test conditions for two reasons. The first and main reason is that a standard
compressor requires the addition of oil to the refrigerant to operate properly, and oil
free compressors are very expensive and largely unprovened with R-134a. By using
a pump, we avoid the addition of oil to the system, allowing us to test pure
refrigerants. The second reason is that pumps are generally easier to regulate than
are compressors. Another difference between a pump and compressor system is
that the refrigerant must enter the compressor as a gas to function properly whereas
a pump requires a liquid. For this reason, a pump cannot be used in place of a
compressor in a standard vapor-compression cycle. However, a pump can be used
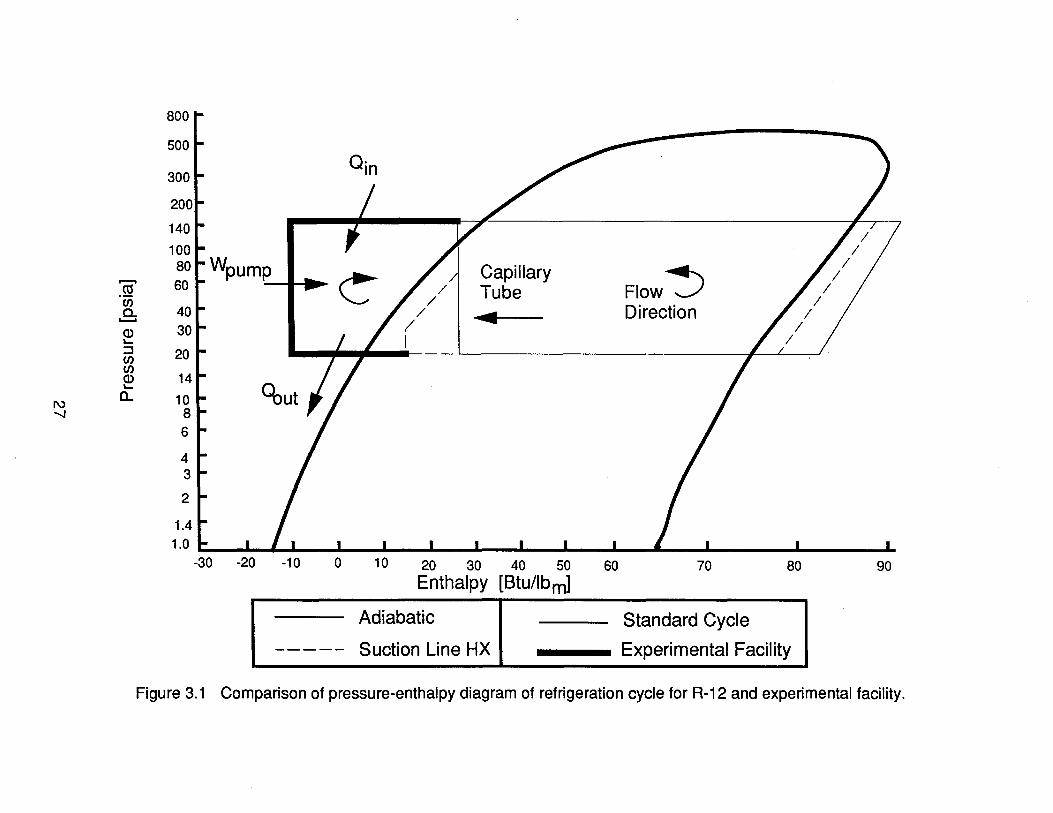
in the cycle displayed on the P-h diagram in Figure 3.1. A standard vapor
compression cycle is drawn with the experimental cycle used by the test apparatus.
The capillary-tube test section operates along the same line on the P-h diagram for
26
I\)
""
.--.
.~ (/) a. .......... Q) ~
::J (/) (/) Q) ~
a..
800
500
300
60 ~ 40
20
6
Qin
TC~/1 Capillary Tube ~
-30 -20 -10 o 10 20 30 40 50 Enthalpy [Btu/Ibm]
Adiabatic
----- Suction Line HX
60
FIOW~ Direction
70 80
Standard CyCle
Experimental Facility
90
Figure 3.1 Comparison of pressure-enthalpy diagram of refrigeration cycle for R-12 and experimental facility.
both cycles with the refrigerant entering at a set subcooled temperature and exiting
in the two-phase region. The two cycles differ in the conditions imposed on the
refrigerant after leaving the test section. The experimental loop operates more in the
subcooled-liquid region instead of the two-phase and superheated-vapor region as
with the standard cycle. In the experimental cycle, the refrigerant leaves the test
section and is cooled at constant pressure to a subcooled liquid. This cooling
process is used to ensure that only liquid enters the pump before increasing the
refrigerant pressure to the desired value at the inlet of the test section. After the
desired pressure value is reached, heat is added to the refrigerant to reduce the
amount of subcooling until the desired inlet temperature is achieved. The refrigerant
then enters the test section, and the cycle is repeated.
The cycle drawn in Figure 3.1 is for adiabatic operation of a capillary tube. This
configuration is not very common because most domestic refrigerators use suction
line heat exchange. Suction-line heat exchange is achieved by soldering the
capillary tube to the suction line located between the evaporator and compressor in
a standard cycle in a counterflow configuration. Energy is transferred from the
refrigerant in the capillary tube to the superheated vapor in the suction line. The
refrigerant enters the capillary tube subcooled and passes into the two-phase region
as the pressure is decreased. Thermodynamically, this type of heat transfer is
termed non-evaporative heat exchange. The advantages of suction-line heat
exchange is that the amount of subcooling at the entrance of the capillary tube is
increased, which, in turn, increases the specific enthalpy change in the evaporator.
This change in the standard vapor-compression cycle is shown in Figure 3.2. The
suction-line heat exchange decreases the exit quality at the capillary tube outlet.
The disadvantage is that the higher superheat of the vapor at the inlet of the
compressor may increase the specific work of the compressor. The work done by
Vakil (1983) shows that the use of a suction-line heat exchange is beneficial only if
28
800
Qin
-20 -10 o 10 20 30 40 50
Enthalpy [Btu/lb ml Adiabatic
----- Suction Line HX
60 70 80
Standard Cycle
Experimental Facility
90
Figure 3.2 Comparison of pressure-enthalpy diagram of refrigeration cycle of R-12 and experimental facility including heat addition from suction-line heat exchange system.
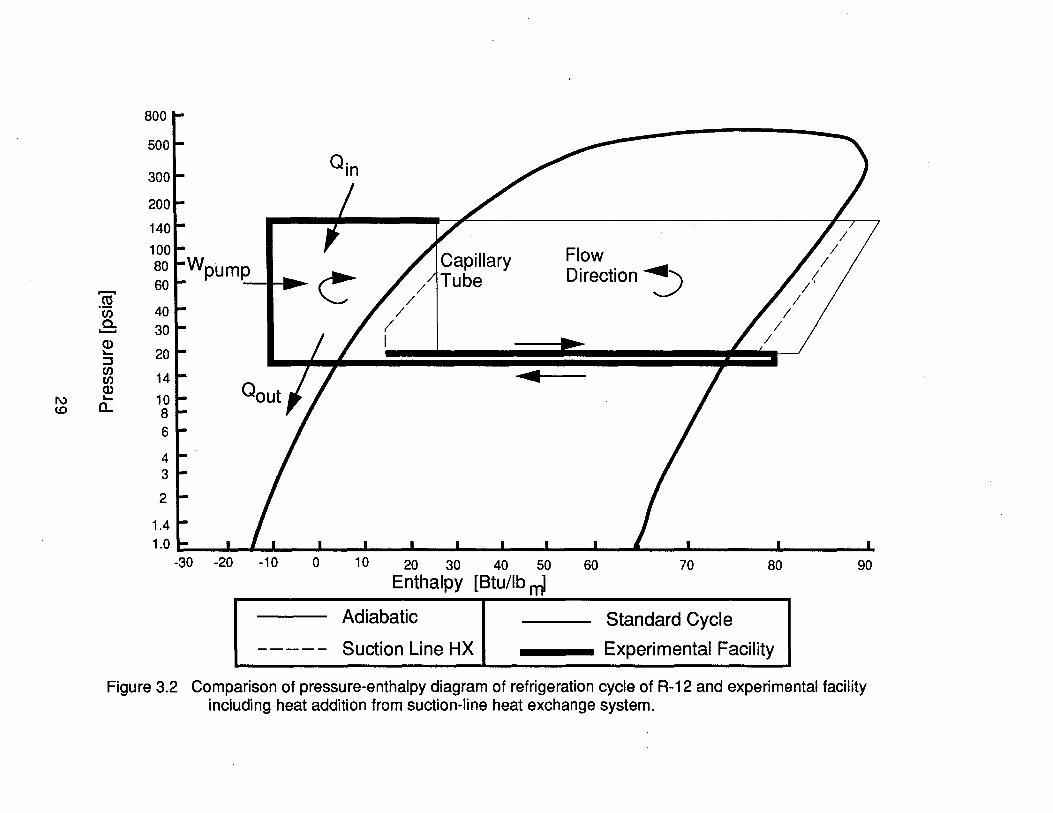
the increase of the specific enthalpy change in the evaporator is greater than the
increase of the specific work in the compressor. The conventional suction-line heat
exchange system is not possible in the experimental apparatus due to the lack of an
evaporator and a compressor. Instead, the suction line is simulated in the
experimental apparatus by heating the refrigerant leaving the pressure tank to a
superheated vapor, as shown in Figure 3.2. The vapor passes through a copper
tubing soldered to the capillary tube which represents the suction line. The
superheated vapor is then cooled to a subcooled liquid before entering the pump.
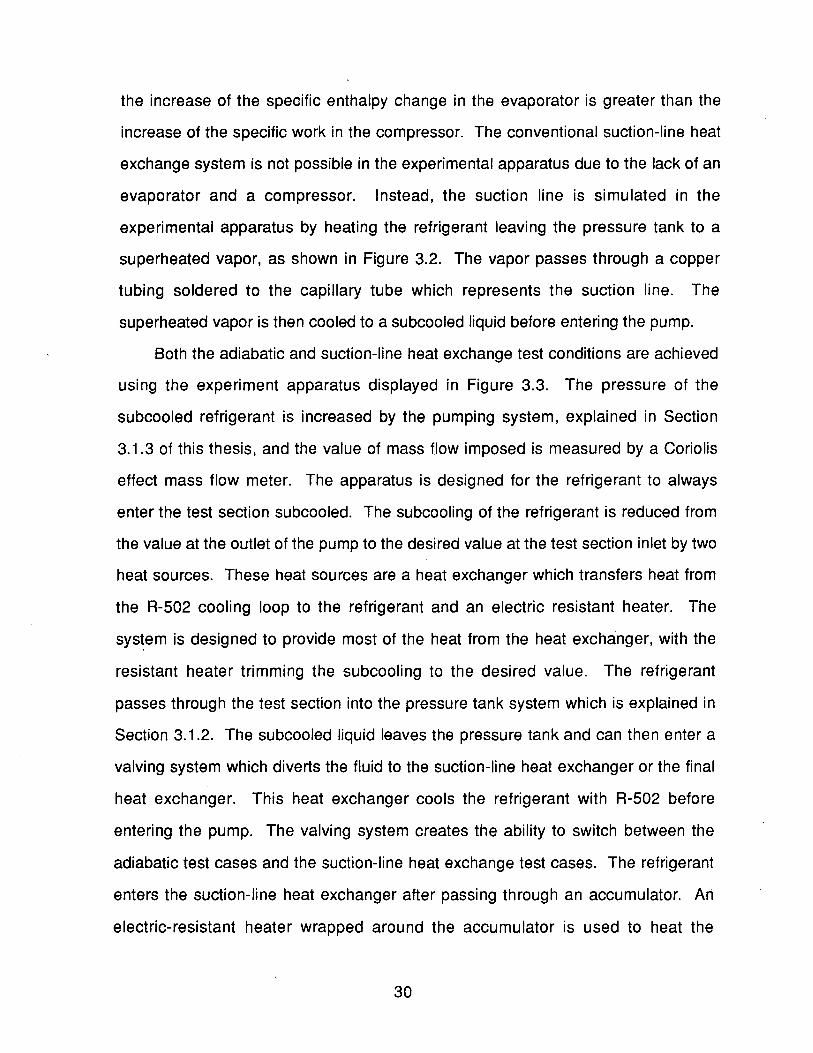
Both the adiabatic and suction-line heat exchange test conditions are achieved
using the experiment apparatus displayed in Figure 3.3. The pressure of the
subcooled refrigerant is increased by the pumping system, explained in Section
3.1.3 of this thesis, and the value of mass flow imposed is measured by a Coriolis
effect mass flow meter. The apparatus is designed for the refrigerant to always
enter the test section subcooled. The subcooling of the refrigerant is reduced from
the value at the outlet of the pump to the desired value at the test section inlet by two
heat sources. These heat sources are a heat exchanger which transfers heat from
the R-502 cooling loop to the refrigerant and an electric resistant heater. The
sys~em is designed to provide most of the heat from the heat exchanger, with the
resistant heater trimming the subcooling to the desired value. The refrigerant
passes through the test section into the pressure tank system which is explained in
Section 3.1.2. The subcooled liquid leaves the pressure tank and can then enter a
valving system which diverts the fluid to the suction-line heat exchanger or the final
heat exchanger. This heat exchanger cools the refrigerant with R-502 before
entering the pump. The valving system creates the ability to switch between the
adiabatic test cases and the suction-line heat exchange test cases. The refrigerant
enters the suction-line heat exchanger after passing through an accumulator. An
electric-resistant heater wrapped around the accumulator is used to heat the
30
CAl ........
Heater Sight glass
Suction-line heat exchange system
R-502 t Cold HX C
Pressure tank
--.. II" eo _ .sa Three-way valves
tR-5t
Flow meter
Liquid
HotHX
Pumping system ---,---=1"
Bladder I accumulator
L.. j
Figure 3.3 Capillary system diagram for testing Refrigerant 134a.
refrigerant to a superheated vapor before entering the suction-line heat exchanger.
The valve system also includes the ability to divert flow to a coil in the chilled
pressure tank before entering the heat exchanger in order to boost the subcooling of
the refrigerant if the heat exchanger cannot provide low enough refrigerant
temperatures. Also included in the system are sight glasses to visually check the
various flow regimes at the test section inlet and outlet and suction-line heat
exchange. A Campbell 21 X data acquisition system is used to record temperature
and pressure values for the main loop and the cooling loop.
The capillary tube in most domestic refrigerators and air conditioners is inserted
into the system by crimping the larger supply and exit copper tubing around the ends
of the capillary tube, then soldering to prevent refrigerants leaks. This method
makes changing the capillary tube difficult, and the non-uniformity of the crimping
creates entrance effects which are very difficult to characterize. Our experimental
apparatus was designed so that the test section could be changed with a minimum
amount of effort and to provide a uniform entrance. The copper tube and capillary
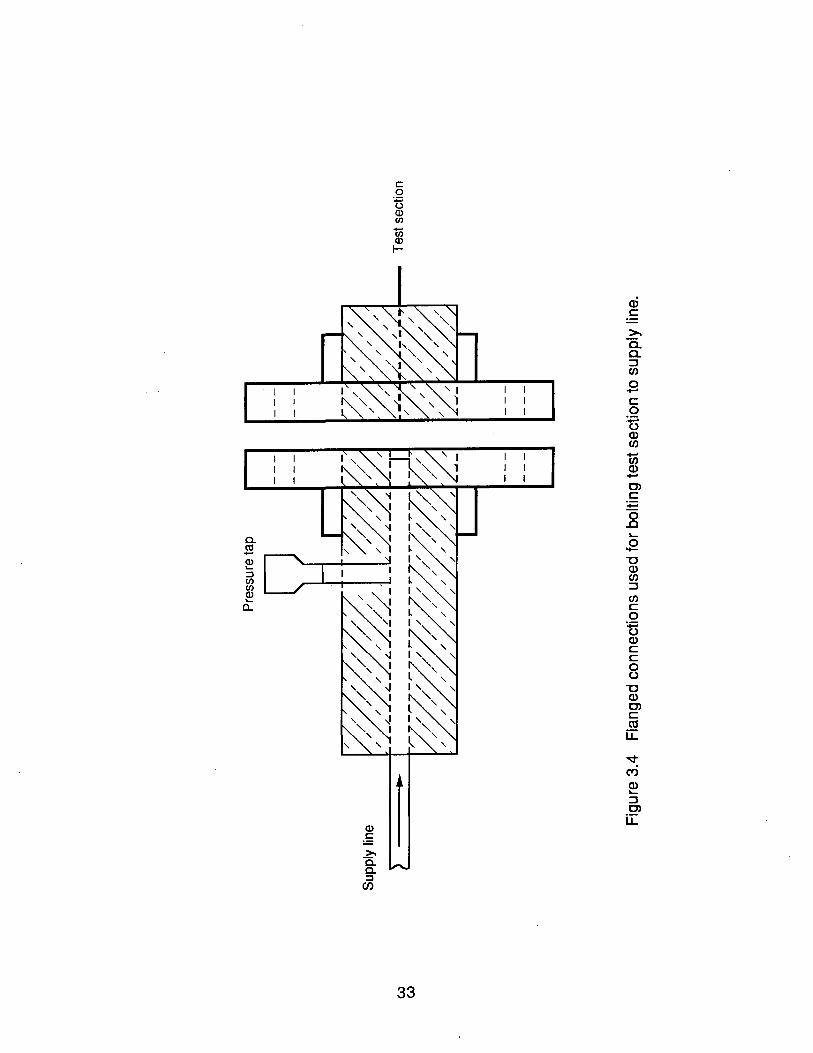
tube are inserted into axially drilled holes in solid copper rod. Figure 3.4 shows that
the rod used for the test section is approximately 1 in. long, and the rod for the
supply line is 1.5 in. long to allow for a pressure tap. These rods are slipped into a
sleeve on a flange and brazed to the flange to create a leak proof seal. A Buna N
gasket is placed between the two flanges before inserting bolts to decrease the
occurrence of leaks. Using the same process for the exit of the test section and
return line allows easy and quick changes of test sections of different diameter
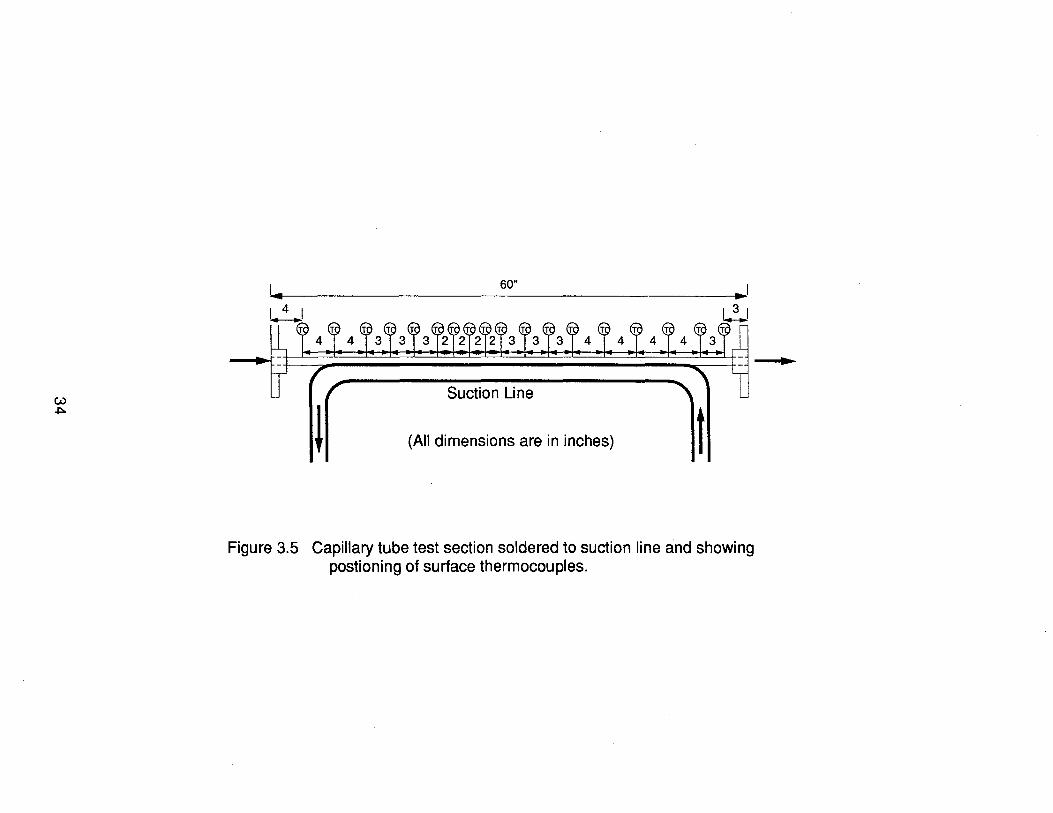
capillary tubes. The flanges are also shown in a schematic of a test section in
Figure 3.5. Included in the drawing is the positioning of surface thermal couples on
the capillary tube, and the suction-line heat exchanger which is created by soldering
the capillary tube onto the suction-line.
32
Q)
.~
>-a. a. ~
CJ)
c .2 t5 (l) III
(j) (l) I-
1
33
cD c
>. a. a. :J CJ)
0 ..-c 0
-.;:; 0 Q) CJ) ..-CJ) Q) ..-0) c
-.;:; 0 .0 ..... 0 -"0 Q) CJ) :J CJ) C 0
U Q) c c 0 0 "0 Q) 0) c CU U.
~
M Q) ..... :J 0)
u:::
w ~
Suction Line
l (All dimensions are in inches) t
Figure 3.5 Capillary tube test section soldered to suction line and showing postioning of surface thermocouples.
•
3.1.2 Pressure Control Tank Design
Refrigerant test systems, like the apparatus used for this project, require the
use of a pressure setting device to set either the inlet or outlet pressure of the test
section. The most common method, employed by Pate and Tree (1983), uses a
bladder accumulator to set the inlet pressure. A bladder accumulator uses a steel
shell into which a rubber bladder is inflated to a set pressure. The refrigerant fills the
shell around the bladder and it tends to equalize to the pressure of the inflated
bladder. The volume of the shell must be approximately five times the volume of
refrigerant in the system to function properly. The accumulator also dampens out
pressure fluctuations during operation.
Instead of using a bladder accumulator, our system was designed to control
system pressure without requiring the large increase in system volume associated
with the bladder accumulator. The system uses a pressure regulating tank
downstream of the outlet of the test section. This system sets the outlet pressure,
and the inlet pressure is then determined by the mass flow rate and outlet pressure.
Our design is similar the method used by Dudley (1962) for his visualization studies
of two-phase flow in capillary tubes. Our method differs from that of Dudley's in that
our system is a closed circulating loop and his was a blow-down system. The basic
principle of the pressure tank is that the refrigerant pressure can be held constant if
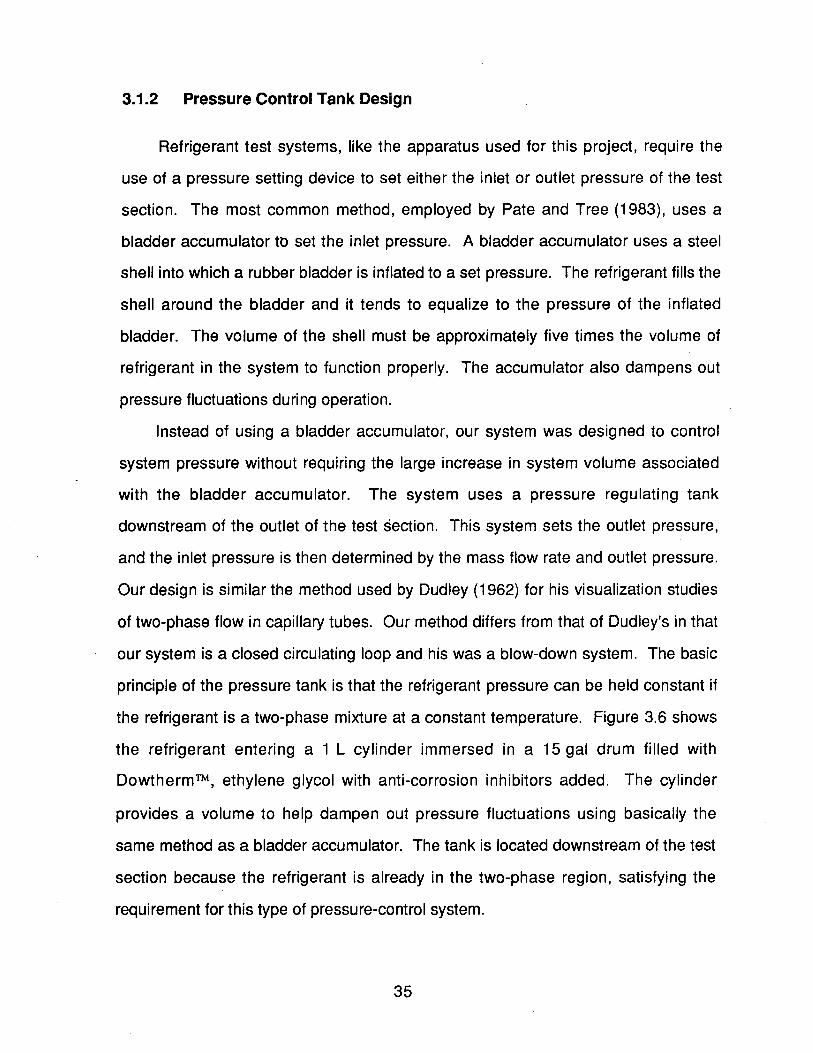
the refrigerant is a two-phase mixture at a constant temperature. Figure 3.6 shows
the refrigerant entering a 1 L cylinder immersed in a 15 gal drum filled with
Dowtherm™, ethylene glycol with anti-corrosion inhibitors added. The cylinder
provides a volume to help dampen out pressure fluctuations using basically the
same method as a bladder accumulator. The tank is located downstream of the test
section because the refrigerant is already in the two-phase region, satisfying the
requirement for this type of pressure-control system.
35
~ :::J
~ Q) a. E Q)
I.::t:. c: as I-
---.. ======::;I!~ R-502 HX C
~==:::::! Dowtherm
R-134a ---..
R-502 ---..
HXB
Pump
Figure 3.6 Pressure tank system using Dowtherm as heat transfer fluid.
50,----------------------------------------,
40 0
30 -o
o 20
o
o
10 -
0-
o o
o o
00 00
00 00000 0
000000000000000
-10~--~~---r-1---r----r-1--~----.1----~--~
o 100 200 300 400
Time [minutes]
Figure 3.7 Time history of decrease of the temperature of Dowtherm in pressure tank sytem.
36
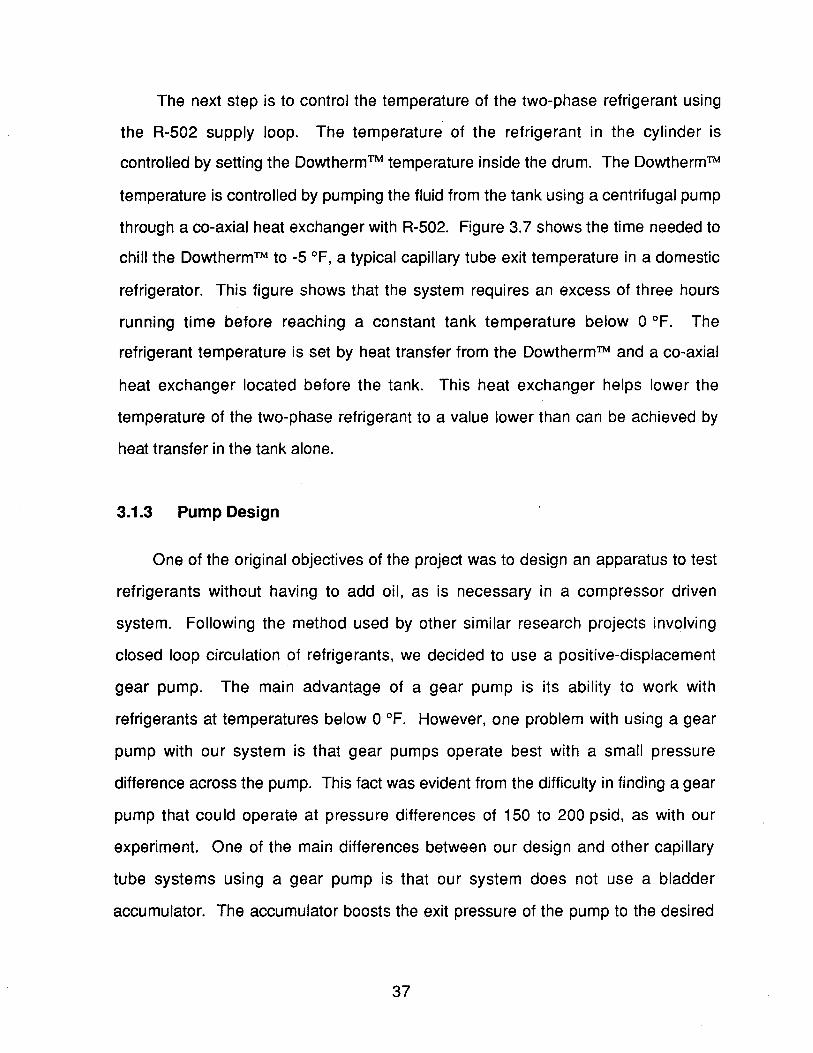
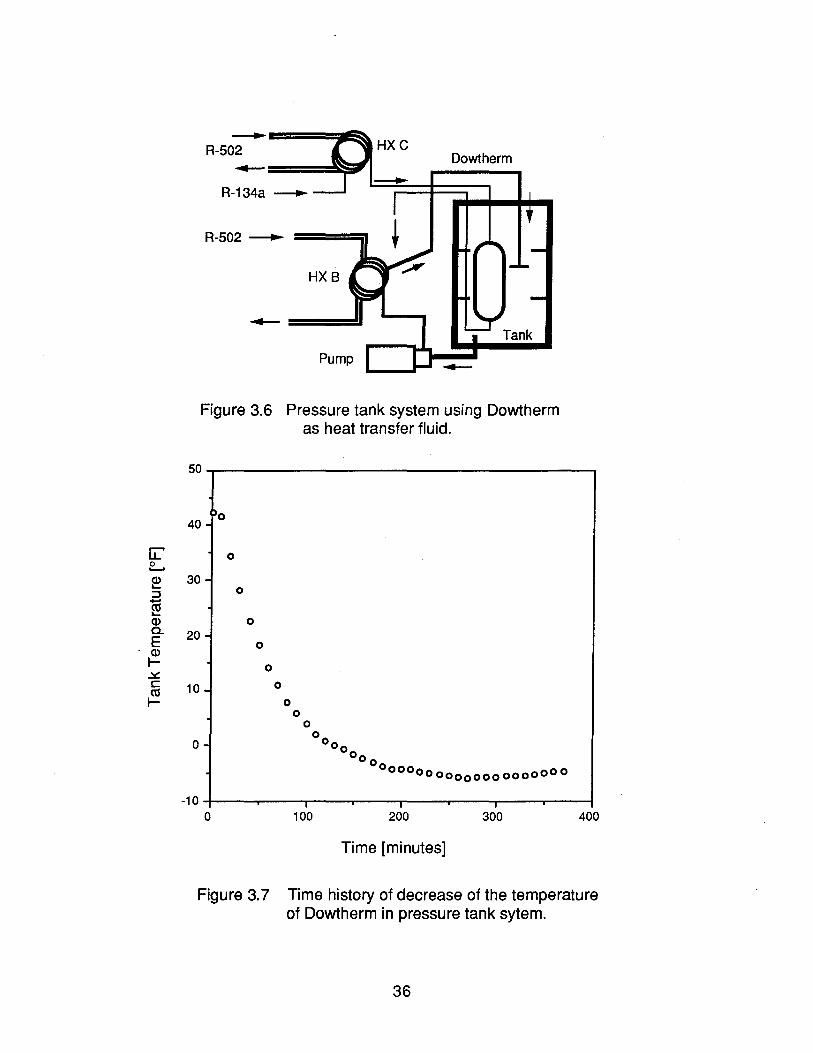
The next step is to control the temperature of the two-phase refrigerant using
the R-502 supply loop. The temperature of the refrigerant in the cylinder is
controlled by setting the Dowtherm™ temperature inside the drum. The Dowtherm™
temperature is controlled by pumping the fluid from the tank using a centrifugal pump
through a co-axial heat exchanger with R-502. Figure 3.7 shows the time needed to
chill the DowthermTM to -5 of, a typical capillary tube exit temperature in a domestic
refrigerator. This figure shows that the system requires an excess of three hours
running time before reaching a constant tank temperature below 0 OF. The
refrigerant temperature is set by heat transfer from the Dowtherm™ and a co-axial
heat exchanger located before the tank. This heat exchanger helps lower the
temperature of the two-phase refrigerant to a value lower than can be achieved by
heat transfer in the tank alone.
3.1.3 Pump Design
One of the original objectives of the project was to design an apparatus to test
refrigerants without having to add oil, as is necessary in a compressor driven
system. Following the method used by other similar research projects involving
closed loop circulation of refrigerants, we decided to use a positive-displacement
gear pump. The main advantage of a gear pump is its ability to work with
refrigerants at temperatures below 0 OF. However, one problem with using a gear
pump with our system is that gear pumps operate best with a small pressure
difference across the pump. This fact was evident from the difficulty in finding a gear
pump that could operate at pressure differences of 150 to 200 psid, as with our
experiment. One of the main differences between our design and other capillary
tube systems using a gear pump is that our system does not use a bladder
accumulator. The accumulator boosts the exit pressure of the pump to the desired
37
inlet pressure of the test section. Due to the lack of an accumulator, the gear pump
in our system must boost the pressure to the value at the inlet of the test section.
We were able to collect data using a specially ordered variable speed pump
which could meet the pressure requirements and the mass flow rates of 5-30 Ibm/hr.
Unfortunately, early test runs using this pump produced unsatisfactory results. The
experimental apparatus was designed to sufficiently subcool the refrigerant in the
heat exchanger from the R-502 loop to ensure a liquid head at the pump entrance.
A loss of liquid rendered the pump incapable of pumping the refrigerant. But, without
a pressure difference in the system, the refrigerant would not circulate through the
heat exchanger. These facts made initial start up of the loop very difficult. The only
successful method of establishing a constant flow rate was to turn the pump on while
adding a small amount of charge between the test section outlet and pump inlet.
This pressure boost would induce flow and the pump would be able to increase the
liquid refrigerant pressure to maintain flow. Maintaining a constant flow rate was
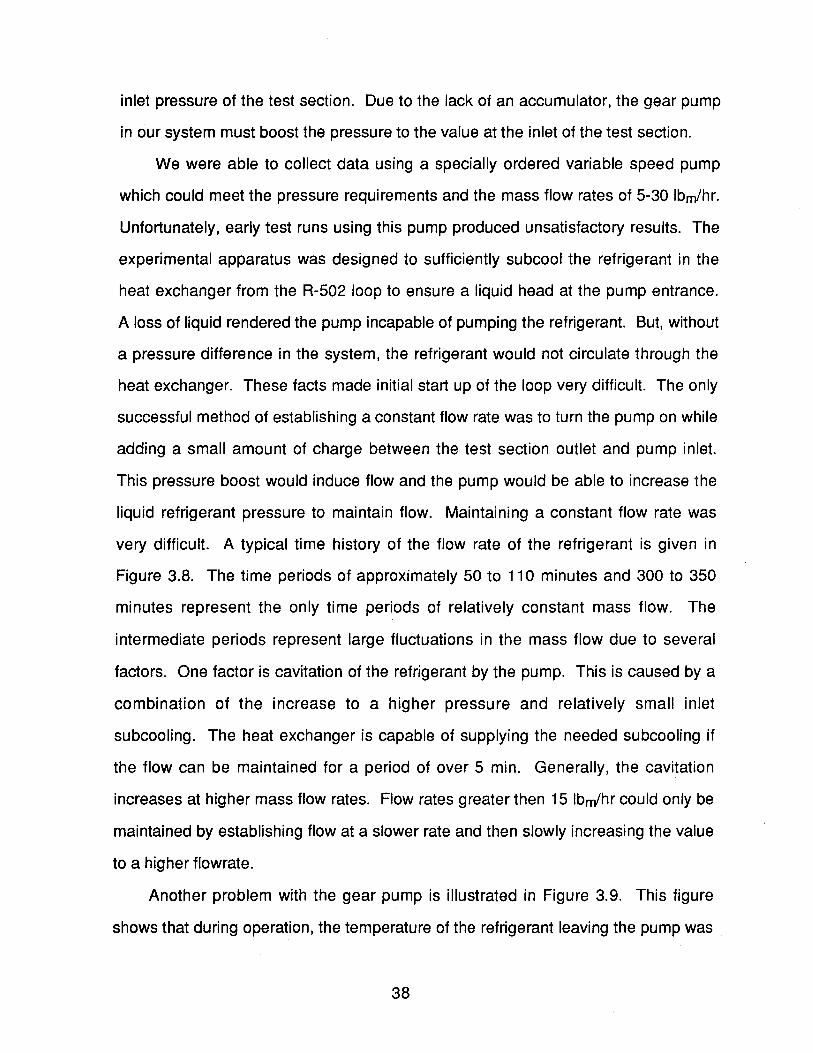
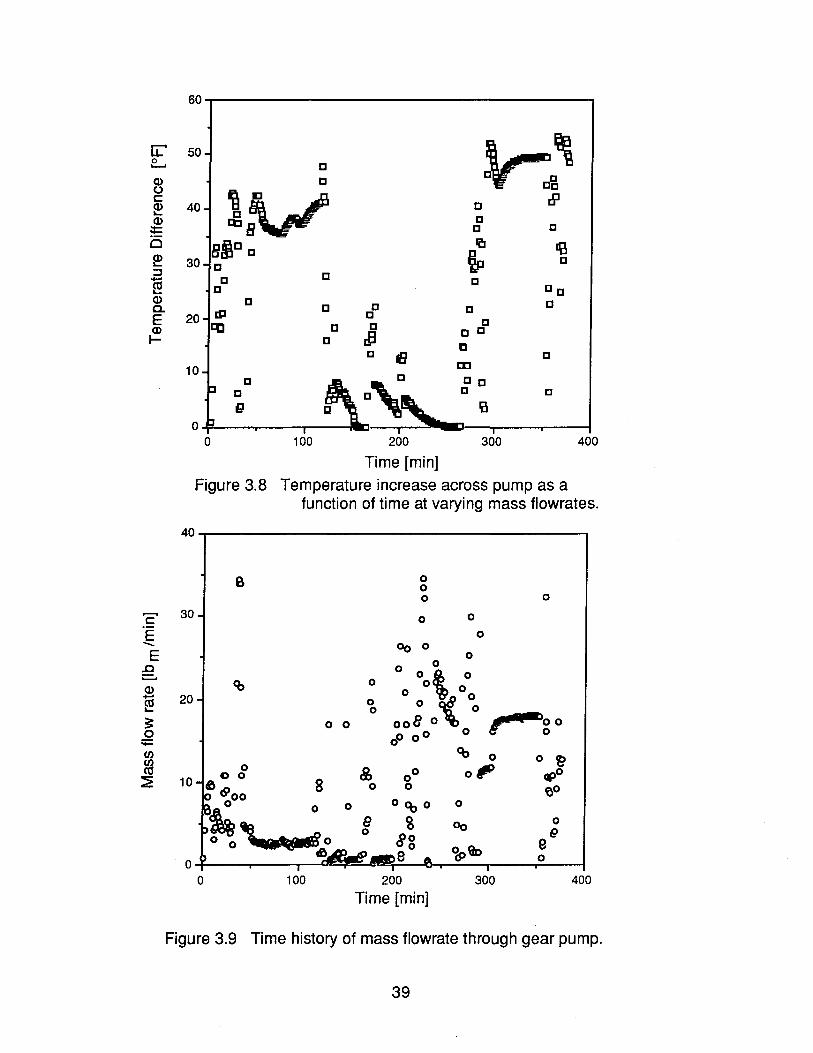
very difficult. A typical time history of the flow rate of the refrigerant is given in
Figure 3.8. The time periods of approximately 50 to 110 minutes and 300 to 350
minutes represent the only time periods of relatively constant mass flow. The
intermediate periods represent large fluctuations in the mass flow due to several
factors. One factor is cavitation of the refrigerant by the pump. This is caused by a
combination of the increase to a higher pressure and relatively small inlet
subcooling. The heat exchanger is capable of supplying the needed subcooling if
the flow can be maintained for a period of over 5 min. Generally, the cavitation
increases at higher mass flow rates. Flow rates greater then 15 Ibm/hr could only be
maintained by establishing flow at a slower rate and then slowly increasing the value
to a higher flowrate.
Another problem with the gear pump is illustrated in Figure 3.9. This figure
shows that during operation, the temperature of the refrigerant leaving the pump was
38
IJ:' 0 ........ Q) 0 c Q) .... Q) --is ~ ::l +-'
~ Q) 0-E Q)
l-
C E -E .0 .......... Q)
ro .... ~ 0
;;::: C/)
m ::E
60
50 ~, e e
lV dl 40. e e e e
8~e e rc IB 30 e ~ e
e e e e ee e e e e e
20- Ell e ~ e e e e e
e JJ ID e e e cc 10
p e
~~ ee
e e e g e
o !J I i i I
0 100 200 300 400
Time [min]
Figure 3.B Temperature increase across pump as a function of time at varying mass flowrates.
40~---------------------------------------------------------------------------------,
0 0 0 0
30 0 0
0 00 0
0 0
o 0 \ 0 0 o 0 20 0 o 0 ~ 00 0 -o 0 008 0 r £ '00
o 0 0 0 0 0
Cb 0 0 ~ 8, 0
0 0' .,0 10 8 0 0 fP
0 0
e 00 0 0 e
~9c e
0 0
0 100 200 300 400
Time [min]
Figure 3.9 Time history of mass flowrate through gear pump.
39
much higher than at the entrance. At times, the temperature increase could exceed
40 of. The temperature increase did reduce the amount of heat transfer required to
get the refrigerant to the desired inlet temperature. The problem with the
temperature increase was that the amount of subcooling had to be increased to
compensate for the pump heat addition. If the subcooling was not great enough to
prevent the formation of a gas phase refrigerant due to cavitation or heat addition in
the pump, flashing would occur at the pump exit. The presence of a two-phase
mixture made reading the mass flow rate impossible and also prevented the pump
from working properly. Heated gas would flow from the pump in reverse direction,
warming the inlet liquid to a two-phase mixture and preventing the pump from
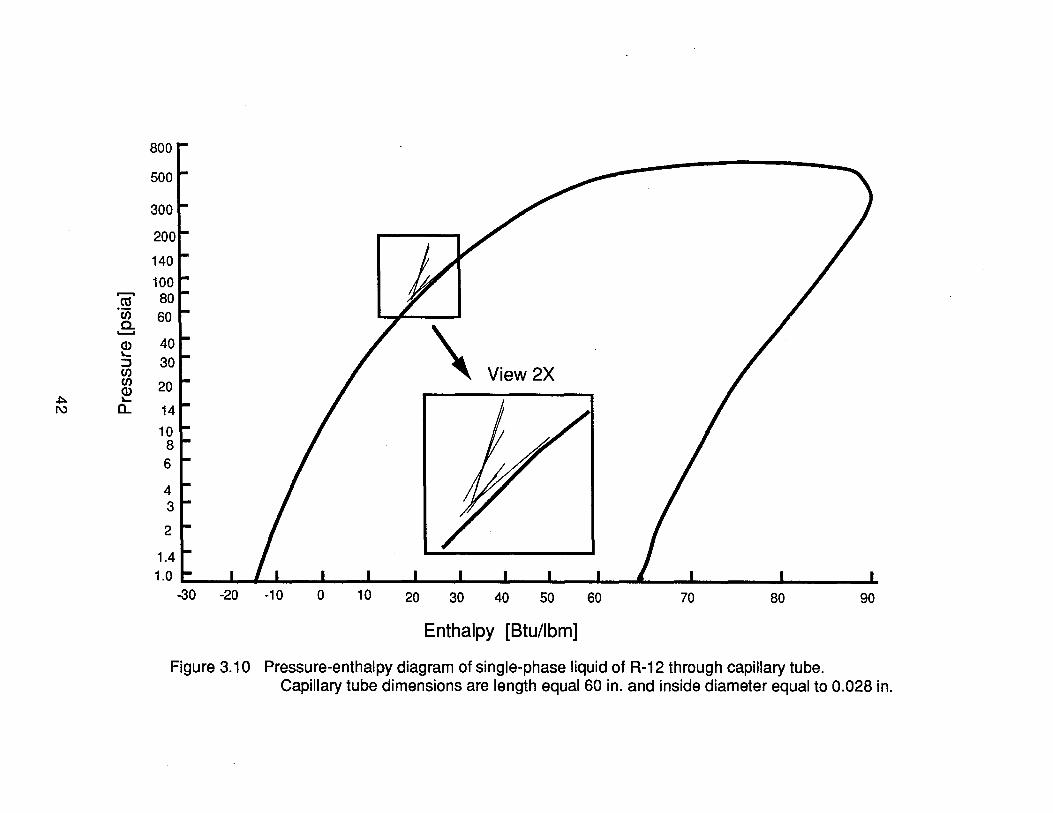
supplying a driving pressure for the system. At the intervals when a constant flow
rate was established, the data taken represented another problem. These data are
presented in Table 3.1 and were used to produce Figure 3.10, which charts the
pressure drop through a 60 in. long capillary tube test section of inside diameter of
0.028 in. A total of seven cases at varying mass flow rates and test section inlet
subcooling are shown. More vertical lines indicate the initial test cases where flow
was first established. The data show pressure drops of about 100 psig for the liquid
through the test section. When the inlet heater was turned on, the inlet subcooling
decreased. The expected results of decreasing the subcooling was for the operation
lines to shift to the right at a constant pressure. This proved incorrect, as shown by
the diagonal lines on Figure 3.10. The response of the system was to maintain liquid
refrigerant through the entire length of the test section instead of flashing at some
point between the inlet and outlet. This represents a major problem for the pressure
control tank system. As previously mentioned in this paper, the pressure control is
entirely dependent on a two-phase mixture at the test section outlet. If the
refrigerant is still a liquid, setting the temperature of the refrigerant with the tank will
not set the pressure. Without the ability to set the inlet or outlet pressure, the
40
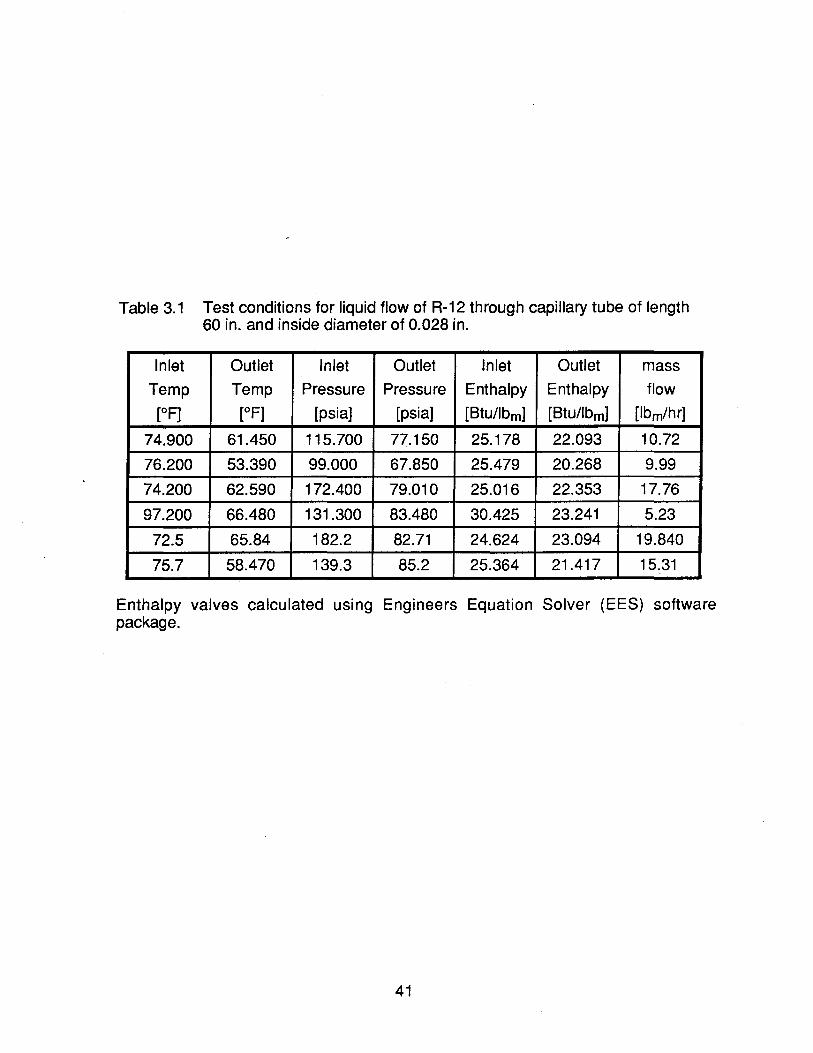
Table 3.1 Test conditions for liquid flow of R-12 through capillary tube of length 60 in. and inside diameter of 0.028 in.
Inlet Outlet Inlet Outlet Inlet Outlet mass
Temp Temp Pressure Pressure Enthalpy Enthalpy flow
[oF] [OF] [psia] [psia] [Btu/Ibm] [Btu/Ibm] [Ibm/hr]
74.900 61.450 115.700 77.150 25.178 22.093 10.72
76.200 53.390 99.000 67.850 25.479 20.268 9.99
74.200 62.590 172.400 79.010 25.016 22.353 17.76
97.200 66.480 131.300 83.480 30.425 23.241 5.23
72.5 65.84 182.2 82.71 24.624 23.094 19.840
75.7 58.470 139.3 85.2 25.364 21.417 15.31
Enthalpy valves calculated using Engineers Equation Solver (EES) software package.
41
800
500
300
20C
140 100 ,......,
.~ (J) a.
/ \ .......... Q) 40~ '-:::J 30
View2X (fJ (fJ 20 Q)
~ '-I\) a..
6
2
1.0 , « ' • -30 -20 -10 o 10 20 30 40 50 60 70 80 90
Enthalpy [Btu/Ibm]
Figure 3.10 Pressure-enthalpy diagram of single-phase liquid of R-12 through capillary tube. Capillary tube dimensions are length equal 60 in. and inside diameter equal to 0.028 in.
number of parameters controlled is not sufficient to establish the operation of the
system.
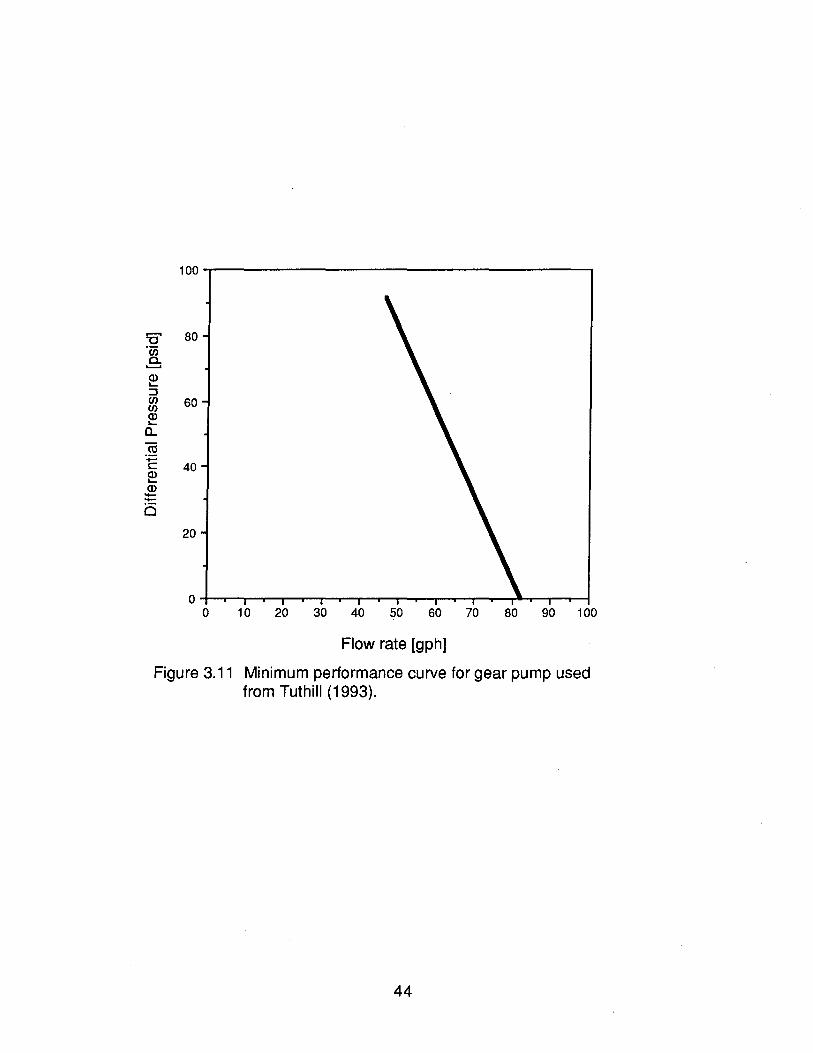
The problem with using a gear pump is shown in Figure 3.11, which is a typical
performance curve for a gear pump. The figure shows the pump reaches a large
differential pressure value only at the higher mass flow rates. The reason is that a
higher differential pressure can only be achieved if the motor speed is operating at a
sufficiently high speed, and a higher speed is required for higher mass flow rates.
The figure shows that at a mass flow rate typical of a capillary-tube system
(25 Ibm/hr for R-12 or 0.0375 gpm), the motor speed is not high enough to achieve
differential pressures of over 100 psid. This and the other results led to the decision
to replace the gear pump with another pumping system which could provide the
desired mass flow and differential pressure. The first option was to replace the gear
pump with a diaphragm pump. A diaphragm pump can be designed to provide the
needed operational conditions, but the problem lies with the fluctuations of these
values. Because of the piston-like action of the diaphragm in the pump, mass flow
and pressure fluctuate during operation. These fluctuations can be minimized if the
stroke rate is sufficiently high. For the mass flow rate of our system, the required
stroke rate is low, thus increasing the pressure and flow rate pulsations to
unacceptable values. These pulsations could be in excess of 10% for both mass
flow and pressure.
The solution was to operate the gear pump at constant pressure and to use it
as a metering valve because of its ability to provide a constant mass flow rate. The
differential pressure in the system is provided by a diaphragm pump located
upstream of the gear pump as shown in Figure 3.3. The difficulty with this approach
is that the mass flow rate between the two pumps may be slightly different. This
problem is lessened by placing a refrigerant cylinder and a bladder accumulator
between the two pumps. The diaphragm pump pressurizes the subcooled
43
100~-------------------------------------,
....... 80 "0 ·w .e-Q) .... :l en 60 en Q) ....
a.. ct!
.';:; c 40 ~ Q) --i:S
20
O~~'-~~~~~r-~~~~~~~~~~~
o 1 0 20 30 40 50 60 70 80 90 1 00
Flow rate [gph]
Figure 3.11 Minimum performance curve for gear pump used from Tuthill (1993).
44
refrigerant into the cylinder, where the gear pump removes the liquid from the
cylinder to meet the mass flow requirements. The bladder accumulator works to
prevent flashing of the liquid in the fixed volume between the two pumps. The
refrigerant can flash to a two-phase state due to differences in the mass flow rates of
the two pumps. If the gear pump removes the liquid at a rate faster than the
diaphragm pump supplies it, the pressure in the fixed volume drops and promotes
flashing of the refrigerant. The bladder accumulator exerts a force on this volume to
maintain a sufficiently high pressure to prevent flashing. The bladder accumulator
also helps with operation of the diaphragm pump. The diaphragm pump used
requires a pressure difference of 30 psid for starting operation. By isolating the fixed
volume at the pump's outlet from the rest of the system, the bladder accumulator can
increase the pump's high side pressure to a value sufficiently greater than the
system pressure at the pump's inlet, or low side. Once pump operation has been
established, the liquid in the fixed volume is allowed to enter the gear pump to
establish operational conditions.
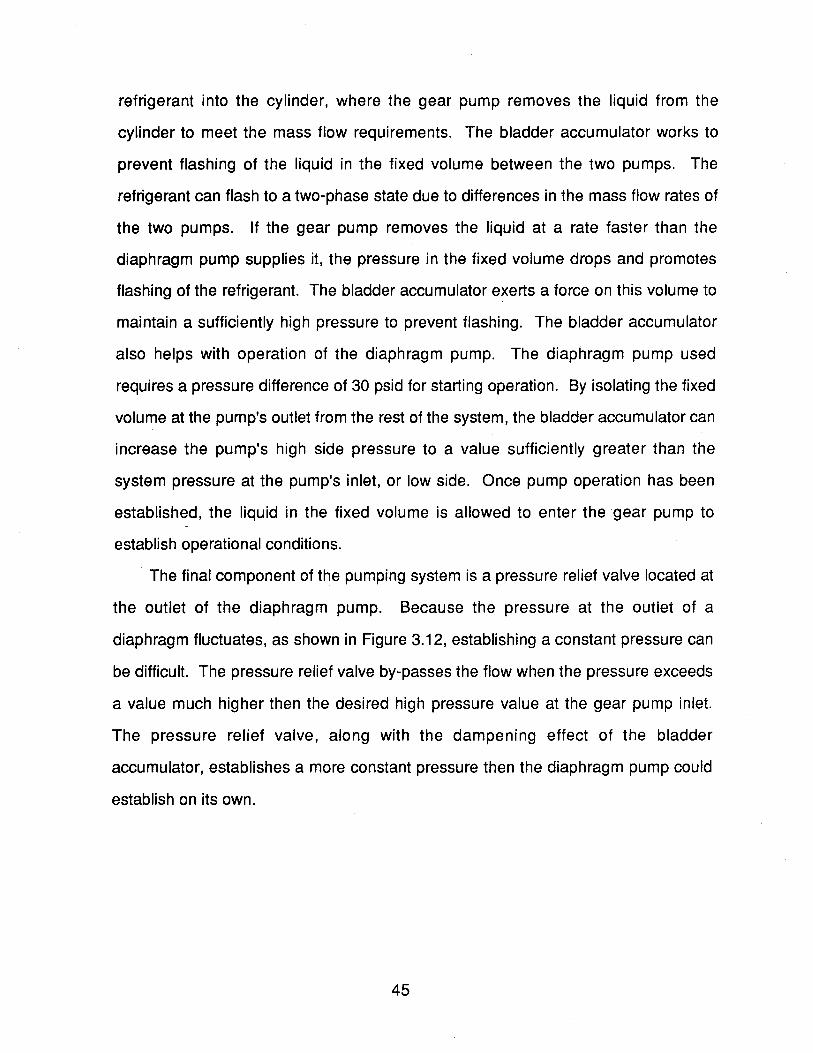
The final component of the pumping system is a pressure relief valve located at
the outlet of the diaphragm pump. Because the pressure at the outlet of a
diaphragm fluctuates, as shown in Figure 3.12, establishing a constant pressure can
be difficult. The pressure relief valve by-passes the flow when the pressure exceeds
a value much higher then the desired high pressure value at the gear pump inlet.
The pressure relief valve, along with the dampening effect of the bladder
accumulator, establishes a more constant pressure then the diaphragm pump could
establish on its own.
45
136~--------------------------------------~
132
128
124
120
116
--- ---
Stroke of Diaphragm
Relief Valve Setting
--- ....... 1---
... Desired System Pressure
Figure 3.12 Outlet pressure of diaphragm pump
46
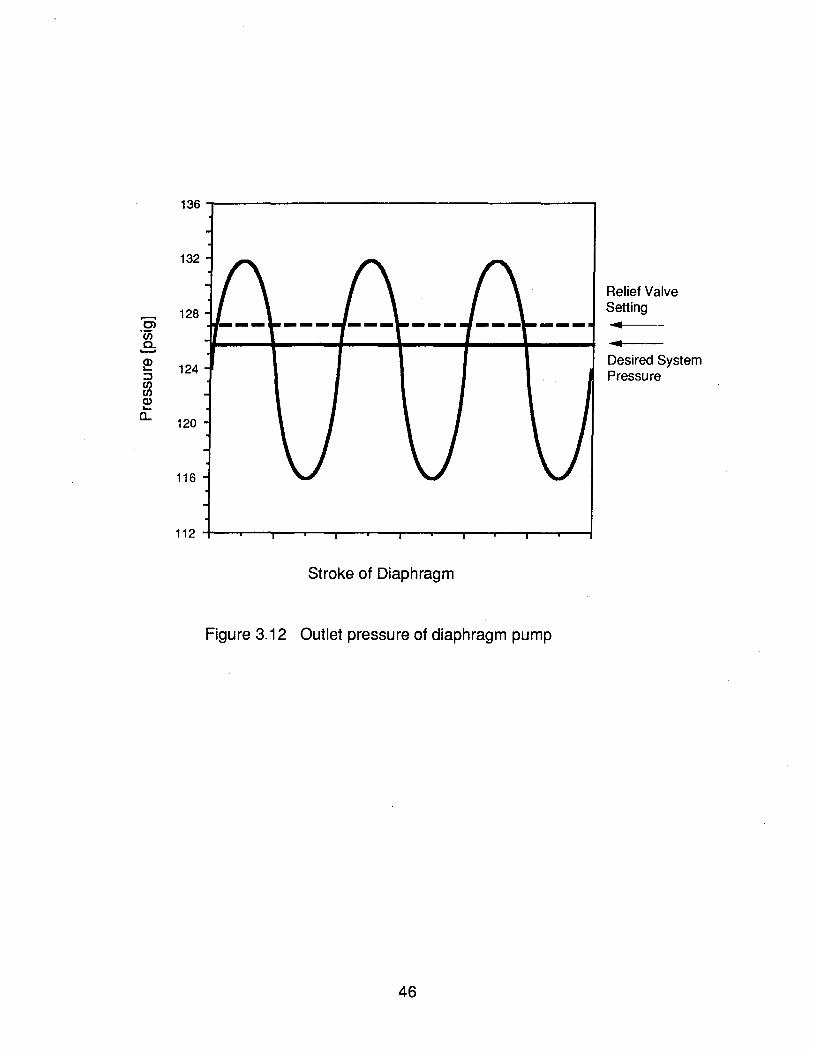
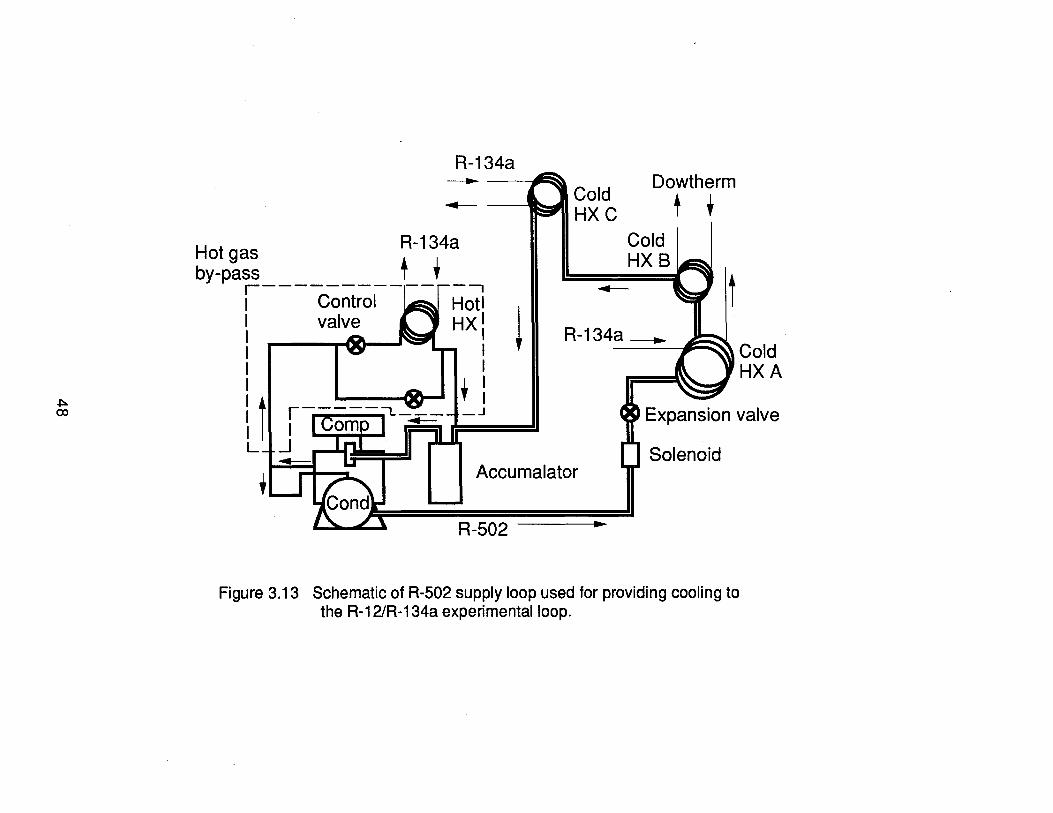
3.1.4 R-502 Supply Loop
The primary purpose of the R-502 supply loop is to provide cooling of the
refrigerant in the experimental loop. This method of using a secondary refrigerant
coolant loop was also used by Dudley (1962) for cooling the two-phase refrigerant at
the exit of a capillary tube to a subcooled liquid. This cooling is accomplished in our
system with a 5-hp Copeland Copelametic compressor and water-cooled condenser
package. Even though a 1-2 hp unit was calculated to be sufficient to provide the
amount of cooling needed for the experimental operating range, a 5-hp unit was
purchased to provide the required capacity at lower temperatures. Smaller units
were capable of reaching temperatures below -20 of, but the capacity of these units
was reduced in excess of 80% of full capacity at the lower temperatures. The 5-hp
unit also suffers capacity loss at lower temperatures, but has a full capacity value of
approximately five times the 1-hp unit. One point of cooling is achieved directly in
the heat exchangers A and C in Figure 3.13. The larger heat exchanger, labeled A,
chills the refrigerant to a subcooled liquid to ensure proper operation of the pump.
Heat exchanger C cools the refrigerant leaving the test section. The supply loop
also sets the temperature of the pressure tank system by heat exchange with the
Dowtherm™ in cold heat exchanger B in the figure. Because the pressure tank uses
temperature to set the outlet pressure of the test section, controlling this temperature
is the most important function of the supply loop. The amount of refrigeration
provided by the R-502 system is controlled by the motor speed of the compressor
and the throttling valve located before heat exchanger A. The motor speed is
manually controlled by a Toshiba Inverter from the engine rating of 60 Hz to a low of
25 Hz. The throttling valve can be hand adjusted to vary the pressure drop in the
supply loop and thus vary the refrigerant temperature in the heat exchangers.
Optimal combinations of motor speed and throttling valve settings were
47
~ co
R-134a -... ~~
Cold ~~IHXC
Dowtherm
t + R-134a
Hot gas ._ Cold HXB t + by-pa~ __ --Control-
l valve I I I I
--, Hotl HXI
I I I
+ l
~
~ R-134a ~ Cold HXA
i t _.J Expansion valve
L Solenoid Accumalator
.. Figure 3.13 Schematic of R-502 supply loop used for providing cooling to
the R-121R-134a experimental loop.
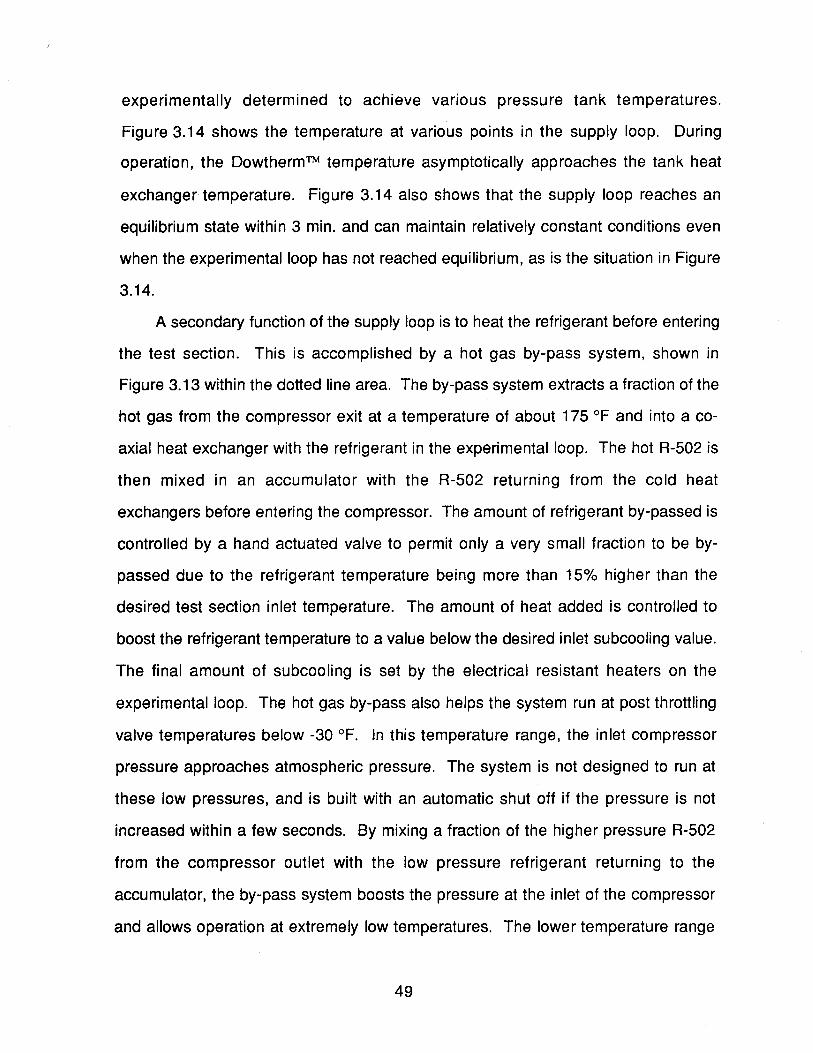
experimentally determined to achieve various pressure tank temperatures.
Figure 3.14 shows the temperature at various pOints in the supply loop. During
operation, the DowthermTM temperature asymptotically approaches the tank heat
exchanger temperature. Figure 3.14 also shows that the supply loop reaches an
equilibrium state within 3 min. and can maintain relatively constant conditions even
when the experimental loop has not reached equilibrium, as is the situation in Figure
3.14.
A secondary function of the supply loop is to heat the refrigerant before entering
the test section. This is accomplished by a hot gas by-pass system, shown in
Figure 3.13 within the dotted line area. The by-pass system extracts a fraction of the
hot gas from the compressor exit at a temperature of about 175 of and into a co
axial heat exchanger with the refrigerant in the experimental loop. The hot R-502 is
then mixed in an accumulator with the R-502 returning from the cold heat
exchangers before entering the compressor. The amount of refrigerant by-passed is
controlled by a hand actuated valve to permit only a very small fraction to be by
passed due to the refrigerant temperature being more than 15% higher than the
desired test section inlet temperature. The amount of heat added is controlled to
boost the refrigerant temperature to a value below the desired inlet subcooling value.
The final amount of subcooling is set by the electrical resistant heaters on the
experimental loop. The hot gas by-pass also helps the system run at post throttling
valve temperatures below -30 of. In this temperature range, the inlet compressor
pressure approaches atmospheric pressure. The system is not designed to run at
these low pressures, and is built with an automatic shut off if the pressure is not
increased within a few seconds. By mixing a fraction of the higher pressure R-502
from the compressor outlet with the low pressure refrigerant returning to the
accumulator, the by-pass system boosts the pressure at the inlet of the compressor
and allows operation at extremely low temperatures. The lower temperature range
49
190
170
150
[L' 130 E...... ~ 110 ::J ro ..,;. 90 Q) a. 70 E Q)
50 I-
30
10
-10
-30
-50 0
••••••••••••••••••••••••••••••••••••
• •• 00000000000000000000000000000000000
•• b.b. •••• ~ b.AA:~· •••••••••••••••••••••••••••• ~~~AAAAAA6A6AAAAAAAAAA6AAAAAAAb.
---.. .............. ~ ...... ~ Cc ccccccccccccccccccccccccCcccccCCCC
100 200
Time [minutes]
c Pre compressor • Pre condenser o Pre expansion valve • Post expansion valve
300
b. Dowtherm heat exchanger ~ Pre tank
400
Figure 3.14 Temperature values at various pOints in the R-502 supply loop.
50
is limited by the amount of capacity lost from running at such low temperatures, and
by increasing the fraction of refrigerant by-passed.
51
4. EXPERIMENTAL RESULTS
4.1 Apparatus Operation
A closed-loop experimental apparatus to study the flow of refrigerants through a
capillary tube was developed, thus achieving the goal of this project. The first
preliminary data sets used R-12, and the test apparatus operated using the gear
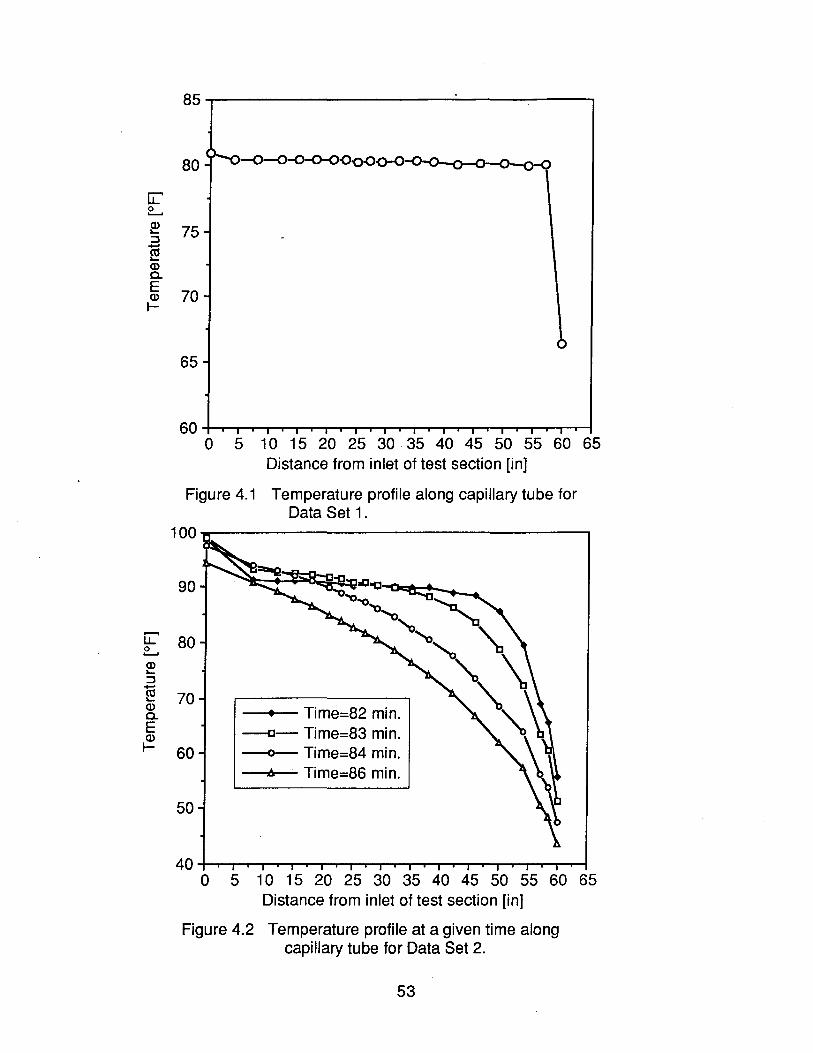
pump without the diaphragm pump. Figure 4.1 gives the first set of data showing the
temperature profile along the test section and the sudden temperature drop that
occurs due to the transition of subcooled refrigerant to two-phase. The flash point
for this case was located within 3 in. of the outlet of the test section. The inlet
subcooling is lower for the data shown in Figure 4.2, causing the flash point to be
shifted closer to the inlet, as is shown with the data collected at time equal to
82 minutes. The data points at times equal to 84 and 86 minutes show the effect of
having a two-phase refrigerant at the inlet of the capillary tube and the resulting
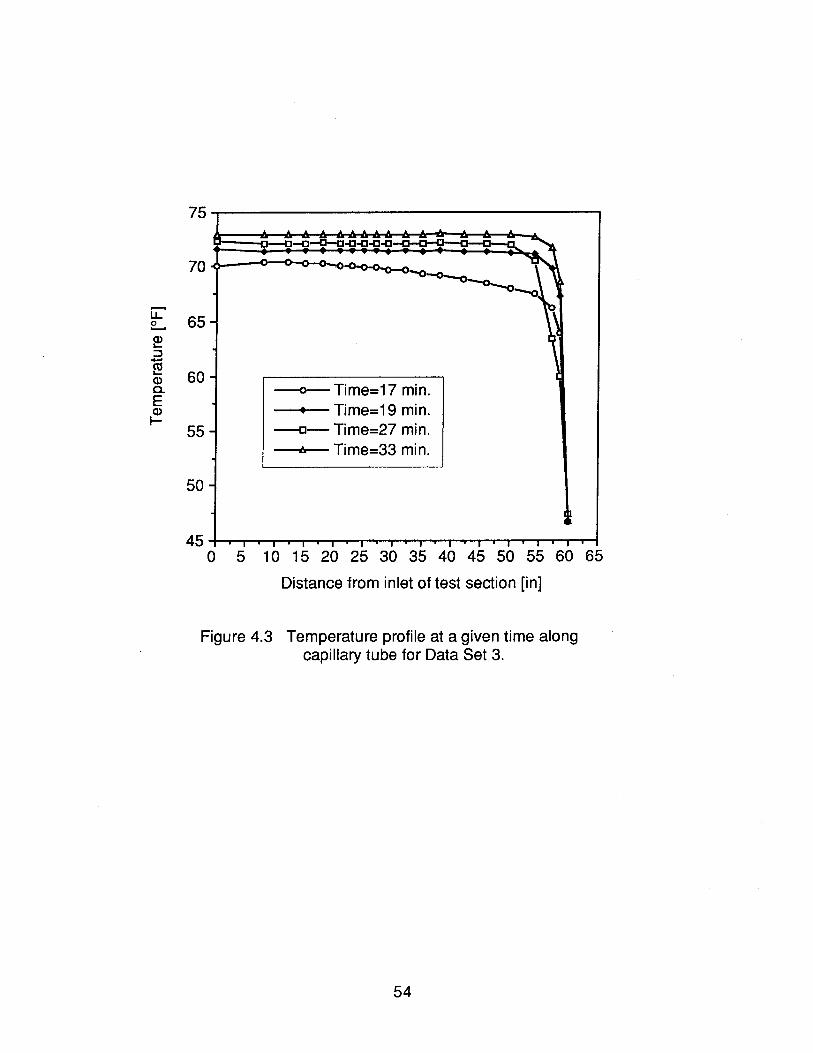
temperature drop due to the decreasing pressure. The last preliminary data set
taken using R-12 is Data Set 3, presented in Figure 4.3. The basic shape of the
curves formed in Figure 4.1, 4.2 and 4.3 is very similar to Bolstad's data, shown in
Figure 2.9 of this thesis.
4.2 Pressure Tank
Essential to a capillary-tube test apparatus is the ability to set and maintain a
constant low-side pressure. The method used for this project is the pressure tank
system described in Section 3.1.2 of this thesis. Preliminary results show the
pressure control characteristics of the system and the effect of mass flow rate and
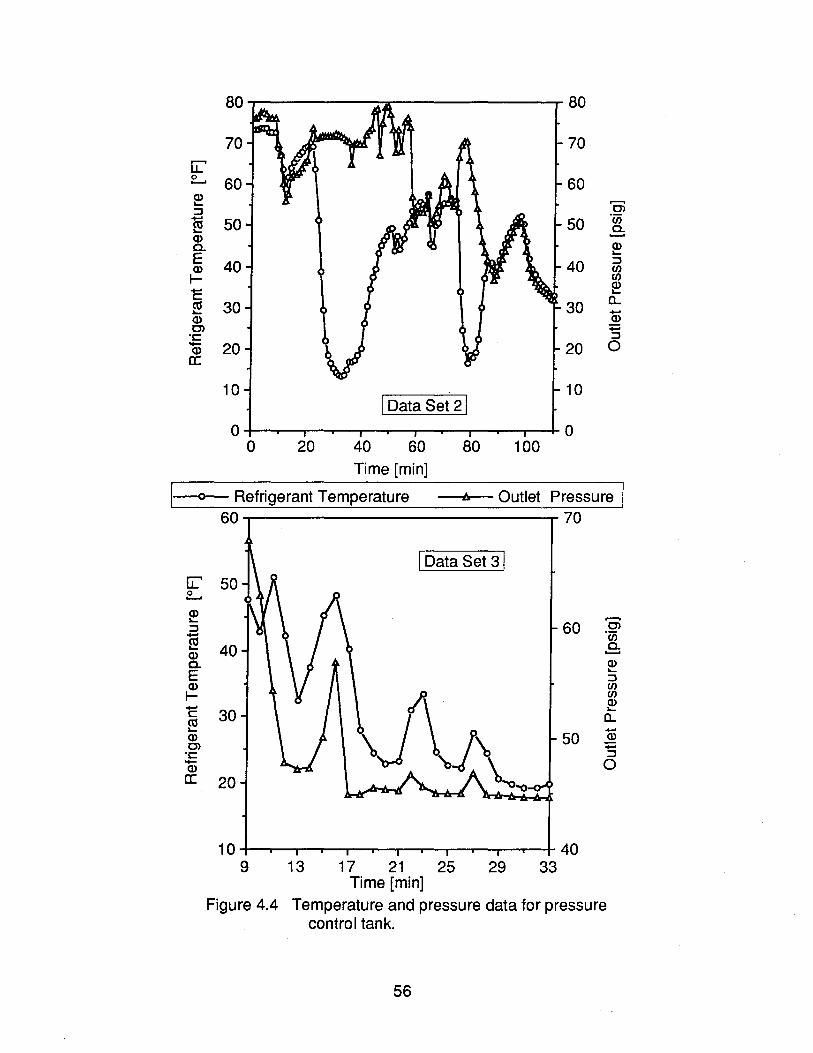
inlet pressure on the outlet or tank pressure. Figure 4.4 plots outlet pressure with
the refrigerant temperature at the exit of the pressure tank for Data Sets 1 and 3.
52
........ u.. 1?-. Q) .... :J +-'
~ Q) e.. E Q)
I-
........ u.. 1?-. Q) .... :J
N Q) e.. E Q)
I-
85~--------------------~------------~
80 000-0
75
70
65
60~~~~-r~~~~~~-r~~~~~~~
o 5 1 0 15 20 25 30 35 40 45 50 55 60 65 Distance from inlet of test section [in]
Figure 4.1 Temperature profile along capillary tube for Data Set 1.
100~---------------------------------.
90
80
70 • Time=82 min .
--0- Time=83 min. 60 --0- Time=84 min.
6 Time=86 min.
50
40+-~~~~~~~~~~~~~~~~~~
o 5 1 0 15 20 25 30 35 40 45 50 55 60 65 Distance from inlet of test section [in]
Figure 4.2 Temperature profile at a given time along capillary tube for Data Set 2.
53
[L E..... ~ ::J
N Q) a. E Q)
I-
75
-c-O-C-c-c-c-c~ .. ~
70 ~~~ 65 - ~ 60 j
--0- Time=17 min.
• Time=19 min . 55 --0- Time=27 min.
.6 Time=33 min .
50 -
45+-~~~I-r~~I-'~~~I~~I~~I~~-~I-T~~
o 5 1 0 15 20 25 30 35 40 45 50 55 60 65
Distance from inlet of test section [in]
Figure 4.3 Temperature profile at a given time along capillary tube for Data Set 3.
54
Figure 4.4 for Data Set 2 shows that refrigerant temperature and outlet pressure
respond independently of each other until a time of 81 minutes. At this point, a
visual inspection via a sight glass confirms that two-phase refrigerant was entering
the pressure tank, and the figure shows a direct correspondence between the
change in temperature and the change in pressure. This relationship is better shown
in Figure 4.4 for Data Set 3. Along with the ability to set outlet pressure by
controlling tank temperature, the pressure tank system must maintain a constant
pressure for varying values of mass flow rate and inlet pressure. The system works
by setting the outlet pressure using the pressure tank while mass flow rate and inlet
pressure are determined by pump speed and the heat addition to the refrigerant at
the inlet. Figures 4.5, 4.6 and 4.7 show the effects of varying these values on the
tank pressure for three data sets. Figure 4.5 shows different mass flow rates set by
the manual speed control of the pump, and Figure 4.6 shows the corresponding
outlet pressures at the same points in time. The mass flow rate for Data Set 3
changed from a minimum of 12.3 Ibm/hr to a maximum of 16.1 Ibm/hr over the entire
range while the outlet pressure did not vary more than 0.3 psig (except for one point)
from an average value of 45 psig. The same basic relationship of a 20% or more
variation in mass flow resulting in a less then 1 % variation in outlet pressure was
also recorded for the other two data sets. Another critical relationship is the effect of
inlet pressure on outlet pressure. The inlet pressure reacted in the same manner as
the mass flow rate. Figure 4.7 shows inlet pressures varying from 92 psig to
121 psig for Data Set 2, with the corresponding outlet pressure remaining virtually
constant at 71 psig. The same basic pressure tank design has been incorporated
into other refrigerant loops within the Air Conditioning and Refrigeration Center, and
has proven to be as effective as the system being used with this project.
55
80~--------~~--------------~80
70
e.... 60 ~ ::J -~ 50 Q) a. ~ 40 I--c ~ 30 Q) C> -c
CD 20 a:
10
70
60
50
40
30
20
I Data Set 21 10
O+-~~--~~----~~~--~~-+O
o 20 40 60 80 100 Time [min]
-Q) +=' ::J o
1--0- Refrigerant Temperature A Outlet Pressure I 60~--------------------------~70
I Data Set 31 LL:' 50 o ...... ~ ::J -~ Q) a. E Q)
I--c ~ Q) C> -c -Q)
a:
60 40
30 50
20
10+-~~--~~~~~~~~~~+40
9 13 17 21 25 29 33 Time [min]
-Q) +=' ::J o
Figure 4.4 Temperature and pressure data for pressure control tank_
56
'i::" .s::. -E .0 ;:::;. Q)
ro .... 3: 0 ~
en ~ ~
20
18
16
14
12
10
8
6 0 2 4 6
Data point # 8
Figure 4.5 Mass flow rate data for the analysis of pressure control tank performance.
10
75~--------------------------------~
70
0; 'w 65 .e. ~ :::J 60 en en ~ a.. 55 Ci5 ~ :::J
o 50
45
0--0--0-0---0--0--0--0--0
0--0--0--0--0---0-0--0
40+---~--r-~~~--~--~--~--~--~~
o 2 4 6 8 Data point #
Figure 4.6 Outlet pressure data for the analysis of . pressure control tank performance.
57
10
--0-- Data Set 1
--0- Data Set 2
--J:r- Data Set 3
--0- Data Set 1
--0- Data Set 2
----Ir- Data Set 3
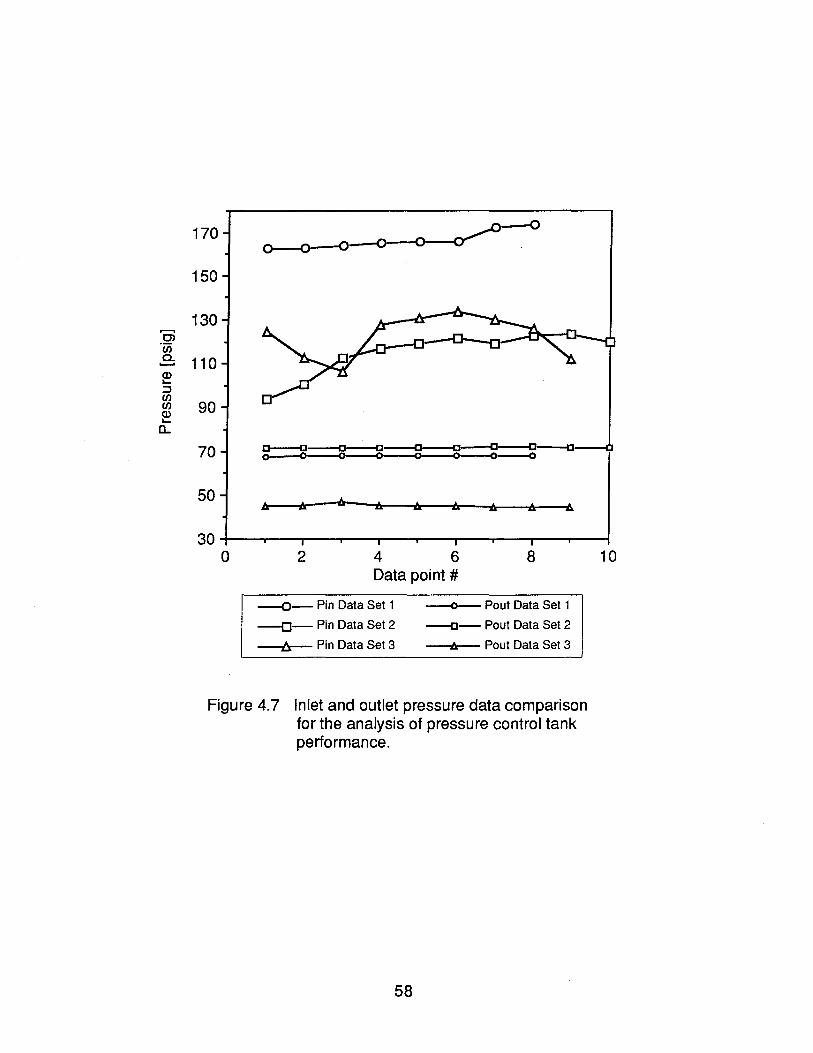
Oi ·00 c. ........ Q) .... ~ CJ) CJ) Q) .... a..
170
150
130
110
90
70
50
30 0
c---c---o----a---o---o---C---O--a ~--~--~--~--~--~--~
2 4 6 Data point #
8
--0- Pin Data Set 1
--0- Pin Data Set 2
-I::r-- Pin Data Set 3
~- Pout Data Set 1
--0- Pout Data Set 2
A Pout Data Set 3
Figure 4.7 Inlet and outlet pressure data comparison for the analysis of pressure control tank performance.
58
10
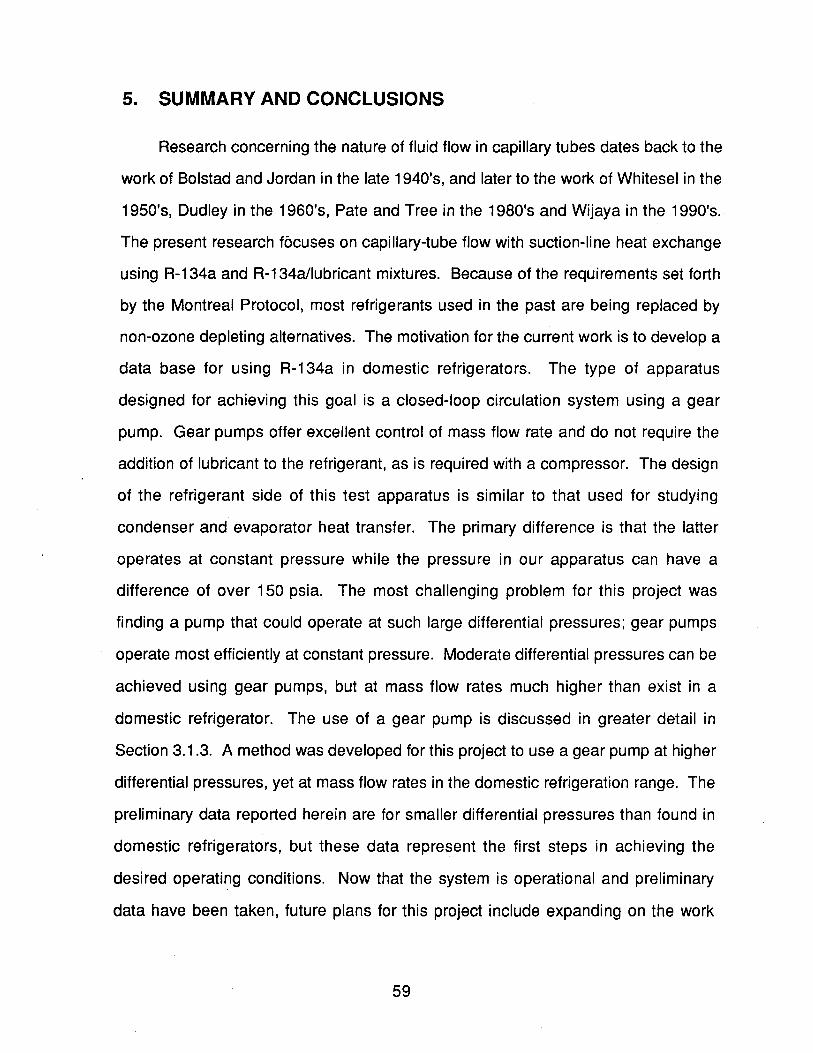
5. SUMMARY AND CONCLUSIONS
Research concerning the nature of fluid flow in capillary tubes dates back to the
work of Bolstad and Jordan in the late 1940's, and later to the work of Whitesel in the
1950's, Dudley in the 1960's, Pate and Tree in the 1980's and Wijaya in the 1990's.
The present research focuses on capillary-tube flow with suction-line heat exchange
using R-134a and R-134a1lubricant mixtures. Because of the requirements set forth
by the Montreal Protocol, most refrigerants used in the past are being replaced by
non-ozone depleting alternatives. The motivation for the current work is to develop a
data base for using R-134a in domestic refrigerators. The type of apparatus
designed for achieving this goal is a closed-loop circulation system using a gear
pump. Gear pumps offer excellent control of mass flow rate and do not require the
addition of lubricant to the refrigerant, as is required with a compressor. The design
of the refrigerant side of this test apparatus is similar to that used for studying
condenser and evaporator heat transfer. The primary difference is that the latter
operates at constant pressure while the pressure in our apparatus can have a
difference of over 150 psia. The most challenging problem for this project was
finding a pump that could operate at such large differential pressures; gear pumps
operate most efficiently at constant pressure. Moderate differential pressures can be
achieved using gear pumps, but at mass flow rates much higher than exist in a
domestic refrigerator. The use of a gear pump is discussed in greater detail in
Section 3.1.3. A method was developed for this project to use a gear pump at higher
differential pressures, yet at mass flow rates in the domestic refrigeration range. The
preliminary data reported herein are for smaller differential pressures than found in
domestic refrigerators, but these data represent the first steps in achieving the
desired operating conditions. Now that the system is operational and preliminary
data have been taken, future plans for this project include expanding on the work
59
completed by lowering. the outlet pressure to values typical of a domestic
refrigerator, and beginning to collect data for alternative refrigerants such as R-134a.
Then, the next step is to use the loop to study the effects of suction-line heat
exchange and the different capillary tube configurations discussed in the
introduction. The final goal of the project is to have the data necessary to improve
the understanding of the fluid flow phenomena and develop a computer model for
sizing capillary tubes for industrial refrigeration cycles using alternative refrigerants.
60
BIBLIOGRAPHY
Air-Conditioning and Refrigeration Institute, 1992: Koldfax (December).
Bolstad, M. M., 1949: "Theory and Use of Capillary Tube Expansion Device", Ph. D Thesis, University of Minnesota.
Bolstad, M. M., and R. C. Jordan, 1949: "Theory and Use of the Capillary Tube Expansion Device,"Refrigerating Engineering, 577-583.
Cooper, L., C. K. Chu, and W. R. Brisken, 1957: "Simple Selection Method for Capillaries Derived from Physical Flow Conditions," Refrigerating Engineering, 37-41 +.
Dudley, J. C., 1962: "A Photographic Study of the Two-Phase Flow of Freon in Small Bore Tubes," M.S. Thesis, University of Wisconsin.
Kuehl, S. J., 1987: "Study, Validation and Improvement of a Model for Sizing a Capillary Tuber for and Air-Conditioning/Heat Pump System," M.S. Thesis, Purdue University.
Krueger, M., and J. Driessen, 1991: "The Potentiality of the HFC-134a Refrigerant in Replacing the CFC-12 for Domestic Refrigeration", Proceedings of the XVIII International Congress of Refrigeration 1991, Montreal, Quebec, Canada, 1171- 1174.
Li, R. Y., Z. H. Chen, D. K. Chen, and S. Lin, 1991: "Numerical AnalysiS on Flow of Stratospherically Safe Refrigerant-R-134a Through Capillary Tube," Proceedings of the XVIII International Congress of Refrigeration 1991, Montreal, Quebec, Canada, 1151-1154.
Pate, M. B., 1982: "A Theoretical and Experimental Analysis of Capillary TubeSuction Line Heat Exchangers," Ph.D. Thesis, Purdue University.
Pate, M. B., and D. R. Tree, 1983: "An Experimental Analysis of a Capillary TubeSuction Line Heat Exchanger," Proceedings of XVlth International Congress Qi Refrigeration 1983, 709-715.
Peixoto, R. A., and O. M. Silvares, 1992: "Theoretical Analysis of the Capillary Tube Suction Line Heat Exchanger Using R-12 and R134a," presented to The Spanish and Inter-American Air Conditioning and Refrigeration Congress in Madrid, Spain.
Purvis, B. D., 1992: "Development of a Computer Model for Refrigerant Flow in Small Diameter Tubes," M.S. Thesis, University of Illinois at UrbanaChampaign.
Scott, T. C., 1976: "Flashing Refrigerant Flow in Small Bore Tubes," Ph.D. Thesis, University of Michigan.
61
Stoecker, W. F., and J. W. Jones, 1986: Refrigeration and Air Conditioning, (2nd. ed.), McGraw-Hili Book Company, New York, 260-265.
Tuthill Pump Co. of California, 1993: Fax received from Andy Saradino of Rock Valley Pump.
Vakil, H. B., 1983: "Thermodynamics of Heat Exchange in Refrigeration Cycles with Non-Azeotropic Mixtures Part II. Suctionline Heat Exchange and Evaporative Cooling of Capillary Tubes," Proceedings of XVlth International Congress of Refrigeration 1983, 311-316.
Whitesel, H. A., 1957: "Capillary Two-Phase Flow, Part II," Refrigerating Engineering, 35-40.
Wijaya, H., 1991: "An Experimental Evaluation of Adiabatic Capillary Tube Performance for HFC-134a and CFC-12," International CFC and Halon Alternatives Conference, Baltimore, MD.
Wijaya, H., 1992: "Adiabatic Capillary Tube Test Data for HFC-134a," Proceedings QL the 1992 International Refrigeration Conference-Energy Efficiency and New Refrigerants ,Purdue University, 63-71.
62
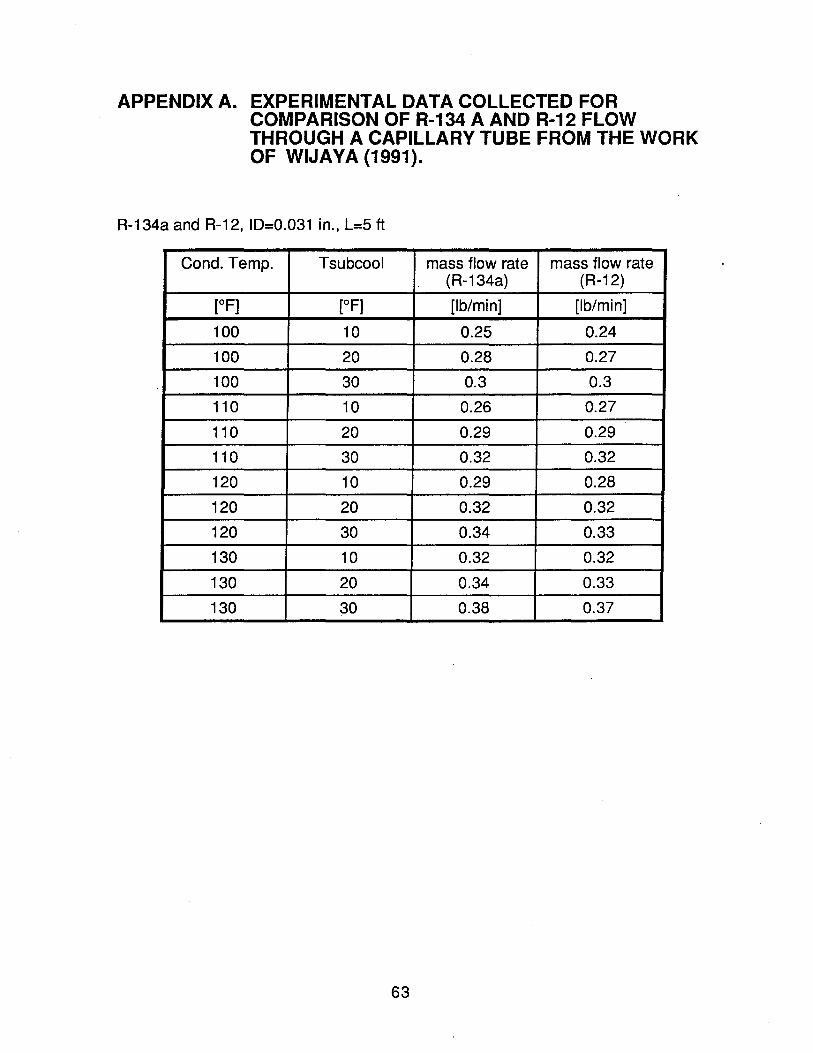
APPENDIX A. EXPERIMENTAL DATA COLLECTED FOR COMPARISON OF R-134 A AND R-12 FLOW THROUGH A CAPILLARY TUBE FROM THE WORK OF WIJAYA (1991).
R-134a and R-12, ID=0.031 in., L=5 ft
Condo Temp. Tsubcool mass flow rate mass flow rate (R-134a) (R-12)
[OF] [OF] [Ib/min] [Ib/min]
100 10 0.25 0.24
100 20 0.28 0.27
100 30 0.3 0.3
110 10 0.26 0.27
110 20 0.29 0.29
110 30 0.32 0.32
120 10 0.29 0.28
120 20 0.32 0.32
120 30 0.34 0.33
130 10 0.32 0.32
130 20 0.34 0.33
130 30 0.38 0.37
63
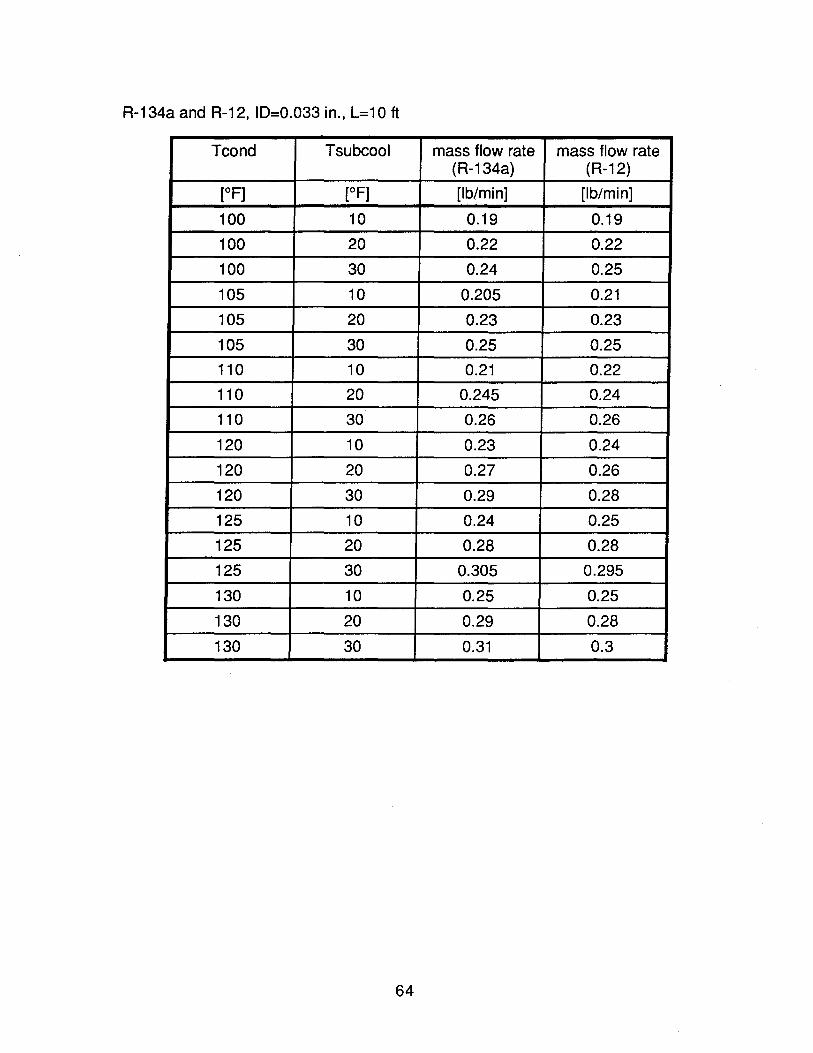
R-134a and R-12, ID=0.033 in., L=10 ft
Tcond Tsubcool mass flow rate mass flow rate (R-134a) (R-12)
[OF] [OF] [Ib/min] [Ib/min]
100 10 0.19 0.19
100 20 0.22 0.22
100 30 0.24 0.25
105 10 0.205 0.21
105 20 0.23 0.23
105 30 0.25 0.25
110 10 0.21 0.22
110 20 0.245 0.24
110 30 0.26 0.26
120 10 0.23 0.24
120 20 0.27 0.26
120 30 0.29 0.28
125 10 0.24 0.25
125 20 0.28 0.28
125 30 0.305 0.295
130 10 0.25 0.25
130 20 0.29 0.28
130 30 0.31 0.3
64
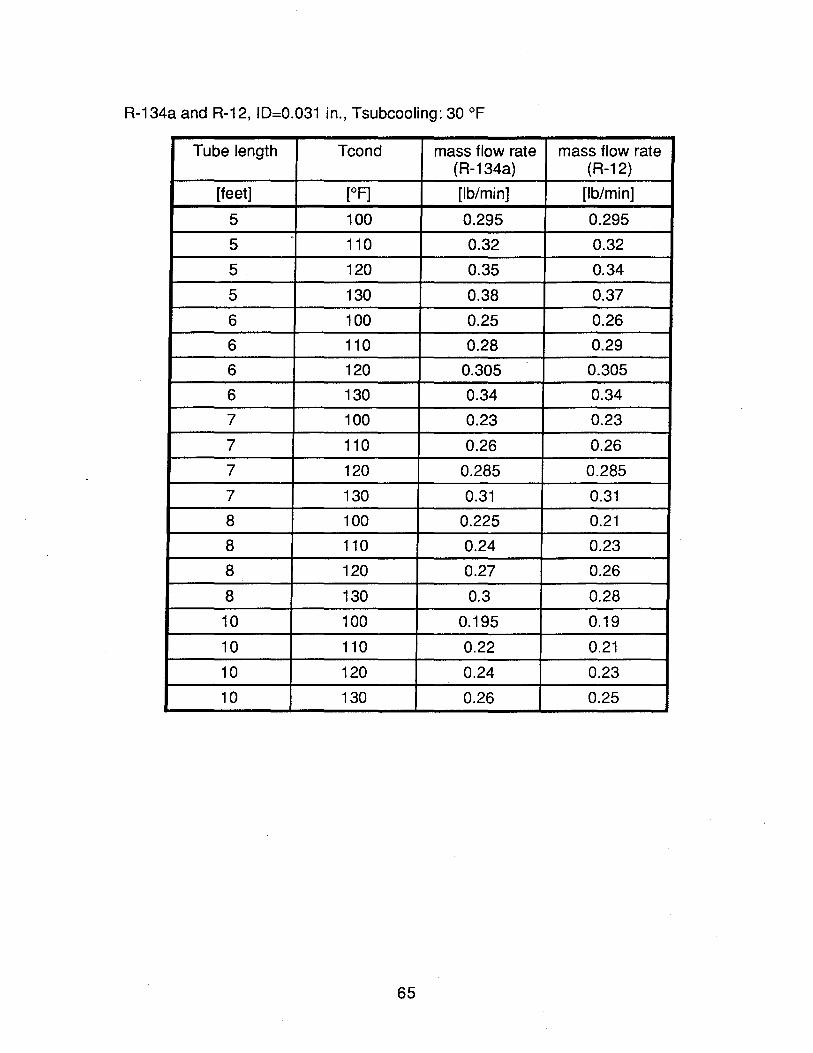
R-134a and R-12, ID=0.031 in., Tsubcooling: 30 of
Tube length Tcond mass flow rate mass flow rate (R-134a) (R-12)
[feet] [oF] [Ib/min] [Ib/min]
5 100 0.295 0.295 -
5 110 0.32 0.32
5 120 0.35 0.34
5 130 0.38 0.37
6 100 0.25 0.26
6 110 0.28 0.29
6 120 0.305 0.305
6 130 0.34 0.34
7 100 0.23 0.23
7 110 0.26 0.26
7 120 0.285 0.285
7 130 0.31 0.31
8 100 0.225 0.21
8 110 0.24 0.23
8 120 0.27 0.26
8 130 0.3 0.28
10 100 0.195 0.19
10 110 0.22 0.21
10 120 0.24 0.23
10 130 0.26 0.25
65
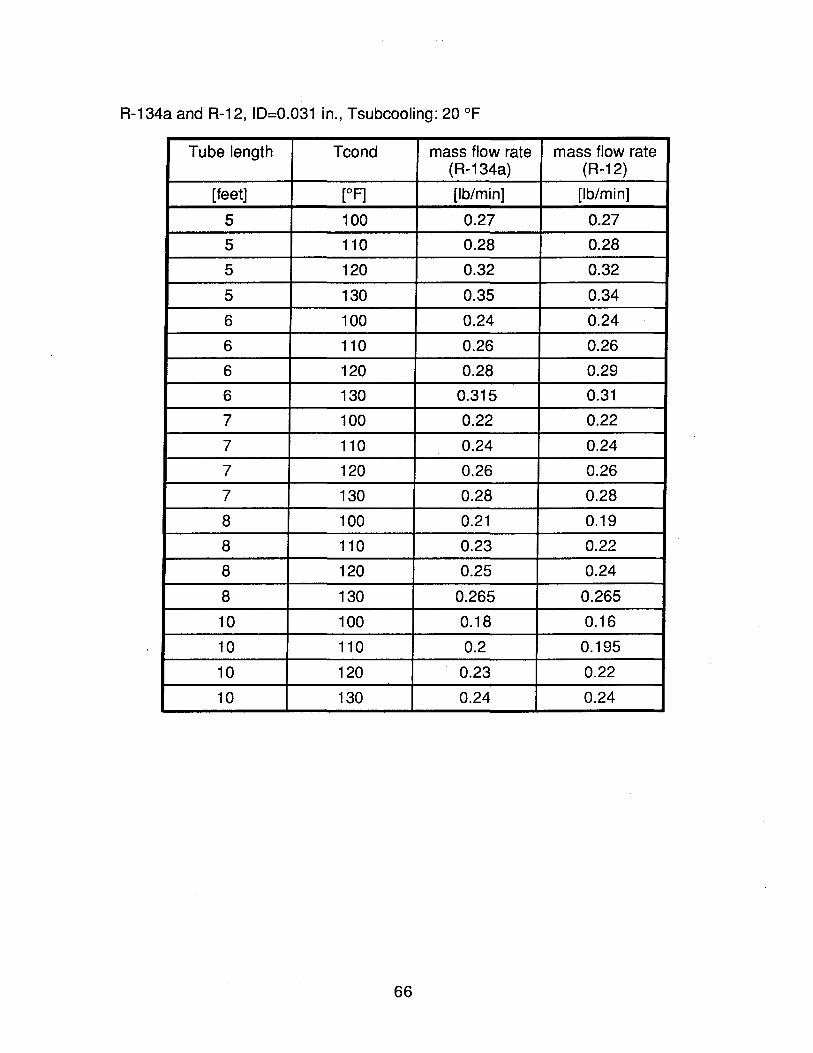
R-134a and R-12, 10=0.031 in., Tsubcooling: 20 of
Tube length Tcond mass flow rate mass flow rate (R-134a) (R-12)
[feet] [oF] [Ib/min] [Ib/min]
5 100 0.27 0.27
5 110 0.28 0.28
5 120 0.32 0.32
5 130 0.35 0.34
6 100 0.24 0.24
6 110 0.26 0.26
6 120 0.28 0.29
6 130 0.315 0.31
7 100 0.22 0.22
7 110 0.24 0.24
7 120 0.26 0.26
7 130 0.28 0.28
8 100 0.21 0.19
8 110 0.23 0.22
8 120 0.25 0.24
8 130 0.265 0.265
10 100 0.18 0.16
10 110 0.2 0.195
10 120 0.23 0.22
10 130 0.24 0.24
66
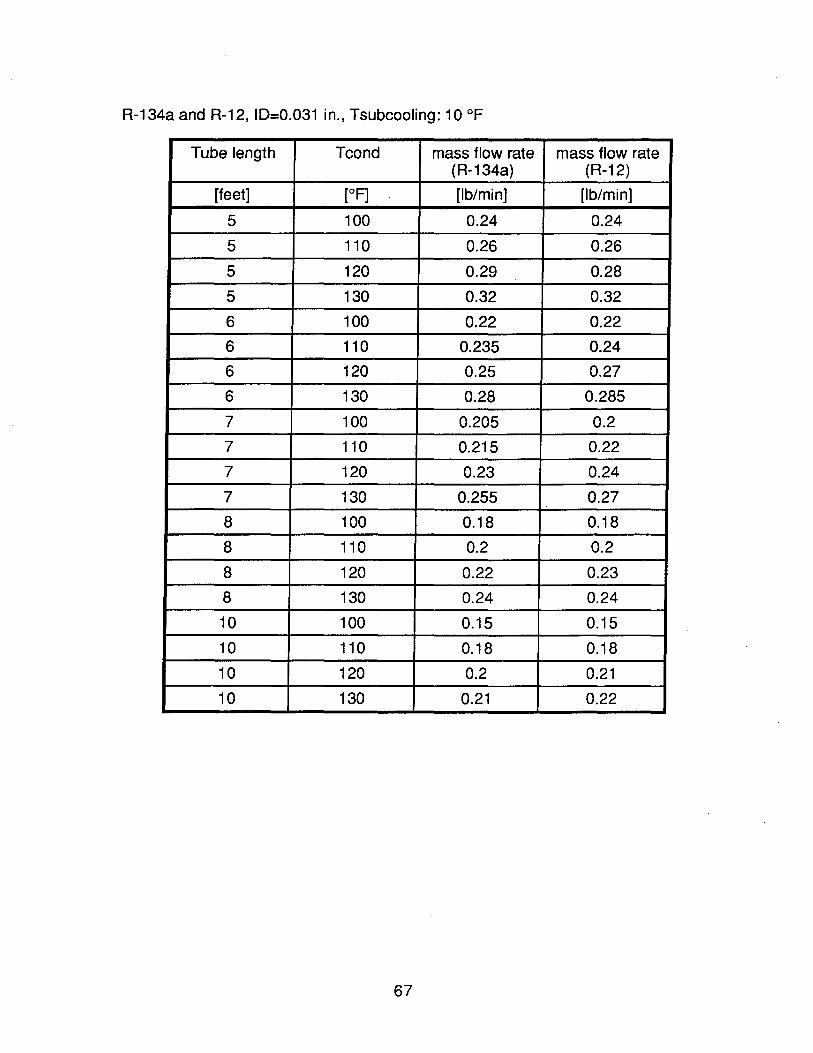
R-134a and R-12, ID=0.031 in., Tsubcooling: 10°F
Tube length Tcond mass flow rate mass flow rate (R-134a) (R-12)
[feet] [oF] [Ib/min] [Ib/min]
5 100 0.24 0.24
5 110 0.26 0.26
5 120 0.29 0.28
5 130 0.32 0.32
6 100 0.22 0.22
6 110 0.235 0.24
6 120 0.25 0.27
6 130 0.28 0.285
7 100 0.205 0.2
7 110 0.215 0.22
7 120 0.23 0.24
7 130 0.255 0.27
8 100 0.18 0.18
8 110 0.2 0.2
8 120 0.22 0.23
8 130 0.24 0.24
10 100 0.15 0.15
10 110 0.18 0.18
10 120 0.2 0.21
10 130 0.21 0.22
67
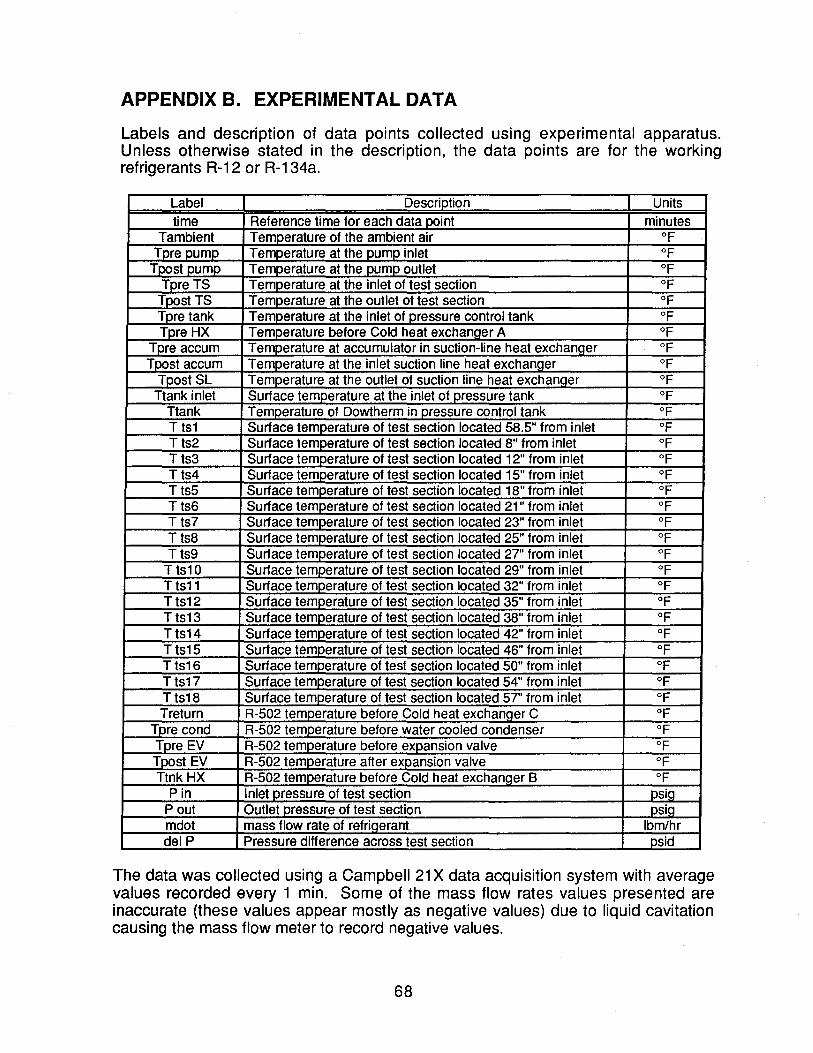
APPENDIX B. EXPERIMENTAL DATA
Labels and description of data points collected using experimental apparatus. Unless otherwise stated in the description, the data points are for the working refrigerants R-12 or R-134a.
Label Description Units
time Reference time for each data point minutes Tambient Temperature of the ambient air of
Tpre pump Temperature at the pump inlet OF Tpost pump Temperature at the pump outlet of
Tpre TS Temperature at the inlet of test section OF Tpost TS Temperature at the outlet of test section OF Tpre tank Temperature at the inlet of pressure control tank of Tpre HX Temperature before Cold heat exchanger A of
Tpre accum Temperature at accumulator in suction-line heat exchanQer of Tpost accum Temperature at the inlet suction line heat exchanger of
Tpost SL Temperature at the outlet of suction line heat exchanQer of Ttank inlet Surface temperature at the inlet of pressure tank of
Ttank Temperature of Dowtherm in pressure control tank OF T ts1 Surface temperature of test section located 58.5" from inlet of Tts2 Surface temperature of test section located 8" from inlet OF T ts3 Surface temperature of test section located 12" from inlet OF T ts4 Surface temperature of test section located 15" from inlet of Tts5 Surface temperature of test section located 18" from inlet of Tts6 Surface temperature of test section located 21" from inlet OF T ts7 Surface temperature of test section located 23" from inlet of Tts8 Surface temperature of test section located 25" from inlet OF Tts9 Surface temperature of test section located 27" from inlet of
T ts10 Surface temperature of test section located 29" from inlet of T ts11 Surface temj>erature of test section located 32" from inlet OF Tts12 Surface temperature of test section located 35" from inlet of T ts13 Surface temperature of test section located 38" from inlet of Tts14 Surface temperature of test section located 42" from inlet of Tts15 Surface temj>erature of test section located 46" from inlet of Tts16 Surface temperature of test section located 50" from inlet of Tts17 Surface temperature of test section located 54" from inlet of Tts18 Surface temperature of test section located 57" from inlet of Treturn R-502 temperature before Cold heat exchanQer C of
Tpre cond R-502 temperature before water cooled condenser OF Tpre EV R-502 temperature before expansion valve of Tpost EV R-502 temperature after expansion valve OF Ttnk HX R-502 temperature before Cold heat exchanQer B OF
Pin Inlet pressure of test section psiQ Pout Outlet pressure of test section psig mdot mass flow rate of refriQerant Ibm/hr delP Pressure difference across test section psid
The data was collected using a Campbell 21 X data acquisition system with average values recorded every 1 min. Some of the mass flow rates values presented are inaccurate (these values appear mostly as negative values) due to liquid cavitation causing the mass flow meter to record negative values.
68
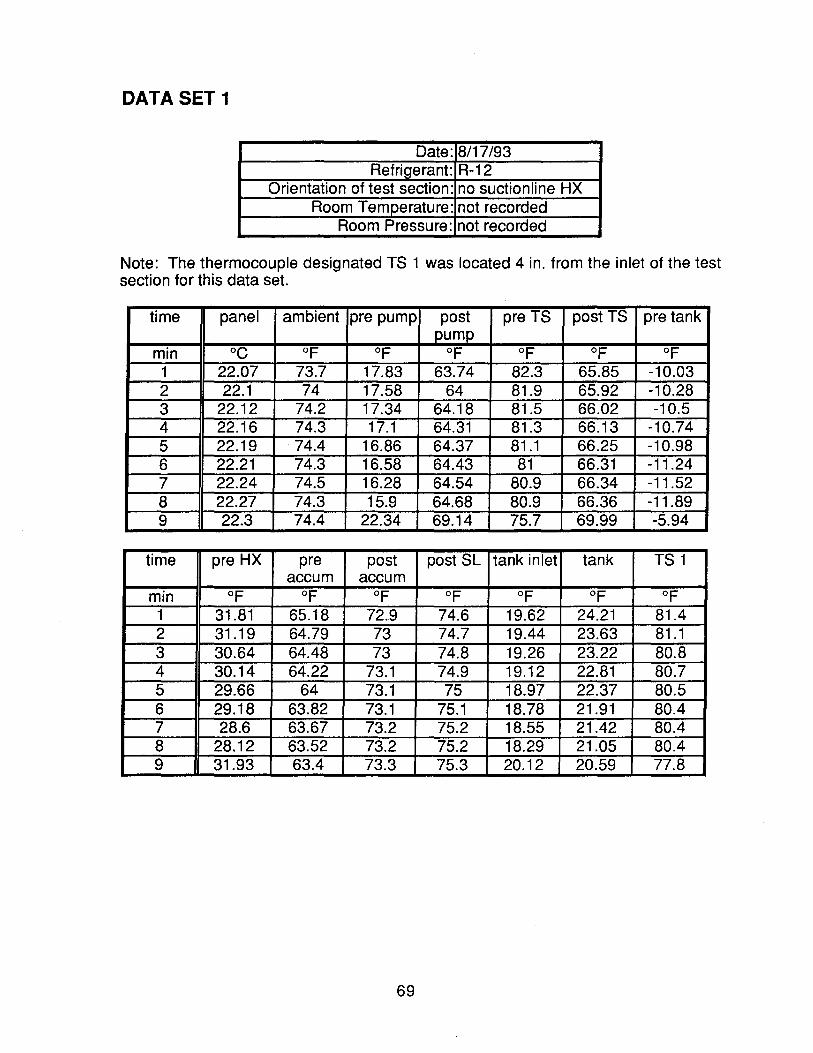
DATASET 1
Date: 8/17/93 Refrigerant: R-12
Orientation of test section: no suctionline HX Room Temperature: not recorded
Room Pressure: not recorded
Note: The thermocouple designated TS 1 was located 4 in. from the inlet of the test section for this data set.
time panel ambient pre pump post pre TS post TS pre tank pump
min °C of of of OF of OF 1 22.07 73.7 17.83 63.74 82.3 65.85 -10.03 2 22.1 74 17.58 64 81.9 65.92 -10.28 3 22.12 74.2 17.34 64.18 81.5 66.02 -10.5 4 22.16 74.3 17.1 64.31 81.3 66.13 -10.74 5 22.19 74.4 16.86 64.37 . 81.1 66.25 -10.98 6 22.21 74.3 16.58 64.43 81 66.31 -11.24 7 22.24 74.5 16.28 64.54 80.9 66.34 -11.52 8 22.27 74.3 15.9 64.68 80.9 66.36 -11.89 9 22.3 74.4 22.34 69.14 75.7 69.99 -5.94
time pre HX pre post post SL tank inlet tank TS 1 accum accum
min of OF OF OF OF OF OF 1 31.81 65.18 72.9 74.6 19.62 24.21 81.4 2 31.19 64.79 73 74.7 19.44 23.63 81.1 3 30.64 64.48 73 74.8 19.26 23.22 80.8 4 30.14 64.22 73.1 74.9 19.12 22.81 80.7 5 29.66 64 73.1 75 18.97 22.37 80.5 6 29.18 63.82 73.1 75.1 18.78 21.91 80.4 7 28.6 63.67 73.2 75.2 18.55 21.42 80.4 8 28.12 63.52 73.2 75.2 18.29 21.05 80.4 9 31.93 63.4 73.3 75.3 20.12 20.59 77.8
69
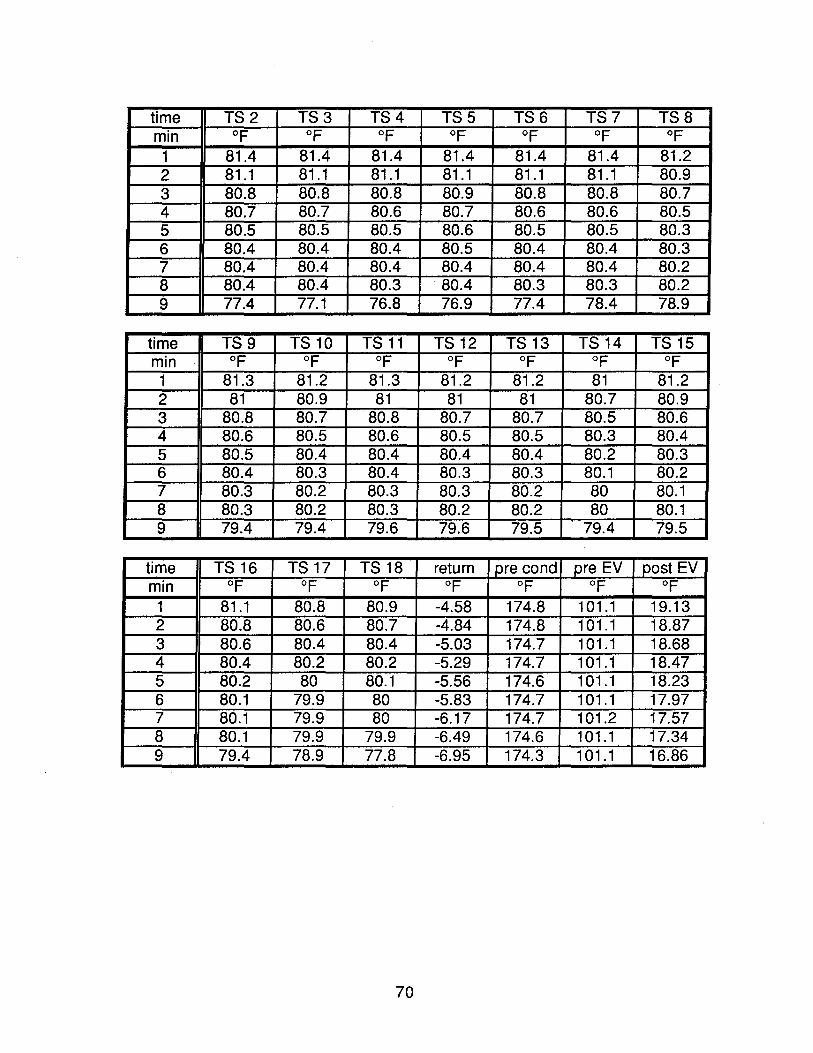
time TS2 TS3 TS4 TS5 TS6 TS7 TSB min of of of OF of of OF
1 B1.4 B1.4 B1.4 B1.4 B1.4 B1.4 B1.2 2 B1.1 B1.1 B1.1 B1.1 B1.1 B1.1 BO.9 3 BO.B BO.B BO.B BO.9 BO.B BO.B BO.7 4 BO.7 BO.7 BO.6 BO.7 BO.6 BO.6 BO.5 5 BO.5 BO.5 BO.5 BO.6 BO.5 BO.5 BO.3 6 BO.4 BO.4 BO.4 BO.5 BO.4 BO.4 BO.3 7 BO.4 BO.4 BO.4 BO.4 BO.4 BO.4 BO.2 B BO.4 BO.4 BO.3 BO.4 BO.3 BO.3 BO.2 9 77.4 77.1 76.B 76.9 77.4 7B.4 7B.9
time TS 9 TS10 TS 11 TS12 TS13 TS14 TS15 min of of of of of of of 1 B1.3 B1.2 B1.3 B1.2 B1.2 B1 B1.2 2 B1 BO.9 B1 B1 B1 BO.7 BO.9 3 BO.B BO.7 BO.B BO.7 BO.7 BO.5 BO.6 4 BO.6 BO.5 BO.6 BO.5 BO.5 BO.3 BO.4 5 BO.5 BO.4 BO.4 BO.4 BO.4 BO.2 BO.3 6 BO.4 BO.3 BO.4 BO.3 BO.3 BO.1 BO.2 7 BO.3 BO.2 BO.3 BO.3 BO.2 BO BO.1 B BO.3 BO.2 BO.3 BO.2 BO.2 BO BO.1 9 79.4 79.4 79.6 79.6 79.5 79.4 79.5
time TS16 TS17 TS1B return pre cond pre EV post EV min of of of of of of of 1 B1.1 BO.B BO.9 -4.5B 174.B 101.1 19.13 2 BO.B BO.6 BO.7 -4.B4 174.B 101.1 1B.B7 3 BO.6 BO.4 BO.4 -5.03 174.7 101.1 1B.6B 4 BO.4 BO.2 BO.2 -5.29 174.7 101.1 1B.47 5 BO.2 BO BO.1 -5.56 174.6 101.1 1B.23 6 BO.1 79.9 BO -5.B3 174.7 101.1 17.97 7 BO.1 79.9 BO -6.17 174.7 101.2 17.57 B BO.1 79.9 79.9 -6.49 174.6 101.1 17.34 9 79.4 7B.9 77.B -6.95 174.3 101.1 16.B6
70
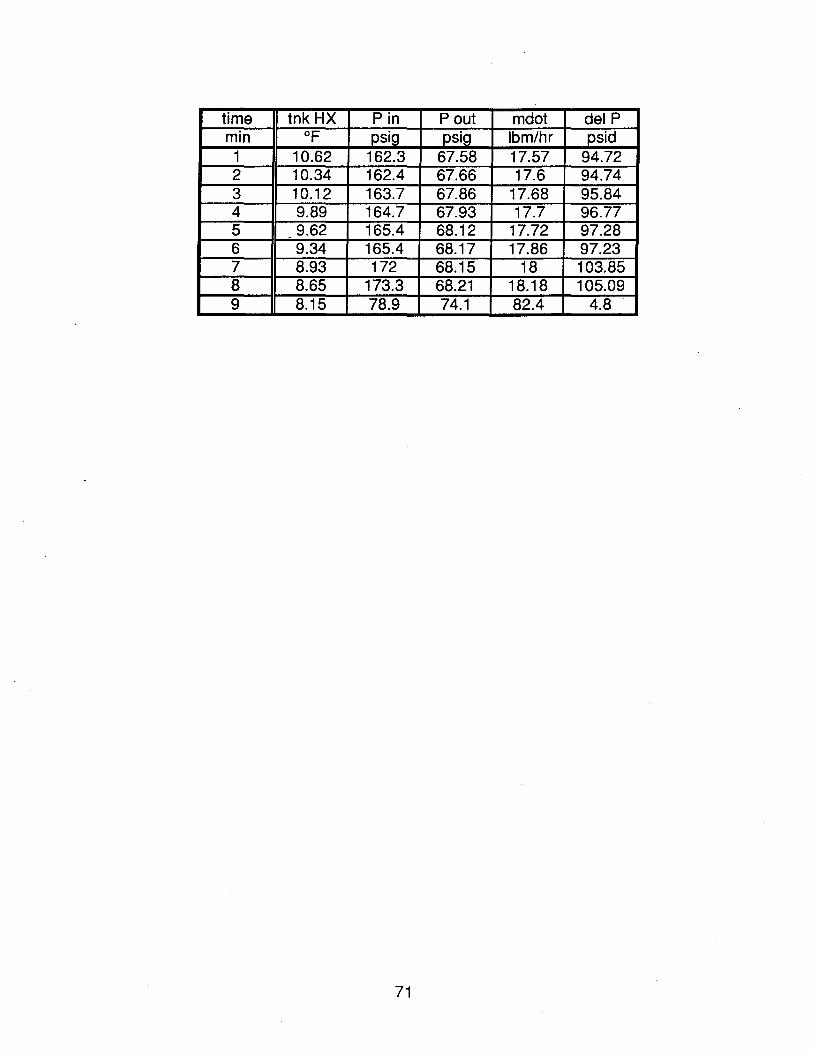
time tnk HX Pin Pout mdot delP min of psig psig Ibm/hr psid 1 10.62 162.3 67.58 17.57 94.72 2 10.34 162.4 67.66 17.6 94.74 3 10.12 163.7 67.86 17.68 95.84 4 9.89 164.7 67.93 17.7 96.77 5 9.62 165.4 68.12 17.72 97.28 . 6 9.34 165.4 68.17 17.86 97.23 7 8.93 172 68.15 18 103.85 8 8.65 173.3 68.21 18.18 105.09 9 8.15 78.9 74.1 82.4 4.8
71
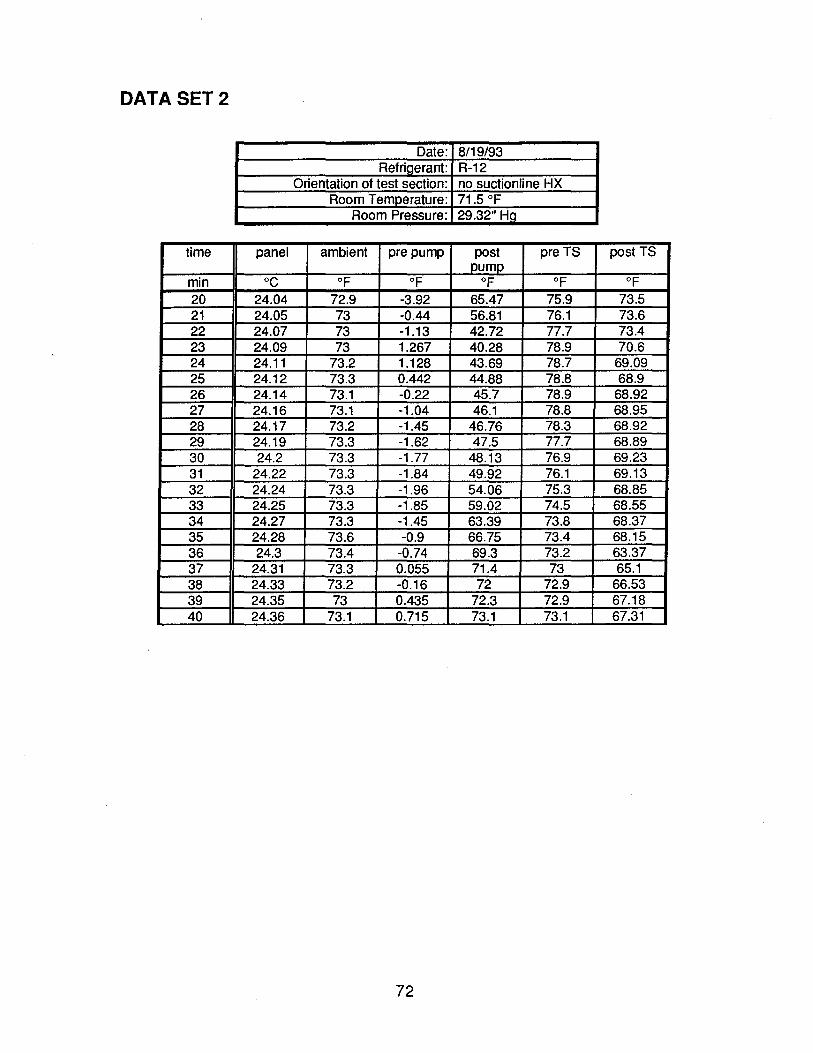
DATA SET 2
Date: 8/19/93 Refriaerant: R-12
Orientation of test section: no suctionline HX Room Temperature: 71.5 of
Room Pressure: 29.32" Ha
time panel ambient pre pump post preTS postTS pump
min °C of of of of of 20 24.04 72.9 -3.92 65.47 75.9 73.5 21 24.05 73 -0.44 56.81 76.1 73.6 22 24.07 73 -1.13 42.72 77.7 73.4 23 24.09 73 1.267 40.28 78.9 70.6 24 24.11 73.2 1.128 43.69 78.7 69.09 25 24.12 73.3 0.442 44.88 78.8 68.9 26 24.14 73.1 -0.22 45.7 78.9 68.92 27 24.16 73.1 -1.04 46.1 78.8 68.95 28 24.17 73.2 -1.45 46.76 78.3 68.92 29 24.19 73.3 -1.62 47.5 77.7 68.89 30 24.2 73.3 -1.77 48.13 76.9 69.23 31 24.22 73.3 -1.84 49.92 76.1 69.13 32 24.24 73.3 -1.96 54.06 75.3 68.85 33 24.25 73.3 -1.85 59.02 74.5 68.55 34 24.27 73.3 -1.45 63.39 73.8 68.37 35 24.28 73.6 -0.9 66.75 73.4 68.15 36 24.3 73.4 -0.74 69.3 73.2 63.37 37 24.31 73.3 0.055 71.4 73 65.1 38 24.33 73.2 -0.16 72 72.9 66.53 39 24.35 73 0.435 72.3 72.9 67.18 40 24.36 73.1 0.715 73.1 73.1 67.31
72
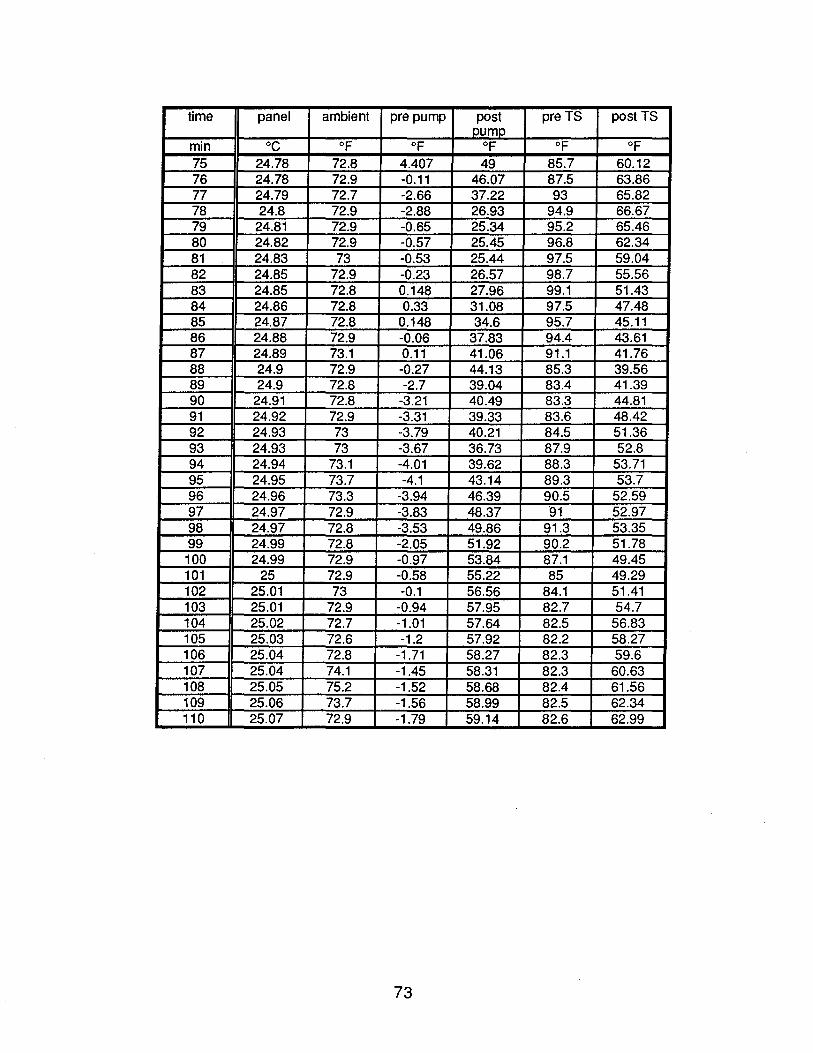
time panel ambient pre pump post preTS post TS pump
min °C of OF of of OF 75 24.78 72.8 4.407 49 85.7 60.12 76 24.78 72.9 -0.11 46.07 87.5 63.86 77 24.79 72.7 -2.66 37.22 93 65.82 78 24.8 72.9 -2.88 26.93 94.9 66.67 79 24.81 72.9 -0.65 25.34 95.2 65.46 80 24.82 72.9 -0.57 25.45 96.8 62.34 81 24.83 73 -0.53 25.44 97.5 59.04 82 24.85 72.9 -0.23 26.57 98.7 55.56 83 24.85 72.8 0.148 27.96 99.1 51.43 84 24.86 72.8 0.33 31.08 97.5 47.48 85 24.87 72.8 0.148 34.6 95.7 45.11 86 24.88 72.9 -0.06 37.83 94.4 43.61 87 24.89 73.1 0.11 41.06 91.1 41.76 88 24.9 72.9 -0.27 44.13 85.3 39.56 89 24.9 72.8 -2.7 39.04 83.4 41.39 90 24.91 72.8 -3.21 40.49 83.3 44.81 91 24.92 72.9 -3.31 39.33 83.6 48.42 92 24.93 73 -3.79 40.21 84.5 51.36 93 24.93 73 -3.67 36.73 87.9 52.8 94 24.94 73.1 -4.01 39.62 88.3 53.71 95 24.95 73.7 -4.1 43.14 89.3 53.7 96 24.96 73.3 -3.94 46.39 90.5 52.59 97 24.97 72.9 -3.83 48.37 91 52.97 98 24.97 72.8 -3.53 49.86 91.3 53.35 99 24.99 72.8 -2.05 51.92 90.2 51.78 100 24.99 72.9 -0.97 53.84 87.1 49.45 101 25 72.9 -0.58 55.22 85 49.29 102 25.01 73 -0.1 56.56 84.1 51.41 103 25.01 72.9 -0.94 57.95 82.7 54.7 104 25.02 72.7 -1.01 57.64 82.5 56.83 105 25.03 72.6 -1.2 57.92 82.2 58.27 106 25.04 72.8 -1.71 58.27 82.3 59.6 107 25.04 74.1 -1.45 58.31 82.3 60.63 108 25.05 75.2 -1.52 58.68 82.4 61.56 109 25.06 73.7 -1.56 58.99 82.5 62.34 110 25.07 72.9 -1.79 59.14 82.6 62.99
73
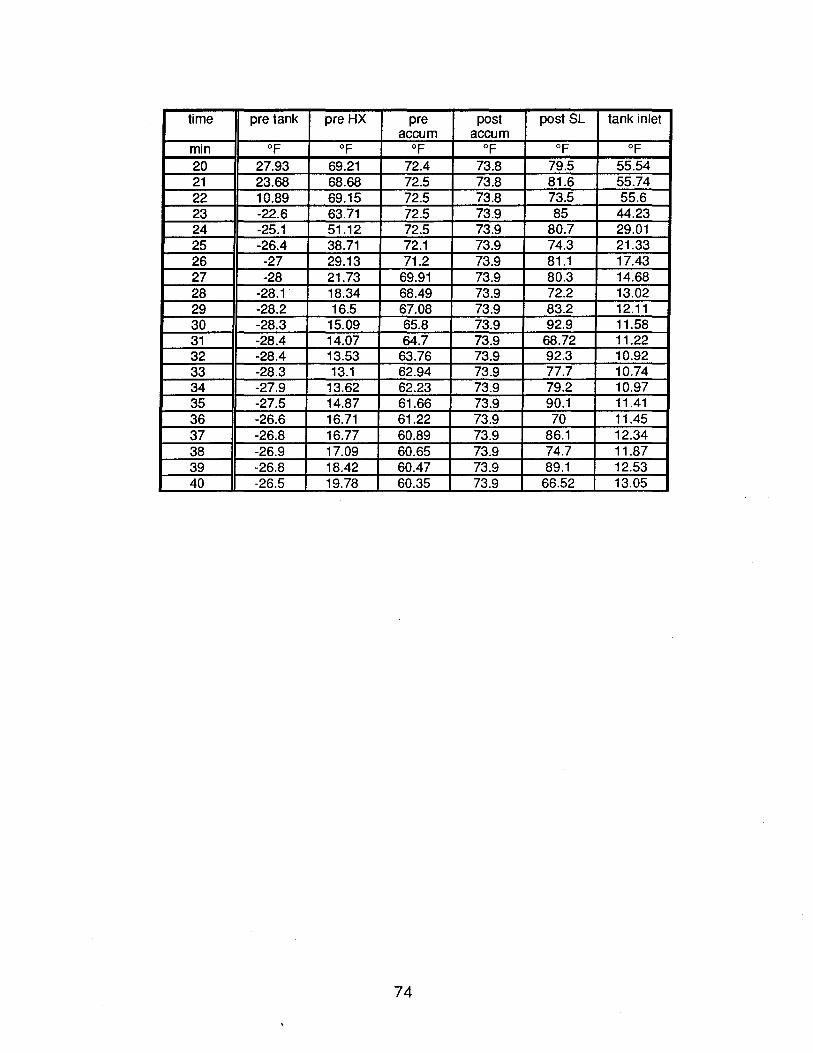
time pre tank pre HX pre post post SL tank inlet accum accum
min of OF OF OF OF of
20 27.93 69.21 72.4 73.8 79.5 55.54 21 23.68 68.68 72.5 73.8 81.6 55.74 22 10.89 69.15 72.5 73.8 73.5 55.6 23 -22.6 63.71 72.5 73.9 85 44.23 24 -25.1 51.12 72.5 73.9 80.7 29.01 25 -26.4 38.71 72.1 73.9 74.3 21.33 26 -27 29.13 71.2 73.9 81.1 17.43 27 -28 21.73 69.91 73.9 80.3 14.68 28 -28.1 18.34 68.49 73.9 72.2 13.02 29 -28.2 16.5 67.08 73.9 83.2 12.11 30 -28.3 15.09 65.8 73.9 92.9 11.58 31 -28.4 14.07 64.7 73.9 68.72 11.22 32 -28.4 13.53 63.76 73.9 92.3 10.92 33 -28.3 13.1 62.94 73.9 77.7 10.74 34 -27.9 13.62 62.23 73.9 79.2 10.97 35 -27.5 14.87 61.66 73.9 90.1 11.41 36 -26.6 16.71 61.22 73.9 70 11.45 37 -26.8 16.77 60.89 73.9 86.1 12.34 38 -26.9 17.09 60.65 73.9 74.7 11.87 39 -26.8 18.42 60.47 73.9 89.1 12.53 40 -26.5 19.78 60.35 73.9 66.52 13.05
74
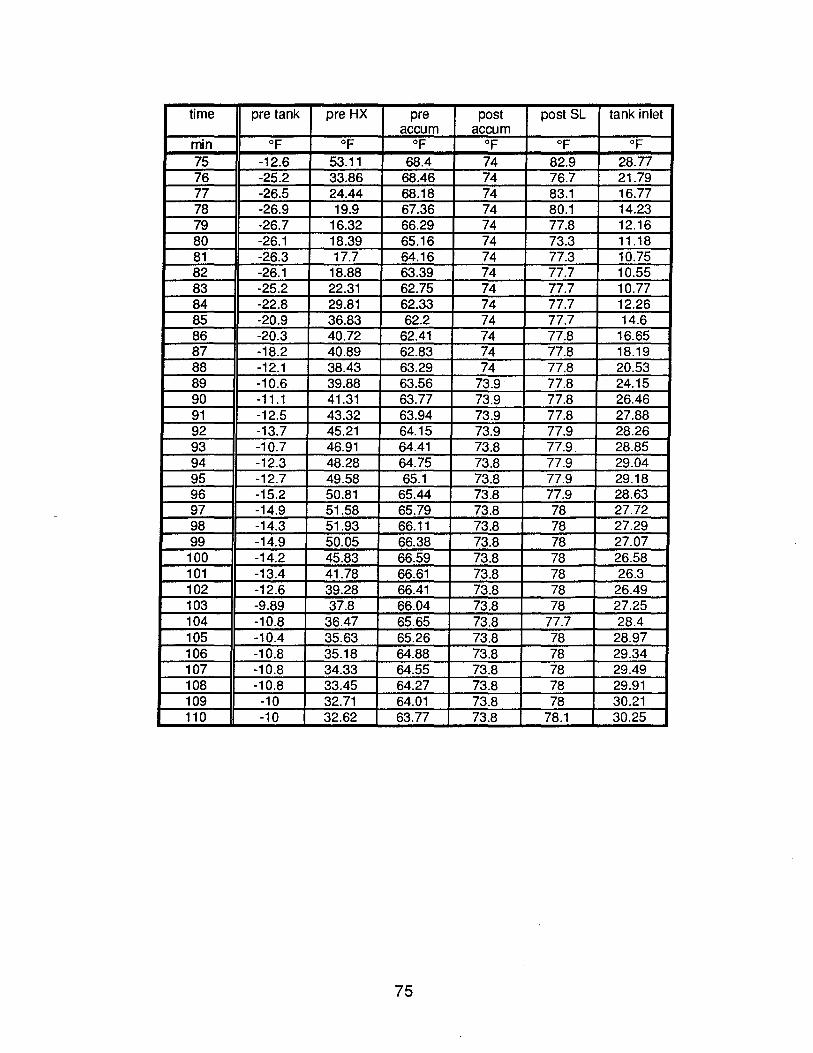
time pre tank preHX pre post post SL tank inlet accum accum
min OF of of of of of 75 -12.6 53.11 68.4 74 82.9 28.77 76 -25.2 33.86 68.46 74 76.7 21.79 77 -26.5 24.44 68.18 74 83.1 16.77 78 -26.9 19.9 67.36 74 80.1 14.23 79 -26.7 16.32 66.29 74 77.8 12.16 80 -26.1 18.39 65.16 74 73.3 11.18 81 -26.3 17.7 64.16 74 77.3 10.75 82 -26.1 18.88 63.39 74 77.7 10.55 83 -25.2 22.31 62.75 74 77.7 10.77 84 -22.8 29.81 62.33 74 77.7 12.26 85 -20.9 36.83 62.2 74 77.7 14.6 86 -20.3 40.72 62.41 74 77.8 16.65 87 -18.2 40.89 62.83 74 77.8 18.19 88 -12.1 38.43 63.29 74 77.8 20.53 89 -10.6 39.88 63.56 73.9 77.8 24.15 90 -11.1 41.31 63.77 73.9 77.8 26.46 91 -12.5 43.32 63.94 73.9 77.8 27.88 92 -13.7 45.21 64.15 73.9 77.9 28.26 93 -10.7 46.91 64.41 73.8 77.9 28.85 94 -12.3 48.28 64.75 73.8 77.9 29.04 95 -12.7 49.58 65.1 73.8 77.9 29.18 96 -15.2 50.81 65.44 73.8 77.9 28.63 97 -14.9 51.58 65.79 73.8 78 27.72 98 -14.3 51.93 66.11 73.8 78 27.29 99 -14.9 50.05 66.38 73.8 78 27.07
100 -14.2 45.83 66.59 73.8 78 26.58 101 -13.4 41.78 66.61 73.8 78 26.3 102 -12.6 39.28 66.41 73.8 78 26.49 103 -9.89 37.8 66.04 73.8 78 27.25 104 -10.8 36.47 65.65 73.8 77.7 28.4 105 -10.4 35.63 65.26 73.8 78 28.97 106 -10.8 35.18 64.88 73.8 78 29.34 107 -10.8 34.33 64.55 73.8 78 29.49 108 -10.8 33.45 64.27 73.8 78 29.91 109 -10 32.71 64.01 73.8 78 30.21 110 -10 32.62 63.77 73.8 78.1 30.25
75
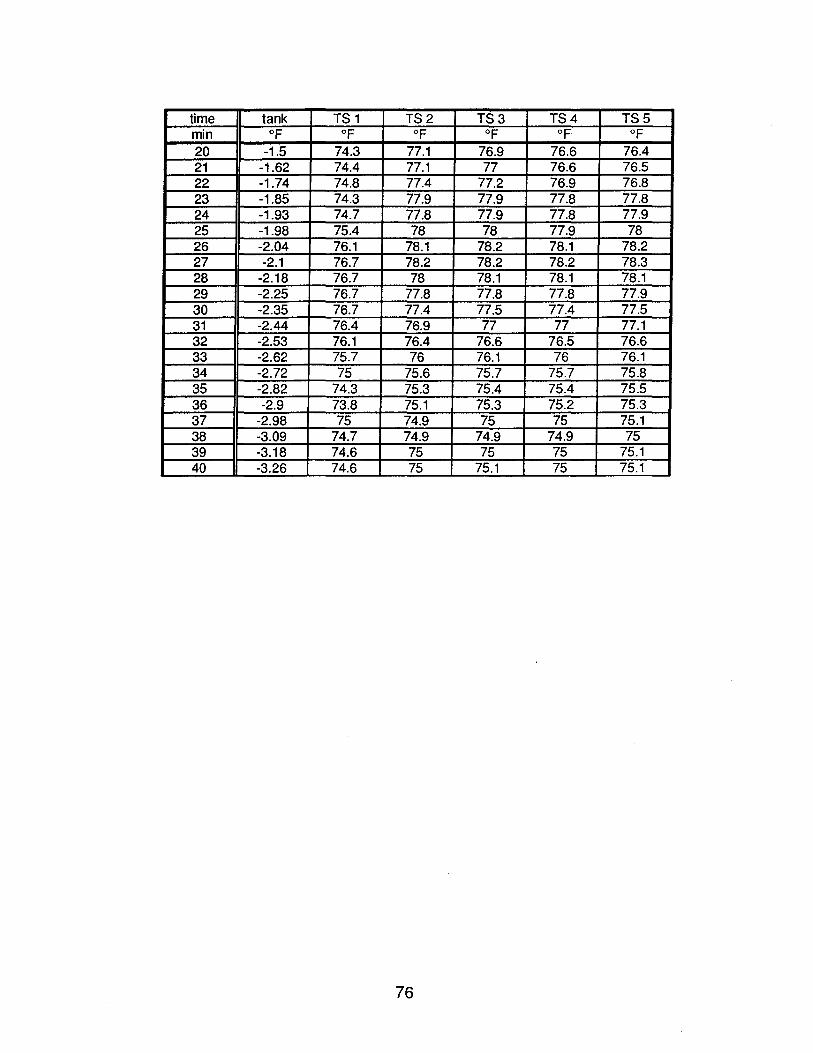
time tank T81 T82 T83 T84 T85 min OF of OF of of OF 20 -1.5 74.3 77.1 76.9 76.6 76.4 21 -1.62 74.4 77.1 77 76.6 76.5 22 -1.74 74.8 77.4 77.2 76.9 76.8 23 -1.85 74.3 77.9 77.9 77.8 77.8 24 -1.93 74.7 77.8 77.9 77.8 77.9 25 -1.98 75.4 78 78 77.9 78 26 -2.04 76.1 78.1 78.2 78.1 78.2 27 -2.1 76.7 78.2 78.2 78.2 78.3 28 -2.18 76.7 78 78.1 78.1 78.1 29 -2.25 76.7 77.8 77.8 77.8 77.9 30 -2.35 76.7 77.4 77.5 77.4 77.5 31 -2.44 76.4 76.9 77 77 77.1 32 -2.53 76.1 76.4 76.6 76.5 76.6 33 -2.62 75.7 76 76.1 76 76.1 34 -2.72 75 75.6 75.7 75.7 75.8 35 -2.82 74.3 75.3 75.4 75.4 75.5 36 -2.9 73.8 75.1 75.3 75.2 75.3 37 -2.98 75 74.9 75 75 75.1 38 -3.09 74.7 74.9 74.9 74.9 75 39 -3.18 74.6 75 75 75 75.1 40 -3.26 74.6 75 75.1 75 75.1
76
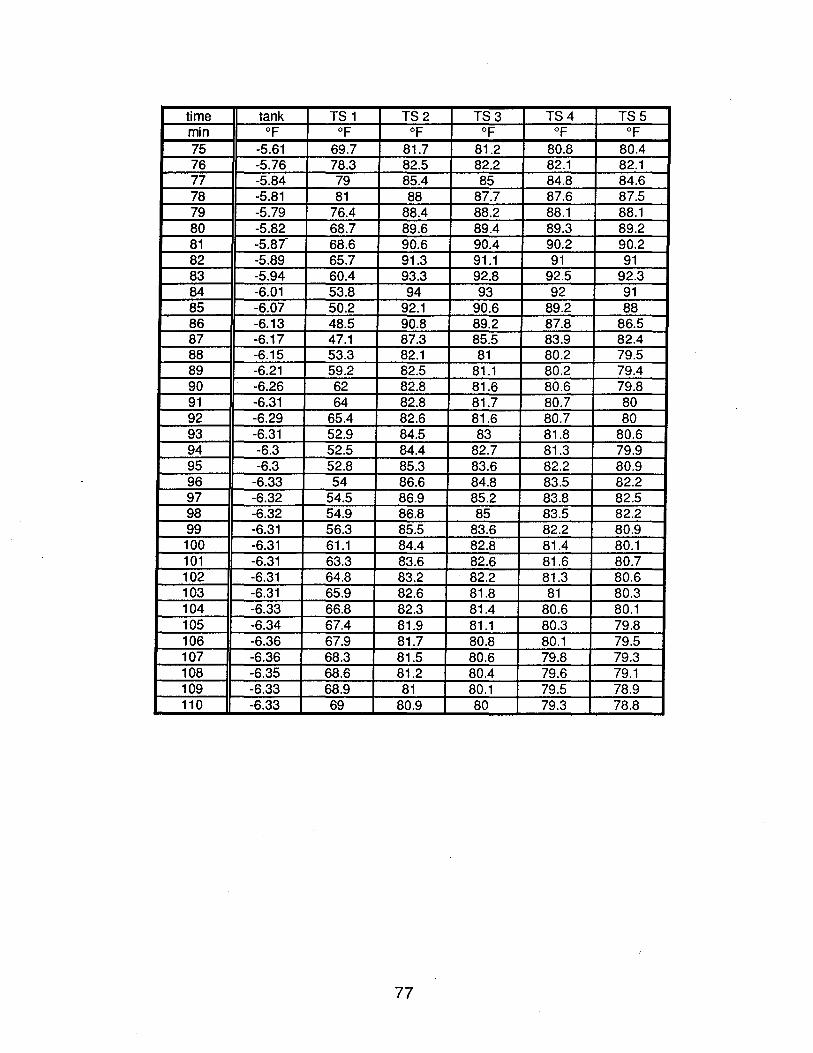
time tank TS 1 TS2 TS3 TS4 TS5 min of OF OF OF OF of
75 -5.61 69.7 81.7 81.2 80.8 80.4 76 -5.76 78.3 82.5 82.2 82.1 82.1 77 -5.84 79 85.4 85 84.8 84.6 78 -5.81 81 88 87.7 87.6 87.5 79 -5.79 76.4 88.4 88.2 88.1 88.1 80 -5.82 68.7 89.6 89.4 89.3 89.2 81 -5.87- 68.6 90.6 90.4 90.2 90.2 82 -5.89 65.7 91.3 91.1 91 91 83 -5.94 60.4 93.3 92.8 92.5 92.3 84 -6.01 53.8 94 93 92 91 85 -6.07 50.2 92.1 90.6 89.2 88 86 -6.13 48.5 90.8 89.2 87.8 86.5 87 -6.17 47.1 87.3 85.5 83.9 82.4 88 -6.15 53.3 82.1 81 80.2 79.5 89 -6.21 59.2 82.5 81.1 80.2 79.4 90 -6.26 62 82.8 81.6 80.6 79.8 91 -6.31 64 82.8 81.7 80.7 80 92 -6.29 65.4 82.6 81.6 80.7 80 93 -6.31 52.9 84.5 83 81.8 80.6 94 -6.3 52.5 84.4 82.7 81.3 79.9 95 -6.3 52.8 85.3 83.6 82.2 80.9 96 -6.33 54 86.6 84.8 83.5 82.2 97 -6.32 54.5 86.9 85.2 83.8 82.5 98 -6.32 54.9 86.8 85 83.5 82.2 99 -6.31 56.3 85.5 83.6 82.2 80.9 100 -6.31 61.1 84.4 82.8 81.4 80.1 101 -6.31 63.3 83.6 82.6 81.6 80.7 102 -6.31 64.8 83.2 82.2 81.3 80.6 103 -6.31 65.9 82.6 81.8 81 80.3 104 -6.33 66.8 82.3 81.4 80.6 80.1 105 -6.34 67.4 81.9 81.1 80.3 79.8 106 -6.36 67.9 81.7 80.8 80.1 79.5 107 -6.36 68.3 81.5 80.6 79.8 79.3 108 -6.35 68.6 81.2 80.4 79.6 79.1 109 -6.33 68.9 81 80.1 79.5 78.9 110 -6.33 69 80.9 80 79.3 78.8
77
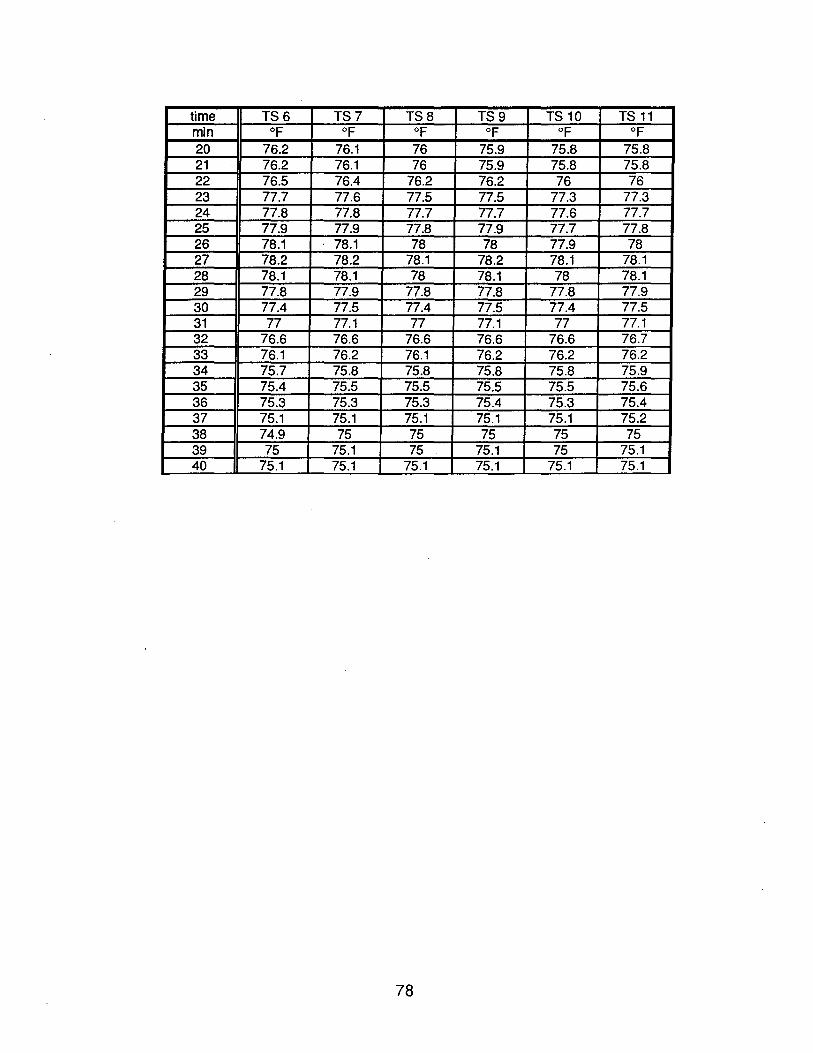
time TS6 TS7 TS8 TS9 TS 10 TS 11 min of OF OF OF of OF 20 76.2 76.1 76 75.9 75.8 75.8 21 76.2 76.1 76 75.9 75.8 75.8 22 76.5 76.4 76.2 76.2 76 76 23 77.7 77.6 77.5 77.5 77.3 77.3 24 77.8 77.8 77.7 77.7 77.6 77.7 25 77.9 77.9 77.8 77.9 77.7 77.8 26 78.1 78.1 78 78 77.9 78 27 78.2 78.2 78.1 78.2 78.1 78.1 28 78.1 78.1 78 78.1 78 78.1 29 77.8 77.9 77.8 77.8 77.8 77.9 30 77.4 77.5 77.4 77.5 77.4 77.5 31 77 77.1 77 77.1 77 77.1 32 76.6 76.6 76.6 76.6 76.6 76.7 33 76.1 76.2 76.1 76.2 76.2 76.2 34 75.7 75.8 75.8 75.8 75.8 75.9 35 75.4 75.5 75.5 75.5 75.5 75.6 36 75.3 75.3 75.3 75.4 75.3 75.4 37 75.1 75.1 75.1 75.1 75.1 75.2 38 74.9 75 75 75 75 75 39 75 75.1 75 75.1 75 75.1 40 75.1 75.1 75.1 75.1 75.1 75.1
78
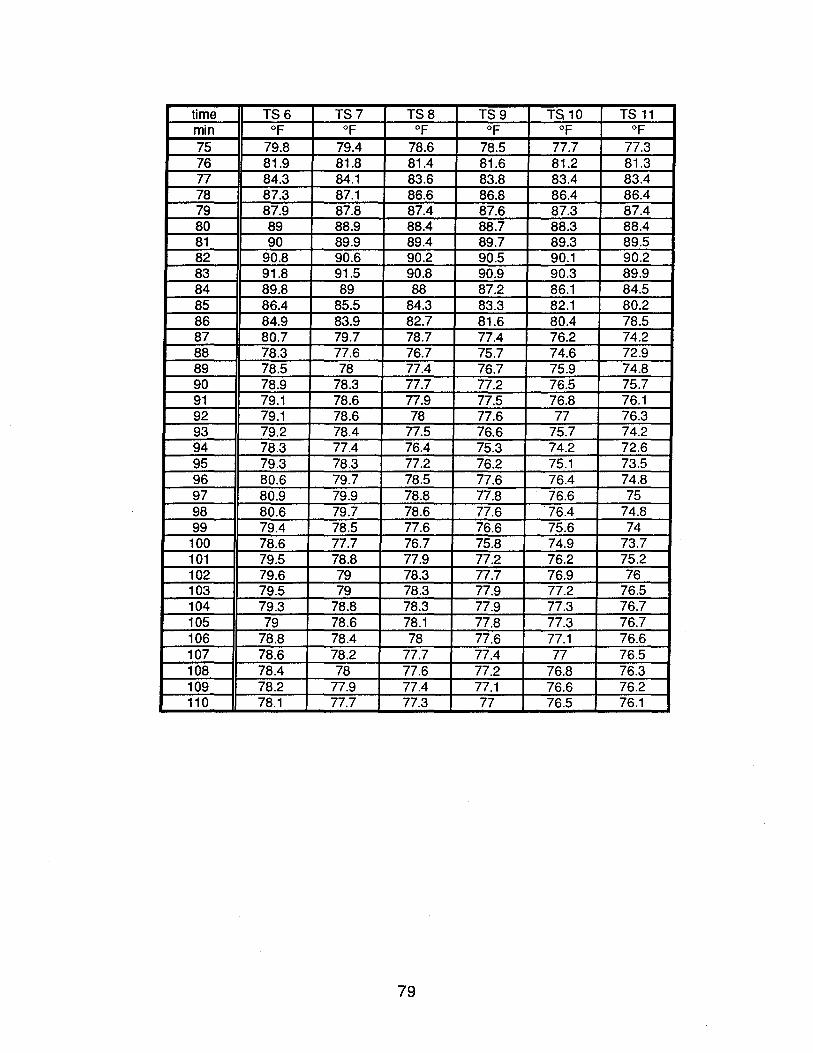
time TS6 TS7 TS8 TS9 TS 10 TS 11 min of of of of OF OF 75 79.8 79.4 78.6 78.5 77.7 77.3 76 81.9 81.8 81.4 81.6 81.2 81.3 77 84.3 84.1 83.6 83.8 83.4 83.4 78 87.3 87.1 86.6 86.8 86.4 86.4 79 87.9 87.8 87.4 87.6 87.3 87.4 80 89 88.9 88.4 88.7 88.3 88.4 81 90 89.9 89.4 89.7 89.3 89.5 82 90.8 90.6 90.2 90.5 90.1 90.2 83 91.8 91.5 90.8 90.9 90.3 89.9 84 89.8 89 88 87.2 86.1 84.5 85 86.4 85.5 84.3 83.3 82.1 80.2 86 84.9 83.9 82.7 81.6 80.4 78.5 87 80.7 79.7 78.7 77.4 76.2 74.2 88 78.3 77.6 76.7 75.7 74.6 72.9 89 78.5 78 77.4 76.7 75.9 74.8 90 78.9 78.3 77.7 77.2 76.5 75.7 91 79.1 78.6 77.9 77.5 76.8 76.1 92 79.1 78.6 78 77.6 77 76.3 93 79.2 78.4 77.5 76.6 75.7 74.2 94 78.3 77.4 76.4 75.3 74.2 72.6 95 79.3 78.3 77.2 76.2 75.1 73.5 96 80.6 79.7 78.5 77.6 76.4 74.8 97 80.9 79.9 78.8 77.8 76.6 75 98 80.6 79.7 78.6 77.6 ·76.4 74.8 99 79.4 78.5 77.6 76.6 75.6 74
100 78.6 77.7 76.7 75.8 74.9 73.7 101 79.5 78.8 77.9 77.2 76.2 75.2 102 79.6 79 78.3 77.7 76.9 76 103 79.5 79 78.3 77.9 77.2 76.5 104 79.3 78.8 78.3 77.9 77.3 76.7 105 79 78.6 78.1 77.8 77.3 76.7 106 78.8 78.4 78 77.6 77.1 76.6 107 78.6 78.2 77.7 77.4 77 76.5 108 78.4 78 77.6 77.2 76.8 76.3 109 78.2 77.9 77.4 77.1 76.6 76.2 110 78.1 77.7 77.3 77 76.5 76.1
79
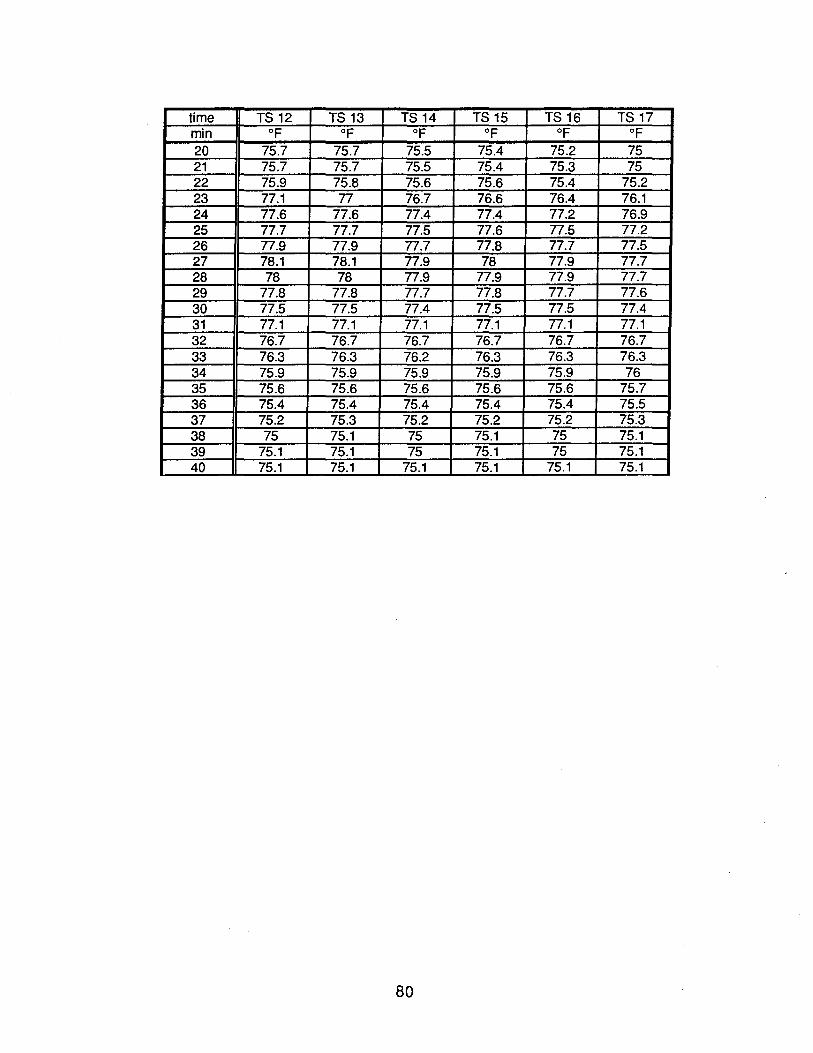
time TS 12 TS 13 TS 14 TS 15 TS 16 TS 17 min of of of of of of 20 75.7 75.7 75.5 75.4 75.2 75 21 75.7 75.7 75.5 75.4 75.3 75 22 75.9 75.8 75.6 75.6 75.4 75.2 23 77.1 77 76.7 76.6 76.4 76.1 24 77.6 77.6 77.4 77.4 77.2 76.9 25 77.7 77.7 77.5 77.6 77.5 77.2 26 77.9 77.9 77.7 77.8 77.7 77.5 27 78.1 78.1 77.9 78 77.9 77.7 28 78 78 77.9 77.9 77.9 77.7 29 77.8 77.8 77.7 77.8 77.7 77.6 30 77.5 77.5 77.4 77.5 77.5 77.4 31 77.1 77.1 77.1 77.1 77.1 77.1 32 76.7 76.7 76.7 76.7 76.7 76.7 33 76.3 76.3 76.2 76.3 76.3 76.3 34 75.9 75.9 75.9 75.9 75.9 76 35 75.6 75.6 75.6 75.6 75.6 75.7 36 75.4 75.4 75.4 75.4 75.4 75.5 37 75.2 75.3 75.2 75.2 75.2 75.3 38 75 75.1 75 75.1 75 75.1 39 75.1 75.1 75 75.1 75 75.1 40 75.1 75.1 75.1 75.1 75.1 75.1
80
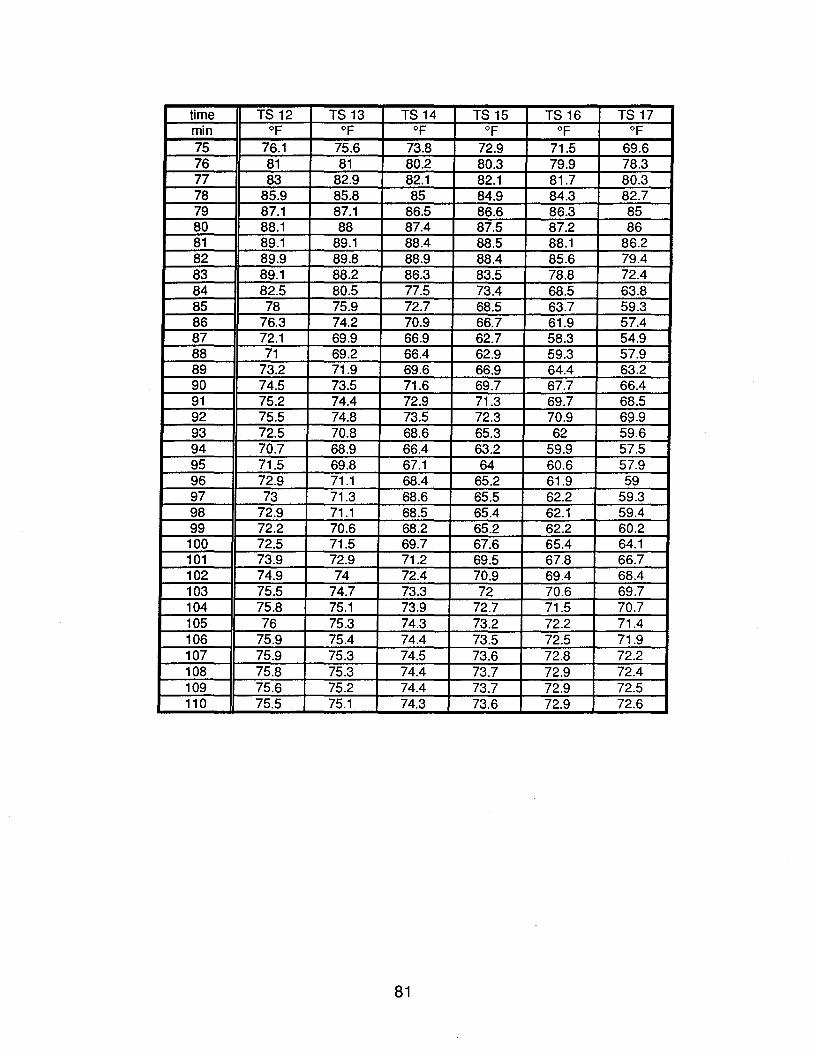
time TS 12 TS 13 TS 14 TS 15 TS 16 TS 17 min of of of of OF of 75 76.1 75.6 73.8 72.9 71.5 69.6 76 81 81 80.2 80.3 79.9 78.3 77 83 82.9 82.1 82.1 81.7 80.3 78 85.9 85.8 85 84.9 84.3 82.7 79 87.1 87.1 86.5 86.6 86.3 85 80 88.1 88 87.4 87.5 87.2 86 81 89.1 89.1 88.4 88.5 88.1 86.2 82 89.9 89.8 88.9 88.4 85.6 79.4 83 89.1 88.2 86.3 83.5 78.8 72.4 84 82.5 80.5 77.5 73.4 68.5 63.8 85 78 75.9 72.7 68.5 63.7 59.3 86 76.3 74.2 70.9 66.7 61.9 57.4 87 72.1 69.9 66.9 62.7 58.3 54.9 88 71 69.2 66.4 62.9 59.3 57.9 89 73.2 71.9 69.6 66.9 64.4 63.2 90 74.5 73.5 71.6 69.7 67.7 66.4 91 75.2 74.4 72.9 71.3 69.7 68.5 92 75.5 74.8 73.5 72.3 70.9 69.9 93 72.5 70.8 68.6 65.3 62 59.6 94 70.7 68.9 66.4 63.2 59.9 57.5 95 71.5 69.8 67.1 64 60.6 57.9 96 72.9 71.1 68.4 65.2 61.9 59 97 73 71.3 68.6 65.5 62.2 59.3 98 72.9 71.1 68.5 65.4 62.1 59.4 99 72.2 70.6 68.2 65.2 62.2 60.2
100 72.5 71.5 69.7 67.6 65.4 64.1 101 73.9 72.9 71.2 69.5 67.8 66.7 102 74.9 74 72.4 70.9 69.4 68.4 103 75.5 74.7 73.3 72 70.6 69.7 104 75.8 75.1 73.9 72.7 71.5 70.7 105 76 75.3 74.3 73.2 72.2 71.4 106 75.9 75.4 74.4 73.5 72.5 71.9 107 75.9 75.3 74.5 73.6 72.8 72.2 108 75.8 75.3 74.4 73.7 72.9 72.4 109 75.6 75.2 74.4 73.7 72.9 72.5 110 75.5 75.1 74.3 73.6 72.9 72.6
81
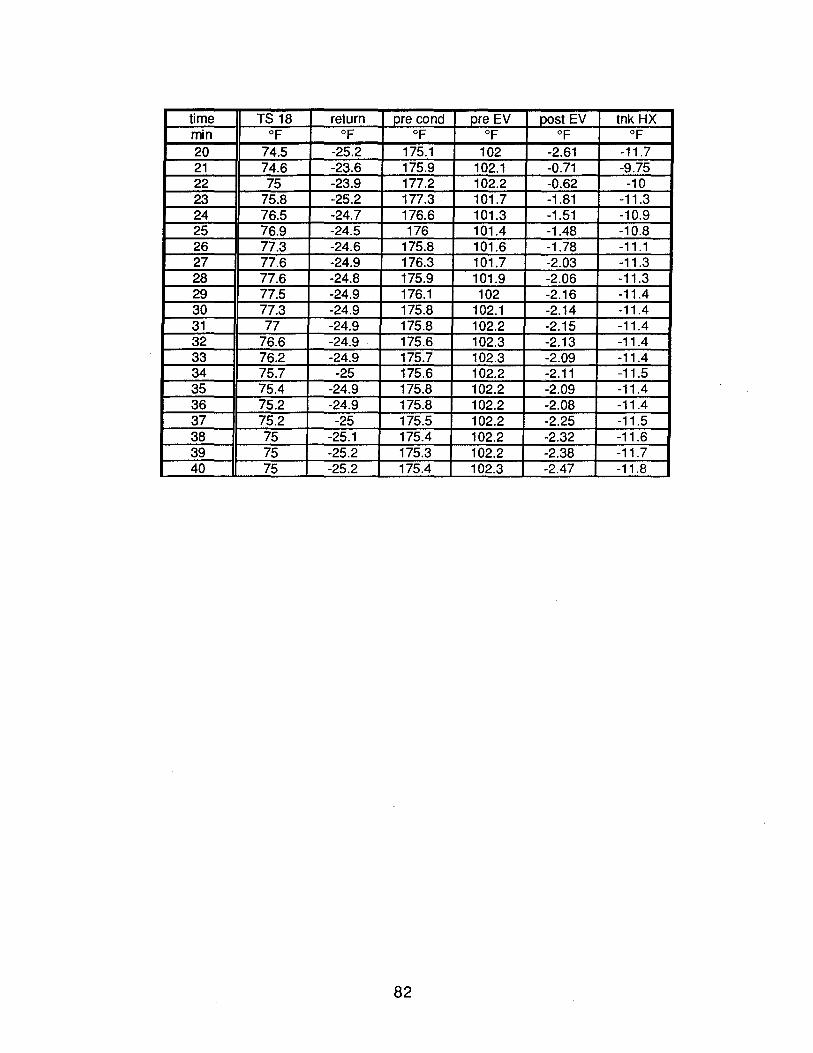
time TS 18 return pre cond pre EV post EV tnk HX min of of of OF of of 20 74.5 -25.2 175.1 102 -2.61 -11.7 21 74.6 -23.6 175.9 102.1 -0.71 -9.75 22 75 -23.9 177.2 102.2 -0.62 -10 23 75.8 -25.2 177.3 101.7 -1.81 -11.3 24 76.5 -24.7 176.6 101.3 -1.51 -10.9 25 76.9 -24.5 176 101.4 -1.48 -10.8 26 77.3 -24.6 175.8 101.6 -1.78 -11.1 27 77.6 -24.9 176.3 101.7 -2.03 -11.3 28 77.6 -24.8 175.9 101.9 -2.06 -11.3 29 77.5 -24.9 176.1 102 -2.16 -11.4 30 77.3 -24.9 175.8 102.1 -2.14 -11.4 31 77 -24.9 175.8 102.2 -2.15 -11.4 32 76.6 -24.9 175.6 102.3 -2.13 -11.4 33 76.2 -24.9 175.7 102.3 -2.09 -11.4 34 75.7 -25 175.6 102.2 -2.11 -11.5 35 75.4 -24.9 175.8 102.2 -2.09 -11.4 36 75.2 -24.9 175.8 102.2 -2.08 -11.4 37 75.2 -25 175.5 102.2 -2.25 -11.5 38 75 -25.1 175.4 102.2 -2.32 -11.6 39 75 -25.2 175.3 102.2 -2.38 -11.7 40 75 -25.2 175.4 102.3 -2.47 -11.8
82
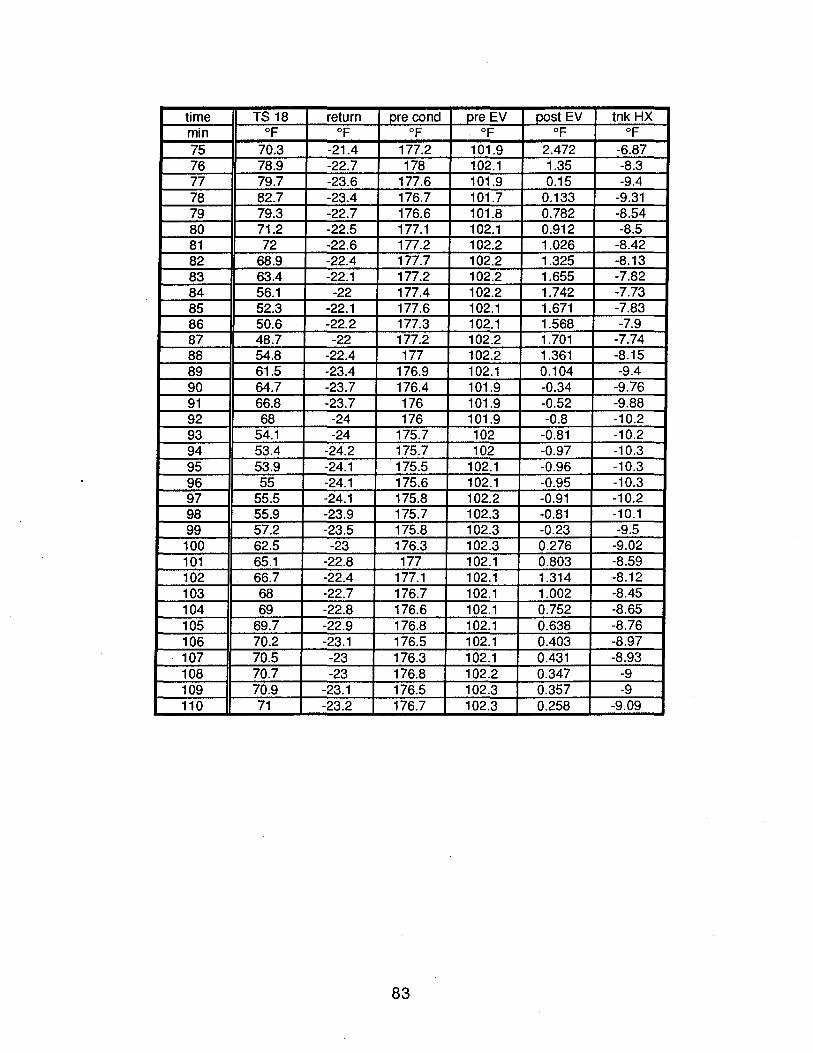
time TS 18 return pre cond pre EV post EV tnk HX min of OF OF of of OF 75 70.3 -21.4 177.2 101.9 2.472 -6.87 76 78.9 -22.7 178 102.1 1.35 -8.3 77 79.7 -23.6 177.6 101.9 0.15 -9.4 78 82.7 -23.4 176.7 101.7 0.133 -9.31 79 79.3 -22.7 176.6 101.8 0.782 -8.54 80 71.2 -22.5 177.1 102.1 0.912 -8.5 81 72 -22.6 177.2 102.2 1.026 -8.42 82 68.9 -22.4 177.7 102.2 1.325 -8.13 83 63.4 -22.1 177.2 102.2 1.655 -7.82 84 56.1 -22 177.4 102.2 1.742 -7.73 85 52.3 -22.1 177.6 102.1 1.671 -7.83 86 50.6 -22.2 177.3 102.1 1.568 -7.9 87 48.7 -22 177.2 102.2 1.701 -7.74 88 54.8 -22.4 177 102.2 1.361 -8.15 89 61.5 -23.4 176.9 102.1 0.104 -9.4 90 64.7 -23.7 176.4 101.9 -0.34 -9.76 91 66.8 -23.7 176 101.9 -0.52 -9.88 92 68 -24 176 101.9 -0.8 -10.2 93 54.1 -24 175.7 102 -0.81 -10.2 94 53.4 -24.2 175.7 102 -0.97 -10.3 95 53.9 -24.1 175.5 102.1 -0.96 -10.3 96 55 -24.1 175.6 102.1 -0.95 -10.3 97 55.5 -24.1 175.8 102.2 -0.91 -10.2 98 55.9 -23.9 175.7 102.3 -0.81 -10.1 99 57.2 -23.5 175.8 102.3 -0.23 -9.5
100 62.5 -23 176.3 102.3 0.276 -9.02 101 65.1 -22.8 177 102.1 0.803 -8.59 102 66.7 -22.4 177.1 102.1 1.314 -8.12 103 68 -22.7 176.7 102.1 1.002 -8.45 104 69 -22.8 176.6 102.1 0.752 -8.65 105 69.7 -22.9 176.8 102.1 0.638 -8.76 106 70.2 -23.1 176.5 102.1 0.403 -8.97 107 70.5 -23 176.3 102.1 0.431 -8.93 108 70.7 -23 176.8 102.2 0.347 -9 109 70.9 -23.1 176.5 102.3 0.357 -9 110 71 -23.2 176.7 102.3 0.258 -9.09
83
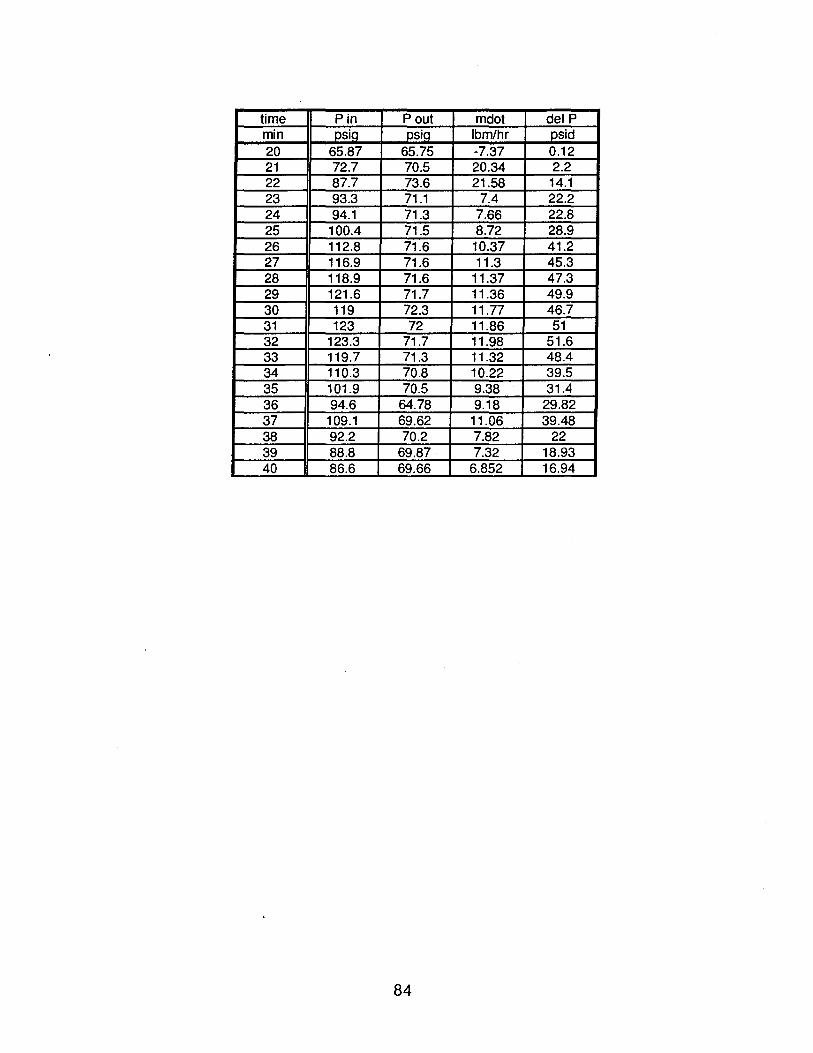
time Pin Pout mdot delP min psig psig Ibm/hr psid 20 65.87 65.75 -7.37 0.12 21 72.7 70.5 20.34 2.2 22 87.7 73.6 21.58 14.1 23 93.3 71.1 7.4 22.2 24 94.1 71.3 7.66 22.8 25 100.4 71.5 8.72 28.9 26 112.8 71.6 10.37 41.2 27 116.9 71.6 11.3 45.3 28 118.9 71.6 11.37 47.3 29 121.6 71.7 11.36 49.9 30 119 72.3 11.77 46.7 31 123 72 11.86 51 32 123.3 71.7 11.98 51.6 33 119.7 71.3 11.32 48.4 34 110.3 70.8 10.22 39.5 35 101.9 70.5 9.38 31.4 36 94.6 64.78 9.18 29.82 37 109.1 69.62 11.06 39.48 38 92.2 70.2 7.82 22 39 88.8 69.87 7.32 18.93 40 86.6 69.66 6.852 16.94
84
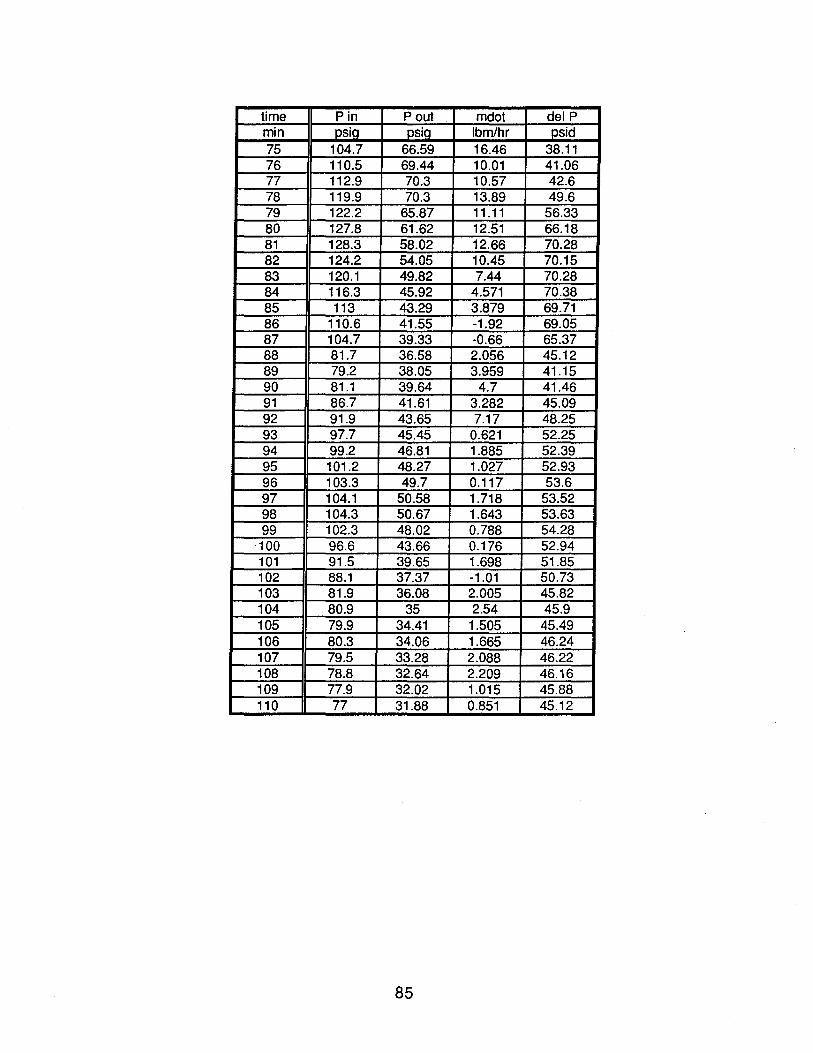
time Pin Pout mdot delP min psio psio Ibrn/hr psid 75 104.7 66.59 16.46 38.11 76 110.5 69.44 10.01 41.06 77 112.9 70.3 10.57 42.6 78 119.9 70.3 13.89 49.6 79 122.2 65.87 11.11 56.33 80 127.8 61.62 12.51 66.18 81 128.3 58.02 12.66 70.28 82 124.2 54.05 10.45 70.15 83 120.1 49.82 7.44 70.28 84 116.3 45.92 4.571 70.38 85 113 43.29 3.879 69.71 86 110.6 41.55 -1.92 69.05 87 104.7 39.33 -0.66 65.37 88 81.7 36.58 2.056 45.12 89 79.2 38.05 3.959 41.15 90 81.1 39.64 4.7 41.46 91 86.7 41.61 3.282 45.09 92 91.9 43.65 7.17 48.25 93 97.7 45.45 0.621 52.25 94 99.2 46.81 1.885 52.39 95 101.2 48.27 1.027 52.93 96 103.3 49.7 0.117 53.6 97 104.1 50.58 1.718 53.52 98 104.3 50.67 1.643 53.63 99 102.3 48.02 0.788 54.28
100 96.6 43.66 0.176 52.94 101 91.5 39.65 1.698 51.85 102 88.1 37.37 -1.01 50.73 103 81.9 36.08 2.005 45.82 104 80.9 35 2.54 45.9 105 79.9 34.41 1.505 45.49 106 80.3 34.06 1.665 46.24 107 79.5 33.28 2.088 46.22 108 78.8 32.64 2.209 46.16 109 77.9 32.02 1.015 45.88 110 77 31.88 0.851 45.12
85
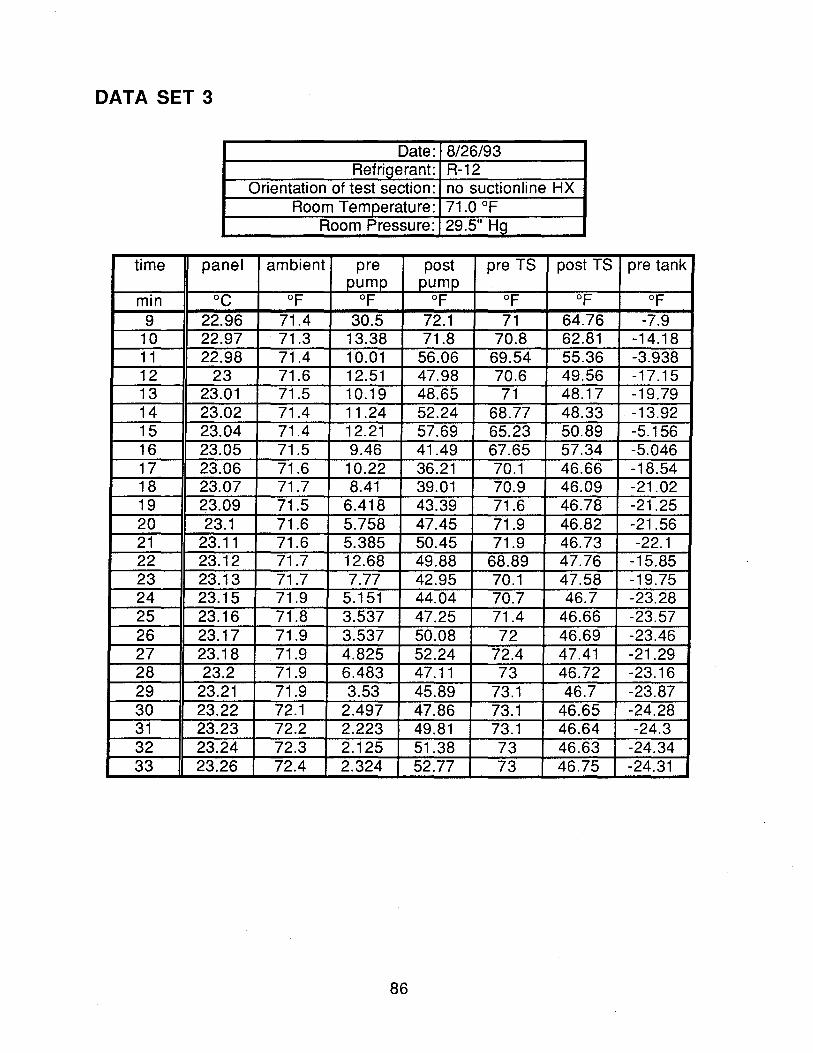
DATA SET 3
Date: 8/26/93 Refrigerant: R-12
Orientation of test section: no suctionline HX Room Temperature: 71.0 of
Room Pressure: 29.5" Hg
time panel ambient pre post pre TS post TS pre tank pump pump
min °C of OF OF OF OF OF 9 22.96 71.4 30.5 72.1 71 64.76 -7.9
10 22.97 71.3 13.38 71.8 70.8 62.81 -14.18 11 22.98 71.4 10.01 56.06 69.54 55.36 -3.938 12 23 71.6 12.51 47.98 70.6 49.56 -17.15 13 23.01 71.5 10.19 48.65 71 48.17 -19.79 14 23.02 71.4 11.24 52.24 68.77 48.33 . -13.92 15 23.04 71.4 12.21 57.69 65.23 50.89 -5.156 16 23.05 71.5 9.46 41.49 67.65 57.34 -5.046 17 23.06 71.6 10.22 36.21 70.1 46.66 -18.54 18 23.07 71.7 8.41 39.01 70.9 46.09 -21.02 19 23.09 71.5 6.418 43.39 71.6 46.78 -21.25 20 23.1 71.6 5.758 47.45 71.9 46.82 -21.56 21 23.11 71.6 5.385 50.45 71.9 46.73 -22.1 22 23.12 71.7 12.68 49.88 68.89 47.76 -15.85 23 23.13 71.7 7.77 42.95 70.1 47.58 -19.75 24 23.15 71.9 5.151 44.04 70.7 46.7 -23.28 25 23.16 71.8 3.537 . 47.25 71.4 46.66 -23.57 26 23.17 71.9 3.537 50.08 72 46.69 -23.46 27 23.18 71.9 4.825 52.24 72.4 47.41 -21.29 28 23.2 71.9 6.483 47.11 73 46.72 -23.16 29 23.21 71.9 3.53 45.89 73.1 46.7 -23.87 30 23.22 72.1 2.497 47.86 73.1 46.65 -24.28 31 23.23 72.2 2.223 49.81 73.1 46.64 -24.3 32 23.24 72.3 2.125 51.38 73 46.63 -24.34 33 23.26 72.4 2.324 52.77 73 46.75 -24.31
86
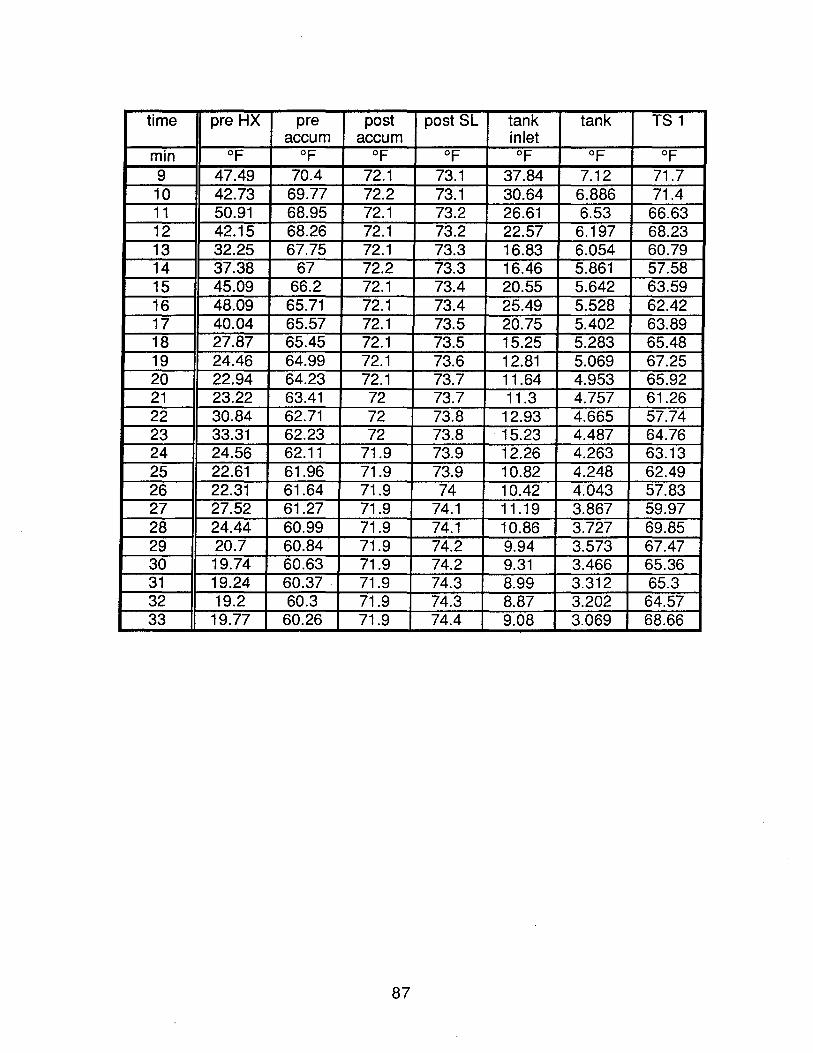
time pre HX pre post post SL tank tank TS 1 accum accum inlet
min of OF OF of of of OF 9 47.49 70.4 72.1 73.1 37.84 7.12 71.7 10 42.73 69.77 72.2 73.1 30.64 6.886 71.4 11 50.91 68.95 72.1 73.2 26.61 6.53 66.63 12 42.15 68.26 72.1 73.2 22.57 6.197 68.23 13 32.25 67.75 72.1 73.3 16.83 6.054 60.79 14 37.38 67 72.2 73.3 16.46 5.861 57.58 15 45.09 66.2 72.1 73.4 20.55 5.642 63.59 16 48.09 65.71 72.1 73.4 25.49 5.528 62.42 17 40.04 65.57 72.1 73.5 20.75 5.402 63.89 18 27.87 65.45 72.1 73.5 15.25 5.283 65.48 19 24.46 64.99 72.1 73.6 12.81 5.069 67.25 20 22.94 64.23 72.1 73.7 11.64 4.953 65.92 21 23.22 63.41 72 73.7 11.3 4.757 61.26 22 30.84 62.71 72 73.8 12.93 4.665 57.74 23 33.31 62.23 72 73.8 15.23 4.487 64.76 24 24.56 62.11 71.9 73.9 12.26 4.263 63.13 25 22.61 61.96 71.9 73.9 10.82 4.248 62.49 26 22.31 61.64 71.9 74 10.42 4.043 57.83 27 27.52 61.27 71.9 74.1 11.19 3.867 59.97 28 24.44 60.99 71.9 74.1 10.86 3.727 69.85 29 20.7 60.84 71.9 74.2 9.94 3.573 67.47 30 19.74 60.63 71.9 74.2 9.31 3.466 65.36 31 19.24 60.37 71.9 74.3 8.99 3.312 65.3 32 19.2 60.3 71.9 74.3 8.87 3.202 64.57 33 19.77 60.26 71.9 74.4 9.08 3.069 68.66
87
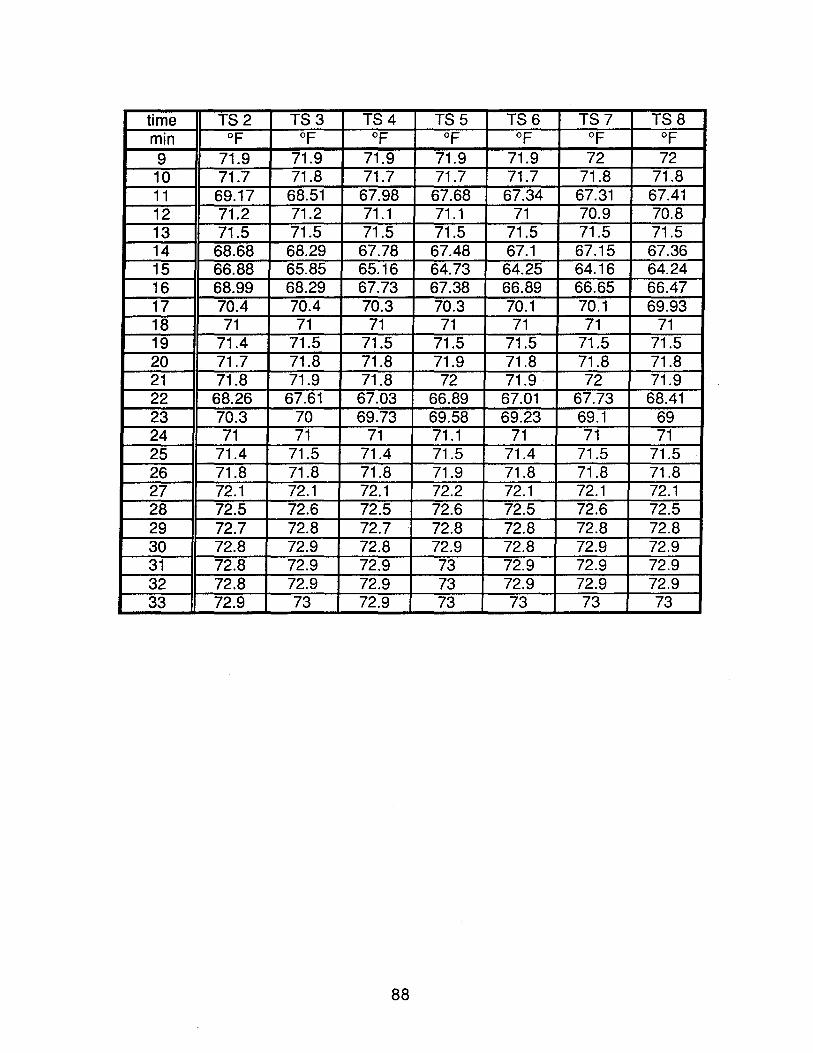
time TS2 TS3 TS4 TS5 TS6 TS7 TS8 min of of of of of of of 9 71.9 71.9 71.9 71.9 71.9 72 72 10 71.7 71.8 71.7 71.7 71.7 71.8 71.8 11 69.17 68.51 67.98 67.68 67.34 67.31 67.41 12 71.2 71.2 71.1 71.1 71 70.9 70.8 13 71.5 71.5 71.5 71.5 71.5 71.5 71.5 14 68.68 68.29 67.78 67.48 67.1 67.15 67.36 15 66.88 65.85 65.16 64.73 64.25 64.16 64.24 16 68.99 68.29 67.73 67.38 66.89 66.65 66.47 17 70.4 70.4 70.3 70.3 70.1 70.1 69.93 18 71 71 71 71 71 71 71 19 71.4 71.5 71.5 71.5 71.5 71.5 71.5 20 71.7 71.8 71.8 71.9 71.8 71.8 71.8 21 71.8 71.9 71.8 72 71.9 72 71.9 22 68.26 67.61 67.03 66.89 67.01 67.73 68.41 23 70.3 70 69.73 69.58 69.23 69.1 69 24 71 71 71 71.1 71 71 71 25 71.4 71.5 71.4 71.5 71.4 71.5 71.5 26 71.8 71.8 71.8 71.9 71.8 71.8 71.8 27 72.1 72.1 72.1 72.2 72.1 72.1 72.1 28 72.5 72.6 72.5 72.6 72.5 72.6 72.5 29 72.7 72.8 72.7 72.8 72.8 72.8 72.8 30 72.8 72.9 72.8 72.9 72.8 72.9 72.9 31 72.8 72.9 72.9 73 72.9 72.9 72.9 32 72.8 72.9 72.9 73 72.9 72.9 72.9 33 72.9 73 72.9 73 73 73 73
88
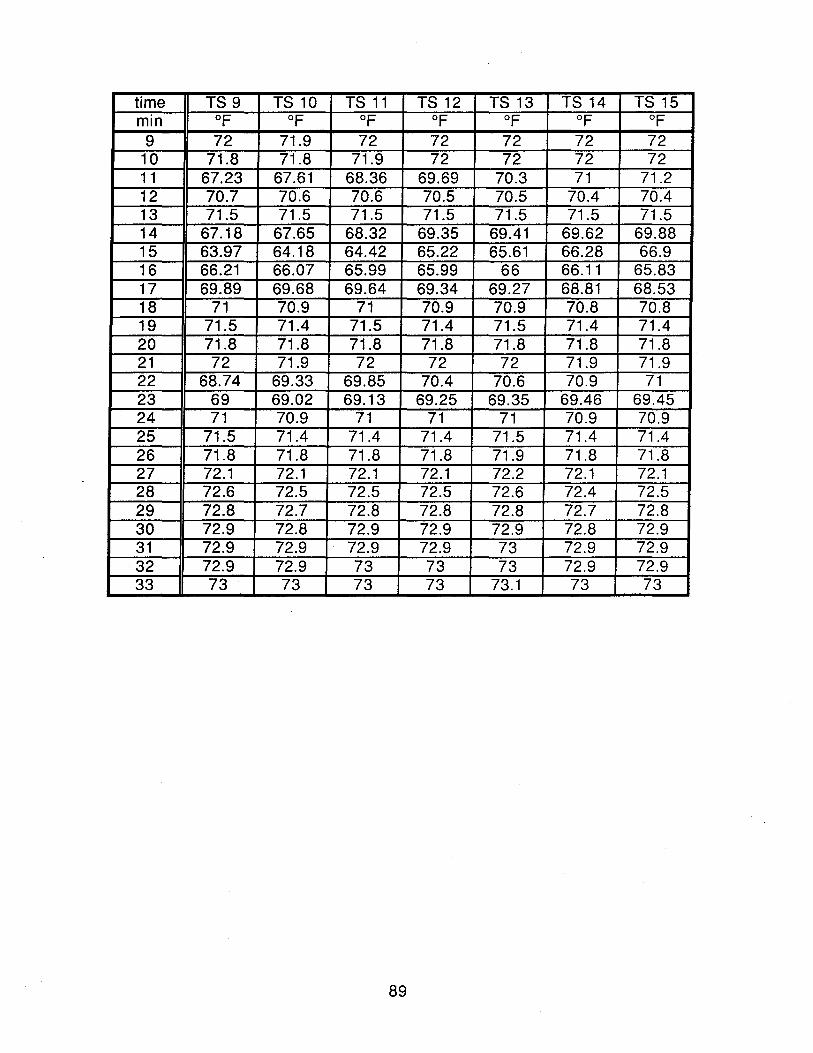
time TS 9 TS 10 TS 11 TS 12 TS 13 TS 14 TS 15 min of of of of of of of
9 72 71.9 72 72 72 72 72 10 71.8 71.8 71.9 72 72 72 72 11 67.23 67.61 68.36 69.69 70.3 71 71.2 12 70.7 70.6 70.6 70.5 70.5 70.4 70.4 13 71.5 71.5 71.5 71.5 71.5 71.5 71.5 14 67.18 67.65 68.32 69.35 69.41 69.62 69.88 15 63.97 64.18 64.42 65.22 65.61 66.28 66.9 16 66.21 66.07 65.99 65.99 66 66.11 65.83 17 69.89 69.68 69.64 69.34 69.27 68.81 68.53 18 71 70.9 71 70.9 70.9 70.8 70.8 19 71.5 71.4 71.5 71.4 71.5 71.4 71.4 20 71.8 71.8 71.8 71.8 71.8 71.8 71.8 21 72 71.9 72 72 72 71.9 71.9 22 68.74 69.33 69.85 70.4 70.6 70.9 71 23 69 69.02 69.13 69.25 69.35 69.46 69.45 24 71 70.9 71 71 71 70.9 70.9 25 71.5 71.4 71.4 71.4 71.5 71.4 71.4 26 71.8 71.8 71.8 71.8 71.9 71.8 71.8 27 72.1 72.1 72.1 72.1 72.2 72.1 72.1 28 72.6 72.5 72.5 72.5 72.6 72.4 72.5 29 72.8 72.7 72.8 72.8 72.8 72.7 72.8 30 72.9 72.8 72.9 72.9 72.9 72.8 72.9 31 72.9 72.9 72.9 72.9 73 72.9 72.9 32 72.9 72.9 73 73 73 72.9 72.9 33 73 73 73 73 73.1 73 73
89
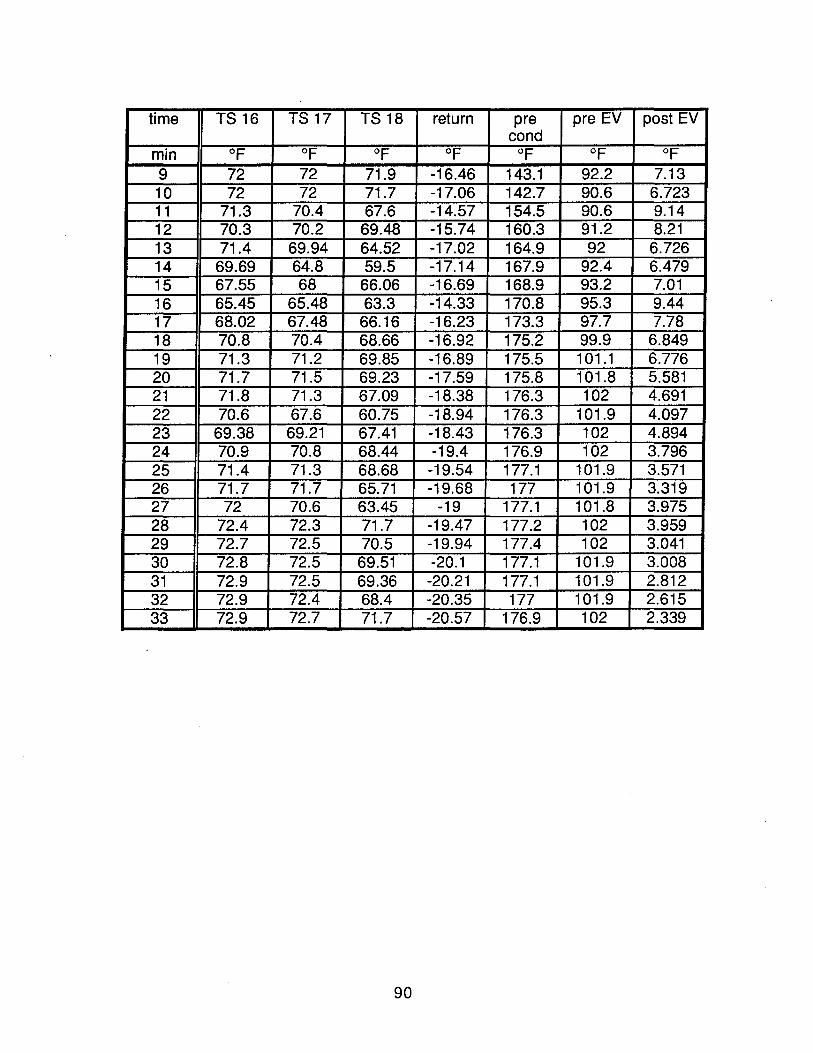
time TS16 TS17 TS18 return pre pre EV post EV cond
min of of of of of of of 9 72 72 71.9 -16.46 143.1 92.2 7.13 10 72 72 71.7 -17.06 142.7 90.6 6.723 11 71.3 70.4 67.6 -14.57 154.5 90.6 9.14 12 70.3 70.2 69.48 -15.74 160.3 91.2 8.21 13 71.4 69.94 64.52 -17.02 164.9 92 6.726 14 69.69 64.8 59.5 -17.14 167.9 92.4 6.479 15 67.55 68 66.06 -16.69 168.9 93.2 7.01 16 65.45 65.48 63.3 -14.33 170.8 95.3 9.44 17 68.02 67.48 66.16 -16.23 173.3 97.7 7.78 18 70.8 70.4 68.66 -16.92 175.2 99.9 6.849 19 71.3 71.2 69.85 -16.89 175.5 101.1 6.776 20 71.7 71.5 69.23 -17.59 175.8 101.8 5.581 21 71.8 71.3 67.09 -18.38 176.3 102 4.691 22 70.6 67.6 60.75 -18.94 176.3 101.9 4.097 23 69.38 69.21 67.41 -18.43 176.3 102 4.894 24 70.9 70.8 68.44 -19.4 176.9 102 3.796 25 71.4 71.3 68.68 -19.54 177.1 101.9 3.571 26 71.7 71.7 65.71 -19.68 177 101.9 3.319 27 72 70.6 63.45 -19 177.1 101.8 3.975 28 72.4 72.3 71.7 -19.47 177.2 102 3.959 29 72.7 72.5 70.5 -19.94 177.4 102 3.041 30 72.8 72.5 69.51 -20.1 177.1 101.9 3.008 31 72.9 72.5 69.36 -20.21 177.1 101.9 2.812 32 72.9 72.4 68.4 -20.35 177 101.9 2.615 33 72.9 72.7 71.7 -20.57 176.9 102 2.339
90
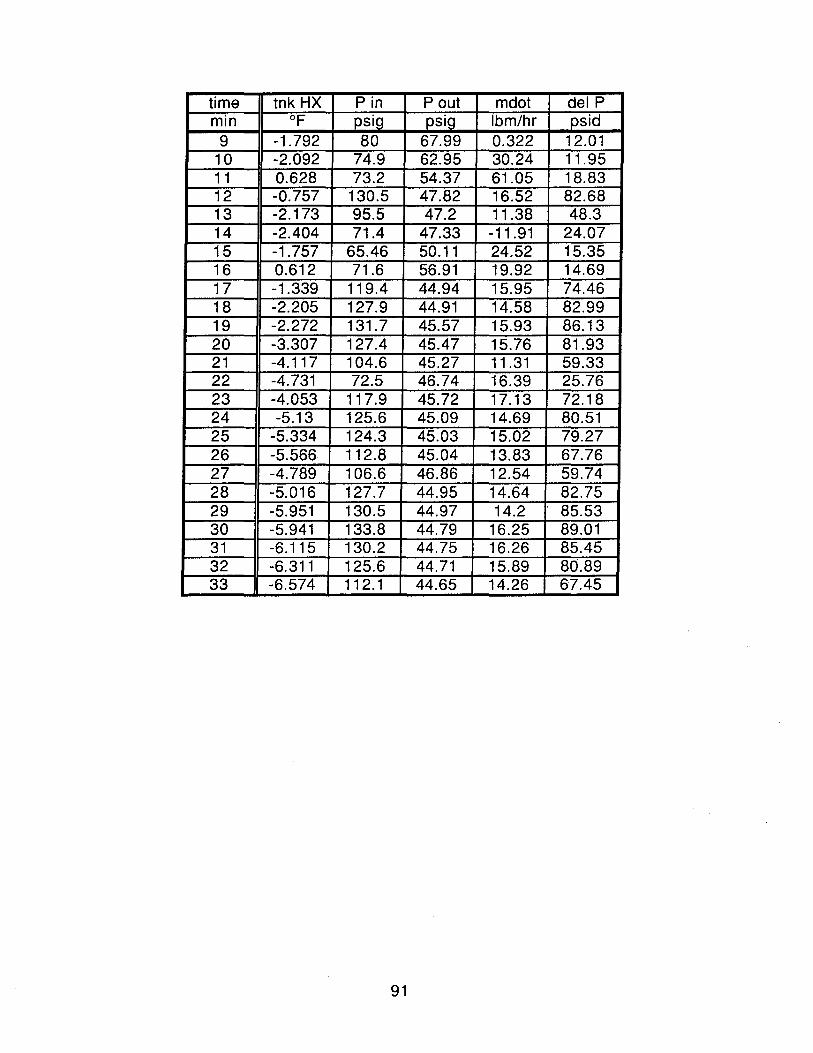
time tnk HX Pin Pout mdot del P min OF psig psig Ibm/hr psid
9 -1.792 80 67.99 0.322 12.01 10 -2.092 74.9 62.95 30.24 11.95 11 0.628 73.2 54.37 61.05 18.83 12 -0.757 130.5 47.82 16.52 82.68 13 -2.173 95.5 47.2 11.38 48.3 14 -2.404 71.4 47.33 -11.91 24.07 15 -1.757 65.46 50.11 24.52 15.35 16 0.612 71.6 56.91 19.92 14.69 17 -1.339 119.4 44.94 15.95 74.46 18 -2.205 127.9 44.91 14.58 82.99 19 -2.272 131.7 45.57 15.93 86.13 20 -3.307 127.4 45.47 15.76 81.93 21 -4.117 104.6 45.27 11.31 59.33 22 -4.731 72.5 46.74 16.39 25.76 23 -4.053 117.9 45.72 17.13 72.18 24 -5.13 125.6 45.09 14.69 80.51 25 -5.334 124.3 45.03 15.02 79.27 26 -5.566 112.8 45.04 13.83 67.76 27 -4.789 106.6 46.86 12.54 59.74 28 -5.016 127.7 44.95 14.64 82.75 29 -5.951 130.5 44.97 14.2 85.53 30 -5.941 133.8 44.79 16.25 89.01 31 -6.115 130.2 44.75 16.26 85.45 32 -6.311 125.6 44.71 15.89 80.89 33 -6.574 112.1 44.65 14.26 67.45
91