Embed Size (px)
Citation preview

N A S A C O N T R A C T O R R E P O R T
LOAN COPY: RETURN TO AFWL (DQUL)
M1IWTbAND AFB, N. M.
DESIGN OF A CONVECTIVE COOLING SYSTEM FOR A MACH 6 HYPERSONIC TRANSPORT AIRFRAME
If $1 by R. G. Helenbrook and F. M . Anthony ,
\
Prepared by
BELL AEROSPACE COMPANY Buffalo, N.Y . 14240
f o r LangZey Research Center
NATIONAL AERONAUTICS AND SPACE ADMINISTRATION WASHINGTON, D. C. DECEMBER 1971
I - ~. - .-
TECH LIBRARY KAFB, NM
1. Report No. 2. Government Accession No. 3. ReCiF
NASA CR-1918 00b0979 I
4. Title and Subtitle 5. Report Date
DESIGN OF A CONVECTIVE COOLING SYSTEM FOR A MACH 6 6. Performing Organization Code HYPERSOMC TRANSPORT AIRFRAME
December lg71
7. Authork) 8. Performing Organization Report No.
R. G. Helenbrook and F. M. Anthony 7305-903001 10. Work Unit No.
9. Performing Organization Name and Address
Bell Aerospace Company P.O. Box One B a a l o , N.Y. 14240
11. Contract or Grant No. 1 NAS 1-7468
I I 13. Type of Report and Period Covered 12. Sponsoring Agency Name and Address
National Aeronautics and Space Administration Washington, D.C. 20546
I Contractor ReDort I 14. Sponsoring Agency Code
I 15. Supplementary Notes
16. Abstract
Results of analytical and design studies are presented for a water-glycol convective cooling system for the airframe structure of a hypersonic transport. System configurations and weights are compared. The influences of system pressure drop and flow control schedules on
17. Key Words (Suggested by Authorfs) ) 18. Distribution Statement
Hypersonic Transport Cooled Structure Convective Cooling Cooling System Design
I Unclassified - Unlimited
I 19. Security Classif. (of this report) 22. Price' 21. NO. of Pages 20. Security Classif. (of this page)
Unclassified $ 3 .OO 131 Unclassified
For sale by the National Technical Information Service, Springfield, Virginia 22151


FOREWORD
This is one of three final reports on a program to design and evaluate active cooling systems for a Mach 6 cruise vehicle. The work has been accomplished by the Bell Aerospace Company under Contract NAS 1-7468 with the National Aeronautics and Space Administration, Langley Research Center, Hampton, Virginia. F.M. Anthony was program manager, and the principal investigator during the course of the contract was either W. H. McConarty or R.G. Helenbrook. Other personnel contributing to this program were W. N. Meholick (structural design and analysis), M.S. Janis (heat transfer analyses), A. L. Mistretta (line routing studies), D. L. Gillis, J. D. Witsil, Jr., and D.Brzezinski (technical analyses) H.N. Scurrah, J. Witmer, H. Yee, and P. Mitchell. D.E. Fetterman and P.L.Lawing I
were the NASA contract monitors. Final reports have been prepared for each of three parts.
Part I - Design and Evaluation of Active Cooling Systems for Mach 6 Cruise Vehicle Wings.
Part I1 - Evaluation of Active Cooling Systems for a Mach 6 Hypersonic Transport Airframe.
Part I11 - Design of a Convective Cooling System for a Mach 6 Hypersonic Transport kirframe.
Results of Part I11 are presented in this report.
iii


CONTENTS
Section Page
SUMMARY ............................................................. 1
INTRODUCTION ........................................................ 1
SUMMARY OF PRIOR TASKS ............................................ 3 BaselineData ....................................................... 3 Wingstudies ........................................................ 8 Fuselage Studies .................................................... 14 Total Airframe Studies ................................................. 21 ManeuverEffects .................................................... 26
COOLANT DISTRIBUTION SYSTEM DESIGN ................................ 31 H e a t h a d s . . . . . . . . . . . . . . . . . . . . . . . . . . . . . . . . . . . . . . . . . . . . . . . . . . . . . . . . 31 LineRouting . . . . . . . . . . . . . . . . . . . . . . . . . . . . . . . . . . . . . . . . . . . . . . . . . . . . . . . -33 Heat Exchanger Design ................................................ 57 Pumpsizing . . . . . . . . . . . . . . . . . . . . . . . . . . . . . . . . . . . . . . . . t . . . . . . . . . . . . . . . 63 Coolant Flow Control . . . . . . . . . . . . . . . . . . . . . . . . . . . . . . . . . . . . . . . . . . . . . . . . 68
COOLED PANEL DESIGN ................................................ 74 Cooled Panel Design Procedure ......................................... 74 DetailedPanelDesign ................................................ 87 Panelperformance ................................................... 92
SYSTEMINTEGRATION ................................................. . 104 CoolingSystemSummary . . . . . . . . . . . . . . . . . . . . . . . . . . . . . . . . . . . . . . . . . . . . . 104 Structural Interfaces . . . . . . . . . . . . . . . . . . . . . . . . . . . . . . . . . . . . . . . . . . . . . . . . . . 112 Reliability and Redundancy Considerations ................................ 113 Cooling System Performance .......................................... 115
CONCLUSION AND RECOMMENDATION ................................... 121
REFERENCES ............................................... . . . . . . . . . . . 123
V

.. _ . ...._.._."..."....... _. ............ ~ ..
ILLUSTRATIONS
Figure
6 7
8 9
10 11
12
13 14 15 16
17
18
19
20
21
22
23
24
25
Delta Wing Configuration ........................................ Mission Profile for Baseline Vehicle with Modified Descent Profile . . . . . . . . Fuel Flow Rate as a Function of Time for Modified Descent Profiles . . . . . . Schematics of Active Cooling Concept . . . . . . . . . . . . . . . . . . . . . . . . . . . . . . Percentage of Hydrogen Heat Capacity Utilization. Convective Cooling
System. Mach 6. 100. 000 ft. 147. 000 lb/hr. Maximum Hz Temperature - 1.400F . . . . . . . . . . . . . . . . . . . . . . . . . . . . . . . . . . . . . . . .
Thermal Model of Fuselage . . . . . . . . . . . . . . . . . . . . . . . . . . . . . . . . . . . . . . Streamwise Variation of Heating and Temperature for an Uncooled
Fuselage. M = 6. Altitude = 100. 000 ft. a = 8.3" . . . . . . . . . . . . . . . . . . . . Radiation Heat Shield Arrangements. Fuselage . . . . . . . . . . . . . . . . . . . . . . . Percentage of Fuel Flow and Fuel Heat Capacity Required for Airframe
Cooling. End of Cruise Condition. M = 6.0, Altitude = 106. 360 ft. ~ = 5 . 1 4 . . . . . . . . . . . . . . . . . . . . . . . . . . . . . . . . . . . . . . . . . . . . . . . . . . .
Heat Loads on a Cooled Mach 6 Cruise. Tw = 200F. Unshielded . . . . . . . . . . Heat Loads on a Cooled Mach 6 Cruise Vehicle. Tw = 2.00F. 1. 000F
Shieldsystem . . . . . . . . . . . . . . . . . . . . . . . . . . . . . . . . . . . . . . . . . . . . . . Heat Loads on a Cooled Mach 6 Cruise Vehicle. Tw = 200F. 800F
Shieldsystem . . . . . . . . . . . . . . . . . . . . . . . . . . . . . . . . . . . . . . . . . . . . . . Schematic of Fuselage Coolant Distribution System Designs . . . . . . . . . . . . . Wing Distribution System Layout . . . . . . . . . . . . . . . . . . . . . . . . . . . . . . . . . Schematic of Distribution System Weight Optimization . . . . . . . . . . . . . . . . Pressure Drop per Unit Length as a Function of Flow Rate and Line
Diameter for a 60-40 Water-Glycol Solution. Turbulent Flow. Temperature = 50F . . . . . . . . . . . . . . . . . . . . . . . . . . . . . . . . . . . . . . . . . .
Pressure Drop per Unit Length as a Function of Flow Rate and Line Diameter for Coolant Temperature of 200F. Turbulent Flow . . . . . . . . . .
Optimum Line Diameters and Unit Weights for Distribution System Water-Glycol Temperature 50F . . . . . . . . . . . . . . . . . . . . . . . . . . . . . . . . .
Optimum Line Diameters and Unit Weights for Distribution System Water-Glycol Temperature 200F . . . . . . . . . . . . . . . . . . . . . . . . . . . . . . . .
Distribution System Line Sizes and Flow Rates for Concept A. 10 ft by 10 ft Panels. Low Pressure System . . . . . . . . . . . . . . . . . . . . . . . . . . . . . .
Line and APS Fuel Weights for the Supply and Return System to the Most Remotepanel . . . . . . . . . . . . . . . . . . . . . . . . . . . . . . . . . . . . . . . . . .
Weight of Supply and Return System for Most Remote Panel. Concept A. 70 psi Allowance for Panel and Heat Exchanger ....................
Distribution System Line Sizes and Flow Rates for Concept B. Low Pressure System . . . . . . . . . . . . . . . . . . . . . . . . . . . . . . . . . . . . . . . . . . . . .
Heat Exchanger Schematic and Operating Conditions at Maximum Heat Load . . . . . . . . . . . . . . . . . . . . . . . . . . . . . . . . . . . . . . . . . . . . . . . . . . . . . .
Counter Flow Heat Exchanger Weight Optimization Heat Load 236 x lo6 BTU/hr. Square Core. No Wall Temperature Constraint . . . . . . . . . . . . . .
Page
4 5 5
11
13 15
17 19
23 28
29
30 34 37 39
40
41
42
43
47
50
51
56
58
61
vi
.

ILLUSTRATlONS (CONT)
Figure Page
26
27 28
29
30
31
32 33 34 35 36 37 38
39 40 41 42 43
44
45 46
47
48 49
50 51 52 53 54
55
56
Heat Exchanger Pressure Drop and Length as a Function of Core Height. Square Core. Offset Fin. Heat Load 236 x lo6 BTU/hr. AT = 182F . . . . .
Efficiencies of Single-Stage Centrifugal Pumps ........................ Impeller Diameter as a Function of Flow Rate and Head Requirements.
Ns=2.000. 7 ) = 8 5 % .......................................... Pump Speed as a Function of Flow Rate and Pump Requirements.
Ns=2,000, 7 ) = 8 5 % ........................................... Pump Weight as a Function of Flow Rate and Head Requirements,
Ns=2.000. r )=85% .......................................... Pump Horsepower as a Function of Flow Rate and Head Requirements.
Ns=2,000, 7 ) = 8 5 % . . . . . . . . . . . . . . . . . . . . . . . . . . . . . . . . . . . . . . . . . . Coolant Flow Control Techniques. Wo = 2.04 x lo6 lb/hr . . . . . . . . . . . . . . Coolant Flow Rate Schedule. Mode 3 . . . . . . . . . . . . . . . . . . . . . . . . . . . . . . Cooled Airframe Structure . . . . . . . . . . . . . . . . . . . . . . . . . . . . . . . . . . . . . . . Temperature Distribution Along a Convectively Cooled Aluminum Panel . . . Coolant Passage Spacing . . . . . . . . . . . . . . . . . . . . . . . . . . . . . . . . . . . . . . . . Coolant Passage Hydraulic Diameter ................................ Coolant Passage Heat Transfer Coefficient, L = 10 ft. T = 125F,
Water-Glycol . . . . . . . . . . . . . . . . . . . . . . . . . . . . . . . . . . . . . . . . . . . . . . Residual Coolant Weight in Panels . . . . . . . . . . . . . . . . . . . . . . . . . . . . . . . . . Relationship of Coolant Panel Design Parameters ...................... Cooled Fuselage Panel. Station 1 10 . . . . . . . . . . . . . . . . . . . . . . . . . . . . . . . . Cooled Leading Edge Concept . . . . . . . . . . . . . . . . . . . . . . . . . . . . . . . . . . . . Temperature Histories of Between Passage Locations on Fuselage.
Nominal Trajectory . . . . . . . . . . . . . . . . . . . . . . . . . . . . . . . . . . . . . . . . . . Temperature Histories of Between Passage Locations on Wing Surfaces,
Nominal Trajectory . . . . . . . . . . . . . . . . . . . . . . . . . . . . . . . . . . . . . . . . . . Pressure Drops Through Fuselage and Wing Panel, Nominal Trajectory . . . . . Temperature Envelope for Fuselage Panel at Station 30. Maneuver
Conditions . . . . . . . . . . . . . . . . . . . . . . . . . . . . . . . . . . . . . . . . . . . . . . . . . Temperature Envelope for Fuselage Panel at Station 1 10. Maneuver
Conditions . . . . . . . . . . . . . . . . . . . . . . . . . . . . . . . . . . . . . . . . . . . . . . . . . Temperature Envelope for Upper Wing Panel. Maneuver Conditions . . . . . . . Transient Thermal Response of Panels to a Pushover Maneuver at a
FlightTimeof2127Seconds .................................. Distribution System Line Supports . . . . . . . . . . . . . . . . . . . . . . . . . . . . . . . . Installation Arrangement of Pumps and Heat Exchanger . . . . . . . . . . . . . . . . Typical Panel Connector ........................ 1 . . . . . . . . . . . . . . . Typical Cooled Panel Configuration ................................ Flow Schematic of Analytical Model Used for Cooling System
Transient Analysis .......................................... Cold Wall Heating Rate Histories for Typical Panels. Nominal
Trajectory . . . . . . . . . . . . . . . . . . . . . . . . . . . . . . . . . . . . . . . . . . . . . . . . Flow Rate Histories for Typical Panels. Nominal Trajectory . . . . . . . . . . . . . .
62 64
66
67
69
70 72 73 76 77 79 81
83 84 86 89 90
94
95 96
97
100 101
103 105 106 108 108
116
118 119
vii

ILLUSTRATIONS (CONT)
Figure Page
57 Temperature Histories for Typical Panels. Nominal Trajectory. 50F Inlet Temperature ........................................ 120
TABLES
Number
I
I1 111 IV
V
VI
VI I
VI11 IX X
XI
XI1 XI11 XIV xv
XVI XVII
XVIII XIX XX
XXI XXI I
XXIII XXIV
XXV XXV!
XXVII
Dead Weight Distribution . Estimated Hydrogen Fueled Air Breathing Cruise Aircraft . . . . . . . . . . . . . . . . . . . . . . . . . . . . . . . . . . . . . . . . . . . . . .
Convection Cooling Concepts . . . . . . . . . . . . . . . . . . . . . . . . . . . . . . . . . . . . Transpiration Cooling System Comparison for.Hypersonic Wing . . . . . . . . . . Water-Glycol Convective Cooling System Comparison for Aluminum
AlloyWingY200F . . . . . . . . . . . . . . . . . . . . . . . . . . . . . . . . . . . . . . . . . . . . Silicon Convective Cooling System Comparison for Titahium Alloy
Wing, 400F . . . . . . . . . . . . . . . . . . . . . . . . . . . . . . . . . . . . . . . . . . . . . . . . Heat Loads on Unshielded Fuselage for 200 and 400F Wall
Temperature. M = 6. Altitude = 100. 000 ft. CY = 8.3. . . . . . . . . . . . . . . . . Transpiration Cooling System Weight Summary for Fuselage. M = 6.
Altitude=100. 000ft . . . . . . . . . . . . . . . . . . . . . . . . . . . . . . . . . . . . . . . . Indirect Convection Cooling System Weight Summary Fuselage . . . . . . . . . . Summary of Cooled and Uncooled Fuselage Concepts . . . . . . . . . . . . . . . . . . Summary of Cooled and Uncooled Airframe Concepts (Mach 6.
Highest Heat Loads on a Mach 6 Cruise Vehicle. lOOOF Shields Maneuver Effects Included . . . . . . . . . . . . . . . . . . . . . . . . . . . . . . . . . . . .
Comparison of Distribution System Layouts for Mach 6 Cruise Vehicle . . . . Line Sizing Parameters . . . . . . . . . . . . . . . . . . . . . . . . . . . . . . . . . . . . . . . . . . Equivalent Lengths for Various Pipe Fittings . . . . . . . . . . . . . . . . . . . . . . . . Distribution Line Segment Weights and Pressure Drops for the Most
Remote Panel. Concept k . . . . . . . . . . . . . . . . . . . . . . . . . . . . . . . . . . . . . Incremental Weight and Pressure Drop Changes ...................... Distribution System Weights. Concept A . . . . . . . . . . . . . . . . . . . . . . . . . . . . Distribution System Weights. Concept B . . . . . . . . . . . . . . . . . . . . . . . . . . . . Heat Exchanger Fin Configurations Selected for Optimization Analysis . . . . Pump Sizing Parameters . . . . . . . . . . . . . . . . . . . . . . . . . . . . . . . . . . . . . . . . Panel Sizing Parameters . . . . . . . . . . . . . . . . . . . . . . . . . . . . . . . . . . . . . . . . Maximum Heat Flux to Representative Structural Panels . . . . . . . . . . . . . . . . Passage Size and Spacing for Representative Structural Cooling Panels . . . . . Maximum Panel Temperature and Pressure Drop Through Typical
Cooled Structural Panels at Peak Heat Loads ...................... Cooling System Weight Summary . . . . . . . . . . . . . . . . . . . . . . . . . . . . . . . . . . Residual Cooling Weights in Panels ................................ Number and Weight of System Connectors ..........................
100. OOOft) . . . . . . . . . . . . . . . . . . . . . . . . . . . . . . . . . . . . . . . . . . . . . . . .
Page
6 9
12
12
13
18
18 20 20
22
32 36 44 45
52 52 54 54 60 65 80 87 91
93 109 110 111
viii
.

DESIGN OF A CONVECTIVE COOLING SYSTEM for a
MACH 6 HYPERSONIC TRANSPORT AIRFRAME by
R.G. Helenbrook and F.M. Anthony
SUMMARY
Studies were conducted to establish the design of a canvec.tive coo1,jng system for an alum- inum alloy airframe,of a Mach 6 hypersonic transport. Prior studies indicated the potential advan- tiges of the cooling system approach over alternate cooling concepts and uncooled structure. They also provided the heating distribution over the vehicle surfaces during nominal and maneuver flight conditions.
The system designs examined circulate water-glycol coolant in a closed loop to absorb inci- dent aerodynamic heating and transfer it to a heat exchanger where it is rejected to the hydrogen fuel. Partial shielding of the aluminum alloy structure reduced heat loads to levels compatible with engine fuel flow requirements. The coolant was distributed to skin panels with integral coolant pas- sages through a network of supply and return lines. Various distribution h e routing arrangements and system pressure levels were compared to define the lowest weight concept, including pumping power penalties. Heat exchanger and pump characteristics and weights were determined and flow control modes were investigated. The sizes and spacing of coolant passages were established for rep- resentative skin panels and the thermal performance of the panels was assessed for nominal and man- euver flight conditions.
A total system weight of 13,915 pounds was determined, 0.404 psf, for a 150 psi system which was slightly off optimum because of present burst pressure limitations for skin panels with integral coolant passages. Prior studies had estab1ished.a target weight of 16,000 pounds. The use of relatively large skin panels, 10 feet wide by up to 45 feet long, restricted the number of connec- tions between the cooled skin panels and the distribution lines to 300. The maximum diameter of the distribution line elements was 7.87 inches in the pump region and decreased to about 1 .OO inch at locations farthest from the pumps. The weight of the distribution lines was 0.186 psf. Dual pumps were used to enhance reliability and weighed 170 pounds each.
INTRODUCTION
In the development of advanced flight systems such as hypersonic transports, the establish ment of a firm technological base is essential to minimize development difficulties and costs when a major aircraft program is undertaken. To establish this base, a quantitative definition of the de- sign interactions of major systems is necessary. The objectives of the work reported herein were to realistically define, evaluate and compare convective cooling systems for a Mach 6 transport and to identify problems which require further investigation.
Earlier studies examined a. variety of cooling system/coolant combinations for aluminum alloy and titanium alloy wing structures of the hypersonic transport of interest and the more prom- ising were applied to the fuselage and tail surfaces. System concepts examined for the wing included transpiration, direct convection, indirect convection and spray cooling; coolants included hydrogen, helium, air, water, water-glycol, silicone fluid, and lithium. Many other concepts and coolants were

considered qualitatively prior to the selection of systems for analytical studies. Based on the results of the wing studies the concept/coolant combinations examined for the fuselage and wing surfaces included transpiration with hydrogen, helium, and water coolants; and indirect convection with water-glycol for the aluminum alloy airframe and silicone for the titanium alloy airframe. The in- direct convective systems were more attractive because heat rejection to the hydrogen fuel elimin- ated the need for an expendable coolant. Total weights for the two convectively cooled airframe structures were comparable. Secondary considerations suggested advantages in using aluminum al- loy construction rather than titanium.
This report presents the results of cooling system design studies for a partially shielded alum- inum alloy airframe. Water-glycol coolant is circulated in a closed loop to absorb incident aero- dynamic heating and transfer it to a heat exchanger where it is rejected to the hydrogen fuel. Dis- '
tribution line routing arrangements and pressure levels were compared, the water-glycol-to-hydro- gen heat exchanger was sized, pump characteristics were defined, and coolant flow control modes were investigated. The sizes and spacings of coolant passages were established for representative skin panels and the thermal performance of the panels was assessed for nominal and maneuver flight conditions. Elements of the cooling system were integrated to provide a design which was lighter and less complex than originally anticipated. The transient performance of the system was checked to verify its suitability.
2

SUMMARY OF PRIOR TASKS
Since this is the last report in the preliminary investigation of the application of active cooling to the airframe structure of a hypersonic transport, it is appropriate to review prior results in order to establish the background for the design of the selected convective cooling system without the neces- sity of referring to other reports. Interested readers may consult References 1 and 2 for details of prior studies. A major factor which contributes to the practicality of actively cooling the airframe structure for a hypersonic transport is the advancement in technology with respect to hypersonic air- breathing propulsion as discussed in References 3 and 4.
The review is separated into five categories beginning with a description of the baseline vehicle and its nominal trajectory. Next, the cooling system and structural design studies of the wing are summarized. This is followed by a discussion of the fuselage studies. These results were then inte- grated to provide weight estimates for actively-cooled airframe concepts. The effects of maneuvers on the cooling system requirements are also discussed.
Baseline'Data
The baseline configuration used throughout the study was that developed in Reference 5 . Figure 1 shows the delta wing vehicle configuration and identifies the locations of the fuel tankage, passenger and cargo compartments, and primary flight control surfaces. The 65degree swept wing has a span of 108 feet and an area of approximately 7,000 square feet. The horizontal tail has a span of about 50 feet, a leading edge sweep of 55 degrees, a trailing edge sweep of 30 degrees and an area of approximately 1 100 square feet. The vertical tail has a leading edge sweep of 65 degrees, a trailing edge sweep of 45 degrees and an area of approximately 900 square feet. The fuselage is 3 14 feet long and has a wetted surface area of 18,400 square feet.
Initial comparisons of cooling system concepts and coolants were conducted for a single de- sign point during climb defined by an altitude of 100,000 feet, a velocity of Mach 6, and a fuselage angle of attack of 8.3 degrees, which because of a 2 degree incidence corresponded to a wing angle of attack of 10.3 degrees. Later studies of the influence of the timewise variation in heating during nominal flight and due to maneuvers made'use of the trajectory and attitude data shown in Figure 2. The fuel flow rate for the nominal trajectory is shown in Figure 3 as a function of time. For the design point the fuel flow was 147,000 lb/hr.
A detailed weight breakdown for the baseline vehicle was obtained from Reference 5 and is presented in Table I. The design maximum weight for the vehicle was assumed as 520,652 pounds which corresponds to a vehicle with a full load of fuel. The design cruise weight was 484,500 pounds, 80% fuel load, while the design landing weight was 356,000 pounds, 10% fuel load. The weight dis- tributions for each of these conditions was used in conjunction with the appropriate flight loads to determine the structural loads. The structural design criteria was established from data contained in References 5 through 10.
For the determination of flight loads, the variation of the slope of the total aircraft lift curve was estimated using data from Reference 5. Maneuver load factors were assumed to be 2.5g for speeds less than Mach 3 and 2.0g for speeds greater than Mach 3. Positive and negative gust velocities applicable to the hypersonic speed regime of the basic mission profile were calculated by multiplying a 25 fps gust velocity by an altitude correction factor as obtained from Reference 6. Using this pro- cedure the calculated hypersonic gust load factors were +1.14g and -0.8g. Positive and negative gusts
3

P
r I
Crew """. I"" -108 ft"----------l
""" Lower Surface
Figure 1 . Delta Wing Configuration (from Reference 5) ". "".. ""~
79 ft
". - " .a
I

7
6
20- 5
16- 4
J 5
12-
' f '5 3 z
8- . 2
4- 1
0. 0 0 20 -40 60 80
Time, Hundreds of Seconds -
F-e 2. Mission Profile for Baseline Vehicle with Modified Descent Profile
280
120 240
100 200
20 40
0 0 0 20 40 60 80
Time, Hundreds of Seconds
Figure 3. Fuel Flow Rate as a Function of Time for Modified Descent Psofiles

TABLE 1
DEAD WEIGHT DISTRIBUTION- ESTIMATED HYDROGEN FUELED AIRBREATHING CRUISE AIRCRAFT
c 40'-60' - .- S!
120"140' rION 60"180'
- OO"314'
Total :ION LO1 140"160'
- 80'-300'
- 60'-80'
- 80"200 !40"260' 100~-120 200"220' 120'-240' 160'-280'
Body
Basic Encloslng Structure
Pressurized Compartments
Main Propulsion
Engine and Accessories
Alr Inductlon
Kacelles , Pods, Pylons, Sup.
Fuel Containers and Supta
Propellant Insu!ation
Fuel System
Pressurization System
Lubrlcating System
Aerodynamic Controls ( Body )
Prime Power Sources
Ensine or Gas Gen.Units
mwer Source Tanka and Systems
Power Converalon and Distribution
Electrlcal
Hydraullc/Fneumatic
Guidance and Navigation
Instrumentation
Communicatloa
Environmental Controls
Equlpment
Personnel
Compt Insulation
landing Gear Aerodynnmlc Surfaces
Wing and Wing Mounted Control Surfaces
Vertical Surfaces
Horizontal Surfaces
Personnel Provisions
Accomodatlons for Personnel
Fixed Life Support
Furnishlnga and Cargo Hdlg
Emergency Equipment
3.259
316
880
405
400
176
529
Last Itl
2,000
25
4,715
516
1,276
70
880
200
800
1.625
430
527
4,000
of Tab11
185
154
800
25
5,867
5 16
2.511
726
76
789
2.142
1,042
BO
20
430
527
660
450
6,719
516
2,789
807
76
60
80
20
'%27
660
45 0
15
1,160
516
2,789
807
81
16
60
80
20
215
521
845
450
5,492
5 16
2.789
807
80
76
60
80
20
527
660
450
5,404
5 16
5,641
2.789
807
205
16
60
80
20
860
527
660
1,250
15
5.598
5 16
.2,535
9.055
1.114
2.789
807
605
1,276
60
580
181
529
11.944
185
154
908
185
5.987
284
23,278
2.069
2.789
807
230
IO0
160
30
580
908
25
4,301
2.843
817
30
30
5.538
2.789
807
81
30
31
3.244
30
30
1.817
30
-
417
-
12.346
4,728
35.813
14,702 3,183
27.666
7.999
1,362
3.108
160
1.429
2.142
1,042
3.491
1,101
800
405
2.025
116
2.150
5.214
15.944
4.700
308
8.1 16
305 -
5,609
516
2.789
807
80
76
60
80
20
215
521
845
450
15

c
TABLE I ( CONT ) -. (221.375 J
r STATION TZFm aol"
Crew Station
Comboh a d Panela Dry Structure-Not Incl: Aeru
Surhcs. and Aero Cod
psrlonael
Craw, Gear a d Acceaaoried
Crew. LIfa Support '
hyload
Cargo
Puaenger a d Support
Uaeful Load
Rarlrhl h o p e l . d Servfca Items
Tank Prearurlratlon Grs
Tn@ Fuel
Service Items Resid.
Reserve Propel. a d Sorv. ItCm
mwer Source Propel.
Lubrlcantn
Wet Structure
In-FUght Losaes
Fuel Vent mwer Source Propel.
Lubrlcantu
b i n Propellant , Fuel
Takeoff, Cllmb. Ace.
Crulse
Dement
Lolter
L.od Taknoff Walrht
Not Includlng:
1. Aem. S u r h c u
2. Aem. Surface Control# Not In Body
Deslp Crosa Welght
200
8.260
I 8 0
25
9.035
-
loo
11.022 ;
500
17.532
-
1.159
1.159
111.923)
5,950
10
60
11
110
14.588
32.712
12.119)
5,950
10
60
11
170
16.000
34.920
(1,560)
6,500
23
130
11
89
41
170
2.000
165
21.600
12,289
-
12.089 )
5.950
23
130
11
170
21,600
39.973
13.626)
5.950
23
130
11
110
18,000
31.910
(11,557)
5,950
23
130
11
110
21.600
39,441
18.916)
5.250
23
130
11
110
21.600
46.100
49.619)
6.500
23
130
11
89
42
170
1.561
165
2 1,600
19.910
1.250
21 1
13.000 1 35,000 , I 49.275
190
1,042
104
178
83
1,543
3.561
330
23
130
11
170
19.000
28,610
9
I2
5
13
7,000
15.060
182.58R
460,269
56.i2.i
3,618
5?0.65?
411 1.907 3.304
of 50 fps were considered applicable for the subsonic flight regime of the basic mission profile which resulted in subsonic gust load factors of +2.26g and -0.26g. Taxi and landing load conditions were also considered in establishing structural design loads. The static taxi condition of Reference 7 and the dynamic taxi condition of Reference 10 were used. Only the horizontal, tail down landing con- dition was examined. Detail structural loadings for the wing, fuselage, and tail surfaces are presented in References 1 and 2.
Wing Studies
During the cooling system studies as applied to the wing of the hypersonic transport, sweep angles from 0 degrees to 75 degrees, and leading edge diameters of 0.10 inch and 4.0 inches were considered. The wing area, wing span, and thickness-to-chord ratio were kept constant as the leading edge sweep was varied. This resulted in wing root thicknesses between 3.05 feet and 6.3 feet and had a major influence on wing structural weight with the more highly swept wings showing lower struc- tural weight. However, wing sweep had an insignificant influence on cooling system weight for the various wing configurations. Since the area of all wings was constant the weight of the coolant dis- tribution system was constant to a first order approxiination. While the heating intensity decreased as wing sweep was increased the length of the leading edge also increased such that the total heat load on the .wing was essentially constant and coolant flow requirements were also constant. Changes in the leading edge diameter had a minor influence on cooling system weight because of the very small area associated with the actual leading edge as compared to the total wing area. A reduction in lead- ing edge diameter increased local heating intensity but significantly decreased local heat loads. How- ever, leading edge effects were damped out within 3 diameters which was less than 2% of the mean aerodynamic chord even for the largest leading edge diameter considered.
On the basis of the heating rates for each of the above vehicle configurations, the weights for different cooling concepts were determined. The cooling concepts included direct and indirect convective cooling, transpiration cooling and film cooling. The direct and indirect convection cool- ing concepts considered initially are listed in Table 11. With the exception of the direct convection system which used hydrogen as the expendable coolant, all others require the use Of an auxiliary fluid whose only purpose is to absorb heat from the airframe and reject it from the aircraft as the coolant is exhausted. For the high heat load associated with the long flight time of a hypersonic transport this results in large expendable coolant weights. Because of its heat capacity of about 10,000 BTU/lb, only lithium is potentially competitive with hydrogen as an expendable heat sink. However, as noted in Table 11, the minimum structural operating temperature which is compatible with reasonable vapor volumes for a lithium system is 1500 F which negates the usefulness of such a system for any regions except stagnation areas. Therefore, only the direct hydrogen system was evaluated in more detail.
For the indirect convection systems a number of heat transport fluids and expendable heat sinks were examined along with a closed-loop, radiative system which did not require an expendable coolant. The superiority of liquid heat transport fluids as compared to gases is established in Refer- ence 1 . At first glance the closed-loop, radiative system is attractive but the radiator area required for heat dissipation is excessive unless a liquid-meta1,heat-transport fluid is used. Such liquid-metal, heat-transport systems pose significant development and operational problems, and since the hydro- gen fuel was expected to have adequate heat capacity for absorbing the airframe heat load no parti- cular advantage was seen for any form of the closed-cycle, radiative concept. The indirect convec- tion concept, in which a coolant absorbs the heat input to the airframe and rejects it to the hydrogen fuel, appeared to be most attractive. Because of the excellent heat transfer characteristics and
8

TABLE 11 CONVECTIVE COOLING CONCElTS .
Convdvr Heat Description
Prersurized coolant flows through (1) water
chamber and is expended (1) Lithium
Pressurized coolant flows, boils 11) water in passages in structure and is
Liquid p m then flash boils in a
(1) Lithium ~-~~
D irsa Systems
Two-phase Flow, Liquid to Vapor, or Single Phsps Flow of a Gas
Spray Boiling
Pressurized coolant flows through pastages in structure a d is expended. Boiling might be allowed Helium ,in Stnrctun by introducing liquid coolant
Pressurized coolant flows through nozzles causing liquid droplets to impinge on hot structure and vaporize t "
Liquid Transport Fluid
Liquid transport fluid is pumped
exchanger where it is cculed by Water through item to be cooled and heat
heat sink coolant Hydrogen
1 NaK
LiBH4-
-~~~ ~ I ~
Gaseous Gaseous transport fluid is pumpcd Hydrogen ,
Transport through item to be cooled and heat Helium, Water
Fluid exchanger where it is cooled by Nitrogen heat sink coolant or Air- Hydrogen
Other Direct Air Convection and Transpiration
heatsink
Employs a gas or liquid transport Gas: Hydrogen, loop with a radiator for a Helium, Nitrogen, Radiator 1 or Air 1 ,
Liquid: Water- glycol or Silicone
Ram air taken on board, cooled by hydrogen fuel or water and then used as a convective coolant and transpirant.
Hydrogen (1) and Air
NOTES: (1) No heat transport system as such. Heat sink coolant is passed directly through structure to be cooled. (2) Maximum temperature is material controlled and will probably be as high as poaible while still retaining the advantages of a cooling system. (3) Higher heat capacities can be obtained if residual lithium isvaporized. (4) Minimum temperature is establishd by radiator design.
Approximete Useful Temperature R a w 1
70°F to 250°F
I '7OoF to 400OF
70bF to 200°F 1 70'F to 500"F(3) 1
I
70" F to 2600' F(2)
200°F (waterglycol)
400°F (Silicone) 70°F to
9

sufficiently low pumping power requirements, water-glycol and silicone fluids were found to be the best choice of coolants for an aluminum and titanium structure respectively.
Mass addition to the boundary layer by either transpiration or film cooling were considered attractive because of the heat blockage associated with them. At the time of the wing studies, the theoretical basis for evaluating film cooling was inadequate. Since that time the theoretical basis has been advanced by another NASA-sponsored effort (Reference 1 1 ) and,as such,film cooling may be attractive for localized areas of the vehicle. Attractive transpirants included hydrogen, helium, air, and water. The transpiration concept, as well as the more promising direct and indirect convection concepts, were studied t o define system weights for more detailed comparisons. Schematics of each of the above concepts are shown in Figure 4.
The detailed system comparisons included the determination of external heat transfer coeffi- cients, heating rates, and pressure distributions over wing configurations having sweep angles from 0 degrees to 75 degrees, and leading edge diameters of 0.10 inch and 4.0 inches. The method of Reshotko and Cohen, Reference 12 as modified by Bell Aerospace Company, Reference 13, was used for the determination of the laminar heat transfer coefficient. Aft of the stagnation line the method of Lees, Reference 14, was used. For turbulent heat transfer conditions the method of Beckwith and Gallagher, Reference 15, was used in the region of the stagnation line, and, aft of the leading edge shoulder, the heat flux distribution was computed by a relationship outlined by Neal and Bertram, Reference 16, using the Von Karman form of the Reynolds analogy and the Spaulding and Chi skin friction function, Reference 17. For purposes of cooling-system-concept comparison fully developed turbulent flow was assumed at the onset of.transition. Transition was defined by a critical Reynolds Number of 500,000 as corrected for the premature onset of turbulence due to a swept leading edge as suggested by Czamecki, Reference 18. The Bushnell technique, Reference 19, was used to account for the destabilizing influence of a forebody on the leading edge crossflow thus causing an earlier on- set of transition. For.transpiration cooling, the coolant flow rate for a turbulent flat plate was pre- dicted using the method outlined by Spaulding, Auslander, and Sundaram, Reference 20, while for laminar flow the same general method was used,but the skin friction coefficient was modified for laminar flow.
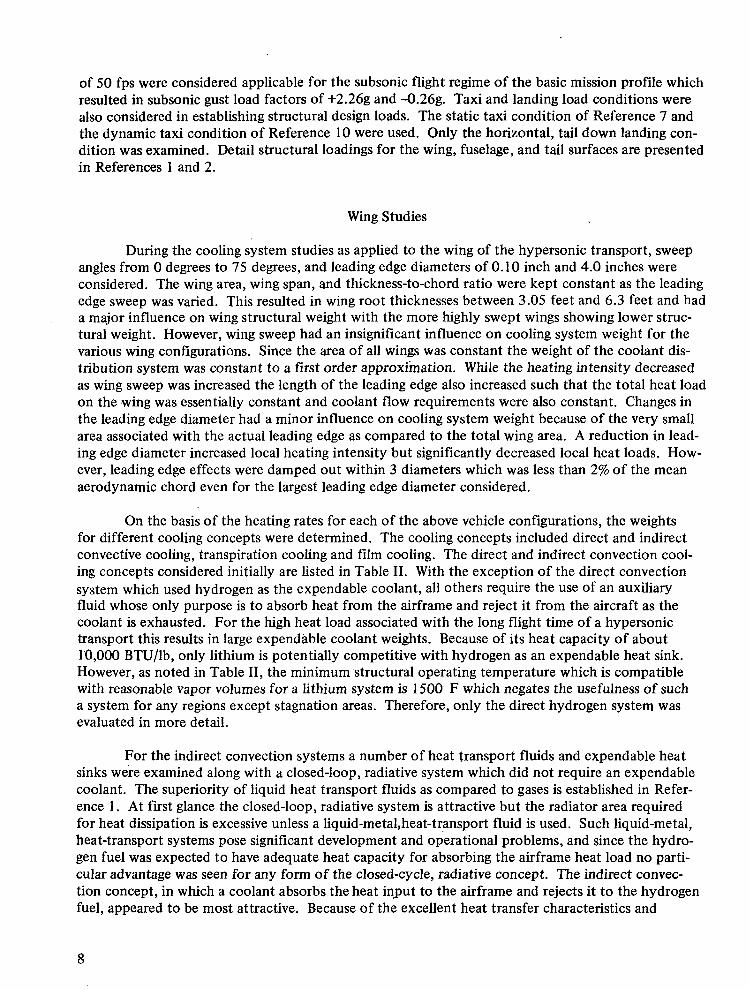
Details of the weight determinations for the wing structure, cooling system components, and coolant are presented in Reference 1. The transpiration cooling systems weights compared in Table I I i assume that the porous material stands off from the primary load carrying structure and operates at temperatures somewhat below radiationequilibrium values: 1400 F at the leading edge, 1 100 F on the bottom surface, and 600 F on the top surface of the wing. The weights of the porous material and the standoffs are included in the cooling system component weights. For the baseline 65 degrees swept wing, the weights of the wing structures transpiration cooled by hydrogen, helium, and water, were 49,300 lb, 54,800 lb, and 5 1,000 lb, respectively.
For the convective cooling system which rejects heat to the hydrogen fuel both aluminum alloy and titanium alloy constructions were compared for three system variations which included: 1 ) surface cooling of the entire wing structure; 2) ' partial protection of the lower wing surface with heat shields; and 3) partial protection of the lower surface with heat shields and radiation barriers. The weights for a convectively cooled aluminum structure are shown in Table IV and the weights for a convectively cooled titanium structure are shown in Table V. As external thermal protection is added to the lower surface of the wing, the total wing weight increases but the coolant flow rate and hydrogen requirements decrease. Figure 5 compares the hydrogen heat capacity needed for wing cooling with the total available in the fuel and the maximum quantity that can be used at the temperature limit of the particular airframe concept. Without some thermal protection on the lower
10

Stored Coolant System
Transpiration Cooling.by a Stored Coolant
Plenum Chamber
Flowmeter
Valve
Filter
t
Flow
Flow Meters 1 I Dual Pumps
Direct Convection Cooling with Fuel - u( I I '
r o Engines
Fuel
Tank
- t )
# , -Heat Exchanger
Flow
Exhaust
Engines
Evaporative Tank
Flow Control Valve 1 L Heat Sink Coolant Tank
Indirect Convection Cooling, Expendable Heat Sink
Figure 4. Schematics of Active Cooling Concept
11
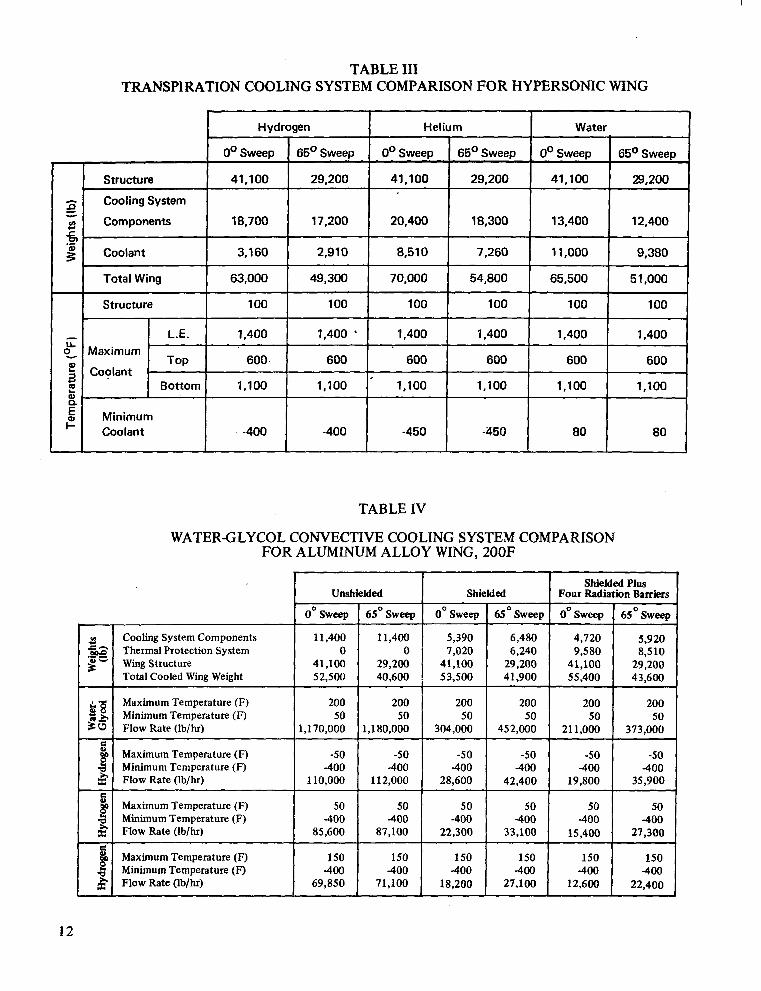
TABLE III TRANSPIRATION COOLING SYSTEM COMPARISON FOR HYPERSONIC WING
Total Wing
100 100 100 100 100 100 Structure
5 1,000 65,500 54,800 70,000 49,300 63,000
-
Coolant E 600 600 600 600 600 600 TOP Maximum 0,
1,400 1,400 1,400 1,400 1,400 ' 1,400 L.E.
- 3 m Bottom 1.100 ' 1,100 1,100 1,100 1,100 1,100 t
L L
Minimum ' 80 80 -450 -450 -400 -400 Coolant
TABLE IV
WATER-GLYCOL CONVECTIVE COOLING SYSTEM COMPARISON FOR ALUMINUM ALLOY WING, 200F
~ ~ ~~ ~~~
Shielded Plus Unshielded
65OSweep OOSweep 65OSweep O'Sweep 65OSweep OoSweep
Four Radiation Barriers Shielded
~1
29,200 41,100 29,200 41,100 29,200 41,100 Wing Structure 5 8,510 9,580 6,240 7,020 0 0 Thermal Protection System =& 5,920 4,720 6,480 5,390 11,400 11,400 Cooling System Components
Total Cooled Wing Weight 52,500 40,600 . 53,500 43,600 55,400 41,900
;a 50 50 50 50 50 50 Minimum Temperature (F) si3
200 200 200 200 200 200 Maximum Temperature (F)
3 C3 373,000 211,000 452,000 304,000 1,180,000 1,170,000 Flow Rate (lb/hr)
Maximum Temperature (F) -50
35,900 19,800 42.400 28,600 112,000 110,000 Flow Rate (lb/hr) &' -400 400 -400 -400 -400 -400 Minimum Temperature (F)
-50 -50 -50 -50 -50
& Maximum Temperature (F) 50 50 50
g, I
27,300 15,400 33,100 22,300 87,100 85,600 Flow Rate (lb/hr) z 400 -400 -400 -400 -400 400 Minimum Temperature (F) 3
50 50 50
Maximum Temperature (F) 150 150 150 150 150 150 a Minimum Temperature (F)
22,400 12.600 27,100 18,200 71,100 69,850 Flow Rate (lb/hr) I & 400 -400 -400 -400 400 -400
3
e
12

TABLE V
SILICONE CONVECTIVE COOLING SYSTEM COMPARISON FOR TITANIUM ALLOY WING, 400F
Unshielded
Cooling System Components .vs
10,800
56,000 Total Cooled Wing Weight 45,700 Wing Structure g
0 Thermal Protection System A - 10,800
0 31,500 42.300
8 8
1,440,000 Flow Rate (Ib/hr) 200 Minimum Temperature (F) a 400 Maximum Temperature (F)
Maximum Temperature (F) 100 1 Minimum Temperature (F) -400 & Flow Rate (Iblhr) 70,200
Maximum Temperature (F) 200 Minimum Temperature (F) - -400 Flow Rate (Ib/hr) 58,300
e
1,430,000
70,800
-400 58.800
G 8
50.400 50,000 Flow Rate (lb/hr) -400 -400 Minimum Temperature (F) e 300 300 Maximum Temperature (F)
~~
Aluminum Alloy/ Water - Glycol
100
80 % of Available Cooling 60 Capacity
40
20
0
~ ..
I Shielded
0" Sweep 65O Sweep
5,220 6,230 7,020 6,240
45.700 44,000 57,900 31,500
400 400 200 . 200
371,000 573,000
100 100 -400 -400
18,300 28,200
200 200 -400 -400
15,250 23,500
300 300 4 0 0 400
13,100 20.200
~~
Titanium Alloy/ Silicone -
5.3 -
Shielded Plus
6.180 9,580
5,690
45,700 61,500 31,500 45,700 8,510
400 400 200 200
252,000 473,000
100 100 -400 -400
12,400 23,300
200 200 -400 -400
10.300 19,430 I
Legend .
Available for 0 Engine Only
Available for Fuselage or Engine - Required for Wing
200 F 200 F 400 F 400 F
Heat Heat Shield Shield
Figure 5. Percentage of Hydrogen Heat Capacity Utilization,Convective Cooling System, Mach 6, 100,000 ft, 147,000 lb/hr, Maximum Hz
Temperature = 1400 F
13

surface of the aluminum alloy wing, the wing cooling requirements are about half the heat capacity that is available from the fuel and there may not be enough capacity available for cooling other areas of the airframe. Because of the higher allowable structural temperature and, therefore, higher temper- ature of hydrogen leaving the transport coolant-to-hydrogen heat exchanger, the use of titanium alloy structure minimizes the amount of hydrogen fuel heat capacity required for wing cooling.
Fuselage Studies
The structural materials and cooling system concepts examined for the fuselage were selected on the basis of the wing study results. Aluminum and titanium alloy constructions operating at average temperatures of 200 F and 400 F, respectively were investigated. Transpiration cooling with hydrogen, helium, and water were examined along with indirect convection systems which rejected the airframe heat loads to the hydrogen fuel. For the aluminum airframe water-glycol was used as the heat transport fluid, while for the titanium airframe a silicone fluid was used. Three variations of the indirect convection cooling systems were investigated: entire surface cooling, partial protec- tion with heat shields, and partial protection with heat shields and radiation bamers. All transpira- tion cooling concepts employed high-temperature, porous materials spaced away from the cooled, primary, load-carrying structure.
Heat transfer data was generated for the fuselage model showrl in Figure 6 which also presents the coordinate system used and the zones employed for integrating heat loads. Heat transfer coeffi- cients were computed at 650 discrete locations on the vehicle judiciously selected to yield average values for the regions of interest. Between 20 and 60 data points were used to define the heat load on each zone. Since the fuselage is symmetrical about the vertical plane, results were computed for only one half of the vehicle. For the initial fuselage study all heat transfer coefficients were generated assuming that conical flow relations apply for all areas of the fuselage except that fully expanded flow on the leeward side according to the Prantl-Meyer relationship was used. To check the optimism of this assumption heat transfer coefficients based on nonexpanded flow were also computed. A difference of 17% in hydrogen requirements resulted. For the systems study presented in this sub- section, the fully expanded flow assumption was used for determination of the heat loads. However, the later studies to evaluate the. effects of a nominal trajectory and maneuvers employed the conser- vative nonexpanded flow results. The design of the selected, indirect, convective cooling system was based on these latter results.
Because of the small nose diameters considered, 1.0 inch to 4.0 inches, the fuselage was con- sidered to be sharp and blunt nose overpressures were not considered. At the stagnation point, the heat transfer coefficient was computed using a modification of the methods suggested by Reshotko and Cohen, Reference 12. The flow was assumed to be laminar on the hemisphere at all times since there are no upstream effects which would cause early transition. Downstream from the stagnation point both on the sphere and conical nose section, the laminar heat transfer coefficients were com- puted by the method of Lees, Reference 14. Computation of the turbulent heat transfer coefficients was performed using the method outlined by Neal and Bertram, Reference 16, employing the Von Karman form of the Reynolds analogy in conjunction with the Spaulding and Chi skin friction co- efficient, Reference 17. For the conical surfaces, a Mangler transformation was applied to the above results in order to account for the thinning of the boundary layer.
14

I-
Y
"X
Section A-A
Sa. 45 Sta. 111 Sa. 21 1 Sta. 257 7
11
b
10 -- "
9
h 2
Zone 8 is the Flat Bottom Section Between Stations 11 1 and 21 1
314
-
Figure 6 . Thermal Model of Fuselage

The onset of transition from laminar to turbulent flow was predicted by the comparison of the streamwise Reynolds number to a critical Reynolds number of 1 x I O 5 . The streamwise Rey- nolds number was computed using the method suggested by Ambrok, Reference 2 1 . For the com- putation of temperatures and heat loads, turbulent flow was assumed to be fully developed at the onset of transition. Figure 7 presents streamwise variations of heat transfer coefficient and radiation equilibrium temperatures for an uncooled fuselage operating at the design point of Mach 6, 100,r)OO feet and 8.3 degree angle of attack. Table VI presents the heat load for the total fuselage at this de- sign point for both a 200 F and 400 F surface temperature corresponding to those which would be experienced by cooling systems designed for aluminum alloy and titanium alloy structures respec- tively.
The method of Spaulding, Auslander, and Sundaram, Reference 20, was used for predicting transpiration flow rates since the empirical functions are based on experimental data at Mach num- bers within the range of this study. As in the computation of the heat transfer coefficient, conical flow relationships were used in the computation of the transpiration flow rate. The formulation was based on the assumption that the coolant acts as an ideal gas with a constant specific heat and that the backface of the porous material is equal to the coolant inlet temperature. Downstream effects were conservatively neglected. Transpiration coolants examined included hydrogen, helium, and water with inlet temperatures of -400F, 450F , and 80F respectively. Flow-rate requirements for each coolant were determined at 650 discrete locations on 1/2 of the fuselage area and were integrated to obtain coolant requirements in much the same manner as that employed for the determination of heat loads. Table VI1 summarizes system weights for the transpiration cooling concept studied.
The heat loads of Table VI were used to compute the convective cooling system weights and hydrogen coolant flow rate requirements for both the aluminum and titanium airframes. Surface cooling of the entire fuselage airframe was examined, as well as the two partially shielded configura- tions shown in Figure 8. For each of the shielded arrangements, comparisons were made between systems which employed only an airgap between the heat shield and the actively cooled structure, and systems which employed one and four radiation barriers between the heat shields and the cooled structure. For the aluminum airframe, the minimum and maximum temperatures of the heat trans- port fluid were 50 F and 200 F respectively while the hydrogen temperature to the inlet of the heat exchanger was -400 F. In order to determine the influence of heat exchanger efficiency on the hydro- gen flow rate requirements, the hydrogen outlet temperature from the heat exchanger was varied from -50 F to +150 F. The minimum and maximum temperatures for the silicone heat transport fluid were 200 F and 400 F respectively, while the hydrogen temperature to the inlet of the heat ex- changer was 400 F and its outlet temperature was varied from 100 F to 300 F. Weight and coolant flow rate results are summarized in Table VIII.
Integration of the cooling system study results with structural analyses of the fuselage and thermal analyses of the cryogenic tankage is summarized in Table IX. Conventional skin stringer frame construction was used for the fuselage regardless of the construction material. Structural re- quirements were matched to axial loading intensities computed from the envelope of maximum bend- ing moments for the various flight conditions discussed under Baseline Data. Aluminum alloy and nickel superalloy constructions were compared for the cryogenic tank and the latter was selected since it was 2000 pounds lighter and because of its higher structural efficiency. Three cyrogenic tank insulation systems were compared for the four fuel tanks which contained 183,000 pounds of hydro- gen fuel, helium-fibrous insulation, sealed-plastic-foam insulation, and fibrous insulation with a C02 frost deposit. Although the sealed-foam system yielded minimum insulation weight there was some
16

a. Temperature, OF
2, Feet
10
-10
-20 O l
2, f e e t 1-
/
t I I I I I I I I I I 1 I J
0 . 25 50 75 100 125 150 175 200 225 250 275 300 325 Station, Feet
t I I I I I I I I I I 1 I J
0 . 25 50 75 100 125 150 175 200 225 250 275 300 325 Station, Feet
b. Heat Transfer Coefficient, BTU/hr-ft2 PF
I- h=2 r h=i /
IU /-
&
o~~~~
0 /
-10
-20 h=15 h=8 h= 1
L I I I I I I I I I I I I I
0 25 50 75 100 125 150 175 200 225 250 275 300 325
Station, Feet . .
Figure 7. Streamwise Variation of Heating and Temperature for an Uncooled Fuselage, M = 6 , Altitude = 100,OO feet, 01 = 8.3'

TABLE VI HEAT LOADS ON UNSHIELDED FUSELAGE FOR 200 AND 400°F
WALL TEMPERATURE, M = 6, ALTITUDE = 100,000 FEET, a = 8.3"
Coolant
Location
1 2 3 4 5 6 7 8 9
10
Area (ft2 1 398 402 364 884 939
1377 1045 1998 2160 2493
11 1648 12
783 13 772
752 17 328 16 703 15 988 14
1 7 18,034
r Heat Load, lo6 BTU/hr
Tw = 200°F
1 1.92 5.71 1.37
21.27 12.00 9.13 2.44
25.12 12.80 13.74 3.52 3.94 4.01 5.20 1.42 0.75 1.99
136.37
TABLE VI1
Tw = 400°F
10.60 4.93 1.16
19.02 10.70 6.62 1.66
20.60 10.5 1 9.92 2.54 3.24 3.28 3.73 1.02 0.45 1.20
11 1.17
TRANSPIRATION COOLING SYSTEM WEIGHT SUMMARY FOR FUSELAGE, M = 6 , ALTITUDE = 100,000 FEET
I Weieht
Porous Material
Distribution
m a l
Location ~.
Nose Lower Fuselage Upper Fuselage
Nose Lower Fuselage Upper Fuselage
Complete
Complete
Hydrogen External
Temp. F Ib surfaF Ib/ft2' Unit Total,
1,400 170 0.5 1 1,000
0.60 9,3 50 600 0.83 2,060
1,400 1,000
600
250
0.7 1 11,100 0.77 1,900 0.77
T I
Helium I Water
Total, Ib
390 5,240
23,400
250 1,900
11,100
26,930
-69,210
I 1 L I
i 11,100
1 . 4 6 F
3.76
i 1 7 I
Iblft' Unit
1.27 2.1 5 1.57
0.77 0.77 0.71
0.5oi
2.86 ~
18
a. 1 OOOOF System
Radiation Shields Cooled External Surface
b. 80O0F System
f- Radiation Shields Cooled External Surface
Figure 8. Radiation Heat Shield Arrangements, Fuselage

TABLE VI11
INDIRE(JT CONVECTION COOLING SYSTEM WEIGHT SUMMARY, FUSELAGE
HZ r , 800'F Radiation IOOO'F Radiation No Outlet No. of Shield System Shield System Shields Temp. Radiation
Shields 4 1 Au Gap 4 1 Air Gap OF
E
19,160 21,180 25,480 50,750 51,750 53,850 85,750 15,670 17,310 20,840 41,550 42,340 44,030 70,800 150
50 lblhr Flow-rate 8 E 5 Hydrogen - 0)
System 233 Weight Ib. e 16,570 15,950 15,970 13,170 12,920 13,050 13,080 Cooling
-50 24,630 27,250 32,780 65,350 66,550 69,250 111,400
tzg ,
zrnd Flow-rate 20% 258,500 285,500 343,800 685,500 698,000 726,000 1,168,000 - Coolant
lblhr
Coolant System
9,360 10,490 13,040 Ib/hr @ . f i r -
10,930 12,240 15,220 25,720 26,280 27,580 45,790 300
13,120 14,720 29,980 30,650 32,190 53,410
18,280 36,000 36,780 38,680 64,080 200 Flow-rate m E 100 Hydrogen k
16,110 15,380 15,480 12,280 12,050 1'2,150 11,860 3 Weight Ib SSE -
O k 0
540* *% 2 266,800 299,000 372,000 732,000 748,500 786,200 1,304,000 - Coolant
g;;-xate
TABLE IX
SUMMARY OF COOLED AND UNCOOLED FUSELAGE CONCEPTS
Concept
Silicone Fluid Convectively Cooled Titanium Alloy Water-Glycol Cooled Aluminum Alloy with Shields to lOOOF Water-Glycol Convectively Cooled Aluminum Alloy Silicone Fluid Cooled Titanium Alloy with Welds to lOOOF Water-Glycol Cooled Aluminum Alloy with Shields to 800F Silicone Fluid Cooled Titanium Alloy with Shields to 800F Uncooled Hydrogen Transpiration Cooled Aluminum Alloy Water Transpiration Cooled Aluminum Alloy
I
Total Fuselage Weight, Pound
98,760 99,000 99,025 100,100 101,920 102,530 103,570 130,800 138,740
Required Hydrogen
Flow Rate, Ib/hr.
45,790 44,030 70,800 27,580 20,840 13,040
0 0 0
20

question about its development status, so the weight of the CO, frost system was included in the weight summary of Table IX. However, the use of the sealed-foam insulation could reduce aircraft weight by approximately 12,000 pounds.
In reviewing the fuselage weights and hydrogen-coolant, flow-rate requirements as presented in Table IX, it is apparent that the transpiration-cooled concepts are significantly heavier than the other approaches. The fact that none of the fuel heat capacity is required for such systems is of no significance because adequate fuel heat capacity will be available for airframe cooling when advanced air-breathing engine designs are used for propulsion. With respect to the convectively cooled concepts and their variations, relatively small weight penalties are incurred by the use of external heat shields in the more highly heated regions of the fuselage to achieve significant reductions in hydrogen- coolant-flow-rate requirements. Radiation barriers between the heat shield and the cooled airframe "-.
were of little value. _I \
Total Airframe Studies
In order to assess the potential of the actively cooled airframe structural approach for the hypersonic transport application, the results of the wing and fuselage studies were extended .to in- clude the tail surfaces, and the data obtained for these major airframe components were integrated. Because.of the range of aircraft attitudes and control surface positions likeiy to be encountered during operation, all surfaces of the tail structures were protected by.externa1 heat shields except the very leading edge region, where structural depth is insufficient for the incorporation of such shields. In comparing the various cooled concepts for the tail surfaces with an uncooled concept, it was found that the latter was significantly lighter. However, the actively cooled and shielded structure was used for determining the weights of the actively cooled airframe systems.
Table X summarizes the weights of the total hypersonic aircraft for various cooled and un- cooled airframe structural concepts. The weight of the transpiration-cooled concepts are significantly higher than for other concepts. The trend observed during the fuselage studies, i.e., a relatively small increase in weight due to partial heat shielding but substantial reductions in hydrogen-coolant, flow- rate requirements, is also observed for the total aircraft. Hydrogen flow-rate requirements for cool- ing the titanium aircraft are significantly lower than those for cooling an aluminum airframe. In all cases, the cooled aircraft are lighter than the uncooled aircraft with comparable amounts of heat shielding. I t should be noted that the estimates for the uncooled structure generated during the Bell studies are significantly lighter than the 190,000 pounds projected for an uncooled structural approach in Reference 5. The wing weights listed in Table X are somewhat lower than those of Tables 111, IV and V because Table X corrected the analysis results for individual components to account for the region of overlap between the wing and the fuselage as shown in Reference 2.
At the design point of Mach 6 , 100,000 feet, and 8.3 degree angle of attack, which occurs during the constant Mach number climb to cruise altitude, the hydrogen fuel flow rate is 147,000 Ib/ hr which is sufficient to cool all of the convective systems. However, the fuel flow rate is significantly reduced during the cruise portion of flight. Therefore, heat loads during cruise were determined so that hydrogen coolant requirements could be compared with fuel flow. It was found that the maxi- mum difference between fuel flow and cooling requirements occured at the end of cruise. Figure 9 compares the various convectively cooled concepts with and without shielding for conditions at the end of cruise. The left hand side of the figure compares coolant requirements with fuel flow rates while the right hand portion of the figure indicates the percentage of total fuel heat capacity which is required by the various convective cooling concepts and indicates the percentage of fuel heat
21
I.

TABLE X SUMMARY OF COOLED AND UNCOOLED AIRFRAME CONCEPTS (MACH 6,100,000 FEET)
Weight, Concept lb
Aluminum Alloy Cooled to 200°F (1)
1. Hydrogen Transpiration (7) 130,800
2. Water Transpiration (7) 138,740
3. Convection, Water Glycol (2)
a. No Heat Shields 99,025 b. Heat Shields A (4) 99,000 c . Heat Shields B (5) 101,920
Titanium Alloy Cooled to 400'F
1. Convective, Silicone Fluid (3)
a. No Heat Shields 98,760 b. Heat Shields A (4) 100,100 c. Heat Shields B (5) 102,530
Uncooled
a. No Heat Shields b. Heat Shields A c. Heat Shields B
103,570 (4) 106,650 (5) 113,850
Hydrogen
rate lb/hr
Flow -
0
0
70,800 44,030 20,840
45,790 27,580 13,040
0 0 0
Tail Surfaces I Win1
Weight, lb
19,800
33,500
12,810 14,400 14,400
12,330 14,300 14,300
9,110 9,110 9,110
Hydrogen Flow- rate
lb lb/hr Weight,
0
46,630 0
44,560
27,120
37,850 8,650 39,740 8,650 37,800
18,300 6,250 6,250
0 0 0
39,500 42,060 40,000
41,300 49,000 49,000
~ 6)
iydrogen
rate lb/hr
Flow-
110
110
47,000 19,400 28,880
35,000 9,030
16,080
110 110 110
Total
Weight, lb
195,160 (1)
218,870 (1)
149,635 (1) 153,140 (1) 154,170 (1)
150,590 155,460 156.830
153,980 164,760 171,960
Hydrogen
rate lb/hr
Flow -
110
110
144,920 72,080 58,370
98,900 42,860 35,370
110 110 119
Use of sealed foam insulation would reduce weights of aluminum alloy structure about 12,000 lb.
Hydrogen outlet temperature is 150°F.
Hydrogen outlet temperature is 300°F.
Heat shields where temperatures exceed 1000°F on fuselage, lower wing surface and both sides of tail.
Heat shields where temperatures exceed 800°F on fuselage, lower wing surface and both sides of tail.
Cooling system weight, heat shield weight, and flowrates have been reduced to account for the overlap of the wing and fuselage, See Reference 2.
High temperature transpiration system, See References 1 and 2 .

170
N
Excess Fuel Flow
I
I
I L L
I t t t
a
I! 0) c v)
z + Required for
I” Aitframe m v)
IL Cooling 0 0 03 z
C .- .-
m
w m al
0 )I
7
Water-Glycol 200 F
Silicone 400 F
Water-Glycol 200 F
1 r Available
{for Engine Cooling - 9 .- m
v) c +a m 0)
m
5 Maximum I I Available for ; v) Airframe c:
- q + \ \
(1) Hydrogen Fuel Flow Rate at End of Cruise is 71,900 Ib/hr.
(2) Maximum Hydrogen Temperature Allowable for Cooling is 1400°F
(3) Specific Heat of Hydrogen was Assumed to be a Constant Value of 3.5 BTU/lb-’F.
(4) Hydrogen Outlet Temperature from the Indirect Heat Exchanger is 15OoF for a Water-Glycol System and 300°F for a Silicone System.
Figure 9. Percentage of h e 1 Flow and Fuel Heat Capacity Required for Airframe Cooling, End of Cruise Condition, M = 6.0, Altitude = 106,360 ft, a = 5.14
Silicone 400 F

capacity which is available for engine cooling. Both methods of comparison indicate that the fuel flow is inadequate for the unshielded aluminum alloy airframe, but that there is adequate fuel flow for any of the other five concepts including the unshielded titanium alloy airframe. In making a selection among the various approaches, a number of factors must be considered besides the need for external heat shielding including: (1) vehicle weight, (2) airframe weight, (3) cooling system weight, (4) integration of coolant passages, ( 5 ) cost, and ( 6 ) operational considerations.
Airframe structural and cooling system studies indicated comparable total weights for alumi- num alloy and titanium alloy construction if the same insulation system is used for the cryogenic fuel tanks. However, the 200 F operating temperature level associated with an aluminum alloy airframe permits the consideration of a sealed-plastic-foam insulation system which would result in a potential weight savings of about 12,000 pounds, 50-60 passengers. The key element of this insulation system is the plastic material used. The likelihood of attaining suitable material for use to 200 F is much greater than that of obtaining similar material for operation at 400 F or higher. Hence, if a titanium airframe is used, it is unlikely that the 12,000 pound weight saving on cryogenic insulation can be realized.
With respect to the airframe it should be noted that for preliminary design purposes weights were based on average temperature values. In practice, temperature gradients will exist along the coolant passages and between coolant passages. While the thermal stresses resulting from these gradients will be small, generally less than 15% of the ultimate strength of the construction material, they will probably have a slight effect on structural sizes. In addition, the slightly different tempera- ture levels at various locations may influence design-allowable strengths of the construction materials which will also etfctt. the structural sizes. Since titanium has a lower thermal conductivity than aluminum, higher temperature gradients between coolant passages will be established which will gen- erate higher thermal stresses in the titanium alloy construction. Hence, the thermal stress penalty would be somewhat higher.
The structural studies of the wing indicated comparable weights for a 200 F aluminum alloy structure and a 300 F titanium alloy design. However, if the titanium alloy design was operated to 600 F, a 15% weight penalty would be incurred. Thus a 400 F titanium alloy design would be about 5% heavier than an aluminum alloy design and this would correspond to a weight increase of about 4,000 to 5,000 pounds as compared to the titanium structural design data used for Table X which assumed the fuselage structures would be of equal weight. The higher operating temperature of the titanium structure would also increase the weight of environmental control and equipment installa- tions, as well as requiring additional insulation and cooling capacity for the crew and passenger com- partments. The increased weight associated with these and other aircraft subsystems was estimated to be about 1,000 pounds.
For preliminary estimates of cooling system weight, the distribution system and pumping re- quirements were assumed to be the same for both the water-glycol and silicone systems, and the heat exchanger weight was assumed to be a function of cooling system heat load only. In actuality these assumptions are not strictly correct. The distribution system weight is a function of the num- ber and size of the coolant passages in the skin and the size of the lines required to supply the skin panels. Pumping requirements are a function of transport fluid flow rate and line sizes, and the heat exchanger weight is a function of the log mean temperature difference in the heat exchanger and the construction material as well as the heat load. The lower thermal conductivity of titanium alloys, as compared to aluminum, requires approximately twice as many coolant passages even when higher temperature gradients are allowed between the passages for the titanium structures. Furthermore,
24
the silicone flow rate is about 15% higher than for water-glycol so that the supply lines would probably be somewhat larger. While quantitative definition of the net effect on cooling system weight was difficult without detailed analyses, prior experience indicated a net weight increase of about 2800 pounds for a cooling system installed in a 400 F titanium airframe structure. Weight in- creases of about 1500 pounds, 700 pounds, and 800 pounds were respectively attributed to larger supply line diameters, use of titanium alloy rather than aluminum alloy lines, and an increase in the fuel required to drive the coolant pumps. A weight reduction of about 200 pounds was expected for the heat exchanger in the titanium airplane system because of the higher log mean temperature dif- ference associated with the operating temperatures of the silicone heat-transport loop.
Techniques for integrating coolant passages with aluminum alloy structural skins have.been demonstrated experimentally, Reference 22, but relatively little work has been done with respect to a titanium alloy structure. In addition, the spacing of coolant passages is a function of the thickness and the thermal conductivity of the construction material. The higher strength and higher density of titanium alloys will dictate the use of thinner gage material and this, in conjunction with its lower thermal conductivity, will necessitate passage spacings which are about one half those for aluminum alloy construction. This closer passage spacing not only adds to the weight of residual coolant but complicates the design of the stringer and frame stiffening for the structural skins. In the more highly heated regions of an unshielded titanium alloy aircraft, passage spacings would be less than 0.50 inch even with temperature gradients as high as 300 F between coolant passages. Such close-passage spac- ing severely complicates coolant-passage integration with the structural skin, as well as assembly of the cooled structural skin with frames, ribs, and stringers. Resolution of these problems is certain to result in increased cost, weight,or both. It is quite likely that some heat shielding would be required even with a titanium airframe in order to attenuate the higher levels of heat flux reaching the cooled structure so that practical passage spacings can be achieved. Hence, the advantage of the titanium alloy structure in eliminating the need for heat shields appears to be more correct theoretically than practically.
While titanium alloys have been used in airframe construction for about twenty years the cost of titanium alloy assemblies is still approximately twice that of comparable aluminum alloy components. It is unlikely that production costs will ever be reduced to those of aluminum alloys. This, coupled with the higher costs of the titanium alloys and the greater development effort and probable cost associated with the integration of coolant passages, suggests that the production costs of a cooled, titanium alloy airframe for the hypersonic transport will be at least twice those of an aluminum alloy airframe. The relative cost differential of the two types of construction will be reduced by the rela- tive amount of heat shielding required for each.
While not directly applicable to weight, the operational aspects of corrosion resistance and emergency conditions favor the use of titanium alloys. As compared to aluminum, they are more re- sistant to corrosion - a fact that may significantly reduce maintenance. However, the importance of this is questionable in view of the extensive use of aluminum alloys in airframe construction. In emergency situations, such as cooling system malfunctions, the titanium alloy structure is definitely superior t o aluminum. At the design point of Mach 6 and 100,000 feet about one third of the air- frame would experience temperatures of 1,000 F or higher if cooling were not provided. However, heat shielding would be used in such regions so the problem is not so severe as might be first thought. The attenuating effect of the heat shields should provide between two and five minutes for corrective action before a serious decrease in the structural load-carrying capability of an aluminum alloy struc- ture would occur. Because of the higher percentage of strength retention exhibited by titanium alloys, the vehicle area which would be seriously affected from a structural point of view by a cooling system malfunction is greatly decreased and the time allowed for corrective action would be greatly extended. In fact, at 1,000 F the titanium alloy structure would retain about 60% of the strength and stiffness that it possesses at 400 F.
25

The results of comparative analyses indicated that the total weights of aluminum alloy and titanium airframes, which are cooled By appropriate convective systems, are essentially equal. The titanium structure offers better corrosion resistance, a higher degree of safety in the event of cooling system malfunction, and reduced hydrogen flowrate requirements which should minimize the amount of heat shielding needed. However, the secondary considerations discussed in preceeding paragraphs suggest that a hypersonic transport with a cooled aluminum alloy airframe should be lighter and probably cheaper than one with a cooled titanium alloy structure. Therefore, the cooled aluminum alloy airframe was selected as the basis for the cooling system design.
Maneuver Effects
Maneuvers have two important effects on the design of a cooled, hypersonic, airframe struc- ture: the accelerations induce structural loadings which must be resisted, and the attitude changes induce transient heating conditions which must be absorbed by the active cooling system without ex- ceeding temperature limits. The structural implications of maneuver conditions on the weight of the hypersonic transport airframe are discussed in References 1 and 2 and the weights were included in prior subsections. In establishing representative maneuver conditions which might be critical for coolant system design, References 6, 7, and 23 were reviewed. These references are concerned prim- arily with insuring the structural integrity of aircraft by defining required maneuver conditions of four basic types:
1. Symmetrical pull-up 2. Symmetrical pushover 3. Roll 4. Yaw
The symmetrical pull-up and pushover maneuvers are associated with desired changes in vehicle alti- tude. High load factors would be experienced only under emergency conditions such as collison avoidance, and their duration would be on the order of 3 to 5 seconds. Roll and yaw maneuvers may be of either short duration, as in the case of collision avoidance, or of long duration, as in the case of a change in destination. While maneuver conditions are expected to have a minimal effect on overall cooling system design, they have a significant influence on detailed design of the coolant circuits in the structural skins which are defined by the maximum incident heat flux and heat load to each particular structural panel. If higher than expected heat fluxes are experienced the temperature gradient between coolant passages will increase, along with coolant and structural temperatures. This
Thus, it is important that the maximum heating condition be identified for each area of the transport surface. For purposes of establishing these maximum, local heating conditions, banked-turn, pull-up, and pushover conditions were examined.
. could result in a degradation of material properties coincident with high load factors and stresses.
Although the maneuvers may be executed at any time during the flight trajectory it was be- yond the scope of the project to examine such a wide range of conditions. Therefore, heat loads were computed at 12 times during the nominal flight profile, four during ascent, four during cruise and four during descent. These heat loads were compared with engine fuel flow requirements, and six specific times were chosen for the investigation of maneuvers. Bank angles of 20 degrees, 40 degrees, and 60 degrees were examined, the latter being equivalent to a 2.0g load factor. During cruise the steady state bank angle was limited to 42" because of engine thrust limitations. Pull-ups of up to 2.0g and pushovers from 1 .Og to -1 .Og were included. Radiation equilibrium temperatures were computed, as well as heat fluxes and heat loads, so that the extent of heat shielding required for the cooled aluminum airframe structure could be checked.
26

The effects of maneuvers were determined for three variations of the cooled aluminum and titanium airframe: unshielded, the 1000 F shield system, and the 800 F shield system (shown in Figure 8). Figures I O , 1 1 , and 12 present the heat loads on the cooling system as a function of time for each of the three structural arrangements. In reviewing the figures it is noted that maneuvers have a relatively small influence on the peak heat load which occurs during ascent and is used to determine the size of the cooling system distribution lines and components during the system design studies. The execution of maneuvers introduces a relatively higher percentage increase in the total heat load during cruise than during ascent. The lower boundary, corresponds to a flight condition where the load factor is about Og. Despite the fact that the total heat load decreases, this is a potentially critical flight condition because fuel flow-rates are at a minimum. However, because of the transient nature of such pushover maneuvers no particular problems were anticipated. In a later section of this report structural temperatures during various transient maneuvers are presented.
The influence of maneuvers on the heat loads for the 400 F titanium alloy structural approach were also assessed for unshielded, 1000 F shielded, and 800 F shielded airframe design approaches. As would be expected the influence of maneuvers on cooling system characteristics is less significant for the titanium alloy construction material. For the unshielded titanium alloy, airframe cooling requirements exceeded fuel flow levels during ascent between 1600 and 21 00 seconds and during descent near 5500 seconds. For the partially shielded airframe concept there was more than enough fuel flow for both shielding systems. In contrast, the unshielded aluminum alloy airframe had cool- ing requirements which exceeded fuel flow requirements from 1400 seconds to 6000 seconds. When aluminum alloy construction was used, the 1000 F shielded design reduced heat loads sufficiently such that the normal fuel flow rates were adequate except during a portion of the descent from 5400 seconds to 6200 seconds, while for the 800 F shielded design, cooling requirements exceeded the fuel flow rate only from about 5750 seconds to 6 100 seconds. During the detailed cooling sys- tem design study effort, NASA personnel investigated alternate descent trajectories and selected one which provided adequate fuel flow for airframe cooling during the entire descent when the 1000 F shielded system was used.
With respect to the banked-turn and pull-up maneuvers, the increase in drag associated with the increased angles of attack required higher fuel flow rates if velocity was maintained or resulted in deceleration and associated reduced heating when power level was kept constant, so that the engine fuel flow rate matched the cooling requirement quite well except for the unshielded aluminum alloy airframe. No attempt was made to modify the final stages of ascent and the transition to cruise. Trajectory tailoring in this region would be quite desirable if a cooled airframe is used for the hyper- sonic transport. If the heat load during this phase of flight could be reduced to the levels associated with cruise, substantial weight reductions would result in all cooling system components including the distribution lines, the pumps, and the heat exchanger. Furthermore, some reduction in the fuel required to drive the pumps could also be achieved.
27

500
400
200
100
0 0 10 20 30
Nominal Trajectory
-- - Banked Turn
- - - - Pushover
1
x1 ." - - .
40 50 60 70
Flight Time, Hundreds of Seconds
Figure 10. Heat Loads on a Cooled Mach 6 Cruise T, = 200 F, Unshielded
28

400
300
200
1 0 0
10 20 30 40 50 60 70
Flight Time, Hundreds of Seconds
Figure 1 1 . Heat Loads on a Cooled Mach 6 Cruise Vehicle, T, = 200 F, 1000 F Shield System
29
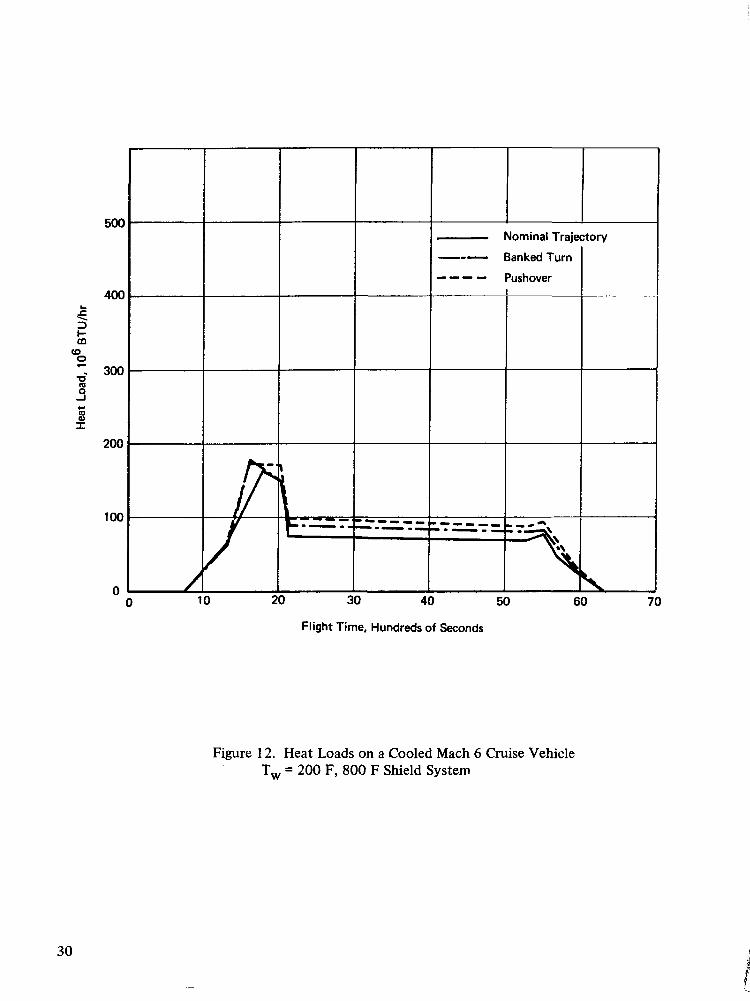
Nominal Trajectory
Flight Time, Hundreds of Seconds
Figure 12. Heat Loads on a Cooled Mach 6 Cruise Vehicle T, = 200 F, 800 F Shield System
30

COOLANT DISTRIBUTION SYSTEM DESIGN
During previous studies (see SUMMARY OF PRIOR TASKS) the weights of the cooling system were estimated on the basis of factors which had been developed at Bell as the result of many years of airframe cooling system development activities. While they provide realistic weight estimates, it is unlikely that the weight of a particular cooling system design would be predicted exactly. Accurate estimation of cooling system weight requires a rather thorough preliminary de- sign effort in which the sizes, operating characteristics and weights of all major components are defined. The total airframe convective cooling system consists of coolant passages which are inte- grated with the structural skin, the necessary distribution lines, pumps, heat exhanger and flow con- trols associated with coolant.distribution. The weight of the system includes contributions of these elements, plus the fuel to drive the coolant pumps, the residual coolant in the system, and the heat exchanger. The weight and operational characteristics of the cooling system depend upon the ex- ternal heating environments and the specific arrangement of system components. For a hypersonic transport, the hydrogen fuel serves as the heat sink and this weight is not charged to the cooling system. In this section, system components other than the integrally cooled structural panels are examined, alternate approaches are compared, selections are made, sizes are defined, and weights are determined. The partially shielded aluminum airframe was used for these cooling system design studies which examined distribution lines, heat exchanger, pump and system controls.
When designing an actively cooled structural system, it is necessary to provide the proper amout of coolant to each location so that temperatures are controlled within limits compatible with desired structural efficiency. During a mission, both the magnitude and distribution of the heat load on the vehicle vary as a function of time. For example, heating on upper surfaces will be increased substantially as the result of a pushover maneuver, as compared to nominal flight or a pull-up condition. However, when a maneuver is executed at a particular velocity and altitude, the increase in heating on one surface is usually coincident with a decrease in heating on an opposite surface. Thus, a suitable arrangement of sensors and valves can modify the transport fluid flow through the airframe structure to provide adequate temperature control under all flight conditions. However, such an arrangement adds complexity to the cooling system. An alternate approach is to design the basic cooling system so that each area of the structure is supplied with sufficient coolant to avoid exceeding temperature limits regardless of flight conditions or vehicle attitudes. With this arrangement various areas are overcooled during portions of the flight regime. Oversizing of the cooling system in this manner results in penalties related to system pressure drop, line sizes, and pumping power. The simplicity of this second approach is extremely attractive, and system penalties were found to be quite small. Therefore, the second approach was chosen for the system design.
Subsequent subsections define the maximum design heat loads, analyze and select routing for the distribution lines, size the heat exchanger and pump, consider and select flow controls, and present the selected system configuration.
Heat Loads
The heat loads on the vehicle were presented earlier (Maneuver Effects) for the nominal vehicle trajectory and for representative maneuvers. Maximum heating was found to occur during the ascent, at 1671 seconds for the unshielded regions and at 2024 seconds for the shielded regions. This difference in time is due to the fact that heating to the unshielded regions is given by the
31

product of the local heat transfer coefficient and the difference between the recovery and wall temperatures while the heating to the structure in a shielded region is primarily by radiation from the heat shield. As altitude and speed are increased during ascent, the heat transfer coefficients de- crease and the recovery temperature increases. Therefore, heat shield temperatures and the thermal radiation from them peak slightly later than maximum cold wall heat flux..
Table XI presents the maximum heat load to each region of the convectively cooled airframe as determined from a review of the heating conditions which exist during nominal flight, banked turns, pull-ups and pushovers for a 200F average skin temperature at flight times of 167 1 and 2024 seconds. Heat loads are presented for the lower, upper, and leading edge surfaces of the wing; verti- cal and horizontal tail surfaces; and 17 zones on the fuselage. The zone numbers on the fuselage correspond to those shown in Figure 6. The lower surface of the wing, the tail surfaces, and fuselage zones 1 through 5 and 8 are shielded. The last column of Table XI identifies the maximum heating conditions for each zone. Addition of these maximum incremental heat loads results in a total heat
TABLE XI HIGHEST HEAT LOADS ON A MACH 6 CRUISE VEHICLE, 1000°F SHIELDS
MANEUVER EFF.ECTS INCLUDED
Zone
Lower Wing Upper Wing Leading Edge Vertical Tail Horizontal Tail Fuselage 1
2 3 4 5 6 7 8 9
10 11 12 13 14 15 16 17
Total
T Heat Load, lo6 BTU/hr 1 Flight Time, Seconds
1671
4.10 34.50 34.24
2.35 2.19 0.60 0.7 1 0.69 1.62 1.41
17.50 12.50 2.52
23.40 27.2 1 18.20 7.84 7.99
10.18 7.26 1.56 4.40
222.3 1
2024
8.16 36.04 33.13
3.94 3.2 1 1.56 0.97 1.22 2.87 I .97
14.56 1 1 .os 3.8 1
19.08 21.79 16.16 6.14 6.24 7.94 5.95 1.23 3.06
210.10
Maximum for Cooling System
Design
8.16 36.04 34.24 3.94 3.21 1.56 0.97 1.22 2.87 1.97
17.50 12.50 3.8 1
23.40 27.21 18.20 7.84 7.99
10.18 7.26 1.56 4.40
235.99
Notes 1. Fuselage Zones per Figure 6 2. Lower Wing, fuselage zones 1, through 5 and 8 and both tails are shielded 3. Wing leading edge includes the first 5 feet of wing normal to leading edge
. 32

load of 236 x lo6 BTU/hr, which is only 7% greater than the heat load which occurs during a 60 degree banked turn at a flight time of 1671 seconds. Consequently, the penalties associated with designing the cooling system for this conservatively high heat load will be quite small and are con- sidered to be preferable to the system complexity required to modulate the exact quantity of coolant to each location under all flight conditions. This maximum heat load was used to size the coolant distribution lines, pumps and heat exchanger.
Line Routing
Prior studies indicated that a major portion of the cooling system weight is from the lines required for distribution of the water-glycol coolant to the structural panels and for the return of this coolant to the heat exchanger. The design of this piping also influences pump size and weight and requirements for fuel to drive the pumps. Several system arrangements were considered and compared.
General Arrangements - The cooled structural panels of the airframe can be connected among themselves and to the heat exchanger and pump by various piping arrangements of series, parallel, or series/parallel configurations. For an airframe of the size of a hypersonic transport, 35,000 square feet, almost an infinite number of line routing configurations are possible. When dealing with such a large surface area it is desirable to consider the flow circuit as consisting of three distribution levels: main lines which supply and return coolant for major elements of the airframe such as the wing, fuselage, and tail surfaces; branch lines which supply and return coolant to individual panels within the major airframe element; and flow circuits within the cooled structural panels including interconnections between such panels. The vehicle configuration itself suggests the desirability of employing a degree of parallelism in the distribution system at least to
initial studies were conducted to examine coolant distribution within one of these elements, the fuselage. Results could then be applied to the other elements.
' the level of major airframe elements, the fuselage, the wing, and the tail surfaces. Therefore,
The series-circuit approach has advantages of mechanical simplicity, excellent control of flow distribution, and minimum weight of coolant distribution lines. Disadvantages include higher pressure drops for a given flow rate as compared to other types of circuitry and a degree of in- ' flexibility with respect to coolant temperature as the transport fluid passes through the various panels to be cooled. The high pressure drop with a series circuit can be.reduced by increasing the coolant passage sizes but this adds to the weight of residual coolant. With the parallel system a manifold supplies coolant to the various structural panels at the same inlet temperature. In the ideal case, each panel receives only the flow required to absorb the heat load on that particular panel. Hence, panel flow rates are much less than for series arrangements and the residual coolant within each panel is reduced. Furthermore, the total pressure drop and the associated pumping power penalty are reduced when parallel flow circuits are used. However, the weight of residual coolant tends to be large because of the more extensive network of main and branch distribution lines required for a parallel flow system, and accurate flow distribution is more difficult to attain under all flight conditions. The use of a series/parallel system arrangement can usually provide an optimum compromise between the advantages and disadvantages of the individual system types.
For the fuselage, consideration was given to three types of coolant distribution systems as shown in Figure 13. Concept A is essentially a parallel flow type, Concept B is a combination series/ parallel system, and Concept C utilizes series flow primarily. Concept A is characterized by several
33
L

Supply Line Return Line Coolant Flow in Skin Panels
A. Original Line Routing
6. Simplified Line Routing
C. Minimum Line Concept
Figure 13. Schematic of Fuselage Coolant Distribution System Designs

sets of supply and return lines which run the length of the vehicle. The main lines are installed just below the floor of the passenger compartment and auxiliary lines are provided in the passenger compartment region. In the lower portion of the aircraft small lines are branched perpendicular to the main distribution lines to feed individual eooling panels which are approximately 10 feet wide by 10 feet long. If longer panel lengths are used, the number and weight of the branch lines can be reduced. Coolant flow through the panels in the lower portion of the fuselage is in the circumferential direction. In the region of the passenger compartment, passages in the cooled panels are v e r t i w y oriented to provide more uniform cooling at each passenger location. The heat exchanger is located forward of the main wing beam at the 67% chord line. The pumps are mounted directly on the auxiliary power system, which was assumed to be in the fuselage at the rear of the wing to eliminate separate electrical generators and motors. It is apparent that a system such as Concept A requires a relatively large number of distribution lines with low coolant flow rates through each panel.
Concept B is a simplified system which eliminates the requirement for branch lines from the main supply and return lines for the panels. With this arrangement a single supply line is provided at 'the top of the fuselage and a single return'line is provided along the bottom centerline. By supplying coolant along the top of the fuselage, the passenger compartment is kept relatively cooler than the majority of the airframe. The flow in the passages is oriented vertically so that both the supply and return lines are tapered in a stepwise manner as coolant is routed to and from the coolant panels. This arrangement requires the use of panels which are up to 40 feet long and were assumed to be 10 feet wide. For this arrangement, the heat exchanger was mounted from the for- ward side of the main wing beam and the pumps were mounted from the rear side to provide a more central location for the initial supply and final return lines. It was assumed that the auxiliary power supply could be located aft of the main wing beam so that the pumps could be mounted di- rectly to it and the exhaust could be ducted to the engine.
Concept C is an approach which eliminates most of the distribution lines. This system con- sists of the necessary interconnecting piping between the heat exchanger and pump plus the vertical lines up the sides of the fuselage at about midlength. These short main lines supply coolant to panels located on the upper portion of the fuselage. The coolant passages are horizontally oriented so that the coolant flows in the forward and aft direction from the vertical supply line. All of the coolant flows th;ough the upper panels to either the nose or tail from which it is routed to the panels on the lower surface which act as the return lines. The lower surface panels are then connected to a short length of main distribution line which feeds the heat exchanger. Such an arrangement minimizes the number of distribution lines but increases the passage sizes since ap- proximately one-fourth of the total flow passes down the full length of the fuselage through the panels.
A preliminary comparison of the characteristics of each of the three system types was made in order to identify which systems should be studied further. The results of this comparison are summarized in Table XI. Because the coolant flow ra t a through the panelsare less for Concept A and since the passage sizes are directly related to the coolant flow rate, this design can use small passage sizes so that the residual coolant weight in the panels, about 0.01 lb/ft2, is less than for the other'concepts. The small passage sizes also minimize the difficulty of integrating the cooled structural skin with the stiffening elements which run perpendicular to the coolant passages. How- eyer, the distribution line routing is more complex than that of the other approaches and the . number of connections between the distribution lines, the branch lines, and the skin panels is greater than for the other two system arrangements. Increasing the length of the coolant panels
35

to forty feet, that is, making them comparable to the lengths used for Concepts B and C, will reduce the number of panels and system connectors to essentially the same levels as for the other concepts. Average passage diameters and residual coolant weight would approach those of Concept B. The number of branch lines required to supply the skin panels would also be reduced with a weight re- duction of about 300 pounds. However, the residual coolant weight in distribution lines would still be greater than that required for just a single supply and a single return. line.
Item
Average Coolant Flow Rate Per 1 0-foot Wide Panel (Ib/hr)
Average Passage Diameter (in.) ,
Approximate Number of Panels
Approximate Number of Connectors
Residual Coolant Weight in Panel
Residual Coolant Weight in Lines
Uniform Flow Distribution
Concept A
7,500
0.05
400
800
1,650
9,750
Good
Concept B
30,000
0.10
150
300
3,800
6,100
Very Good
Concept C
120,000
1 .o
150
300
40,000
1,000
Excellent
.. .
"
Concept B simplifies the distribution system, reduces the number of system connectors, and reduces system weight. Passage size is increased because the flow rates are about four times greater for the larger panel size than they are for Concept A. It also offers the advantage of a lower coolant temperature at the passenger compartment which will reduce the heat load on the environ- mental control system. As a consequence of the fewer number of surface panels, uniform flow distribution throughout the system is more easily obtained with this design. Even though Concept C is probably the best on the basis of number of connectors, simplification and uniform flow distri- bution, the cross-sectional area of the passages at any fuselage cross section must be equivalent to two 6-inch diameter lines in order to satisfy the pressure drop constraint. Flow areas of this size result in system weights which are much greater than those of Concepts A and B; hence, Concept C was not considered as an attractive system and was eliminated from the more detailed sizing an- alysis.
The supply and return lines to the wing structure are somewhat more complex than for the fuselage as shown in Figure 14. The main wing supply and return lines are located near the fuselage/ wing intersection. Secondary supply and return lines for the cooled structural panels of the wing follow some of the wing spars. The supply and return lines must extend to within five feet of the leading edge to distribute coolant to the leading edge. As a result of the 65 degree sweep angle of the wing, the panel lengths will vary with span locations, and the dimensions of the passages must be tailored at each location. Since the passage sizes are varied, the supply and return lines can be located at the 20-foot intervals shown. There may be a slight weight advantage in running the coolant passages from five feet aft of the leading edge to the trailing edge flap; however, it was
36

k TO HX
i I I t i I I Supply Lines
I Return Lines
-+- Coolant Flow "
Direction in Skin
r---- T""7""""" I -r------
I I I I I I I I I
Panels
Figure 14. ,Wing Diskbution System Layout
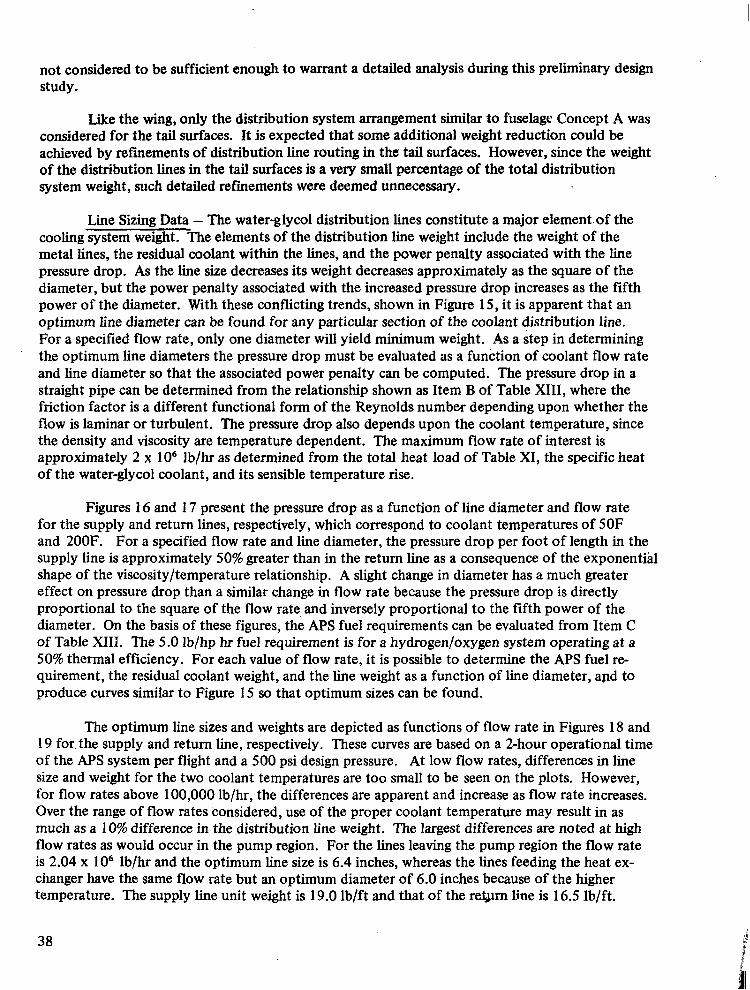
not considered to be sufficient enough to warrant a detailed analysis during this preliminary design study.
Like the wing, only the distribution system arrangement similar to fuselage Concept A was considered for the tail surfaces. It is expected that some additional weight reduction could be achieved by refinements of distribution line routing in the tail surfaces. However, since the weight of the distribution lines in the tail surfaces is a very small percentage of the total distribution system weight, such detailed refmements were deemed unnecessary.
Line Sizing Data - The water-glycol distribution lines constitute a major element.of the cooling system weight. The elements of the distribution line weight include the weight of the metal k e s , the residual coolant within the lines, and the power penalty associated with the line pressure drop. As the line size decreases its weight decreases approximately as the square of the diameter, but the power penalty associated with the increased pressure drop increases as the fifth power of the diameter. With these conflicting trends, shown in Figure 15 , it is apparent that an optimum line diameter can be found for any particular section of the coolant distribution line. For a specified flow rate, only one diameter will yield minimum weight. As a step in determining the optimum line diameters the pressure drop must be evaluated as a function of coolant flow rate and line diameter so that the associated power penalty can be computed. The pressure drop in a straight pipe can be determined from the relationship shown as Item B of Table XIII, where the friction factor is a different functional form of the Reynolds number depending upon whether the flow is laminar or turbulent. The pressure drop also depends upon the coolant temperature, since the density and viscosity are temperature dependent. The maximum flow rate of interest is approximately 2 x lo6 lb/hr as determined from the total heat load of Table XI, the specific heat of the water-glycol coolant, and its sensible temperature rise.
Figures 16 and 17 present the pressure drop as a function of line diameter and flow rate for the supply and return lines, respectively, which correspond to coolant temperatures of 50F and 200F. For a specified flow rate and line diameter, the pressure drop per foot of length in the supply line is approximately 50% greater than in the return line as a consequence of the exponential shape of the viscosity/temperature relationship. A slight change in diameter has a much greater effect on pressure drop than a similar change in flow rate because the pressure drop is directly proportional to the square of the flow rate and inversely proportional to the fifth power of the diameter. On the basis of these figures, the APS fuel requirements can be evaluated from Item C of Table XIII. The 5.0 lb/hp hr fuel requirement is for a hydrogenloxygen system operating at a 50% thermal efficiency. For each value of flow rate, it is possible to determine the APS fuel r e quirement, the residual coolant weight, and the line weight as a function of line diameter, apd to produce curves similar to Figure 15 so that optimum sizes can be found.
The optimum line sizes and weights are depicted as functions of flow rate in Figures 18 and 19 for. the supply and return line, respectively. These curves are based on a 2-hour operational time of the APS system per flight and a 500 psi design pressure. At low flow rates, differences in line size and weight for the two coolant temperatures are too small to be seen on the plots. However, for flow rates above 100,000 lb/hr, the differences are apparent and increase as flow rate increases. Over the range of flow rates considered, use of the proper coolant temperature may result in as much as a 10% difference in the distribution line weight. The largest differences are noted at high flow rates as would occur in the pump region. For the lines leaving the pump region the flow rate is 2.04 x lo6 lb/hr and the optimum line size is 6.4 inches, whereas the lines feeding the heat ex- changer have the same flow rate but an optimum diameter of 6.0 inches because of the higher temperature. The supply line unit weight is 19.0 lb/ft and that of the r a m Line is 16.5 lb/ft.
38

Minimum Weight
Wall Thickness
Line Diameter
Figure 15. Schematic of Distribution System Weight Optimization
39

P 0
10.0
1.0
Pressure Drop per Foot of Length,
psilft
0.1
*
Line Diameter, Inches 0.5 . _ 0.75 1.0 1.25 1.5 1.75 2.0 2.5 3.0 3.5
0.01
0.00 1
1 o3 1 o4 1 os Flow Rate, Ib/hr
1 o6
Figure 16. Pressure Drop per Unit Length as a Function of Flow Rate and Line Diameter for a 60 - 40 Water-Glycol Solution, Turbulent Flow
Temperature = 50" F

10.0
1 .o
Pressure Drop per Foot of Length,
p d f t 0.1
0.01
0.001
Flow Rate - lblhr
Figure 17. Pressure Drop per Unit Length as a Function of Flow Rate and Line Diameter . for Coolant Temperature of 200 F, Turbulent Flow

20
18
16
1 o4 1 05 1 o6
Flow Rate, Ib/hr
Figure 18. Optimum Line Diameters and Unit Weights for Distribution System Water-Glycol Temperature 50°F
42
I

20
18
16
14
12
10
1 CI Y-
r, 2 8 a .-
6
4
2
0
104 1 05 1 o6
Flow Rate, Ib/hr
Figure 19. Optimum Line Diameters and Unit Weights for Distribution System Water Glycol Temperature 200°F
43

TABLE XI11 LINE SIZING PARAMETERS
A. Fluid Flow Rate
I-low rate = heat input (BTU/hr)/heat capacity (BTU/lb)
where
N Q- A- Panel Heat lnput = x - J IJ
to Panel i A- J
Heat Capacity = Cp (To - Ti)
Qj - heat load (BTU/hr) to zone j from Table XI Aj - area of zone j from Table XXVl Ai, - area of panel i located in zone j Cp - specific heat of coolant (BTU/lb-'F) To - coolant temperature at panel outletJ F) Ti - coolant temperature at panel inlet ( F)
B. Pressure Drop
L - panel length f - friction factor g - gravitational constant d - hydraulicdiameter W - flow rate p - coolant density AF - flow area of passage Re - Reynoldsnumber = - I.( - Soolant viscosity
Wd AFP
C. Power Penalty
APS Fuel Requirements = ' * &' ' e P
F - hydrogen fuel weight per horsepower - hour - 5.0 lb/hp-hr AP - pressure drop 8 - APS operational time
D. Residual Coolant Weight
Residual Coolant Weight/ft = pAF
E. Line Weight
Line Weight/ft = ndmt pm
where
t . line thickness = - Pd
2 0 ~ ~
UAL - material allowable stress limit - 20,000 psi P - ultimate design pressure dm - actualdiameter pm - metal density
I
44

In addition to the pressure drop due to straight runs of the distribution lines, consideration must be given to the effects of fittings which are required to accomplish turning of the flow and routing from the main lines to the branch lines. The methods for estimating the pressure drop in converging, diverging, and turning fittings is more approximate than those for straight pipes. Therefore, two methods were compared. One of the most commonly used methods is the equiva- lent length approach. Flow through a fitting causes a reduction in static head similar to the reduc- tion from flow through a straight pipe. Therefore, a generally accepted procedure involves the determination of the length of straight pipe which would have the same pressure drop as the fitting at a particular Reynolds number. Table XIV presents the equivalent-length parameters for fittings that are likely t o be used in a convective cooling distribution system. These values are for standard types of fittings and were obtained from Reference 24. The other method used for predicting the pressure drops through fittings is more analytical and accounts for tees with branch angles other than 90 degrees with respect to the run and accounts for pressure drop differences of converging and diverging flows. Reference 25 discusses this procedure in detail and presents appropriate design charts.
TABLE XIV
EQUIVALENT LENGTHS FOR VARIOUS PIPE FITTINGS
Equivalent Length in Pipe Diameters
Fitting Description L/D
90" Standard elbow 30 90" Long Radius Elbow
60 Standard Tee, Flow Through Branch 20 Standard Tee, Flow Through Run 16 45" Standard Elbow 20
~
A comparison of the two methods was made for the simplified distribution system of the fuselage. For tees in either the supply or return line, the equivalent length method predicted higher pressure drops in the run section and lower pressure drops in the branch section. The cumulative effect was that the equivalent length method resulted in a total fitting pressure drop of 30 psi, where- as the method of Reference 25 resulted in a total fitting pressure drop of 47 psi for all the fittings located in the distribution lines to and from the panel furthest from the pump. Approximately 60% of this pressure drop occurs in the region between the heat exchanger and pump. In this region,.the flow rates are a maximum and the flow is passing through the branch of the tees; hence, the method of Reference 25 yielded larger pressure drops.
One means of reducing the fitting pressure drops is to employ Y fittings rather than tee fittings, so a quantitative comparison was made using the method of Reference 25. The use of the former type resulted in a 30% reduction of the total fitting pressure drop which was only a 7% re- duction in the total system pressure drop. However, the effort required to determine the angles of each fitting and the subsequent pressure drop for each Y-type fitting was not considered war- ranted for a preliminary analysis study. Since the system pressure drop due to fittings was about the same for the equivalent-length method applied to tees and for the method of Reference 25 applied to Y fittings, the former approach was used in subsequent studies.
45

Comparison of Weights and Pressure Drops - As discussed in the preceding subsection a coolant distribution.system of minimum weight is obtained when the distribution lines are opti- mized with respect to the weight of coolant lines, the weight of the residual coolant in the lines, and the power penalty associated with circulating the coolant at the required flow rate. For this case the optimization results in system pressure drops in the range of 300 psi to 400 psi. However, selection of the allowable system pressure must also consider the pressure capabilities of the coolant panels. Past experience indicates the desirability of employing structural skins with integral coolant passages in order to minimize the number of connections within the system. Prior testing of adhes- ively bonded and diffusion bonded panels, References 22 and 26, yielded burst pressure capabilities which ranged as high as 400 psi. For the design of the critical fluid flow system a burst pressure safety factor of between 1.5 and 2.0 is desirable. If the more conservative factor is used, allowable working pressures may range up to 200 psi while with the less conservative factor pressures of up to 265 psi may be acceptable. For purposes of this project it was considered desirable to compare the weight of optimum systems with those which could utilize integrally cooled panels produced with present state-of-the-art technology. The weight differences would then provide a measure of the rel- ative importance in advancing the state+f-the-art with respect to integrally cooled structural skins. Distribution system Concepts A and B were investigated. For purposes of these studies several as- sumptions were " made, including:
1. Coolant panel width of 10 feet 2. Coolant panel pressure drop of SO psi 3. Heat exchanger pressure drop of 20 psi 4. Coolant inlet temperature of 50F 5 . Coolant outlet temperature of 200F, except in cabin area.
A total coolant flow of 2.04 x lo6 lb/hr was required to supply every location on the vehicle with sufficient coolant so that local temperatures were not exceeded under any maneuver conditions permitted by hydrogen fuel flow considerations.
Concept A - The panel size for Concept A was assumed to be 10 ft x 10 ft and had a strong influence on the lay-out of the distribution system shown in Figure 20. The main supply line from the heat exchanger splits laterally to feed the two pumps. The interconnecting outlet line routes the flow to both sides of the aircraft where it branches to provide flow to the fuselage and wing. The fuselage distribution system is essentially symmetrical about a vertical plane through the longi- tudinal axis. A main supply linegp each side of the fuselage, located at Station 198, runs up to the cargo compartment floor at which point it divides to feed the forward and aft fuselage sections. A slight degree of assymmetry exists aft of Station 198 with the distribution line diameters on the right being slightly smaller than those on the left, because the left line supplies the vertical tail surface as well as the aft fuselage and left horizontal tail. At the rear of the passenger compartment each forward supply line branches to provide a parallel line half way up the passenger compart- ment. These additional distribution lines were needed to satisfy an initially imposed cabin temper- ature limit of 70F which was later relaxed for Concept B . Three return lines are provided along the length of the fuselage, one at the top centerline and one on each side of the fuselage just below the floor of the cabin compartment.
<. 4, >
A major assymmetry occurs at Station 153 in which all the flow from the upper passenger return line runs down the left side of the fuselage and combines with the flow at the passenger compartment floor and then continues down to combine with the wing return line which eventually feeds the heat exchanger. The vertical return line on the right side only connects the main return line at the passenger compartment floor and the right wing returns lines.
46

,- Upper Surface
c
0 R
RO I
IJ d; & d; m
\ Lower Surface
d; rn
Section A - A
R - 2.70; 141,500 S - 3.40; 217,700
Figure 20. Distribution System Line Sizes and Flow Rates for Concept A, 10 ft by 10 ft Panels, Low Pressure System
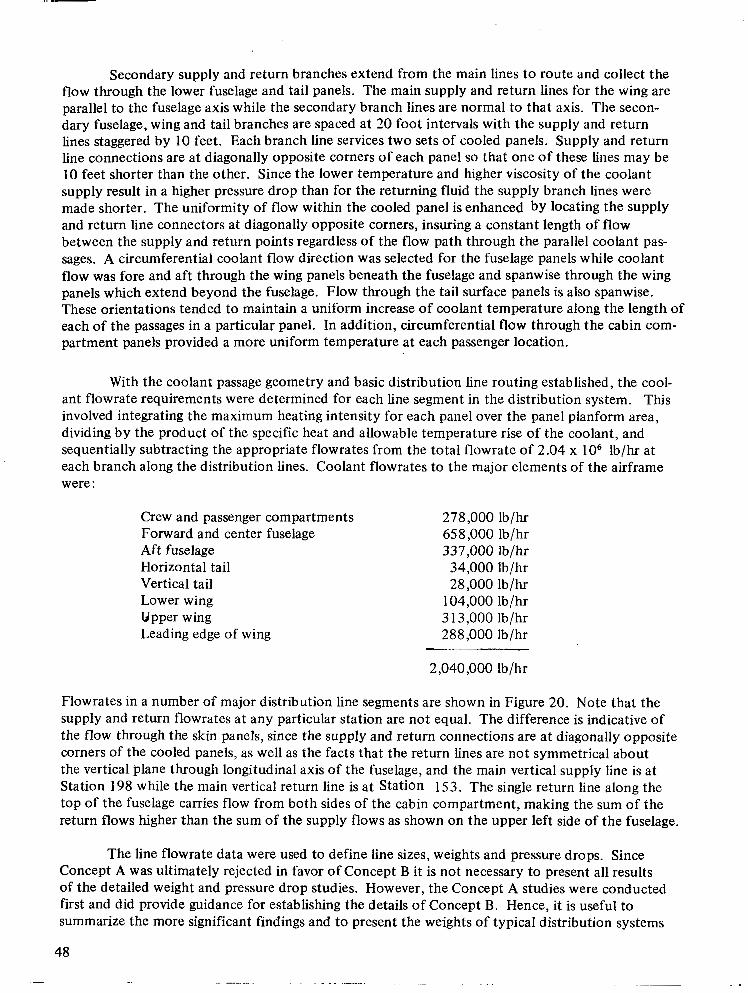
Secondary supply and return branches extend from the main lines to route and collect the flow through the lower fuselage and tail panels. The main supply and return lines for the wing are parallel to the fuselage axis while the secondary branch lines are normal to that axis. The secon- dary fuselage, wing and tail branches are spaced at 20 foot intervals with the supply and return lines staggered by 10 feet. Each branch line services two sets of cooled panels. Supply and return line connections are at diagonally opposite corners of each panel so that one of these lines may be 10 feet shorter than the other. Since the lower temperature and higher viscosity of the coolant supply result in a higher pressure drop than for the returning fluid the supply branch lines were made shorter. The uniformity of flow within the cooled panel is enhanced by locating the supply and return line connectors at diagonally opposite corners, insuring a constant length of flow between the supply and return points regardless of the flow path through the parallel coolant pas- sages. A circumferential coolant flow direction was selected for the fuselage panels while coolant flow was fore and aft through the wing panels beneath the fuselage and spanwise through the wing panels which extend beyond the fuselage. Flow through the tail surface panels is also spanwise. These orientations tended to maintain a uniform increase of coolant temperature along the length of each of the passages in a particular panel. In addition, circumferential flow through the cabin com- partment panels provided a more uniform temperature at each passenger location.
With the coolant passage geometry and basic distribution line routing established, the cool- ant flowrate requirements were determined for each line segment in the distribution system. This involved integrating the maximum heating intensity for each panel over the panel planform area, dividing by the product of the specific heat and allowable temperature rise of the coolant, and sequentially subtracting the appropriate flowrates from the total flowrate of 2.04 x lo6 lb/hr at each branch along the distribution lines. Coolant flowrates to the major elements of the airframe were :
Crew and passenger compartments Forward and center fuselage Aft fuselage Horizontal tail Vertical tail Lower wing Upper wing Leading edge of wing
278,000 lb/hr 658,000 lb/hr 337,000 lb/hr 34,000 lb/hr 28,000 lb/hr
104,000 lb/hr 3 13,000 lb/hr 288,000 lb/hr
2,040,000 lb/hr
Flowrates in a number of major distribution line segments are shown in Figure 20. Note that the supply and return flowrates at any particular station are not equal. The difference is indicative of the flow through the skin panels, since the supply and return connections are at diagonally opposite corners of the cooled panels, as well as the facts that the return lines are not symmetrical about the vertical plane through longitudinal axis of the fuselage, and the main vertical supply line is at Station 198 while the main vertical return line is at Station 153. The.single return line along the top of the fuselage carries flow from both sides of the cabin compartment, making the sum of the return flows higher than the sum of the supply flows as shown on the upper left side of the fuselage.
The line flowrate data were used to define line sizes, weights and pressure drops. Since Concept A was ultimately rejected in favor of Concept B it is not necessary to present all results of the detailed weight and pressure drop studies. However, the Concept A studies were conducted first and did provide guidance for establishing the details of Concept B. Hence, it is useful to summarize the more significant findings and to present the weights of typical distribution systems
48

for Concept A so that they may be compared with results for Concept B. The relative sizing of the supply and return lines. and the weight/pressure drop trends were defined by investigating that portion of the system from the pump to the most remote coolant panel, the most forward one on the fuselage. Since it is the pressure drop between the pump and this panel which determined over- all system pressure drop, representative weight trends were obtained. For this fuselage panel, only the main supply and return lines below the cabin compartment floor and forward of Station 21 1 must be sized. Figures 16 and 17 were used to determine the line sizes and line weight per running foot for each of the line segments connected to the most remote panel. The resulting weights of the. supply and return lines are shown as a function of line pressure drop in Figure 2 1 and include the residual coolant, the piping, and APS fuel requirements for all of the line segments to and from the most remote panel. The much greater weight of the supply line resulted primarily from inclu- sion of the piping between the heat exchanger and the pumps in this portion of the system. This section of piping carried the total coolant flowrate, had a diameter of 7.8 inches and weighed al- most 1400 pounds. The fact that the pressure drop for minimum supply line weight was much higher than for minimum return line weight was a consequence of the higher viscosity of the coolant supply and the higher flowrate in the return line. This return line carries all of the flow delivered to the lower portion of the fuselage by the below floor supply line plus part of the flow supplied to the cabin compartment. The weight optimization trend of reduced pressure drop at higher flow- rates compounds the effect of reduced coolant viscosity in decreasing the pressure drop in the re- turn 1in.e as compared to the cooler supply line.
On the basis of these results, a minimum weight of 3975 pounds was obtained for the supply and return lines to the most remote panel on the cooled airframe. It should be noted that these lines were sized for the flow required by all intermediate panels. The pressure drop in this segment of the system was 355 psi of which 70 psi accounted for the panel and heat exchanger. Since this pressure level was considered to be high, particularly if adhesively bonded coolant panels are used with burst pressure factor of 2.0, the weight penalty associated with systems of lesser pressure drop was assessed. The weight and pressure drop trade+ff was examined for the supply and return lines for the most remote panel. The results are summarized in Figure 22 which was generated fram the data of Figure 2 1. The distribution system weight is presented as a function of total system pres- sure drop and a pressure parameter which is the ratio of the supply pressure drop to the sum of the supply and return system pressure drops. Regardless of total system pressure, it is evident that the minimum weight is obtained when the supply pressure drop is between 60% and 65% of the total pressure drop. A weight penalty of 1250 pounds, 2576, is incurred if the system pressure drop is reduced to 150 psi from the value of 355 psi which yielded the minimum weight for this portion of the system.
For the Concept A studies just described minimum weights were achieved when the line pressure drops ranged from 0 .3 to 0.5 psi/ft. The weights of low pressure designs were based on scaling of the line sizes with respect to pressure drop ratio using the line sizes which yielded mini- mum weight as a base. A second series of studies was conducted to define the weight/pressure drop tradeoff for major sections of the distribution lines to the most remote panel. The purpose of these analyses was to check the desirability of scaling of line sizes with respect to those which yielded minimum system weight. For this study the distribution system to the most forward fuse- lage panel was considered to consist of three sections, namely, the supply line, the return line, and the line between the heat exchanger and the pumps. Arbitrary line pressure drops of 0.1 psi/ft and 0.05 psi/ft were compared with lines of optimum pressure drop. The weight and pressure drop results are summarized in Table XV. The distribution line weights include residual coolant and power penalties as well as the weight of the actual piping. As expected the line weights increase as the unit pressure drop is decreased, but the significance of the trends is better understood'if each
49

4500
4000
3500
3000
2500
-0 S
0 2
u)
n - 2000 w r cn .- $
1500
1000
500
0
- Supply System
-
-Return System
0 40 80 120 160 200 240 280 320 Pressure Drop, psi
Figure 2 1. Line and APS Fuel Weights for the Supply and Return System to the Most Remote Panel
50

0 0.2 0.4 0.6 0.8 1 .o Supply Line Pressure Ratio, A p s / A Ps + A p R
Figure 22. Weight of Supply and Return System for Most Remote Panel, Concept A, 70 psi Allowance for Panel and Heat Exchanger
5 1
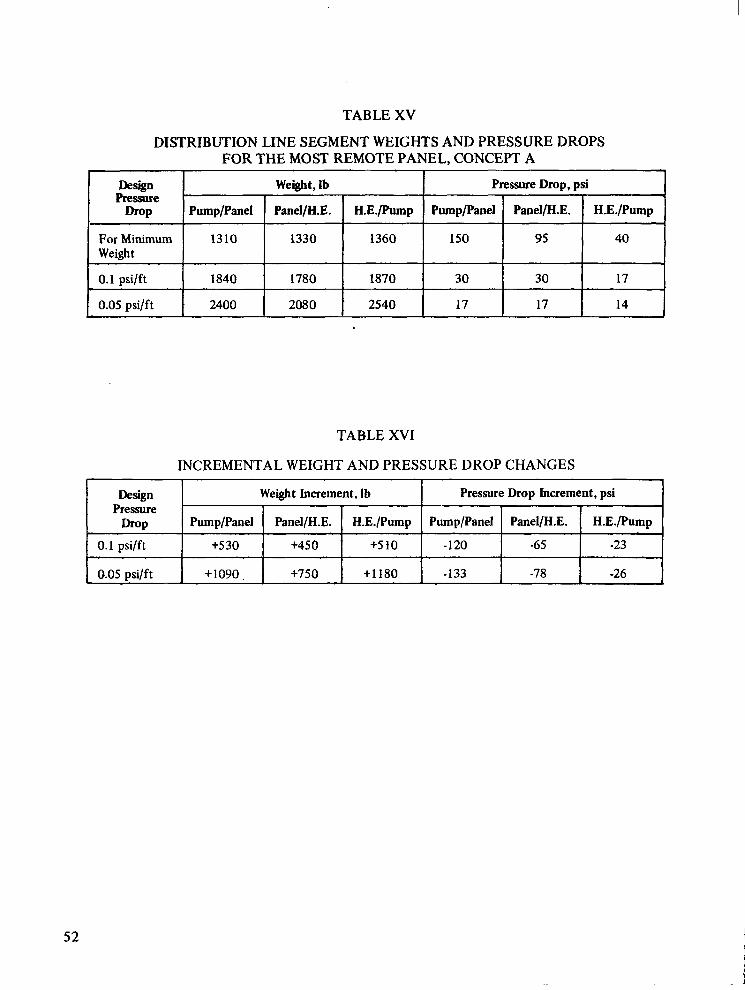
TABLE XV DISTRIBUTION LINE SEGMENT WEIGHTS AND PRESSURE DROPS
FOR THE MOST REMOTE PANEL, CONCEPT A
For Minimum Weight
0.1 psilft
0.05 psi/ft 2400
Weight, Ib Pressure Drop, psi
1780 1870 30 30 17
208 0 2540 17 17 14
TABLE XVI
INCREMENTAL WEIGHT AND PRESSURE DROP CHANGES
Design Pressure Drop Increment, psi Weight Increment, Ib Pressure
B O P H.E./Pump Pane1lH.E. Pump/Panel H.E./Pump Pane1lH.E. PumplPanel
0.1 psi/ft -23 -65 -120 +5 10 +45 0 +530
0.05 D d f t -26 -78 -133 + I 180 +750 +I090
52

line segment is examined in turn with the aid of Table XVI. For the line from the pump to the panel, decreasing the unit pressure drop to 0.1 psi/ft resulted in a weight increase of 530 pounds and a 120 psi decrease in pressure drop. Use of the same unit pressure drop for the return line increased weight by 450 pounds and decreased the pressure drop by 65 psi, while for the line be- tween the heat exchanger and the pump the weight was increased by 5 10 pounds and the pressure drop decreased by 23 psi. Further reductions in unit pressure drop were of little benefit because large weight increases were incurred to achieve small decreases of pressure drop.
In a parallel flow system the total system power penalty depends on the highest pressure drop of a single loop, generally the most remote from the pump. A decrease in the pressure drop of this loop can result in significant savings in APS fuel weight. From the studies just discussed it was apparent that decreasing the pressure drop in the supply lines provided the maximum benefit with a minimum increase of line weight. Where large flowrates are involved, such as between the heat exchanger and the pump, relatively high unit pressure drops can be used to minimize line weight with a minimum impact on system pressure drop.
The weights of two complete distribution systems based on Concept A are presented in Table XVII, based on system pressures of 355 psi and 150 psi. As expected, the line weight for the lower pressure system is significantly greater than for the high pressure system, but the power penalty is much less. The net result was a weight penalty of 1820 pounds for using the lower sys- tem pressure. However, the APS fuel requirements were based on the Mode 3 control schedule discussed later, which involves reducing coolant flowrate when heat loads are reduced. If coolant flow was maintained, constant at the maximum level required for maneuver conditions, Mode 5 , the power penalties for the two systems increase markedly. APS fuel requirements increased to 8300 pounds and 3400 pounds for the 355 psi and 150 psi systems respectively. For this type of flow control the 150 psi system was lighter by 2060 pounds.
During the Concept A design studies several beneficial system changes were identified in addition to those already discussed. The weight and power penalty for the line between the heat exchanger and the pumps could be reduced by about 65% by mounting these items as close together as possible. For the 355 psi and 150 psi systems the weight savings, including power penalty reduc- tions, were 965 pounds and 1245 pounds while the system pressure drops were reduced to 342 psi and 145 psi. Increasing panel length to 20 feet reduced system weight by almost 4%, 240 pounds for the 355 psi system and 330 pounds for the 150 psi system. With these system modifications the system weights were 7,145 pounds and 8,595 pounds for the 355 psi and 150 psi systems res- pectively. However, since these reduced weights were approximate they were not listed in Table XVII. A further weight reduction could be implemented by moving the vertical fuselage supply line forward so that the supply line lengths to the front and rear of the fuselage are more nearly equal. The impact of this change was not investigated because progress with the Concept B design indicated this new design was superior to the original approach.
Concept B - As compared with Concept A the major change in the Concept B distribution system involved a simplification of the fuselage supply and return lines, with only minor modifica- tions of the wing and tail plumbing. These changes were based on the Concept A studies which indicated that system weight was reduced by:
1. Substituting a few large lines for many small ones 2. Reducing the distance between the pumps and heat exchanger 3. Locating the vertical fuselage supply line near the middle of the total supply line length 4. Using cooled panels of large size.
53

TABLE XVII
DISTRIBUTION SYSTEM WEIGHTS, CONCEPT A
I Weight, Ib I item 1 355 psi I 150 psi I System System
Line Segment Heat Exchanger to Pump Pump to Fuselage Panels Fuselage Panels to Heat Exchanger Wing Supply and Return Tail Supply and Return
Subtotal
APS Fuel Requirement
1,360 1,610 1,760 1,560
290
6,580
1,770
8,350
1,870 2,610 2,780 1,810
350
9,420
750
10,170
TABLE XVIII
DISTRIBUTION SYSTEM WEIGHTS, CONCEPT B
System Pressure Drop
355 psi System System Item 150 psi
1
Line Segment Heat Exchanger to Pump Pump to Fuselage Panels Fuselage Panels to Heat Exchanger Wing Supply and Return Tail Supply and Return
Subtotal
APS Fuel Requirement
Total Distribution Svstem
490 1,280 1,070 1,470
270
4,580
1,770
6.350
760 1,990 1,640 1,790
320
6,400
750
7,150 -
54

The system design. Figure 23, employed a major supply line along the top of the fuselage and a major return line along the bottom with auxiliary supply and return lines along the wing root and branch lines into the wing and tail surfaces. The pumps and heat exchanger were located forward of the main wing beam and the lateral distance between pumps was reduced. The vertical supply line was moved from Station 198 to Station 170 so that it was approximately midway along the supply line from the nose of the fuselage to the tips of the tails. Fuselage panel lengths of up to 45 feet were used to minimize the number of supply and return lines. Panel lengths of 15 feet and 25 feet were used for the horizontal and vertical tail surfaces,while wing panel length was limited at 20 feet due to the high sweep which complicated panel layout. All panels were assumed to be 10 feet wide so that connections to the distribution are spaced at .20 foot intervals with the supply and return connections staggered by 10 feet.
From the pump the coolant flow splits laterally with a major portion routed to the left to supply the fuselage, the tail surfaces and the left wing, and a minor portion routed to supply the right wing. Just inboard of the fuselage/wing intersection the left lateral line branches vertically to supply the upper fuselage line and axially to supply the lower surface of wing. The upper fuselage line supplies all of the fuselage panels and all tail surfaces. Each wing root supply line provides coolant flow to the outboard portion of the wing through laterally oriented branch lines along the upper and lower surfaces. The central portion of the wing is supplied directly from the wing root lines. The return line along the lower fuselage collects the fuselage flows from Stations 0 to 11 1 and from Stations 21 1 to 314 as well as the lower wing surface flowsfrom Station 1 11 to 21 1, and the tail flows. Fuselage flows from Station 1 1 1 to 21 1 and wing upper surface flows are collected by the wing root return lines. The wing root return Lines connect laterally to the lower fuselage line forward of the heat exchanger.
On the basis of this distribution system and panel geometry, the coolant flow requirements were determined from the heat flux distribution. The resulting flowrates are summarized on Figure 23. Similar to Concept A, the supply line flowrates do not generally agree with the return line flowrates because of the flow in the panels. The flowrates were then used to size the distribu- tion system lines. For comparative purposes systems with total drops of 150 psi and 355 psi were investigated, 70 psi of which was due to the cooled panels and the heat exchanger. The line sizes for the 150 psi system are presented in Figure 23. Line sizes for the 355 psi system were approxi- mately 20% to 30% less than the values shown in this figure. Line diameters for the 150 psi system range from 7.87 inches at the pump inlets and outlets to less than 1 .OO at the ends of the smaller branch lines. The diameters of the supply and return lines are stepped at each point of panel con- nection to maintain the desired pressure drop/weigh characteristics as flow leaves or enters the lines.
A comparison of the weights for the 150 psi and 355 psi distribution systems is presented in Table XVIII. The supply and return line weights are substantially lighter for the 355 psi system but this is partially offset by the higher APS fuel weight. The weight penalty associated with the use of the 150 psi system is less than 1000 pounds. Comparison of the original Concept A systems with those of Concept B shows that the Concept €3 systems are lighter by 2000 pounds and 3020 pounds for the 355 and 150 psi systems respectively. Even when refinements to Concept A sys- tems are considered, the weight advantages for Concept B is still substantial, 795 pounds and 1445 pounds.
I

d; S - 4.9; 572,500 7
d; m S - 4.7; 520,800 7
r R - 3.7; 324,000
I / r S - 3.1; 160,900 S - 6.7; 1,331,600
R - 7.20; 2,040,000 R - 4.1 ; 433, 100
R - Return Line S - Supply Line d - Line Diameter (in.)
S - 7.87; 2,040,000 m- Flow Rate (Ib/hr)
Figure 23. Distribution System Line Sizes and Flow Rates for Concept B, Low Pressure System

Heat Exchanger Design
While many heat exchanger designs are available for aircraft use past experience suggests that the brazed aluminum plate and fin type is most appropriate for the hypersonic transport air- craft cooling system. Since the desired temperature levels are incompatible with either parallel flow or cross flow designs only a counterflow arrangement was considered. With these constraints the heat exchanger design problem is one of determining the optimum fin configuration.
Figure 24 presents a schematic of the heat exchanger core. It consists of hydrogen enter- ing the heat exchanger at -400F and leaving at 150F, and a water glycol solution entering at 200F and leaving at 50F. Rate controlled solenoid valves were located in the hydrogen line to the heat exchanger and in the bypass line to regulate the amount of hydrogen fuel supplied to the heat ex- changer with a minimum of flow fluctuation. A feedback control operated by a temperature sensor in the water glycol outlet was employed to control the hydrogen flowrate. After completing the panel design studies it became apparent that the temperature sensor should be located in the water glycol inlet line to ensure a hydrogen outlet temperature of 150F. This is necessary to minimize hydrogen requirements for airframe cooling.
The major parameters which define heat exchanger design are the peak heat load at any time during the flight trajectory and the log mean temperature difference between the coolants. The peak design heat load is a composite of heat loads due to various maneuvers and has a value of 236 x 1 O6 BTU/hr which dictates hydrogen requirements of 123,000 lb/hr and a water glycol re- quirement of 2.04 x lo6 lb/hr. The log mean temperature difference is determined from the rela- tionship :
(TI -Tz)-(TS -T4) ATln =
lf:: :;:I The temqeratures are defined in Figure 24. This relationship results in a log mean temperature difference of 182F at the maximum heat load condition. At reduced heat loads the log mean temperature difference will increase slightly and improve heat exchanger efficiency. On the basis of these values the required conductance, (UA), through the heat exchanger is 1.30 x lo6 BTU/ hr. .F. If a plate fin heat exchanger is employed several different types of fins could satisfy the (UA) requirement with different combinations of heat exchanger volume and pressure drop. Thus, the optimum heat exchanger is found from a tradeoff study between heat exchanger weight, which is directly related to heat exchanger volume, and APS fuel requirement, which is related to pressure drop.
Basically, there are three general fin configurations; plain, perforated, and offset. The plain fin provides continuous passages with no cross flow between passages. The flow is uniform, the pressure drop is low but the thermal performance is lower than for other types of fins. The use of such a fin results in a heat exchanger of relatively high weight but low power penalty. The perforated fin is similar to the plain fin except that louvers are stamped in the corrugated fin sheets. This increases the thermal performance, reduces the size of the heat exchanger but increases the pressure drop. The offset configuration employs staggered fins along the passage so that the flow is forced to change direction. Excellent thermal performance is achieved at the expense of a
57

r----- I r----' """" r-------'
.r"""""""- 1 Feedback Control
1 I I
Water-G lycol I I """"_ 1
Pump at 5OF - T3
T4
To - WaterG lycol From Panel at 200F
Hydrogen From Fuel Hydrogen to Tank at Engine at 150F -4OOF
Plate Fin Heat Exchanger
- - - - Sensor and Controls
Distribution System
Parting Sheet
Water-G lycol
Hydrogen
Water-G lym I
200
100
0
LL
-300
-400
Figure 24. Heat Exchanger Schematic and Operating Conditions at Maximum Heat Load
58

substantial pressure drop. The height, thickness and spacing of the fins can be varied over a wide range. As the fin height and spacing are decreased the thermal performance of the heat exchanger is improved, because of the greater amount of exposed surface area for a specified free flow area, but the pressure drop and heat exchanger weight are increased. An increase in fin thickness enhances thermal performance, since the heat flow path through the fin is improved, at the expense of a slight increase in heat exchanger weight.
Since the heat transfer, pressure drop and weight are so interrelated it is extremely dif- ficult to select the fin configuration and dimensions which will yield the lightest heat exchanger unless an optimization computer program is employed to compare all of the competitive configura- tions. A heat exchanger sizing computer program, which determines system weight as a function of Reynolds number in the passage, was used to select the optimum system for the (UA) iequire- ment specified. The fm configurations listed in Table XIX were considered. For each fin configur- ation, the dimensions, thermal characteristics and pressure drop characteristics are input to the program. These characteristics are readily available in Reference 27. In addition the parting sheet thickness, APS fuel weight penalty of 5 .O Ib/hp hr, and the fluid properties of both hydrogen and water glycol are required. The results of the optimizations indicated that an offset fin with a spacing of 14 fins per inch, a height of 0.25 inch and a thickness of 0.006 inch used for both the hydrogen and water glycol side of the heat exchanger would result in the lightest heat exchanger.
The computer program only determines which combination of fin configurations yield the lightest heat exchanger weight for a specified heat load but it does not determine the overall dimensions and pressure drop through the heat exchanger. Assuming a square cross-section in the flow direction, the heat exchanger weight items can be determined as a function of only one para- meter, the heat exchanger length. Once the optimum weight point is determined, the cross-section can be varied as long as the free flow area is not altered. For an aluminum heat exchanger with a parting sheet thickness of 0.010 inch and the optimum fin configuration, the total heat exchanger weight including residual coolant and APS fuel is shown in Figure 25 as a function of core height. The heat exchanger weight includes the fins, headers, parting sheets and supports. The optimum heat exchanger weight is 1380 lb for a heat exchanger having dimensions of 1.4 ft x 1.4 ft x 12 ft and a pressure drop of 20 psi. The required length and resulting pressure drop as a function of core height are shown in Figure 26. Previous estimates of the heat exchanger weight were computed from the following relationship:
Weight = (0.575 x lb/BTU/hr) (Total heat load, BTU/hr)
which yield a heat exchanger wet weight of 1400 pounds. This weight did not include any penalty for the APS fuel requirement. Assuming a 20 psi pressure drop for a water glycol flowrate of 2.04 x IO6 lb/hr, the APS fuel requirement is 400 lb and the total operating weight of the heat exchanger would be 1800 lb, 420 lb greater than the optimized design weight.
As a result of the temperature difference between the hydrogen inlet temperature, 400F, and the water glycol outlet temperature, 50F, the wall temperature on the water glycol side may be less than the freezing point of water glycol, -70F. If this is the case it may be necessary to modify the heat exchanger design which would undoubtedly increase the heat exchanger weight slightly. A steady state thermal analysis of this section indicated the wall temperature on the water glycol side was -1 76F, well below the freezing point. These results are based on a water glycol side heat transfer coefficient of 1 180 BTU/hr-ft2-F and a hydrogen side coefficient of 865 BTU/ hr/ft2-F which are the values for the optimum design. Wali temperatures less than the freezing point do not
59
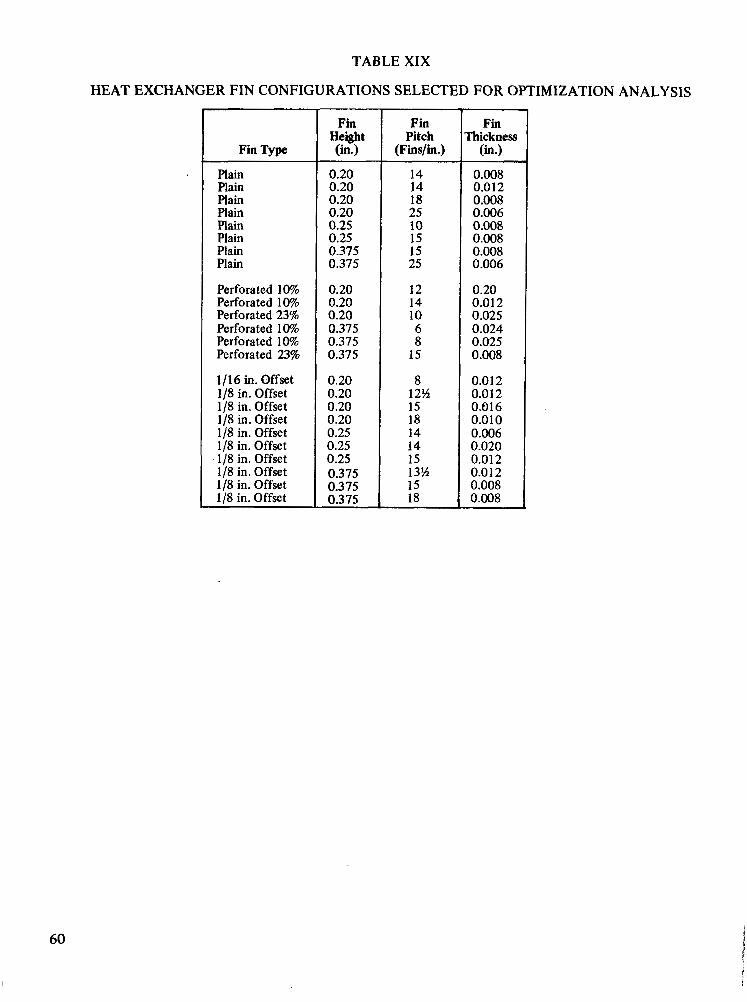
TABLE XIX
HEAT EXCHANGER FIN CONFIGURATIONS SELECTED FOR OPTIMIZATION ANALYSlS
Fin Type
Plain Plain Plain Plain Plain Plain Plain Plain
Perforated 10% Perforated 10% Perforated 23% Perforated 10% Perforated 10% Perforated 23%
1/16 in. Offset 1/8 in. Offset 1/8 in. Offset 1/8 i n . Offset 1/8 in. Offset 1/8 in. Offset 1/8 in. Offset 1/8 in. Offset 1/8 in. Offset 1/8 in. Offset
Height Pitch (Fins/in.)
0.20 0.20 0.20 0.20 0.25 0.25 0.375 0.375
0.20 0.20 0.20 0.375 0.375 0.375
0.20 0.20 0.20 0.20 0.25 0.25 0.25 0.375 0.375 0.375
~~
14 14 18 25 10 15 15 25
12 14 10 6 8
15
8 12% 15 18 14 14 15 13% 15 18
Fin rhickness (in.)
0.008 0.012 0.008 0.006 0.008 0.008 0.008 0.006
0.20 0.01 2 0.025 0.024 0.025 0.008
0.01 2 0.01 2 0.016 0.01 0 0.006 0.020 0.01 2 0.01 2 0.008 0.008
60

4ooo
3600
3200
2800
2400
n - g 2000 .- 0 3
1600
1200
800
400
0 0 . 1 2 3 4 5 6
Core Height, feet
Figure 25. Counterflow Heat Exchanger Weight Optimization Heat Load 236 X IO6 BTU/hr., Square Core, No Wall Temperature Constraint
61

100.0
10.0
1 .o
0.1
0.01
0.001
Figure 26. Heat Exchanger Pressure Drop and Length as a Function of Core Height, Square Core, Offset Fin, Heat Load 236 x lo6 BTU/hr,
AT = 182°F
62

necessarily mean that the water glycol passages would freeze solid. The frozen layer of coolant which may form locally would insulate the water glycol stream from the low hydrogen temperature. The offset fm configuration tends to keep the fluid well mixed hence a bulk water glycol tempera- ture of 50F which is well above the freezing point is obtainable. This may reduce potential freezing problems, however, it is better design practice to keep the wall temperature above the freezing point.
Two methods are available for increasing the wall temperature. One is to adjust the ratio of the water glycol side conductance to the hydrogen side conductance such that the wall tempera- ture is above -70F. The other is to increase the thermal resistance through the parting sheet. To increase the water glycol thermal conductance requires an increase of either the heat transfer coef- ficient or of the exposed surface area. Addition of a greater number of fms per inch at the cold end of the heat exchanger would provide this desired result. If a 25 FPI corrugated sheet was employed for the last 3.3 feet on the water glycol side the heat transfer coefficient times surface area would be sufficient to maintain the wall temperature above -70F however, the total pressure drop would be doubled. This increase in AI'S fuel requirement is approximately 400 pounds.
The other approach is to employ 2 thicknesses of aluminum rather than one for the parting sheets and add a tapered section of honeycomb between the sheets at the cold end of the heat exchanger. The thermal resistance across the parting sheet will be increased, in turn in- creasing the temperature on the water glycol side of the sheet and reducing the temperature on the hydrogen side. The temperature drop through a single parting sheet at the cold end is 15F. By adding a 50 mil thickness of honeycomb (25% effective area) at the cold end this resistance can be increased to 200F which results in a wall temperature of -70F. The added resistance reduces the overall conductance of the heat exchanger by 15% hence the length, weight and pressure drop would be increased by 15%, 2 10 pounds. In addition, the honeycomb parting sheet increases the weight by 60 pounds. Thus, the maximum heat exchanger weight would be 1650 pounds. However, if the heat exchanger is resized for the reduced conductance near the cool end the opti- mum point will shift to a slightly larger core cross-section and the total heat exchanger operating weight will be reduced slightly. Therefore, a heat exchanger weight of 1600 pounds seems ap- propriate for a 1.7 ft x 1.7 ft x 14 ft unit.
Pump Sizing
The size, weight, and power requirements for the pump needed to circulate the water glycol coolant through an airframe depend upon the necessary flow rate and system pressure drop. To allow for variations in system design a parametric study was conducted to relate pump charac- teristics with cooling system flow parameters. For the parameteric studies water glycol flow rates were varied from 1 .O x 1 O6 to 4.0 x lo6 lb /h and pressure drops were varied from 100 psi to 500 psi. A single stage centrifugal pump design was considered most appropriate for the relatively high flow rates and modest pressure drops anticipated. Pumps of this type and size are within the pre- sent state-of-the-art and are used extensively for liquid propellant rocket engine applications. The coolant was assumed to enter the pump at 50F. A pump efficiency of 85% was used along with a specific speed of 2,000. Figure 27 relates specific speed to pump efficiency for flow rates in the range of interest and indicates that the assumed values are slightly conservative.
Proper operation of a centrifugal pump requires appropriate definition of inlet conditions to avoid cavitation and to minimize losses as the working fluid is introduced at the impeller. The temperature of the water glycol entering the pump will be less than 200F and the vapor pressure will not exceed 12 psia so that no particular problems are expected in providing a sufficient net
63
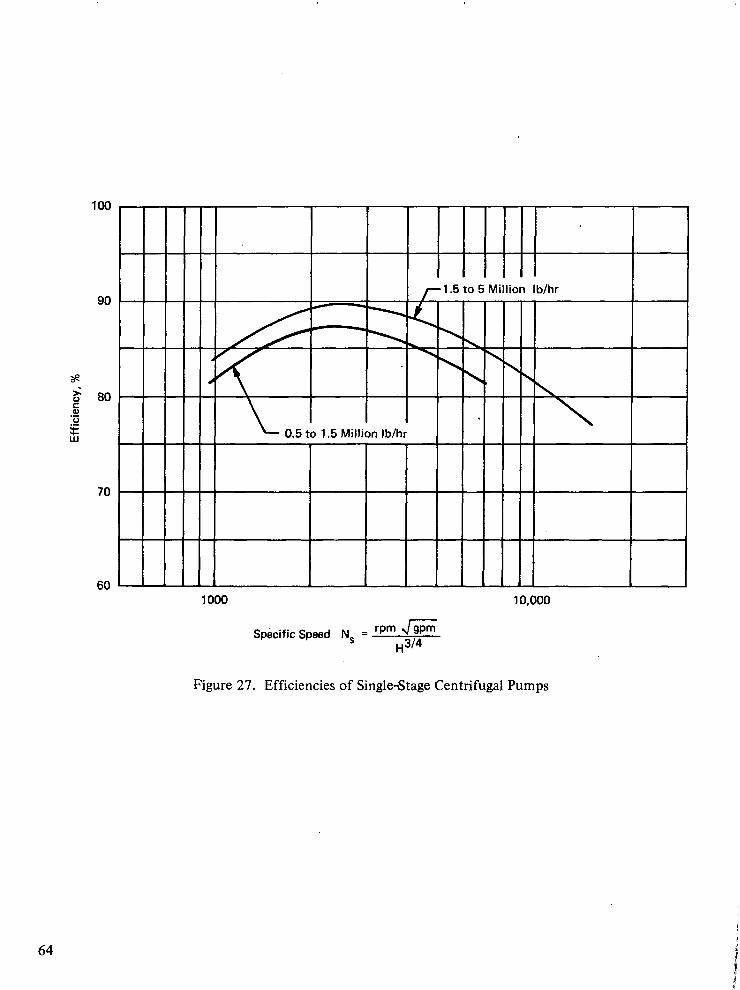
100
90
* 5 80 C 0)
0 .-
;;; .- 'c
70
60 1000
Specific Speed N, = rpm 4 gpm ~ 3 1 4
10,000
Figure 27. Efficiencies of SingleStage Centrifugal Pumps
64

positive suction head. The closed loop water glycol distribution system contains an expansion tank, essentially an accumulator, pressurized to about 30 psia while the system is at ambient temperature and its pressure would increase to about 50 psia as the circulating coolant temperature increases. For efficient pump operation an inlet velocity of about 20 pfs should be provided. The flow re- quirement and coolant properties enable sizing of the inlet line using the equation shown in Table xx.
TABLE XX PUMP SIZING PARAMETERS
A. Specific Speed
where Ns - specific speed N - pump speed H - pump head m - m a s flow rate
B. Suction Line Diameter
C. Tip Diameter
dI = Inlet Diameter
p = density
v = velocity
Once the-suction line diameter is determined the tip diameter can be computed as a function of flow rate and head. Results are presented in Figure 28 for the assumed specific speed and efficiency values. Since the impeller diameter is a function of the specific speed slight increases and decreases in pump size can be accomplished by decreasing or increasing the specific speed for the design. At a particular flow rate and pressure drop this is synonymous with changing pump speed. Pump speeds for the impeller diameters shown in Figure 28 are presented in Figure 29. The speed range from 1 100 to 8400 rpm is well within current practice so that variations in pump size

25.C
20.c
15.c
5.c
a
t

9000
8000
7000
6000
5000 L
P
5 4000
3000
2000
Figure 29. Pump Speed as a Function of Flow Rate and Pump Requirements Ns = 2000, 77= 85%
67

could be considered as a means of reducing pump weight slightly during detailed design of an air- frame cooling system. The specific speed of 2,000 was used in all cases except where the ratio of the inlet diameter to the tip diameter exceeded 0.8 in which case the tip diameter was taken as 1.25 times the inlet diameter. Values greater than 0.8 result in undesirable flow conditions since the coolant entering the impeller section will interfere with the impeller flow field. The impeller diameter increases with an increase in flow rate so that a constant velocity is maintained in the impeller section. As the head is increased the pump speed must be increased to impart more mo- mentum to the fluid.
Pump weights and power requirements are presented in Figures 30 and 3 1. The weights include the residual coolant in the pump as well as the housing, impeller, and bearings. Impeller cases are normally cast and this sets the minimum wall thickness of about 0.2 inch, which was conservatively increased to 0.37 inch for the parametric study. During detailed design of the pump the actual housing thickness can be determined and a slight weight savings may be expected. The initially surprising trend of increasing pump weight with decreasing head is due to the fact that the housing thickness was assumed to be constant and that impeller diameter increases as the required head decreases. However, this does not imply that system weight could be reduced by using a pump with a high head and installing an orifice to increase system pressure drop. Such an approach in- creases the power input to the pump and the A P S fuel required to supply this additional power. Power requirements, as presented in Figure 3 1, increase quite rapidly as pump head is increased.
Coolant Flow Control
During the initial line routing analyses it was assumed that the power to the pumps re- mained at a constant level during the entire flight as well as for a short time prior to take-off and after landing. This assumption of constant power dissipation results in a large increment of sys- tem weight associated with the APS fuel required to drive the coolant pumps, about 3300 pounds and 8000 pounds for the 155 psi and the 355 psi systems based on the Concept B configuration. Furthermore, it was assumed that sufficient coolant was supplied at all times to deal with the maximum heat load at any point on the vehicle due to any maneuver which is compatible with the engine fuel flow rate.' That is, for the critical period of time when heating conditions are most severe there is sufficient coolant flow so that allowable maneuvers can be performed with- out a requirement for increasing coolant flow rate to any location on the vehicle.. Obviously these assumptions are quire conservative and alternate techniques of coolant flow control were examined to reduce the APS fuel requirements.
For coolant flow rate history assumption the various modes of control might include:
1. Exact monitoring of coolant flow in accordance with total heat load for the
2. A mode similar to 1 but with a specific percentage of excess coolant flowrate. 3. Stepwise variations of coolant flowrate as a function of time to approximate the heat
4. Constant flow rate set at the maximum for nominal flight and terminating at the
5. Constant flow rate set high enough to deal with all maneuver conditions and
nominal flight.
load history
end of the supersonic flight regime.
initiated prior to take-off and continued after landing.

400
n
n
n f
0
Figure 30. Pump Weight as a Function of Flow Rate and Head Requirements Ns = 2000, rl = 85%
69

2500
2000
1500
1000
500
0
500
-
-
-
-
1 .o Flow Rate, Million Ib/hr
Figure 3 1 . Pump.Horsepower as a Function of Flow Rate and Head Requirements Ns = 2 0 0 0 , ~ = 85%
70
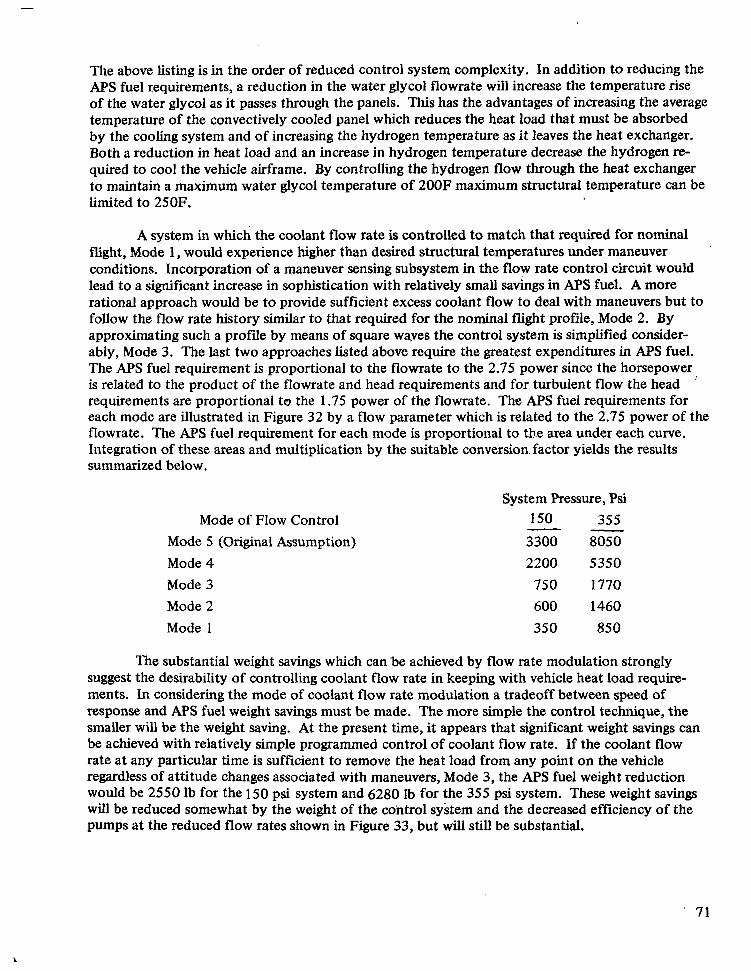
The above listing is in the order of reduced control system complexity. In addition to reducing the APS fuel requirements, a reduction in the water glycol flowrate will increase the temperature rise of the water glycol as it passes through the panels. This has the advantages of increasing the average temperature of the convectively cooled panel which reduces the heat load that must be absorbed by the cooling system and of increasing the hydrogen temperature as it leaves the heat exchanger. Both a reduction in heat load and an increase in hydrogen temperature decrease the hydrogen re- quired to cool the vehicle airframe. By controlling the hydrogen flow through the heat exchanger to maintain a maximum water glycol temperature of 200F maximum structural temperature can be limited to 250F.
A system in which the coolant flow rate is controlled to match that required for nominal flight, Mode 1, would experience higher than desired structural temperatures under maneuver conditions. Incorporation of a maneuver sensing subsystem in the flow rate control circuit would lead to a significant increase in sophistication with relatively small savings in APS fuel. A more rational approach would be to provide sufficient excess coolant flow to deal with maneuvers but to follow the flow rate history similar to that required for the nominal flight profde, Mode 2. By approximating such a profde by means of square wa,ves the control system is simplified consider- ably, Mode 3. The last two approaches listed above require the greatest expenditures in APS fuel. The APS fuel requirement is proportional to the flowrate to the 2.75 power since the horsepower is related to the product of the flowrate and head requirements and for turbulent flow the head ' requirements are proportional to the 1.75 power of the flowrate. The A P S fuel requirements for each mode are illustrated in Figure 32 by a flow parameter which is related to the 2.75 power of the flowrate. The APS fuel requirement for each mode is proportional to the area under each curve. Integration of these areas and multiplication by the suitable conversion. factor yields the results summarized below.
Mode of Flow Control Mode 5 (Original Assumption)
System Pressure, Psi 150. 355
3300 8050 - -
Mode 4 2200 5350 Mode 3 Mode 2
750 1770 600 1460
Mode 1 350 850
The substantial weight savings which can 'be achieved by flow rate modulation strongly suggest the desirability of controlling coolant flow rate in keeping with vehicle heat load require- ments. In considering the mode of coolant flow rate modulation a tradeoff between speed of response and APS fuel weight savings must be made. The more simple the control technique, the smaller will be the weight saving. At the present time, it appears that significant weight savings can be achieved with relatively simple programmed control of coolant flow rate. If the coolant flow rate at any particular time is sufficient to remove the heat load from any point on the vehicle regardless of attitude changes associated with maneuvers, Mode 3, the APS fuel weight reduction would be 2550 lb for the 150 psi system and 6280 Ib for the 355 psi system. These weight savings will be reduced somewhat by the weight of the control system and the decreased efficiency of the pumps at the reduced flow rates shown in Figure 33, but will still be substantial.
' 71

20.0
1b.O
16.0
14.0
m 12.0
10.0
8.0
6.0
4.0
2.0
0.0
0 1000 2000 3000 4000 5000 Time, sec
7000
Figure 32. Coolant Flow Control Techniques, Wo = 2.04 x lo6 lb/hr

2.0
1.6
1.2
0.8
0.4
0
-7" Schedule to Account
for Manuevers !
0 1000 2000 3000 4000 5000 6000 7000 Flight Time, sec
Figure 33. Coolant Flow Rate Schedule, Mode 3
I
COOLED PANEL DESIGN
The structural skin of the hypersonic transport represents a very large surface area from which heat must be removed. If structural temperatures are limited to relatively low values, high structural efficiency can be achieved with easily fabricated construction materials, such as aluminum alloys. Skin gages will be relatively thin because of the modest structural loading intensities associ- ated with large transports with low aspect ratio wings. Despite the high thermal conductivity of aluminum alloys, the thin skin thicknesses, 0.04 to 0.08 inch, provide only a modest in-plane con- duction of heat under conditions of small temperature gradients necessary to maximize coolant out- let temperature and minimize cooling system weight and thermal stresses. The low in-plane thermal conductance coupled with the desirability for small in-plane temperature gradients requires the use of closely spaced coolant passages to absorb the incident heat flux. For a specified heat load to a skin panel of a defined size, the quantity of coolant flow required to maintain desired temperature limits can be computed by dividing the heat load by the specific heat of the coolant and the allow- able coolant temperature rise while passing through the panel. However, proper design of the cool- ant circuit is required to achieve the desired temperature rise in the coolant and to simultaneously minimize the impact of the cooled panel design on the weight of the aircraft cooling system. There- fore, the design of cooled structural panels requires consideration of passage sizing and routing pa- rameters as well as panel size and heating intensity.
In this section cooling panels, representative of the entire vehicle, are designed with respect to passage size and spacing. Also, residual coolant weights of each designed panel are assessed. The designs are based on steady-state heating equivalent to maximum values at each location. The per- formance of the panels under representative transient heating conditions is then examined for a time-dependent coolant flowrate, intended to minimize pumping power penalties. Since cooling .
panel design is an iterative procedure, a series of design charts are presented to facilitate this process by providing numerical solutions of the various relationships involved.
Cooled Panel Design Procedure
The design of cooled structural panels has as its objective the control of panel temperature with a minimum of impact on system weight and reliability. The use of integral coolant passages eliminates the weight of coolant tubes and minimizes the number of joints and connections. For a particular coolant, definition of the sizing and routing of passages within a structural skin panel re- quires consideration of:
Heating intensity Panel length Panel width Allowable temperature rise of the coolant Maximum allowable panel temperature In-plane thermal conductance of the panel Temperature gradient between coolant passages Passage spacing Panel pressure drop Passage hydraulic diameter Passage heat transfer coefficient Residual coolant weight.
74
.
The heating intensity to the structural skin panel is obtained from an aerodynamic heating analysis. To ensure adequate temperature control under all conditions, the maximum heat flux experienced by each panel during a nominal trajectory with maneuvers should be used for its design. Integration of the heat flux distribution over the panel area defines the quantity of heat to be ab- sorbed by the airframe cooling system. Panel planform dimensions, length and width, are functions of vehicle configuration and the routing of coolant distribution lines. Larger panels lead to more reliable systems by reducing the number of connections frpm the distribution lines to the panels. The relatively large size ,of the integral headers required to ensure uniform flow through the coolant passages, as shown in Figure 34, makes it desirable to use panels having aspect ratios greater than two. As the aspect ratio increases, the unit weight of the residual coolant in the panel decreases. Structural skin panels with integral coolant passages have been produced in sizes up to 2 ft x 8 ft, but by the 1980-1990 time period when hypersonic transports may be expected, panel sizes of up to 10 ft x 50 ft should be practical.
Having defined the total heat load to the structural panel, the required coolant flowrate can be determined from the specific heat and allowable temperature rise of the coolant. For an alumi- num airframe designed for a long service 1ife;the maximum coolant temperature must be somewhat below the maximum allowable structural temperature to allow for in-plane temperature gradients between coolant passages, but must also be as high as possible to maximize heat rejection to the hydrogen fuel. The minimum coolant temperature should be as low as possible to minimize cool- ant flowrate, but not so low as to cause high pumping power penalties due to increased viscosity or heat exchanger penalties due to reduction of the log mean temperature difference. For present day aluminum alloys a maximum operating temperature of 250F is reasonable for long life applications, so that the maximum coolant temperature may be as high as 200F. At temperatures below about 70F, the pumping power penalty associated with water glycol flow begins to increase rapidly, so that minimum temperatures below about 40F are generally undesirable. For purposes of the present study, minimum and maximum coolant temperatures were selected at 50F and 200F, thereby providing an allowable temperature rise of 150F. ,
In the crew and passenger compartments it may be undesirable to operate at the maximum structural temperature since the internal temperature must be maintained at about 70F. In these regions high structural temperatures increase the heat load and weight of the environmental control system. However, if the structural temperature is limited to 180F, equivalent to that reached on a hot sunny day while on the ground, the capacity of the environmental control system is not penal- ized by hypersonic flight conditions. The reduced outlet temperature of the coolant from this region would increase coolant flowrate requirements and system weight unless this coolant can be routed through other skin areas to absorb sufficient heat to raise the coolant temperature to 200F.
For regions where the structure is designed by minimum gage considerations, rather than loading intensities, it may be possible to increase the maximum allowable structural and coolant temperatures. In addition, the maximum temperature of the structural panels occurs near the out- let end of the panel. If the outlet is located in a region of low stress, structural temperatures above 250F could be allowed. This will have a favorable influence on the cooling system by reducing coolant flowrate, weight, and hydrogen coolant requirements. However, these potential benefits were not incorporated during the present studies, therefore making the results slightly conservative.
The temperature distribution along a typical aluminum alloy structural panel with integral passages is shown in Figure 35 for the inlet, outlet, and maximum structural temperatures selected. Because of the spacing between individual coolant passages, an in-plane temperature gradient is
75

INTEGRAL HEADER COOLANT PASSAGE
- - . - “
”. . 7 -:---.--- - .- ’3 -1
Figure 34. Cooled Airframe Structure

established. The magnitude of this gradient depends upon the passage spacing and the in-plane thermal conductance of the panel; that is, the product of the thermal conductivity and thickness of the construction material. As will be shown later, the panel thickness will be determined from structural rather than thermal design considerations if minimum weight is to be achieved. Therefore, for a particular heat flux and construction material the magnitude of the temperature gradient be- tween passages is proportional to the square of the passage spacing. In establishing an optimum panel coolant circuit design tradeoffs between passage spacing and maximum panel temperature is required. The temperature levels and temperature gradients shown in Figure 35 are somewhat simplified in that the temperature drop through the coolant boundary layer was neglected. In the actual design case the maximum panel temperature is the sum of the coolant outlet temperature, the coolant film drop, and the gradient between passages, rather than the sum of the first and third items as shown in the figure.
Temperature
Of Land Temperature Along Center
Temperature Along Center of Passage
Inlet, T, = 5OoF
Figure 35. Temperature Distribution Along a Convectively Cooled Aluminum Panel
Determination of the passage spacing permits the computation of the number of passages required for the particular panel, the coolant flow rate for a single passage, and the quantity of heat to be absorbed by the coolant flowing in each passage. If the number of passages contains a frac- tional part, then the next highest number is used. Knowing the coolant flowrate per passage and the allowable pressure drop per foot of passage length, the hydraulic diameter may be determined. The pressure drop per foot is found from the allowable panel pressure drop and the panel length. When numerous coolant panels are connected in parallel between supply and return lines, the allow- able pressure drop through any panel is determined by the pressure difference between the supply and return lines at the points of panel connection. Only for the single pane1 most remote from the pumps is it necessary to minimize panel pressure drop in order to minimize system weight.
77
I .

After the passage hydraulic diameter. has been determined the heat transfer coefficient in the passage and the coolant film temperature drop can be computed. A check can be made of the maximum panel temperature; and if the desired value is not achieved, another value is assumed for the temperature gradient between coolant passages and the coolant circuit characteristics are reeval- uated iteratively until the desired value is obtained. Once the coolant circuit characteristics for the panel are known the residual coolant contained in the circuit can be computed.
A procedure for sizing the coolant circuit and passages for an actively cooled structural panel is described as a series of steps, some of which utilize design charts, based on a 125F coolant temp- erature, to facilitate their implementation. These steps are as follows:
1. Determine heat load to the panel by integrating the local heating intensities over the .panel area.
2. Determine the coolant flowrate by dividing the heat load by the product of the cool- ant specific heat and total temperature rise.
3. Divide the peak heat flux of the panel by the thermal conductivity and thickness of the skin material to obtain the parameter q/kt.
4. Estimate the temperature gradient between passages by subtracting the coolant outlet temperature from the maximum allowable panel temperature.
5. Using the results of steps 3 and 4, determine the approximate passage spacing from Figure 36 . This figure was generated from the relationship shown in Table XXI, item A.
6. Determine the number of coolant passages by dividing the panel width by the passage spacing. If a mixed number results, use the next highest integer.
7 . Determine the coolant flowrate per passage by dividing the total flowrate determined in step 2 by the total number of passages.
8. Compute the unit pressure drop by dividing the allowable panel pressure drop by the panel length.
9. With the results of steps 7 and 8, read the passage hydraulic diameter from Figure 37 . The equation shown in Table XXl, item B was used to prepare this figure.
10. Compute the passage width from the hydraulic diameter, which is equal to four times the free flow area divided by the wetted perimeter.
I 1 I . Subtract the passage width from the passage spacing as determined in step 9.
78

ln c Q
0 C - d b
Figure 36. Coolant Passage Spacing

TABLE XXI. PANEL SIZING PARAMETERS
A. Passage Spacing
(s - w)
s - passage spacing (in.) w - passage width (in.) t - skin thickness (in.) k - thermal conductivity (BTU-in./hr-ft'-OF) A T - skin temperature difference (F) q - heat flux BTU/hr-ft'
B. Hydraulic Diameter
If Re < 2300 f = 16/Re. Re > 2300 , f = 0.079/Re 1/4
f - friction factor @ - passage aspect ratio p - coolant density (lb/ft3) m - mass flowrate (lb/hr) (aP/L) - unit pressure drop (psi/ft) Re - Reynolds number
C. Heat Transfer Coefficient
k d k
Laminar - h = 1.86 - (Re Pr d/L)0.33
Turbulent - h = 0 . 0 2 3 7 Prom4)
L - passage length pr - Prandtl number
80

0.6
0.5
0.4
0.3
0.2
0.1
0
Figure 37. Coolant Passage Hydraulic Diameter
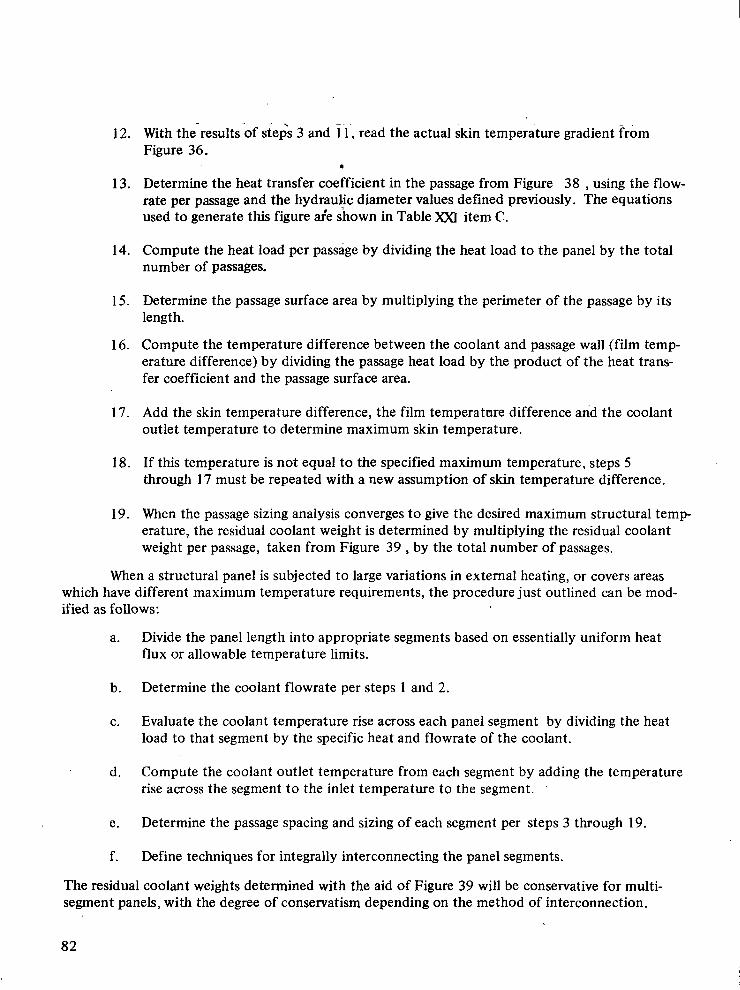
12.
13.
14.
15.
16.
17.
18.
19.
With the-results-of ste& 3 and i.1, read the actual skin temperature gradient from Figure 36.
Determine the heat transfer coefficient in the passage from Figure 38 , using the flow- rate per passage and the hydra+ diameter values defined previously. The equations used to generate this figure ar'e shown in Table XXI item C .
Compute the heat load per passage by dividing the heat load to the panel by the total number of passages.
Determine the passage surface area by multiplying the perimeter of the passage by its length.
Compute the temperature difference between the coolant and passage wall (film temp- erature difference) by dividing the passage heat load by the product of the heat trans- fer coefficient and the passage surface area.
Add the skin temperature difference, the film temperature difference and the coolant outlet temperature to determine maximum skin temperature.
If this temperature is not equal t o the specified maximum temperature, steps 5 through 17 must be repeated with a new assumption of skin temperature difference.
When the passage sizing analysis converges to give the desired maximum structural t e m p erature, the residual coolant weight is determined by multiplying the residual coolant weight per passage, taken from Figure 39 , by the total number of passages.
8
When a structural panel is subjected to large variations in external heating, or covers areas which have different maximum temperature requirements, the procedure just outlined can be mod- ified as follows:
a.
b.
C.
d.
e.
f.
Divide the panel length into appropriate segments based on essentially uniform heat flux or allowable temperature limits.
Determine the coolant flowrate per steps 1 and 2.
Evaluate the coolant temperature rise across each panel segment by dividing the heat load to that segment by the specific heat and flowrate of the coolant.
Compute the coolant outlet temperature from each segment by adding the temperature rise across the segment to the inlet temperature to the segment. '
Determine the passage spacing and sizing of each segment per steps 3 through 19.
Define techniques for integrally interconnecting the panel segments.
The residual coolant weights determined with the aid of Figure 39 will be conservative for multi- segment panels, with the degree of conservatism depending on the method of interconnection.
82

Heat Transfer Coefficient, BTU/ftZ hr F
20,000
10.000 8,000 6,000
4,000
2,000
1,000 800
600
400
200
100 80 60
40
20
10
10
Figure 38. Coolant Passage Heat Transfer Coefficient, L = 10 Feet T = 125'F, Water-Glycol
83

1.0
0.8
0.6
0.4
0.2
0.1
0.08
0.06
0.04
0.02
0.01
0.005
0.006
0.004
0.002
0.
0.001
Figure 39. Residual Coolant Weight in Panels
D
84

The following example illustrates the panel design procedure, assuming these problem inputs:
( 1 ) q = 38,000 BTU/ft2 hr (2) k = 960 BTU-in./ft2 hr "F (3) panel size = 10 ft long x 2 ft wide (4) permissible panel pressure drop = 10 psi ( 5 ) coolant temperature rise = 150F, 50F inlet (6) maximum skin temperature = 250F. (7) coolant specific heat = 0.76 BTU/lbF
The total heat load is 760,000 BTU/hr and the required coolantflowrate is 6,600 lb/hr. To show the effect of skin thickness on the cooled panel design, three values were assumed, 20 mils, 40 mils, and 80 mils; the q/kt values are 2000, 1000 and 500, respectively. As a first approximation, the temperature difference between the passages was assumed as 40F. This results in passage spacings of 0.39,0.57 and 0.8 inch for the three skin thicknesses which, in turn, defines flowrates per pas- sage of 107, 157, and 220 lb/hr. Since the available pressure drop is 10 psi and the panel length is 10 ft, the unit pressure drop is 1 .O psi/ft. The hydraulic diameters are determined from Figure 37 as 0.1 , 0.1 1 , and 0.1 3 inch for skin thicknesses of 20 mils, 40 mils and 80 mils respectively. As- suming a passage width to height ratio of 3. The passage widths are 0.2,0.22 and 0.26 inch. Sub- tracting.these passage widths from the spacing and entering Figure 36, the actual temperature dif- ferences between passages are obtained as 9.0, 17.0 and 2 1 .OF.
Now that the temperature difference in the skin is known, the film temperature difference must be determined before the maximum temperature can be calculated. The heat transfer coeffi- cients in the passages are read from Figure 38 as 800, 650, and 600 BTU/hr-ft2-F for passage heat loads of 12,300, 18,100, 25,400 BTU, the film temperature differences are 3.OF, 4.5F and 6.OF. Adding both the skin and film temperature differences to the coolant outlet temperature, the max- imum panel temperatures are 21 2, 221.5 and 227F. In all cases these temperatures are less than 250F; hence larger temperature differences between passages can be assumed and the above pro- cedure repeated.
The maximum panel temperatures determined for several iterations are plotted on Figure 40 as a function of passage spacing for each skin thickness. The weights of the cooled systems, based on each skin thickness, which limit the maximum skin temperature to 250F are:
Weight, lb/ft2
. Skin Thickness, mils Skin Coolant Total - - 20 40 80
0.29 0.2 1 0.50 0.58 0.20 0.78 1.16 0.19 1.35
85

Skin Thickness, Inch
400 - 380 - 360
340 -
320 LL
a- 5 300 w
i 280
I-
2f 260 .- C
240
c Residual Coolant Weight
\
-
Hydraulic Diameter
180
160 0 0.2 0.4 0.6 0.8 1 .o 1.2
Passage Spacing, in.
Figure 40. Relationship of Coolant Panel Design Parameters

Thus, while thicker skins permit a slight reduction in the weight of residual coolant, the reduction is more than offset by the added skin weight. Therefore, except in special cases of high heat fluxes, the skin thickness will be selected on the basis of structural rather than thermal requirements. Note that the high weight of residual coolant, 0.2 1 Ib/ft2, is due to the very close passage spacings, 0.65 to 0.85 inch, required for the very high heat flux assumed. For a heat flux of 3800 BTU/ft2 hr, an external heat transfer coefficient of about 1.5, the passage spacing would be about 2 inches and the residual coolant weight would be about 0.04 lb/ft2 , almost negligible compared to the skin weight.
Detailed Panel Designs
In the previous sections, parametric design charts were developed to allow rapid sizing of the integrally cooled skin panels for any location on an externally heated vehicle. Since the heat load and available pressure drop for each panel of the hypersonic trapport are known, it is possible to size each panel of the vehicle. For purposes of the present study, it was considered sufficient to size five representative panels and to apply the results to the entire airframe. Heat fluxes, lengths, flow rates, and allowable pressure drops are presented in Table XXII. In all cases the panel width was 10 feet, the maximum allowable structural temperature was 250F, the coolant inlet and outlet temperatures were 50F and 200F respectively, and water-glycol was the coolant. Flow directions for the fuselage and wing panels and for the leading edge are shown in Figures 4 1 , 14, and 42 respectively.
TABLE XXII
MAXIMUM HEAT FLUX TO REPRESENTATIVE STRUCTURAL PANELS
Maximum
Heat Flux, lb/hr . feet psi BTU/ftz - hr SeC Location
Coolant Flowrate Length, AP Flux,
Time of Max Allowable Heat
Fuselage - Station 30 3,070 17.2 40 Crew Compartment
2720 2024 Bottom Section 1470 2024 Side Section 2080 2024
Fuselage - Station 1 10 36,200 40.4 60 Passenger Compartment
3,200 2024 Bottom Section 13,250 1671 Side Section 1 1,850 1671
" ~
Fuselage - Station 2 10 39,900 45.0 60 10,250 1671
wing - Upper Surface
. 364,000(1) 2024 Leading Edge
3,960 70 f 20.0 2,290 2024 Lower Surface
29,400 70 20.0 17,100 2024
50 ] 4.0(2) (3) I
. ___ ~~
(1) At the stagnation line of a 0.10-inch diameter. (2) In the coolant flow direction normal to the leading edge sweep line. (3) 1540 lb/hr per foot of length.
87

Between fuselage Stations 0 and 45 the airframe is protected by heat shields which signi- ficantly attenuate the heat flux to be absorbed by the cooled structural panels. Because of the conical configuration of this portion of the fuselage, panel lengths increase for rearward panels. The design of the coolant distribution systems provides larger allowabie pressure drops for these longer panels and minimizes the variation of pressure drop per foot of panel length. At Station 30 where the representative panel for this region was selected, an allowable pressure drop of 50 psi was assumed, 40 psi through the panel and 10 psi for the connectors. This will permit an allow- able drop of about 40 psi for the nose cap region. Although the presence of the heat shields mini- mizes the variation of heat flux over the surface of the cooled panels, the push-over and pull-up maneuver conditions generate higher heating on the top and bottom than on the sides. In addi- tion, the upper portion of the panel covers the crew compartment where structural temperatures should not exceed 180F. Therefore, the cooled panel at Station 30 was a three segment design. Fuselage panels located between Stations 45 and 200 experience nearly the same variation in peri- pheral heat flux. Allowable pressure drops increase from front to rear. Station l 10 was selected as representative of this region. This panel was subdivided into three segments, the passenger com- partment, the unshielded side section, and the shielded lower section. In the first segment, struc- tural temperatures are kept below 180F, while the other two segments represent large variation in heat flux due to the absence and presence of heat shields. Regions aft of Station 200 experience rather uniform heat flux in both axial and peripheral directions, hence, subdivision of this panel is unnecessary.
Since a major portion of the wing lower surface is protected by heat shields, the magnitudes and planform variations of heat flux are less for the cooled lower panels than for the upper panels. Therefore, the lower panels require less flow and may be of larger size. Two lengths were examined, for each type of wing panel to illustrate the influence of this parameter on panel design and resi- dual coolant weight. Since the tail surfaces are shielded, the results of the lower wing panel designs were assumed to be applicable to the tail. The desirability of a small diameter leading edge with its increased lift, reduced drag, and reduced heat load precludes the use of heat shielding for the first five feet of the wing as measured normal to the leading edge. Over the first two feet of the leading edge, the very high heat fluxes dictate such close passage spacing that the structural panel concept shown in Figure 41 cannot be used. An alternate structural approach, shown in Figure 42 , involves the machining of coolant passages into a block and sealing them with a cover skin. Cool- ant enters an integrally machined supply header along the lower rear edge, flows around the leading edge through convergent/divergent passages with minimum depth at the leading edge hemi- cylinder, and is collected in an integrally machined return header along the upper rear edge.
The coolant panel design charts presented earlier in this section were used to define the passage configuration and spacing, and the unit residual coolant weight for the three fuselage and the four wing panels. Results are summarized in Table XXIII. Passage cross sections were assumed to have a 3: 1 aspect ratio so that the passage width is sufficient to specify the geometry. Passage sizes are smallest and spacings are largest in shielded regions. For the three segment fuselage panels at Stations 30 and 1 10, the passage spacings selected were slightly off optimum to permit changes in passage spacings for the various segments. For the Station 30 panel every three passages from the crew compartment segment converge into a single passage in the side segment and this branches into three passages along the bottom segment. For the Station 1 10 panel, see Figure 41, four passages from the passanger compartment converge into two through the side segment and these two converge into a single passage in the shielded bottom segment. The panel size variations examined for the wing panel indicate an increase of residual coolant weight as panel size is in- creased. However, this weight increase is more than offset by decreases in the weight of connectors and of branch lines in the distribution system.

I., 0 040 in. r 0-23
0.077 in.
0.097 in.
1
0.12 in.
I 2.40 in.' -1
I -1 I_ 0.36 in.
492 in.
E
a"
Top Fuselage Centerline
Inlet Header
Passenger bmpartment
Coolant Flow Direction
Side of Fuselage
c Shielded Lower iurface of Fuselage Outlet
Header
Lower Fuselage Centerline
Figure 4 1. cooled Fbelage Panel, Station 1 10
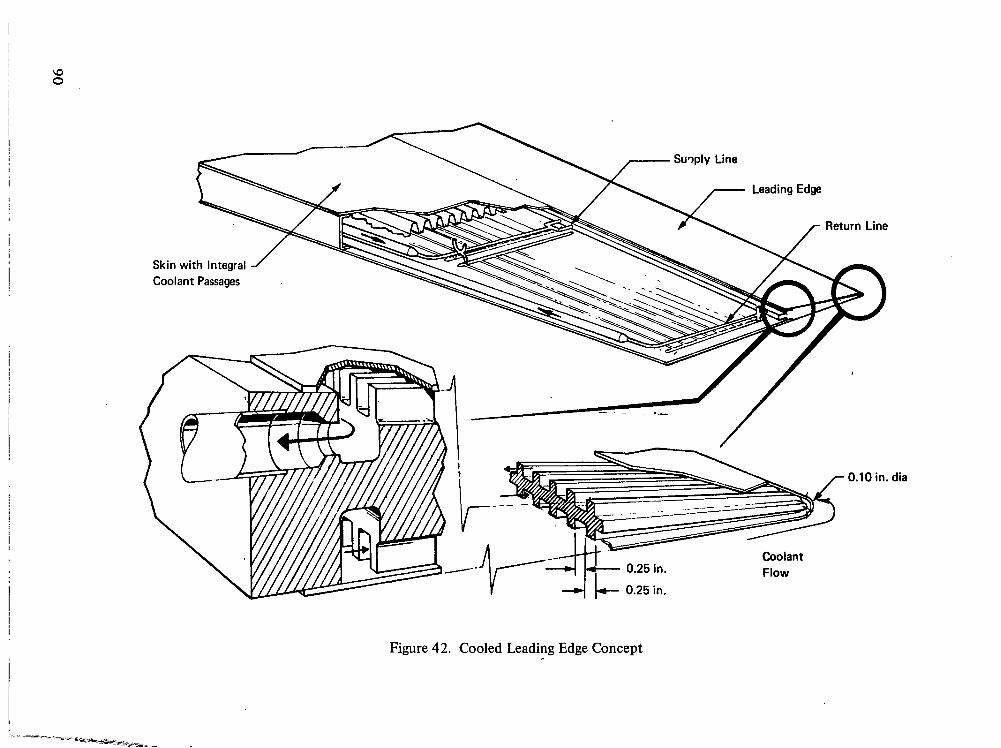
Figure 42. Cooled Leading Edge Concept
dia

TABLE XXIII
PASSAGE SIZE A STRU(
Location
Fuselage - Station 30 - Crew Side Bottom
~ I
Passenger Side Bottom
. __-__ . .
Lower Surface . .~
Leading Edge
JD SPACING FOR REPRESENTATIVE rURAL COOLING PANELS
Panel Length,
Feet
Passage
Inch Inch
Residual Coolant Unit
Weight, Iblftz
17.2 .
(8 -7) (5.0) (3.5)
~~"
40.4 (11.4) ( 19.0) ( 10.0)
0.10 3.30 0.15 1.10
1.10 0.10
0.23 0.29
0.60
2.40 0.36 1.20
0.028
0.024 ~ 0.018
0.187 0.160 0.125
45 .O 0.182 1.35 0.33 ." ~. .~~ .
20.0
0.25 0.5 0.10 4.0
0.1 13 '0.90 0.20 20.0
0.0295 2.42 0.14 -. . - - - -
91
The design charts were based on a water-glycol temperature of 125F, and either laminar or turbulent flow at the outlet of the coolant passages. Actually, the coolant temperature varies from 50F a t the inlet to 200F at the outlet. The change in coolant properties which result from the temperature change cause much of the flow to be in the transition region. Depending on the particu- lar panel, and neglecting entrance effects, flow-transition begins 10% to 20% down the coolant passage and only the last 20% to 50% of the passage length experiences fully developed turbulent flow. There- fore, finite difference analyses were used to check the panel designs. The panel length was divided into a number of elements and the thermal analysis used the fluid conditions at the end of one element
. as input for the next. In this way heat transfer and pressure drop characteristics were checked as a function of temperature along the length of the panel. The computer program employed contained empirical curve fits, to establish heat transfer and pressure drop characteristics in the transition regime, between Reynolds numbers of 2300 to 10,000. Results of these design checks are listed in Table XXIV. In a few instances the maximum panel temperatures differ slightly from the desired value of 250F. For the wing panels, which were assumed to be 10 ft x 20 ft, the passage spacing could be in- creased slightly to increase the maximum panel temperature; however, the pressure drop would be decreased to the target values by decreasing the passage spacing slightly. For preliminary design purposes, the agreement between these results and those based on the design charts were considered to be satisfactory.
. The geometry of the leading edge configuration precluded the use of the coolant passage design charts. The passage spacings are very small, the coolant passages are not of constant cross section, and conduction is significant between the upper and lower surfaces as well as rearward from the leading edge hemicylinder region. Therefore, a three dimensional finite difference com- puter program, with temperature dependent material properties, was used to perform parametric analyses of heat transfer and pressure drop characteristics as functions of coolant passage config- uration and spacing. For each case examined, the passage width was assumed to be constant along the length of the passage, but the depth was increased linearly from the shoulder of the leading edge rearward. Temperature gradients in the leading edge block were quite small because of the high thermal conductance of the aluminum block design. Maximum temperatures did not exceed 250F when the minimum passage depth was less than 0.032 inch around the leading edge and passage width was less than 0.10 inch. Maximum passage depth did not have a significant influence on heat transfer characteristics but affected the pressure drop. When the passage depth was varied linearly from 0.15 to 0.032 to 0.15 inch the pressure drop was 20 psi, well below the allowable value of 70 psi.
Panel Performance
During the nominal trajectory, the heating rates to any of the cooled panels are less than the maximum maneuver heating rates used for designing the coolant circuits and passages so that panel temperatures are less than the maximum allowable used for design even if the coolant outlet temperature could be maintained to 200F. To define the variation of panel temperature, the heat- ing conditions along that portion of the nominal trajectory where speeds exceed M = 2 were applied together with the coolant flow rate history corresponding to Mode 3 of Figure 33. It was assumed that the hydrogen flow rate through the heat exchanger was controlled to maintain the outlet tem- perature of the water-glycol at 50F. On the basis of these constraints, the temperature distributions and the coolant pressure drops through representative cooled panels were determined.
Figure 43 presents the temperature histories of points located between coolant passages on fuselage panels at Stations 30, 1 10, and 2 10. The temperatures of the airframe structure at the crew, passenger, and cargo compartments range from 70F to 120F, well within the limitations of the environmental control system. In the other areas the temperatures are less than the allowable max- imum temperature of 250F. As a matter of fact, these temperatures are generally less than 200F
92

TABLE XXIV
MAXIMUM PANEL TEMPERATURE AND PRESSURE DROP THROUGH . TYPICAL COOLED STRUCTURAL PANELS AT PEAK HEAT LOADS
Section
Drop, M P , Temperature, Spacing, Width, Length,
Panel Panel Pressure R.essure Maximum Passage Passage
Panel Location Psi Pd F Inch Inch Feet "
Fuselage - Station 30 . 17.2 Crew
48.5 4.0 249 1.10 0.10 (3.5) Bottom 10.0 233 3.30 0.15 (5.0) Side 34.5 180 1YiU 0.10 (8.7)
Fuselage - Station 110 40.4 Passenger
61.0 15.2 22 1 2.44 0.36 ( 10.0) Bottom 29.1 253 1.20 0.29 (19.0) Side 16.7 194 0.60 0.23 (11.4)
Fuselage - Station 210 45 .O 0.33 1.35
Wing
65.0 65 .O 249
"" - .- - " ""."
Lower Surface 75 .O 75 .O 236 ' 0.90 0.20 20.0 Upper Surface 75.0 75.0 215 2.42 0.14 20.0
93

240
200 U
j 160 ki E
E! m
Q
c 120
80
40
280
240 LL
120
80
L - ~~ .~~ - ~
1 I Station 1 10
t A # .~ . . -. . . -
/' Side, 30.4 feet t
\ I 1 I
" -
Passenger Compartment, 11.4 feet from Inlet
I I I I I
280 I I Station 210 1 1 1 1 1 1
240
U 200
El w
al
a
2 1 6 0 n E I-"
120
80
40
"- "
A' \ A
XTemperature I
I A
& Cargo Compartment, 11.4 feet from Inlet
1 5000 6000 500 1000 2000 3000 4000
Flight'Time, sec
Figure 43. Temperature Histories of Between Passage Locations on Fuselage, Nominal Trajectory
94

280
240
200 LL
P 3 4-
ii I 6 O E
120
80
40 1 000 2000 3000 4000 5000
Flight Time, sec
Flight Time, sec
Figure 44. Temperature Histories of Between Passage Locations on Wing Surfaces, Nominal Trajectory
95
i

Pressure Drop, psi
80
70
60
50
40
30
20
10
0 1000 2000 3000
Flight Time, Sec
4000 5000
Figure 45. Pressure Drops Through Fuselage and Wing Panel, Nominal Trajectory
: i

- - - Nominal Flight Path
Crew Compartment, 8.7 feet from Inlet Side, 13.7 feet from Inlet Bottom, Outlet
300
250
50
0 0 1000 2000
Time, sec
0 1000 2000 Ti,me, sec
0 l o o 0 2000
Time, sec
Figure 46. Temperature Envelope for Fuselage Panel at Station 30, Maneuver Conditions

and the average panel temperature is between 150F and 175F for the major part of the flight. Be- cause of the shielding along the lower surface at Station l 10, the structural temperature peaks along the side of the fuselage even though the coolant temperature continues to rise along the panel length and the passage spacing in the shieldedregion is larger than along the side.
Figure 44 presents the temperature histories of points located between coolant passages on the lower and upper wing panels. For the lower surface, the maximum temperature increases to approximately 200F during the ascent, jumps to 240F when the coolant flow rate is reduced, and remains essentially constant during cruise. Note that the panel temperature decreases slightly near the inlet when cruise is initiated. This is due to the combination of constant inlet temperature of 50F and the decrease in both heating and flow rate at the start of cruise. On the upper surface the temperatures are much lower during cruise because of the significant reduction in heating due to flow expansion resulting from the increased angle of attack. During the ascent and decent portions of flight, the maximum upper surface temperature is higher than during cruise, opposite to the trend for the lower surface. This is due primarily to the angle-of-attack history which increases upper sur- face heating during ascent and decent, and to the attenuating effect of the heat shields on the heat load to the lower surface of the wing.
The pressure drop through each of the five panels is presented in Figure 45. The influence of the.flow rate changes is quite evident but the influences of shielding and timewise variations of heating intensity are less apparent. In comparing the fuselage panel data, it appears that shielding reduces the timewise variation of pressure drop through a cooled panel. An apparently opposite trend is noted for the wing. However, the shielding effect is overpowered by the variations in the relative magnitude of heating intensities on the upper and lower surfaces as angle-of-attack is changed, During cruise, the heat load to the upper surface is reduced quite substantially as compared to the ascent conditions. Since the flow rate was assumed to be modulated in response to the total vehicle heat load, the upper surface heat load decreased by a greater percentage than the flow rate. This decreased the coolant temperature which increased the coolant viscosity and the relative pressure drop. A relatively good match of panel pressure drop data with the desired levels is obtained at the time of maximum heating. This would be expected because the panel cooling circuits were sized for maneuver conditons executed during this portion of the flight regime. The panel at Station 2 10 which is closest to the pump, was allowed the largest pressure drop, 70 psi, and the calculated value is the highest, 69 psi. The panel at Station 110 is somewhat farther from the pump, hence, the allowed pressure drop is less, 60 psi, which agrees with the calculated value of 62 psi. Station 30 was allowed the smallest pressure drop, 40 psi, while the predicted value was 47 psi. The calculated pressure drops for the wing panels at the time of maximum heating was somewhat higher than the allowable values, suggesting that refinement of the coolant circuits for these panels is required. The relative 'magnitudes of the pressure drops during cruise also suggest the need for refinement of the panel coolant circuits and the probable need for somewhat more sophistication in the coolant flow con- trol for the wing to decrease the flow rate to the upper surface during cruise. Although such refine- ments were beyond the scope of the present project, the influence of the panel designs on system performance was examined by means of a system transient analysis which is discussed in a later see-
' tion.
The influe,nce of maneuvers on panel temperatures was investigated also. Steady-state analyses were performed on three.panels, fuselage Station 30 which was completely shielded, fuselage Station '
110 which was shielded only along the bottom, and the unshielded upper wing panel. The results are presented as envelopes of temperatures which would be reached if pushover or banked turn maneuvers were initiated at any time during climb and cruise. Temperatures for Station 30, shown in Figure 46, are
98

1111 -
about 200F as expected except at the bottom where the maximum airframe temperature is higher for the nominal flight path than for the maneuvers. For the pushovers, the heating on the upper surface is increased and the coolant temperature rises rapidly in the upper portion of the panel. This effect influences temperatures along the side, but is damped along the lower surface where the decrease in heating intensity reduces the temperature gradient between passages and the film temperature drop. When banked turns are executed, the low heating intensity over the upper surface, due to the expanded flow, raises the coolant temperature only slightly. Coolant and airframe temperatures increase along the side and bottom but the lower surface heating is attenuated by the heat shielding. This efficiency of attenuation increases more rapidly for an increase in heating intensity than for a decrease. That is, for an angle-of-attack change from that corresponding to the nominal flight path, the decrease in heating on the leeward side is greater than the increase in heating on the windward side. Therefore, when maneuvers are executed the total heat load on the panel actually decreases as compared to the nominal flight path. This accounts for the lower airframe temperatures on the lower surface during maneuvers than during nominal flight.
The analytical results for the partially shielded panel, Station 110, Figure 47, provides a further indication of the attenuating effect of heat shielding. Here, the coolant temperature in- creases more rapidly as a function of distance along the coolant flow path when push-overs are ex- ecuted than for a banked turn, but at the bottom of the panel the structural temperatures are with- in about 15F for all of the flight conditions considered. In contrast, the structural temperatures on the unshielded upper wing panel, Figure 48, responded to the changes in heating intensities caused by the vehicle attitudes required for push-overs, nominal flight and banked turns. Since positive angles-of-attack are associated with the nominal flight and the banked turns, the temperatures are quite similar for both with those for nominal flight being higher because of the lower angle of attack. Temperatures increase sharply for the negative angles of attack associated with the push- overs.
Maximum structural temperatures are lower than the 250F allowable except for the upper surface of the wing when push-overs are performed after 1500 seconds. Temperatures are highest when push-overs occur during cruise. The sharp rise in temperature at about 2000 seconds is due to the coolant flow rate reduction at this time. Comparison of the temperature levels of each section reveals that the inlet section temperatures are higher than the center section, but both operate at lesser temperatures than the outlet section. The higher temperature in the inlet section is due to the coolant flow being laminar in that section and turbulent in the center section causing a higher film drop in the former. Higher temperatures at the outlet section are a consequence of the higher coolant temperature.
During cruise, a maximum panel temperature of 300F is reached. Temperatures are above 250F between the coolant passages along the entire length of the panel. However, a push-over maneuver will be held for only a few seconds so that the temperature of 300F should have little effect on the structural properties of the aluminum alloy airframe even if one or two push-overs are performed during every flight. During more refined design studies, the maximum panel tempera- tures could be reduced by employing a somewhat smaller passage spacing. Since the maximum coolant temperature is 200F decreasing the passage spacing by about 30 percent would reduce maximum panel temperatures to about 250F.
99

Passenger Compartment, 11.4 feet from Inlet 300
250
200 u-. e
150 L
E g loo
50
0 0 2000
Time, sec
- - - Nominal Flight Path
Side, 30.4 feet from Inlet
0 1000 2000
Time, sec
"
Bottom, Outlet
0 1000 2000
Time, sec
Figure 47. Temperature Envelope for Fuselage Panel at Station 1 10, Maneuver Conditions
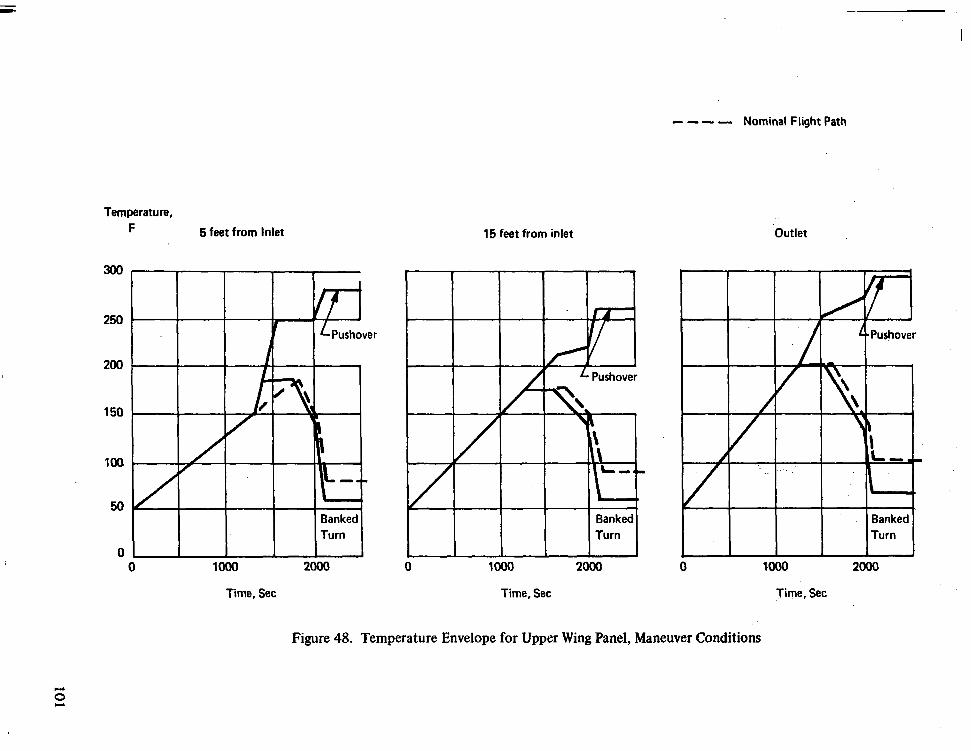
Temperature, F 5 feet from Inlet
- - - - Nominal Flight Path
15 feet from inlet Outlet
300
250
200
150
100
50
0 0 loo0 2000
Time, Sec
0 1000 2000
Time, Sec Time, Sec
Figure 48. Temperature Envelope for Upper Wing Panel, Maneuver Conditions

The envelopes of maximum panel temperatures due to maneuver conditions, Figures 46,47 and 48, indicate the values which would be reached between coolant passages at various locations along the coolant flow direction if a maneuver was initiated from the nominal flight condition at any particular time. In essence, the envelopes define the loci of temperature maximums that result from an infinite number of transient flight conditions characterized as pushovers, pull-ups, and banked turns. As noted earlier, these boundaries were generated by conducting numerous steadystate solutions where the max- imum heating conditions corresponding t o a particular maneuver at a specific time were impressed on the panels of interest. The suitability of this technique warrants a brief discussion. The advantage of steady-state solutions is the short computational times as compared to transient analyses. However, before advantage was taken of this time saving,transient analyses were conducted to verify the suit- ability of steady-state results. Two of the five representative skin panels were checked, both near the inlet end where transition from laminar to turbulent flow might occur within the coolant passages. The panel, at fuselage Station 30, was chosen as representative of shielded regions, while the upper wing panel was chosen as representative of unshielded regions. The results of the transient solutions for the pushover maneuver at 2127 seconds after takeoff, start of cruise, are shown in Figure 49. For the shielded panel, Station 30, the maximum transient and steady-state temperatures agreed within IF; however, the maximum transient temperature for the upper wing panel was 42F lower than the steady- state value. This difference was because of the manner in which flow transition is treated in the two computer codes. In the steady-state program, laminar flow is assumed to exist until turbulent flow is fully established. The transient program accounts for the increase in heat transfer coefficient between the onset of transition and fully developed turbulent flow. Therefore, in regions where flow transition exists the steady-state program will overpredict the skin temperature. Since the transient solutions yielded panel temperatures which were equal to or lower than those computed by the steady-state program, the savings in computational time justified the use of the latter.
102
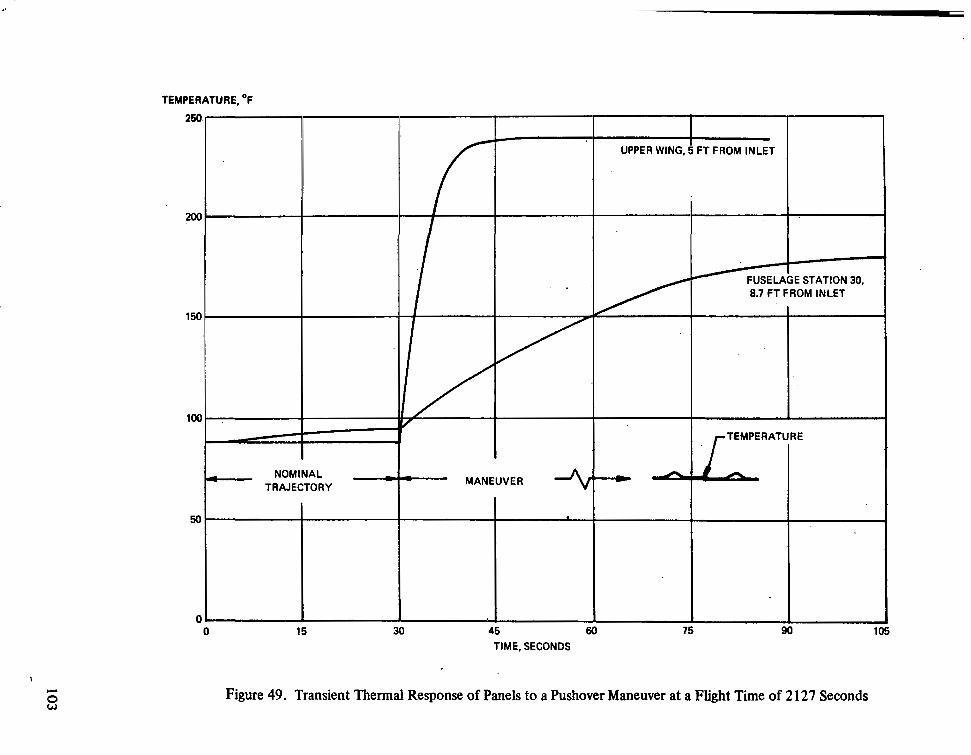
TEMPERATURE, O F
25
m
15
a-
0 -
0 -
r
t- NOMINAL TRAJECTORY
-r I UPPER WING, 5 FT FROM INLET
1)
/ I
0 15 30 45 TIME, SECONDS
75 w
Figure 49. Transient Thermal Response of Panels to a Pushover Maneuver at a Flight Time of 2 127 Seconds

SYSTEM INTEGRATION
In the previous sections the various elements which contribute to the weight of the airframe cooling system were examined. Three distribution system concepts were examined and detailed analyses were conducted on the more promising approaches. Several selected panels were designed and analyzed. Pump and heat exchanger weights were also determined. In this section, these in- dividual items are integrated into a total system. The overall system design is quite simple, and lighter than the weight estimated during the previous tasks.
Cooling System Summary
It was necessary to layout the complete coolant distribution system with connectors, pumps, heat exchanger and piping in order to demonstrate the feasibility and simplicity of an active cool- ing system. Figure 23 presented detailed layout of the cooling system designed for the Mach 6 hypersonic- transport.
The distribution system consisted of thin-wall aluminum alloy pipes whose thicknesses were conservatively based on a design pressure of 500 psi. A total system pressure drop of 150 psi was selected as a reasonable compromise between minimum system weight and panel design require- ments. The expansion tank is pressurized to 30 psia to counteract the liquid head in the vertical tail distribution lines. Thus, the maximum system pressure would be 180 psia under ambient con- ditions and would increase to about 200 psia under operating conditions when the temperature in the system return lines increases to 200F. The line diameters vary from 7.87 inch in the pump and heat exchanger area to less than 1 inch in the wing areas. Because of the long length of lines bellows are incorporated to accommodate differential thermal expansion. The main distribution lines may ~
be installed in sections and joined with Marman-type clamps and seals, or by adhesive bonding, soldering or welding.
A suggested method for attaching these lines to the vehicle is shown in Figure 50. Two types of supports are depicted; one is a fixed support and the other is a roller-type support. Both are easily integrated with the structural frames. The frame is slotted in order to allow the pipe to be readily installed. The pipe is set in place and the support is then bolted to the frame. In the case of the fixed support, adhesive bonding to the distribution line would eliminate welded joints. Since axial loads will be modest a room temperature curing adhesive could be applied at the time of in- stallation. At each of the fixed-type supports it will be necessary to install a bellows in the line in order to take up any thermal expansion or contraction of the line with respect to the airframe. The bellows are shown attached to the distributor lines with Marman-type clamps. The inside of these bellows contain a concentric pipe section so that the pressure drop through the bellows is minimized. It is expected that 6 rigid-type supports will be required for the fuselage of the vehicle. The roller type of support consists of three rollers and allows for axial movement of the pipe with respect to the aluminum structure. The two upper rollers are fastened to the support in such a way that some movement is permitted in the radial direction. This allows for radial growth and prevents binding of the distribution line at the support.
Figure 5 1 clarifies the pipe routing in the heat exchanger and pump area of the vehicle. The pumps, expansion tank and heat exchanger are kept close to the wing beam to minimize weights of supports and of the large-diameter interconnecting lines. This also allows installation and checkout of this portion of the system before the wing is mated with the fuselage.
104

f Marman Clamp
Adhesive A Bel lows1
Fixed Support
Roller Support
Figure 50. Distribution System Line. Supports
105


The sizes for the water-glycol distribution lines in the pump and heat exchanger area are 7.87 inches in diameter reducing to 6.7 inches at the fuselage supply tee downstream of the pump. The pumps are the centrifugal type designed to supply the full flow rate to the vehicle and have an outer diameter of I3 inches and a depth of 6 inches. The valves to the inlet of the pump are solenoid-controlled gate valves whereas the valves at the outlet are check valves whose purpose is to allow flow in only one direction. By automatic operation of the inlet valves, the required flow rate schedule can be achieved. This figure also shows the counter-flow plate and fin heat exchanger. This heat exchanger consists of aluminum parting sheets brazed to offset fin core. This fm con- figuration increases the heat-transfer effectiveness and .insures proper flow distiibution in the heat exchanger. The large lines leading from the ends of the heat exchanger and bypassing the heat exchanger are the hydrogen fuel lines. Two pneumatically operated valves are instal1ed.h these lines to control the fraction of flow through the heat exchanger and the bypass line. If the water- glycol inlet temperature differs from 200F, a signal based on a predetermined valve-setting curve will be sent to the control valves, and the valve positions will be adjusted to supply adequate fuel flow to maintain the water-glycol inlet temperature to the heat exchanger at 200F.
Figure 52 is a typical installation of the panel connections. For the particular location shown the branch from the main distribution line is 1.5 inches in diameter and the lines to the panel are 1 .O inch in diameter. The connectors are designed to : 1) allow for any misalignment due to manufactur- ing tolerances, 2) permit axial movement of the main distribution line with respect t o the panels, 3) minimize weight, 4) provide high reliability and 5) minimize space requirements. Flexible teflon hose with aluminum braid and fittings is employed to connect between the machined tee-fitting and the machined panel connector. Since this line is flexible, movement in any direction is permitted. Threaded-type flare connectors are employed in order to insure easy maintenance and high reliability. Such installations are used in the hydraulic systems of present-day aircraft which operate at pres- sures of 3000 psi compared to the 150-psi to 35O-psi range expected for the cooling system. The Con- nector to the panel has a threaded insert which bears on a split washer and is sealed by a double O-ring. This type of connector was used successfully on the Bell Double Wall demonstration hardware, Reference 22.
The panel to which this connector is attached is shown in Figure 53 and is schematically illustrated to have three passage spacings to account for the variations in heat loads and temperature limits of the different areas of the vehicle. The passenger compartment is located on the upper region of the fuselage;hence,the passages are closer together in order to maintain a maximum tem- perature of less than 150F. At the center section, the passages spacing is doubled to 1.20 inches since the maximum temperature can be increased to 250F. While the maximum temperature is still 250F on the lower surface, the heating rate is much less due to the heat shields;thus,the passage spacing can be increased to 2.4 inches. The equivalent diameters of the passages were sized on the basis of a uniform pressure drop and were 0.1 15,0.145, and 0.183 inch for the upper, center and lower surfaces respectively. These passages are on the inner surface of the panel;hence,the outer sur- face of the vehicle is smooth. This eliminates any hot spots which may occur due to the roughness and reduces skin drag.
During prior studies of cooled airframe concepts for hypersonic transports, References 1 and 2, the weight of the cooling system components were evaluated with weight factors developed dur- ing several previous studies performed by Bell Aerospace Company, References 28,29 and 30. The distribution system weight was estimated on the basis of 0.15 psf which included piping, and residual coolant weight in both the lines and the panels.
107

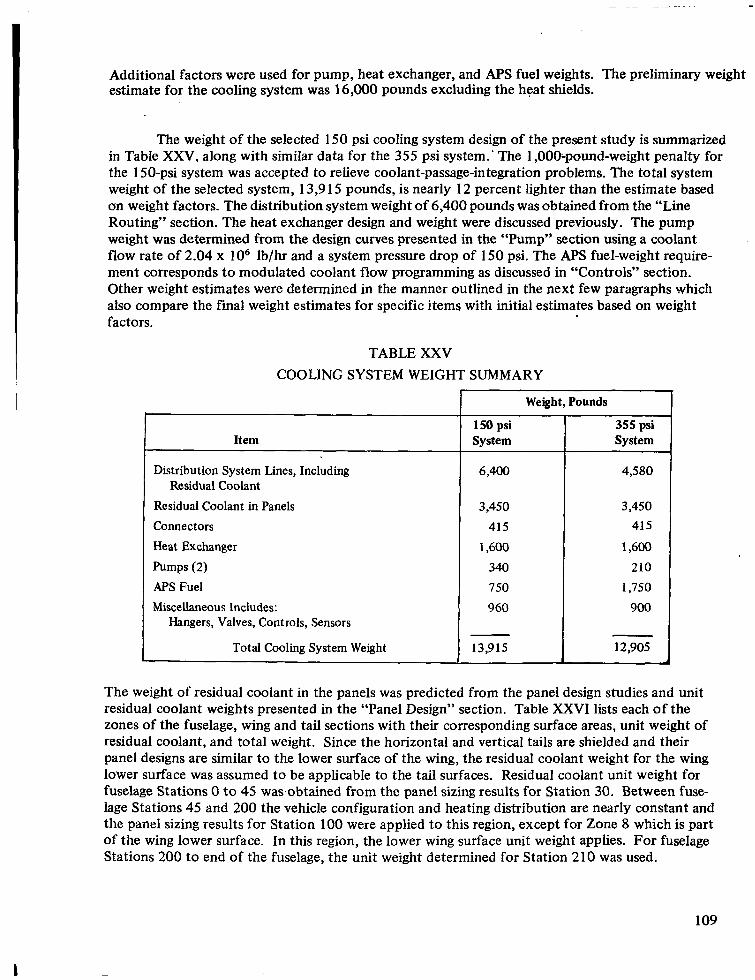
Additional factors were used for pump, heat exchanger, and APS fuel weights. The preliminary weight estimate for the cooling system was 16,000 pounds excluding the heat shields.
The weight of the selected 150 psi cooling system design of the present study is summarized in Table XXV, along with similar data for the 355 psi system.’ The 1,000-pound-weight penalty for the 150-psi system was accepted to relieve coolant-passage-integration problems. The total system weight of the selected system, 13,9 15 pounds, is nearly I2 percent lighter than the estimate based on weight factors. The distribution system weight of 6,400 pounds was obtained from the “Line Routing” section. The heat exchanger design and weight were discussed previously. The pump weight was determined from the design curves presented in the “Pump” section using a coolant flow rate of 2.04 x lo6 lb/hr and a system pressure drop of 150 psi. The APS fuel-weight require- ment corresponds to modulated coolant flow programming as discussed in “Controls” section. Other weight estimates were determined in the manner outlined in the next few paragraphs which also compare the final weight estimates for specific items with initial estimates based on weight factors.
TABLE XXV COOLING SYSTEM WEIGHT SUMMARY
r Weight, Pounds 1 t
Item
Distribution System Lines, Including
Residual Coolant in Panels Connectors Heat Exchanger
Residual Coolant
Pumps (2) APS Fuel Miscellaneous Includes:
1 Hangers, Valves, Controls, Sensors
Total Cooling System Weight 1
1 50 psi System
6,400
3,450 415
1,600
340 750 960
13,915
System
4,580
3,450 41 5
1,600
210 1,750
900 I 12,905 I
The weight of residual coolant in the panels was predicted from the panel design studies and unit residual coolant weights presented in the “Panel Design” section. Table XXVI lists each of the zones of the fuselage, wing and tail sections with their corresponding surface areas, unit weight of residual coolant, and total weight. Since the horizontal and vertical tails are shielded and their panel designs are similar to the lower surface of the wing, the residual coolant weight for the wing loirver surface was assumed to be applicable to the tail surfaces. Residual coolant unit weight for fuselage Stations 0 to 45 was.obtained from the panel sizing results for Station 30. Between fuse- lage Stations 45 and 200 the vehicle configuration and heating distribution are nearly constant and the panel sizing results for Station 100 were applied to this region, except for Zone 8 which is part of the wing lower surface. In this region, the lower wing surface unit weight applies. For fuselage Stations 200 to end of the fuselage, the unit weight determined for Station 210 was used.
109
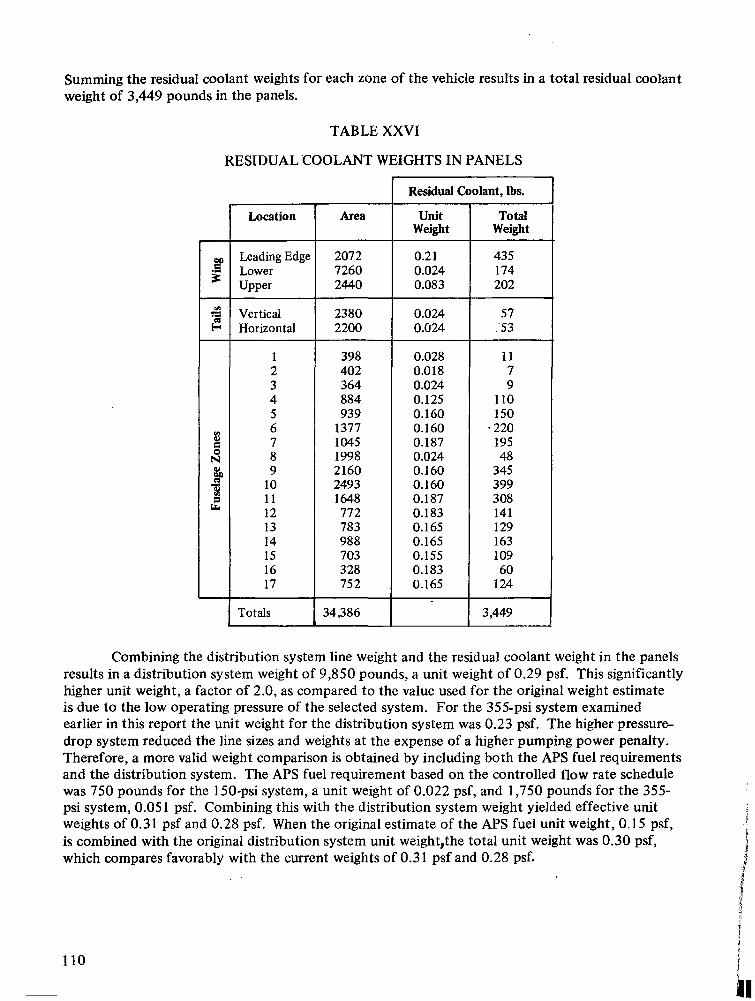
Summing the residual coolant weights for each zone of the vehicle results in a total residual coolant weight of 3,449 pounds in the panels.
TABLE XXVI
RESIDUAL COOLANT WEIGHTS IN PANELS
1 Location
Vertical Horizontal
1 2 3 4 5 6 7
9 10
a 11 12 13 14 15 16 17
4
P Q 8
La
I Totals
Area
2072 7260 2440
2380 2200
398 402 364 884 939
1377 1045 1998 2160 2493 1648 772 783 988 703 328 75 2
34,386
Residual Coolant, Ibs.
Unit Weight
0.2 1 0.024 0.083
0.024 0.024
0.028 0.018 0.024 0.125 0.160 0.160 0.187 0.024 0.160 0.160 0.187 0.183 0.165 0.165 0.155 0.183 0.165
~~~
Total Weight
435 174 202
57 '53
11 7 9
110 150
* 220 195 48
345 399 308 141 129 163 109 60
124
-
Combining the distribution system line weight and the residual coolant weight in the panels results in a distribution system weight of 9,850 pounds, a unit weight of 0.29 psf. This significantly higher unit weight, a factor of 2.0, as compared to the value used for the original weight estimate is due to the low operating pressure of the selected system. For the 355-psi system examined earlier in this report the unit weight for the distribution system was 0.23 psf. The higher pressure drop system reduced the line sizes and weights at the expense of a higher pumping power penalty. Therefore, a more valid weight comparison is obtained by including both the APS fuel requirements and the distribution system. The APS fuel requirement based on the controlled flow rate schedule was 750 pounds for the 150-psi system, a unit weight of 0.022 psf, and 1,750 pounds for the 355- psi system, 0.05 1 psf. Combining this with the distribution system weight yielded effective unit weights of 0.31 psf and 0.28 psf. When the original estimate of the APS fuel unit weight, 0.15 psf, is combined with the original distribution system unit weight,the total unit weight was 0.30 psf, which compares favorably with the current weights of 0.3 1 psf and 0.28 psf.
110
-
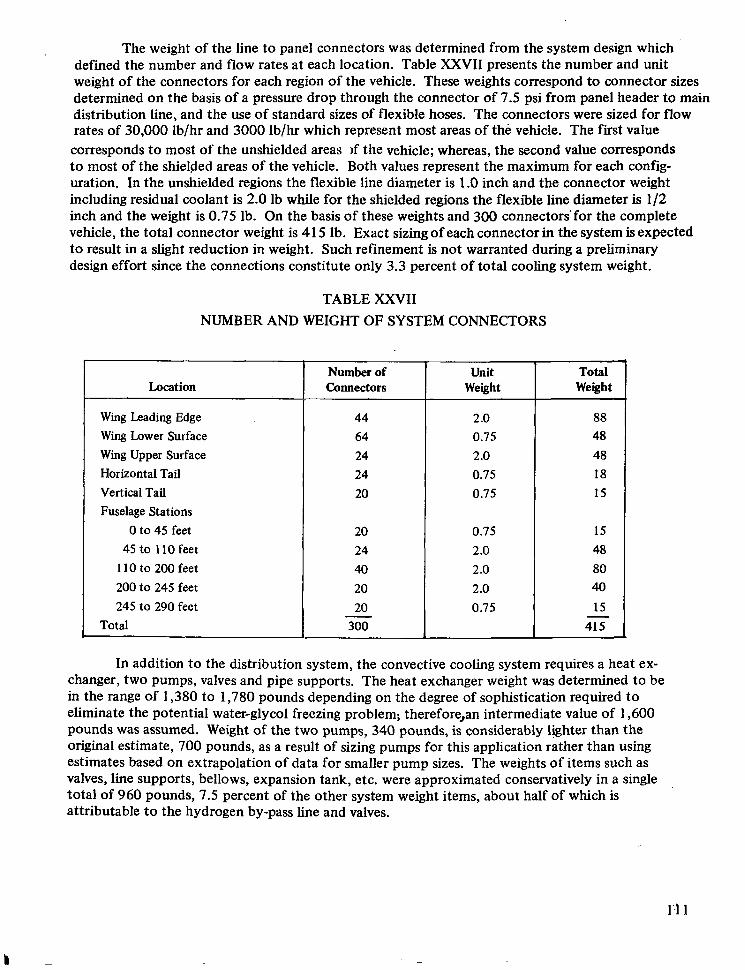
The weight of the line to panel connectors was determined from the system design which defined the number and flow rates at each location. Table XXVII presents the number and unit weight of the connectors for each region of the vehicle. These weights correspond to connector sizes determined on the basis of a pressure drop through the connector of 7.5 psi from panel header to main distribution line, and the use of standard sizes of flexible hoses. The connectors were sized for flow rates of 30,000 lb/hr and 3000 lb/hr which represent most areas of the vehicle. The first value corresponds to most of the unshielded areas If the vehicle; whereas, the second value corresponds to most of the shielded areas of the vehicle. Both values represent the maximum for each config- uration. In the unshielded regions the flexible line diameter is 1 .O inch and the connector weight including residual coolant is 2.0 lb while for the shielded regions the flexible line diameter is 1/2 inch and the weight is 0.75 lb. On the basis of these weights and 300 connectors'for the complete vehicle, the total connector weight is 41 5 lb. Exact sizing of each connector in the system is expected to result in a slight reduction in weight. Such refinement is not warranted during a preliminary design effort since the connections constitute only 3.3 percent of total cooling system weight.
TABLE XXVII NUMBER AND WEIGHT OF SYSTEM CONNECTORS
Location
Wing Leading Edge Wing Lower Surface Wing Upper Surface Horizontal Tail Vertical Tail Fuselage Stations
0 to 45 feet 45 to 110 feet
1 10 to 200 feet 200 to 245 feet 245 to 290 feet
Total
Number of Connectors
44 64
24 24
20
20 24 40 20
20 300 -
Unit Weight
2 .o 0.75 2 .o 0.75 0.75
0.75 2 .o 2 .o 2 .o 0.75
Total Weight
88 48
48 18 15
15 48
80 40
15
41 5 -
In addition to the distribution system, the convective cooling system requires a heat ex- changer, two pumps, valves and pipe supports. The heat exchanger weight was determined to be in the range of 1,380 to 1,780 pounds depending on the degree of sophistication required to eliminate the potential water-glycol freezing problem; therefore,an intermediate value of 1,600 pounds was assumed. Weight of the two pumps, 340 pounds, is considerably lighter than the original estimate, 700 pounds, as a result of sizing pumps for this application rather than using estimates based on extrapolation of data for smaller pump sizes. The weights of items such as valves, line supports, bellows, expansion tank, etc. were approximated conservatively in a single total of 960 pounds, 7.5 percent of the other system weight items, about half of which is attributable to the hydrogen by-pass line and valves.
13 1

Structural Interfaces
Integration of the airframe cooling system with the airframe structure requires consideration of the distribution line and cooled panel installations. The distribution lines are most likely to be in- stalled parallel to or perpendicular to the frames, ribs and spars. The spacing of these members de- pends upon the particular design of the airframe structure. (References l and 2 indicate frame and rib spacings of between 20 and 40 inches while spar spacings may be as great as 400 inches.) In most instances the diameters of the distribution lines are smaller than the depths of the major structural members. Therefore, no difficulty is anticipated in passing the distribution 1ines.through these mem- bers. The method of attachment must consider differential thermal expansion, support of the line weight, and control of the natural frequency of the lines. Figure 50 illustrates techniques for dealing with expansion differences. Spacing of the structural supports at distances of about 75 times the square root of the line diameter will limit bending stresses in the lines to less than 10,000 psi under 2 g limit load conditions. However, closer spacings of the supports will probably be dictated by natural frequency considerations. The actual spacings required for the line supports will depend upon the frequencies of the forcing functions and of the structure so that resonances are avoided. For the fixed items of structure no particular difficulty is anticipated due to interfaces between the structure and the distribution lines. Careful detailed design will be required to estend the distribution lines into areas of movable portions of the structure, such as control surfaces, landing gear doors, etc. Flexible lines or bellows connections provide candidate approaches for accommodating the necessary displace- ments.
Integration of the cooled structural skin panels with the substructure is somewhat more a m - plex than is the installation of the distribution lines. While a variety of coolant passage configurations can be employed, those which protrude from only one side of the structural skin are favored. If the flat side of the skin panel is placed against the structure the interface is almost as simple as that as- sociated with conventional construction. The only additional care required during design and assem- bly is avoiding the placement of holes for fasteners at coolant passages. As for the coolant passage spacings appropriate for the hypersonic transport considered (0.6 to 2.4 inches), no particular dif- ficulties are anticipated in this regard. Unfortunately, if the smooth surface of the cooled skin panel is placed against the substructure the coolant passage protrusions are on the external surface. While this poses no problem in areas where heat shields cover the external surface of the load carrying structure, the protrusions are undesirable where the load carrying structure is exposed to the bound- ary layer. Drag is increased and local hot spots might result. A smooth external surface can be achieved by placing the coolant passages toward the substructure and by using filler strips or shear clips between the skin and the stiffening elements of the substructure as required'to provide clear- ance for the coolant passages. Local joggling of the stringers can also be considered. When coolant passages are parallel to the direction of the load use of stand-offs is minimized since clearance is re- quired only near the headers; the stringers can be attached directly to the structural skin between the coolant passages.
'Obviously, some weight penalty will result from the design details associated with installation of the cooled skin panels with the airframe substructure. For the particular hypersonic transport con- sidered during this project, heat shields are applied to 33% of the external surface, and an additional 20% of the structure is designed by minimum gage considerations where joggled stiffeners would not impose a wtight penalty. Therefore, the weight penalties resulting from filler strips and/or shear clips would be applied to less than 50% of the wetted area of the vehicle. No attempt was made to estimate this penalty because it is intimately associated with the details of the structural design. How- ever, it should be noted that the structural weight estimates for the cooled airframe, as discussed
112

in References 1 and 2, employed conservative assumptions which should more than offset the weight penalties associated with installing structural panels with integral coolant passages onto the airframe substructure.
Reliability and Redundancy Considerations
The design of the cooling system described previously incorporated features which enhance its reliability. Prior studies indicated that the highest failure rates were associated with the coolant pumps and with connections, particularly between the distribution lines and the cooled panels. Therefore, dual pumps were provided and large cooled structural panels were used to minimize the number of connections. Because of the critical dependence of the aircraft and passenger safety on the reliable operation of the cooling system, consideration of a completely redundant cooling system may be desirable. However, before such a necessity is assumed, detailed reliability studies should be conducted, based on experimental data generated for representative cooling system elements. (Such an assessment was beyond the scope of this project.) It is significant to note that while aircraft hy- draulic systems are always duplicated in transport aircraft many other mechanical systems are rarely duplicated in total, for example, fuel systems and environmental control systems.
The ultimate objective is to achieve a cooling system of high reliability. Redundancy offers one approach to achieving this objective. However, the reliability question should be considered in the light of the total system, so that the proper degree of redundancy'can be obtained, i.e.. reliabil- ity objectives are met without undue weight penalties. Of paramount importance is the circulation of the transport coolant through the structural panels so that aerodynamic heat input can be absorbed and transferred to the heat exchanger for rejection to the vehicle fuel. A properly designed system will not be adversely affected by temperature levels or gravitational forces associated with the ex- pected flight envelope. Since proper coolant flow will be established prior to delivery of the aircraft the user must be concerned with the physical phenomena which could distrub the coolant flow dis- tribution, cause the flow to stop, or cause the coolant to drain from the distribution system. Ad-
. verse coolant flow could result from plugging of coolant passages, or excessive deformation of cool- ant passages or distribution lines. Cessation of coolant flow may be caused by pump failure or valve closing. Draining of the coolant from the structural panels and the distribution system could result from leakage at any point in the system and may be caused by rupture of the distribution lines or of the structural panels, failure at metallurgical joints in the system including the heat exchanger, or loosening of mechanical connections.
Once the possible causes of malfunctions are identified potential solutions can be suggested. The possibility of coolant passage plugging can be minimized by using filters in the lines, and by en- suring compatability between the coolant and the cooled skin panel so that corrosion products are not formed. Experimental studies of the coolant flow characteristics within loaded shear and com- pression panels, Reference 22, indicate no significant changes up to loads which induce buckling, but a significant change after buckling has occurred. Since buckling generally is not permitted below design limit load no problems are anticipated in this regard. With dual pumps incorporated in the system there is little likelihood of simultaneous failure and subsequently stopping coolant flow. With respect to control valves, designs are available which fail only in the full open position. As discussed in other sections of this report the stresses induced in the distribution lines, by internal pressurization (1 50 psi system) or bending, are less than 10,000 psi so that rupture of these lines should not occur. On production hardware, failure at metallurgical joints are minimized by good joining practices, quality control procedures and inspection, and proof pressure testing of designs which have been experimentally verified by realistic qualification tests. The possibility of leakage at the mechanical connections between
113

the distribution lines and the cooled panels is minimized by the low system pressure, 150 psi, and the relatively few number of such joints (300 installed on the panels and 300 between the main distribution line and the flexible hoses which attach to the panels). Reference 22 provides test results for five different panel connector designs which successfully passed hydrostatic pressurization to 300 psig, 2450 pressure cycles from 0 to 50 psig, and 1.5 hours of vibration exposure from 20 to 2000 cps at up to 7.5 g without leakage. While the cyclic conditions were relatively short in terms of hypersonic transport life they verified the connector designs for the intended application and indicated approaches which might meet longer life requirements.
114

Cooling System Performance
As a result of various sections of the cooling system operating at different temprrature levels, the coolant flow control may be complicated due to the variation of the water-glycol viscosity. Difficulties due to temperature effects on the viscosity of water-glycol were encountered In the heat rejection system of the Apollo Service Module. Reference 31. This radiator system included two panels each of 38 ft2 and containing 6 parallel flow paths, 33 in. x 166 in. panels with flow in the long direction. When the temperature in one flow path became somewhat lower than that in other paths the flow in the cooler path would essentially stagnate and the flow in the other paths would increase. This effect was noticed even at temperature levels of 32F in one location and 70F in another. At lower temperatures the problem was worse. Naturally, this upset the intended func- tioning of the system. Considerable work on system design with respect to coolant passages and control valves resulted in a satisfactory solution for the complex space environments and hardware orientations of interest.
Prior Bell experience with airframe structures cooled by water-glycol did not indicate any significant flow control problems. This prior work included experimental evaluations of a struc- ture with 168 ft2 of cooling surface area arranged in 4 parallel flow circuits. While the circuits varied somewhat in size the largest contained 72 parallel flow passages between inlet and outlet headers, Reference 22. The reason for the differences in system behaviors may lie in the temperature levels associated with the two applications. For Apollo, minimum system temperatures were below 32F while for the Bell-tested structures the minimum temperature was never below 70F. Hence, one approach to minimizing adverse viscosity effects may be to avoid low coolant temperatures in those portions of the system which contain parallel flow paths. Another approach is io use another coolant whose viscosity is less temperature dependent.
To determine whether flow control problems should be expected for the cooling system of a hypersonic transport, a transient thermal and fluid analysis of the system, was performed. A conventional electrical-analogy technique was employed which converted the heat transfer/fluid flow system into an assembly of resistors and capacitors. The thermal system was divided into several discrete elements connected by a heat flow path which was represented by electrical re- sistors. The thermal capacity of each element is analogous to the electrical capacitor. In the anology, the current flow is analogous to heat flow and voltage is anologous to temperature dif- ference.
The real advantage of the electrical analogy is that the partial differential equations can be expressed in simple finite-difference form. Solution of the finitedifference equations can be per- formed very rapidly with a digital computer. The accuracy of this anology is limited only by the accuracy of the assumptions used to establish the network and the boundary conditions. Temperature- dependent material properties, variable heat transfer coefficients and variable boundary conditions can be handled.
The transient analysis of the airframe cooling system was performed by using a lumped parameter / finite-difference computer program. Even though the heat transfer equations are standard, the flow analysis equations depend on the fluid network and must be developed for each system to be analyzed. Inputs to this program consisted of the heating rate to each Panel as a function of time, the length and diameter of each line in the system, the pump head as a function of time, the fluid properties as functions of temperature and the initial temperature of each element in the system. On the basis of these inputs, the program outputs included the
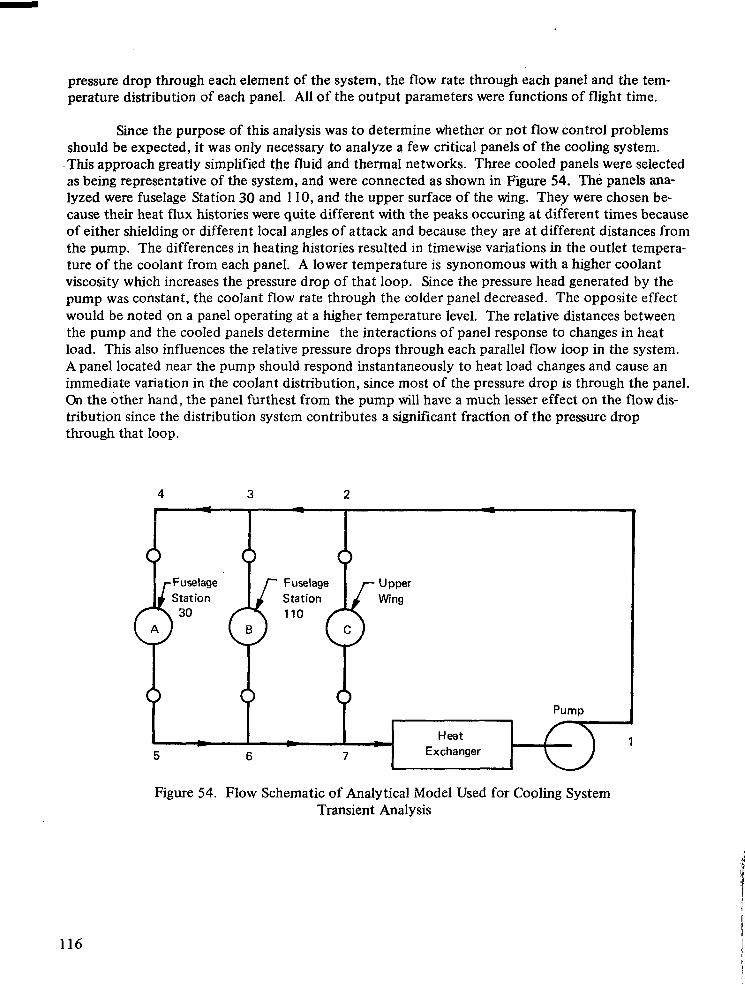
pressure drop through each element of the system, the flow rate through each panel and the tem- perature distribution of each panel. All of the output parameters were functions of flight time.
Since the purpose of this analysis was to determine whether or not flow control problems should be expected, it was only necessary to analyze a few critical panels of the cooling system.
.This approach greatly simplified the fluid and thermal networks. Three cooled panels were selected as being representative of the system, and were connected as shown in Figure 54. The panels ana- lyzed were fuselage Station 30 and l 10, and the upper surface of the wing. They were chosen be- cause their heat flux histories were quite different with the peaks occuring at different times because of either shielding or different local angles of attack and because they are a t different distances from the pump. The differences in heating histories resulted in timewise variations in the outlet tempera- ture of the coolant from each panel. A lower temperature is synonomous with a higher coolant viscosity which increases the pressure drop of that loop. Since the pressure head generated by the pump was constant, the coolant flow rate through the colder panel decreased. The opposite effect would be noted on a panel operating at a higher temperature level. The relative distances between the pump and the cooled panels determine the interactions of panel response to changes in heat load. This also influences the relative pressure drops through each parallel flow loop in the system. A panel located near the pump should respond instantaneously to heat load changes and cause an immediate variation in the coolant distribution, since most of the pressure drop is through the panel. On the other hand, the panel furthest from the pump will have a much lesser effect on the flow dis- tribution since the distribution system contributes a significant fraction of the pressure drop through that loop.
4 3 2
I - I - I - Heat - - 1
5 6 7 Exchanger
Figure 54. Flow Schematic of Analytical Model Used for Cooling System Transient Analysis
116
The cold wall heating rate histones used for the analysis are presented in Figure 55. These values differ from the heating data provided in other sections of this report because these are cold wall values rather than net inputs. A constant water-glycol inlet temperature of 50F was used for the analysis. This is somewhat optimistic in the low-speed regime where heat is lost from the vehl- cle surface. However. the time during which this heat loss occurs is very short for the nominal 70F day considered; within four minutes after take-off, the vehicle velocity reaches Mach 1 at 28,000 feet and the recovery temperature is above 50F. During loiter coolant temperatures will drop be- low 50F and flow distribution may be adversely influenced, but heat loads are negligible and cool- ing of the airframe is no longer necessary. Operations on cold days may introduce flow distribution problems during ascent but such conditions were not checked. Figure 56 presents the coolant flow rate history through each loop. Only slight variations are noted, suggesting that flow control should pose no serious problems during normal operation. The effect of varying the available heat during the trajectory to conserve APS fuel is evident by the step changes in flow rate to each panel. The temperature histories of various points on the panels are shown in Figure 57; the locations are be- tween passages as shown in the figure. These results confirm that no problems should occur when water-glycol is used as the coolant for a hypersonic transport, at least on normal temperature or hot days.
During flight at low speeds on a cold day it will be difficult to avoid low coolant tempera- tures unless heat is added to the coolant. The heat load from the passengers and from the aircraft systems would provide a portion of the needed input but is significantly less than the total required because of the heat loss from the large surface area of the vehicle. Preheating the water-glycol cool- ant to 200F by means of a ground cart prior to take-off would also help. However. a heat source not chargeable to the cooling system is obviously required. The most logical candidate is the engine exhaust. It may be possible to utilize a water-glycol-to-exhaust-gas heat exchanger to maintain coolant temperature during segments of the flight regime where structural temperatures are low and to bypass the exhaust gas during the high-speed portion of flight. In this way, only the weight of the heat exchanger and that due to a slight increase in pressure drop would penalize the cooling sys- tem.
The use of an alternate coolant could result in a significant system weight increase. Pre- fluorinated coolants are the next most attractive and experience only modest viscosity changes with temperature as compared to water-glycol. However, their specific heats are only about half that of water-glycol thereby requiring about twice the coolant flow. Ratios of pumping power to heat trans- fer conductance are from about 2 to 16 times higher than for water-glycol depending on whether the flow is laminar or turbulent and on the temperature level. Since Some of the alternate coolants have lower viscosities than water-glycol, the losses through the distribution lines may not be much differ- ent. Only a detailed check of an alternate coolant would permit an accurate comparison.
The short times associated with relatively low-speed flight, about 900 seconds of ascent and about 3,000 m m d s of descent, suggest that the exhaust gas heat exchanger approach of supplying heat input to the cooling system is preferable to a change of coolant. Thls IS particularly true since the major portion of time spent at low speed is during descent when the coolant flow distribution is no longer important and only enough heat must be supplied to the coolant to avoid freezing with its undesirable volume change.
117

3000
2000
1000
- 0
~~~~ .
. 10 20 30 40 50 60 7 0
30'000 r-
10,000
0 0 10
Time, Hundreds of Seconds
FuLage Station I 110
- Passenger Compartment
50 60 20 30 40 Time, Hundreds of Seconds
70
30,000 I I Upper Surface of Wing
20,000 -
10,000 / 1
0 0 10 20 30 40 50 60 70
Time, Hundreds of Seconds
Figure 55. Cold Wall Heating Rate Histories for Typical Panels, Nominal Trajectory
118

0 10 20 30 40 50 60 70
Flight Time, Hundreds of Seconds
40,000
30,000
20,000
10,000
0 0 10 20 30 40 50 60 70
Time, Hundreds of Seconds
Figure 56. Flow Rate Histories for Typical Panels, Nominal Trajectory
119

300
200
LL
U !2 g 100
3 G
0 0 10 20 30 40 50 60 70
Time, Hundreds of Seconds
300
200 LL 2
& 100 € G
5 U cd &I
0
300
LL a- 200 &I
U s cd & a
E" G 100
0
Fuselage Station 110 Side, 30.4 feet from inlet
Passenger Compartment 11.4 feet from inlet
0 10 20 30 40 50 60 70 Time, Hundreds of Seconds
I Wing - Upper Surface
Outlet Section
Center Section, 15 feet from inlet
- Inlet Section, 5 feet from inlet
I I 1 1 0 10 20 30 40 50 60 70
- Time, Hundreds of Seconds

CONCLUSION AND RECOMMENDATION
During this study, an indirect convective cooling system was designed for a partially shielded airframe of a hypersonic transport. A 60% glycol, 40% water solution was circulated through pass- ages which were integral with the structural skins, absorbed incident aerodynamic heat input, and transferred this heat load to a heat exchanger where it was rejected to the hydrogen fuel.
The cooling system consisted of the piping required to distribute the coolant to the panels, structural panels with integral coolant passages, heat exchanger, pumps and controls. System weights included the pipe material, residual coolant, heat exchanger, pumps, APS fuel to drive the pumps, connectors and miscellaneous installation items. The results of this study were integrated with results of previous studies to indicate the potential advantage of active cooling in increasing payload. Based on the studies performed a number of conclusions were drawn and recommendations for future work were made. These conclusions and recommendations are limited to convective cooling systems as applied to hypersonic transports. Prior studies led to conclusions and recommendations of broader scope as reported in References 1 and 2.
The major conclusion of the study was that a convective cooling system is practical for hypersonic transport aircraft and should be lighter and less complex than first anticipated on the basis of studies reported in References 1 and 2. The largest coolant line diameter was less than 8.0 inches, and the unit weight of all cooling system elements, including APS fuel, was only 0.41 psf. The fact that the selected cooling system design was lighter than originally estimated adds confidence to the prior conclusion that a convectively cooled hypersonic transport airframe will provide substantial payload benefits over an uncooled airframe designed for operation in the Mach 6 flight regime. Further weight benefits may be expected from the cooled airframe through simplifi- cation of subsystem requirements. Since detailed studies of subsystems were not conducted, firm conclusions cannot be drawn in this regard. Additionally, a cooled airframe permits the use of aluminum alloy construction with its well established fabrication techniques. This should provide cost as well as weight advantages as compared to uncooled super alloy construction. The penalties for obtaining these cost and weight advantages are the mechanical complexity associated with the cooled system and the need to use a portion of the fuel heat capacity for airframe cooling. System design studies indicated less complexity than originally anticipated, because only 300 connectors are required for the 35,000 ft2 of cooled airframe. Slight tailoring of the descent flight path pro- ,vided adequate fuel flow for airframe cooling during all flight conditions, including maneuvers.
€n addition to the main conclusions of system feasibility and advantages with respect to weight and cost, a number of more specific conclusions are listed below for the convective cooling system :
1. The system was sized by heating conditions near the end of ascent which lasted about
2. Allowable system pressures are restricted to about 150 psi by present limitations
3. System weight is reduced as allowable pressure drop and panel size increase. 4. Coolant flow must be modulated if system weight is to be minimized. Even simple
900 seconds.
with respect to coolant passage integration techniques.
time-programmed step changes yield very significant weight savings in A P S fuel as compared to a constant, high flowrate.
121

5 .
6 . 7.
8.
Design of the water-glycol to hydrogen heat exchanger requires care to avoid freezing. Control of the hydrogen flow through the heat exchanger is necessary for conditions of low heat load. Sharp leading edges can be adequately cooled by the indirect convection system. The heat exchanger and pumps should be located together to minimize the weight of the large diameter, high flowrate lines. Lines of high flow rate should be sized for higher unit pressure drops than lines of low flow rate.
The results and conclusions of the study provide the basis for recommending specific future activities required to develop the cooled airframe structural concept:
1.
2.
3.
4. ' 5 .
6. 7.
8.
9.
10. 11.
12.
13.
Modification of the later stages of ascent to reduce peak heating. Cooling system weight reductions of up to 30% might be achieved. Development of improved techniques for integrating coolant passages with skin panels. System weight savings up to 10% may result from higher operating pressures. Evaluation of potential advantages of employing advanced construction concepts and materials in cooled airframe designs, with emphasis on weight/cost trade-offs. Comparison of costs for cooled and uncooled airframe construction. Development of reliable panel-to-line connectors. Definition of optimum coolant flow control techniques. Development of heat exchanger designs which preclude the possibility of freezing the water-glycol coolant under conditions of low heat load. Definition of cooling system performance under cold-day conditions, with possible consideration of alternate coolants. Development of sharp leading edge designs including evaluation of minimum-depth, heat-shielding concepts. Evaluation of system reliability with emphasis on weight/reliability trends. Evaluation of system redundancy requirements and their impact on cooling system de- sign. Evaluation of the potential benefits of integrating cooling requirements for other vehicle subsystems with the airframe cooling system. Examination of the applicability of convective cooling to other vehicle configurations.
Assuming the successful completion of the more critical studies recommended above, a re- latively large convectively cooled structure should be fabricated and experimentally evaluated under simulated heating and loading conditions in order to demonstrate system operating characteristics and reliability. Such a structure would also provide realistic system weight and cost data.
122

REFERENCES
1. McConarty, W.A., and Anthony, F.M., “Design and Evaluation of Active Cooling System for Mach 6 Cruise Vehicle Wings,” NASA CR-1916 1971.
2. Helenbrook, R.G., McConarty, W.A., and Anthony, F.M., “Evaluation of Active Cooling Sys- tems for a Mach 6 Hypersonic Transport Airframe,” NASA CR-1917 1971.
3. Becker, J.V.. “New Approaches to Hypersonic Aircraft,” Presented at the Seventh Congress of the International Council of the Aeronautical Sciences (CAS), Rome, Italy, September, 1970.
4. Fuhs, A.E., “Combustion Research Problems Associated with Advanced Air Breathing En- gines; AIAA Paper 7.1-1 , Presented at the Ninth Aerospace Sciences Meeting of the American Institute of Aeronautics and Astronautics, New York, New York, January 197 1.
5. Jarlett, F.E., “Performance Potential of Hydrogen Fueled, Airbreathing Cruise Aircraft,” Reports Numbered GCD - DCB 66-004 / 1/2/2A/3/4, 30 September, 1966.
6. Federal Aviation Regulations Part 25, “Airworthiness Standards; Transport Category Airplanes,” February, 1965.
7. MIL-A-8862 (ASG), “Airplane Strength and Rigidity, Landplane Landing and Ground Handl- ing Loads,” 18 May, 1960.
8. Pietrangeli, G.J. et. al., “The Feasibility of a Mach 7 Transport Employing Airbreathing Pro- pulsion Systems,” AD-654-428, JHU/APL CF-2900, 15 November, 1960.
9. Racisz, Stanley F., “Aerodynamic Parameters for Aeroelastic Analysis of Wings with Various Planforms,” BAC Research Note No. 89, 17 December, 1955.
10. “Advanced V/STOL Tactical Fighter Weapon System Design Study,” Lockheed - California Company and Bell Aerosy-stems Company, Final Report - April, 1966 LAC/608 19 1.
1 1. Ferri, A., Fox, H., and Hoydysh, W., “Active Cooling of Hypersonic Airplanes,” NASA CR- 66930, January, 1970.
12. Reshotko, E., and Cohen,-C.B., “Heat Transfer at the Forward Stagnation Point of Blunt Bodies,” NACA Rep. 3513, 1955.
13. “A Manual for Determining Aerodynamic Heating of High-speed Aircraft,” Bell Aircraft Cor- poration Report No. 7006-3352-001, June, 1959.
14. Lees, L., “Laminar Heat Transfer over Blunt-Nosed Bodies at Hypersonic Flight Speeds,” Jet Propulsion, Vol. 26, No. 4 , April, 1956, pp. 259-269.
15. Beckwith, Ivan E., and Gallagher, James J., “Local Heat Transfer and Recovery Temperatures on a Yawed Cylinder at a Mach Number of 4,15 and High Reynolds Numbers,” NASA TR R-104, 1961.
123
REFERENCES (CONT)
16. Neal, Luther, Jr., and Bertram, Michael H., “Turbulent-Skin-Friction and Heat-Transfer Charts Adapted from the Spalding and Chi Method,” NASA TN D-3969, 1967.
17. Spalding, D.B. and Chi, S.W., “The Drag of a Compressible Turbulent Boundary Layer on a Smooth Flat Plate with and without Heat Transfer,” Journal of Fluid Mechanics, Vol. 18, Part 1, January, 1964, pp. 1 17-143.
18. Czarnecki, K.R., Allen, J.M., and Jackson, M.W., “Boundary Layer Transition on Hypersonic- Cruise Aircraft,” Conference on Hypersonic Aircraft Technology, NASA SP-148, 1967.
19. Bushnell, D,ennis M., “Interference Heating on a Swept Cylinder in Region of Intersection with a Wedge at Mach Number 8,” NASA TN D-3094, 1965.
20. Spalding, D.B., Auslander, D.M., and Sundaram, T.R., “The Calculation of Heat and Mass Transfer through the Turbulent Boundary Layer on a Flat Plate at High Mach Numbers, With and Without Chemical Reaction,” Supersonic Flow Chemical Processes and Radiative Transfer, New York: McMillian Company, 1964.
21. Ambrok, G.S., “Approximate Solution of the Equation for the Thermal Boundary Layer with Variations of the Boundary Layer Structure,’’ Soviet Physica Technical Physics, Volume 2, 1957.
22. Dukes, W.H., et al, Manufacturing Methods for Insulated and Cooled Double-Wall Structures, ASD Technical Report 61-7-799, Section I, Volumes I and 11, May, 1961.
23. “Tentative Airworthiness Standards for Supersonic Transports,’’ Department of Transportation, Federal Aviation Administration, Flight Standards Service, January, 1969.
24. Flow of Fluids, Crane Co., Technical Paper No. 410, 1957. - .
25. Aero-Space Applied Thermodynamics Manual, Society of Automotive Engineers, February 1960.
26. Anthony, F.M., et al, “Fluid Cooled Cabin Wall Design for Hypersonic Aircraft,” Interim Technical Report No. 2331-900201, Contract No. AF33(615)-535 1, Bell Aerosystems Com- pany, March, 1967.
27. Kays, w. and London, A.L., Compact Heat Exchangers, 2nd Edition, New York: McGraw- Hill, 1964.
28. “Reconnaissance Aircraft Weapon System - Summary Report” Bell Aircraft Corporation Re- port D 143-945-029, December 1955.
29. “Reconnaissance Aircraft Weapon System - Summary Report” Bell Aircraft Corporation Re- port Dl43-945-055, August 1957.
124

30. “Dyna-Soar Weapon System - Structures Report” Martin Company Report ER-10373, Prepared by Bell Aircraft Corporation, April 1959.
3 1 . French, R.J., “Apollo Block I1 Environmental Control System Radiator Development.” LTV Report No. 00.7 17, August 1966.
NASA-Langley, 1971 - 02 cod., Newport News, Va. 125


![Mach number P w,test [bar] P model [bar] 1.8 -0.45 -0.20 0 ...ae342/18/lab2/lab2data.pdf · Mach 2.0 Snapshot . Mach 1.8 Snapshot . Mach 2.3 Snapshot Mach 2.2 Snapshot . P w,test](https://img.pdfslide.us/doc/110x75/5fb4e5220b26be1bae0aea08/mach-number-p-wtest-bar-p-model-bar-18-045-020-0-ae34218lab2-.jpg)