Embed Size (px)
Citation preview
APPROVED:
Haifeing Zhang, Major Professor Phillip R. Foster, Committee Member Shuping Wang, Committee Member Enrique Barbieri, Chair of the Department of
Engineering Technology Costas Tsatsoulis, Dean of the College of
Engineering Victor Prybutok, Vice Provost of the Toulouse
Graduate School
DESIGN, MODELING, AND EXPERIMENT OF A PIEZOELECTRIC PRESSURE SENSOR BASED
ON A THICKNESS-SHEAR MODE CRYSTAL RESONATOR
Thanh Tuong Pham
Thesis Prepared for the Degree of
MASTER OF SCIENCE
UNIVERSITY OF NORTH TEXAS
May 2017
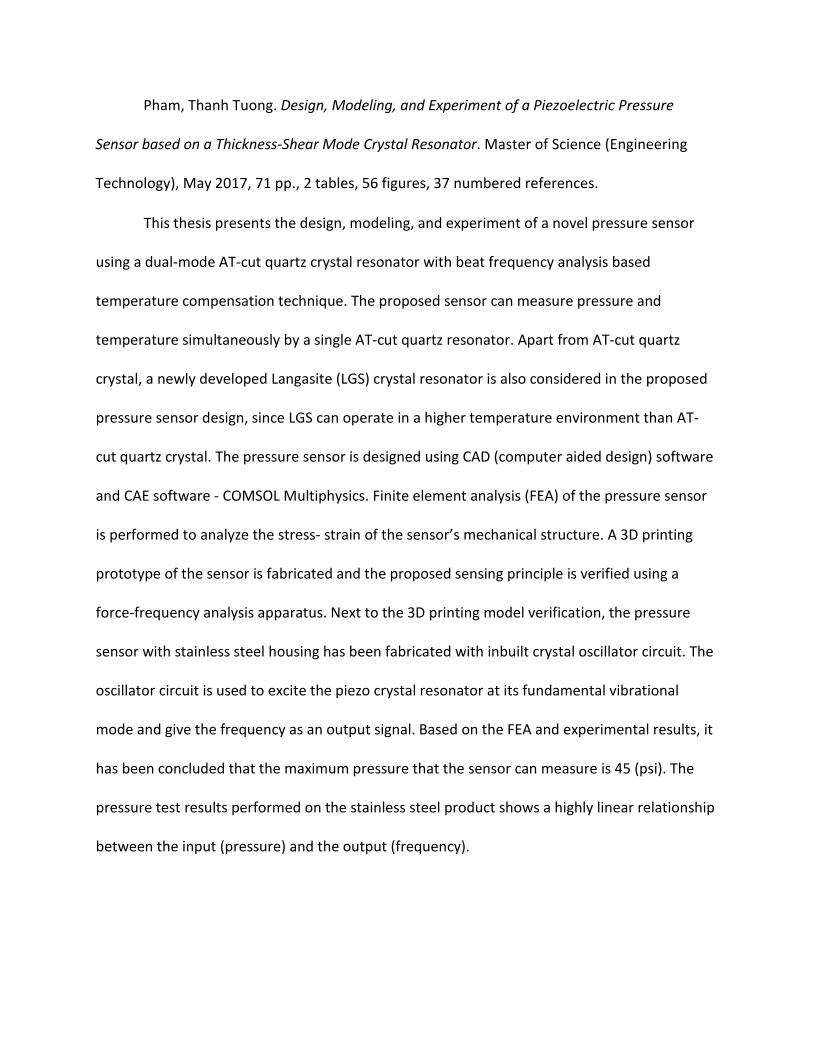
Pham, Thanh Tuong. Design, Modeling, and Experiment of a Piezoelectric Pressure
Sensor based on a Thickness-Shear Mode Crystal Resonator. Master of Science (Engineering
Technology), May 2017, 71 pp., 2 tables, 56 figures, 37 numbered references.
This thesis presents the design, modeling, and experiment of a novel pressure sensor
using a dual-mode AT-cut quartz crystal resonator with beat frequency analysis based
temperature compensation technique. The proposed sensor can measure pressure and
temperature simultaneously by a single AT-cut quartz resonator. Apart from AT-cut quartz
crystal, a newly developed Langasite (LGS) crystal resonator is also considered in the proposed
pressure sensor design, since LGS can operate in a higher temperature environment than AT-
cut quartz crystal. The pressure sensor is designed using CAD (computer aided design) software
and CAE software - COMSOL Multiphysics. Finite element analysis (FEA) of the pressure sensor
is performed to analyze the stress- strain of the sensor’s mechanical structure. A 3D printing
prototype of the sensor is fabricated and the proposed sensing principle is verified using a
force-frequency analysis apparatus. Next to the 3D printing model verification, the pressure
sensor with stainless steel housing has been fabricated with inbuilt crystal oscillator circuit. The
oscillator circuit is used to excite the piezo crystal resonator at its fundamental vibrational
mode and give the frequency as an output signal. Based on the FEA and experimental results, it
has been concluded that the maximum pressure that the sensor can measure is 45 (psi). The
pressure test results performed on the stainless steel product shows a highly linear relationship
between the input (pressure) and the output (frequency).

ii
Copyright 2017
by
Thanh Tuong Pham
iii
ACKNOWLEDGEMENT
First, I would like to express my thanks, sincere gratitude, and appreciation to my Major
Professor, Dr. Haifeng Zhang, for his instruction, great support, and motivation to accomplish
my thesis. He consistently allowed this paper to be my own work, but steered me in the right
the direction whenever he thought I needed it.
Second, I also truly express my thanks to Committee members Dr. Phillip R. Foster and
Dr. Shuping Wang for their guidance and invaluable comments on this thesis. Next, I would like
to give special thanks Dr. Suresh Kaluvan - a member in Dr. Zhang’s lab, other members in the
lab, friends, and ETEC department staff for their support during the time I worked on my thesis.
Finally, I would like to thank you my family members for their encouragement, physical
and mental support. This thesis could not be accomplished without their contributions.
iv
TABLE OF CONTENTS Page
ACKNOWLEDGEMENT ..................................................................................................................... iii
LIST OF TABLES ............................................................................................................................... vi
LIST OF FIGURES ............................................................................................................................ vii
CHAPTER 1 INTRODUCTION ............................................................................................................ 1
CHAPTER 2 LITERATURE REVIEW .................................................................................................... 4
2.1 Pressure Measurement and Pressure Sensor .................................................................. 4
2.2 Piezoelectric Material and Piezoelectric Effect ................................................................ 9
2.2.1 Piezoelectric Material ............................................................................................... 9
2.2.2 Piezoelectric Effect .................................................................................................. 11
2.3 AT-Cut Quartz and Langasite Piezoelectric Material ..................................................... 12
2.3.1 AT-Cut Quartz Piezoelectric Material ..................................................................... 12
2.3.2 Langasite Piezoelectric Material ............................................................................. 13
2.4 Bulk Acoustic Wave (BAW), Surface Acoustic Wave (SAW), and Modes of Vibration .. 14
2.5 Force-Frequency Effect on Crystal Resonator ................................................................ 16
2.6 Application of Quartz, Langasite Crystal on Pressure Sensor ........................................ 19
2.7 Temperature and Resonance Frequency Relation on Crystal Resonator ...................... 19
2.8 Dual-Mode and Temperature Compensation ................................................................ 21
CHAPTER 3 EXPERIMENT METHODOLOGY ................................................................................... 22
3.1 Experiment on Force-Frequency Effect of Crystal Resonator ........................................ 22

v
3.1.1 Experiment Procedure ............................................................................................ 22
3.1.2 Experiment Results ................................................................................................. 25
3.2 Pressure Sensor Housing Design .................................................................................... 27
3.2.1 Operation Principle of the Presssure Sensor .......................................................... 27
3.2.2 Preliminary Design by CAD (Computer Aided Design) Software ............................ 28
3.2.3 Finite Element Analysis (FEA) of the Pressure Sensor ............................................ 31
3.3 3D Printing Prototype ..................................................................................................... 38
3.4 Experiment on 3D Printing Prototype ............................................................................ 38
3.5 Design and Fabrication of Pressure Sensor with Stainless Steel Housing ..................... 40
3.6 Experiment on Pressure Sensor with Stainless Steel Housing ....................................... 43
3.7 Crystal Oscillator Circuit Design ..................................................................................... 47
3.8 Beat Frequency Experiment ........................................................................................... 48
CHAPTER 4 CONCLUSION AND FUTURE RESEARCH ...................................................................... 54
APPENDIX A DESIGN DRAWINGS OF PRESSURE SENSOR ............................................................. 55
APPENDIX B DESIGN DRAWINGS OF ALL-LANGASITE STRUCTURE ............................................... 64
REFERENCES .................................................................................................................................. 67

vi
LIST OF TABLES Page
Table 1: Maximum Force Applied on Crystal ................................................................................ 37
Table 2: Force-Frequency Relation ............................................................................................... 40

vii
LIST OF FIGURES Page
Figure 1: Pressure sensor using diametric force application (Hewlett Packard) ............................ 6
Figure 2: Structures where external hydrostatic pressure applies planar stress patterns in a
TSMR disc via a cylindrical shell ...................................................................................................... 7
Figure 3: Pressure sensor using uniaxial stress (Schlumberger) ..................................................... 7
Figure 4: Components of the all-langasite sensor structure .......................................................... 8
Figure 5: Unit cell of quartz [16] ................................................................................................... 10
Figure 6: Direct piezoelectric effect [16] ...................................................................................... 11
Figure 7: Inverse piezoelectric effect at applied electric field [16] .............................................. 11
Figure 8: Typical cuts of quartz crystal [18] .................................................................................. 13
Figure 9: Modes of vibration of quartz resonator [21] ................................................................. 15
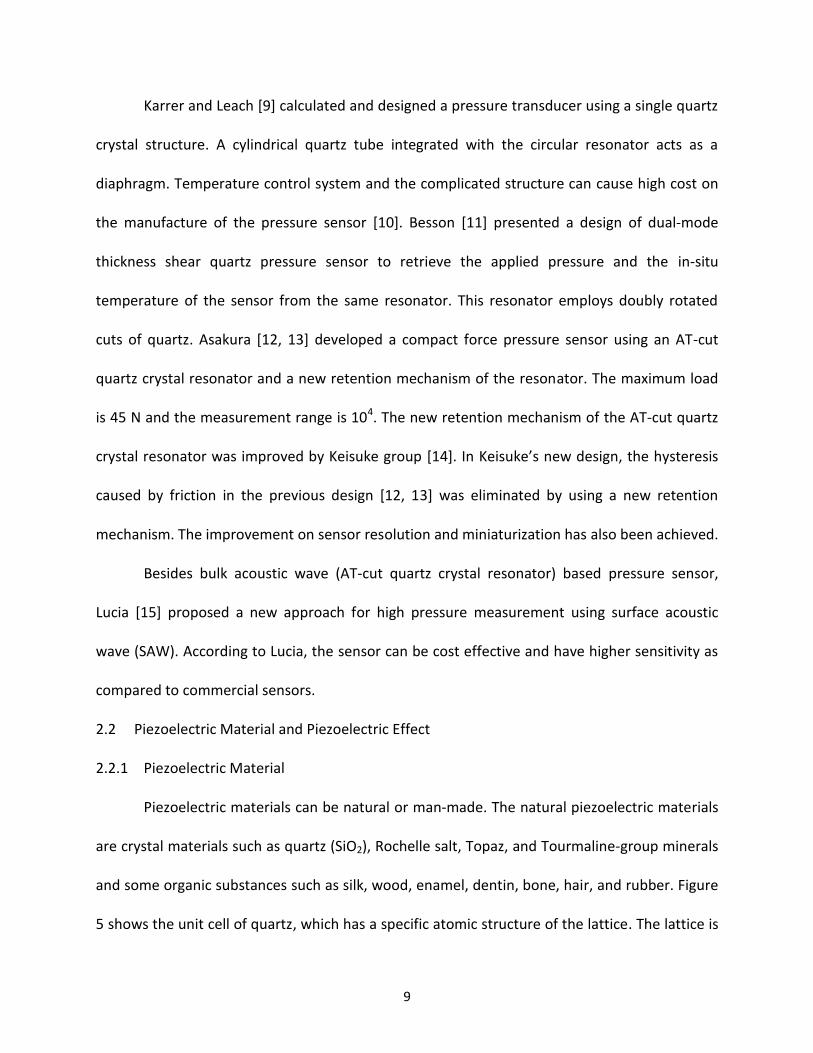
Figure 10: Isometric view of an AT-cut quartz crystal resonator ................................................. 16
Figure 11: Illustration of force application and azimuth angle ψ [29] ......................................... 17
Figure 12: Force sensitivity coefficients in resonators of different materials and cuts [31] ........ 18
Figure 13: Block diagram of the temperature compensation ...................................................... 21
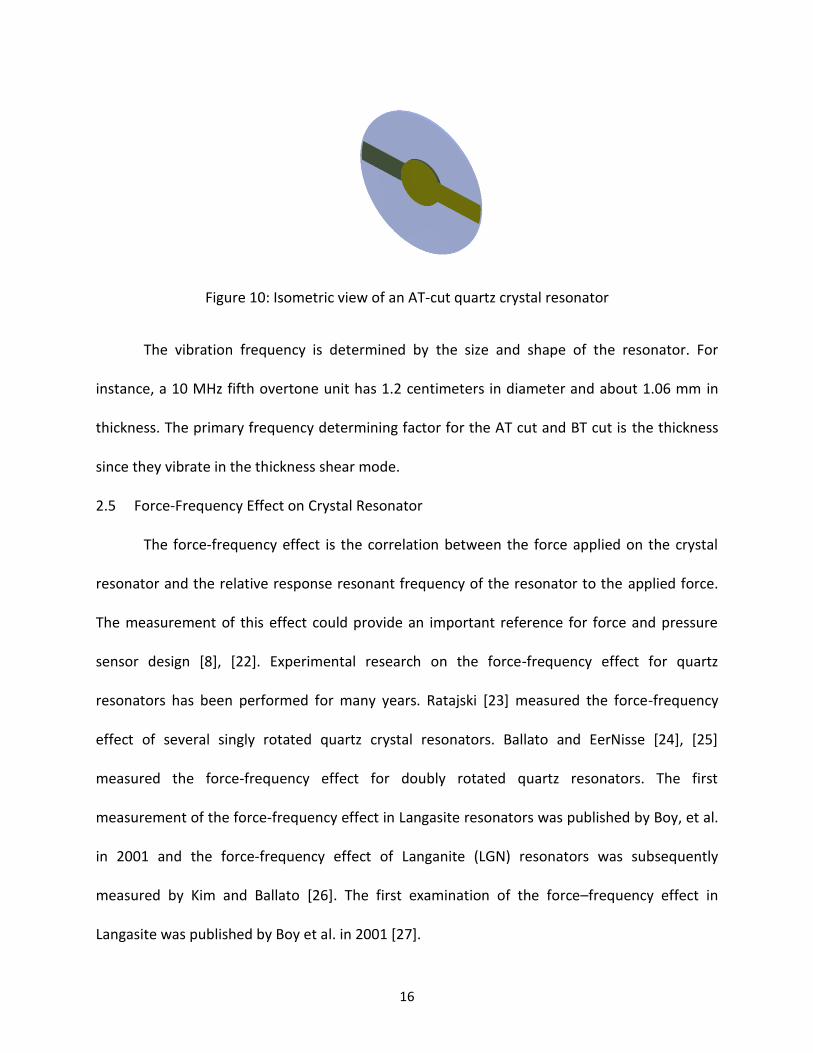
Figure 14: 3D isometric view (a) and front view (b) of the force loading device ......................... 22
Figure 15 Pictorial representation of the force loading device .................................................... 23
Figure 16: Photo of experiment setup .......................................................................................... 24
Figure 17: Definition of azimuth angles ψ for the experiment .................................................... 25
Figure 18: Force-frequency relation graph at different azimuth angles ψ obtained from
LabVIEW ........................................................................................................................................ 26
Figure 19: The curve Kf of a quartz resonator from the experiment vs. peer’s curve Kf .............. 27
viii
Figure 20: Mounting methods for TSMR using either a two-point mount or a three or four-point
mount [21] .................................................................................................................................... 28
Figure 21: Dimensions and section view of the pressure sensor ................................................. 29
Figure 22: Detailed view and side view B of the pressure sensor ................................................ 29
Figure 23: Section isometric view (a) and exploded view (b) of the pressure sensor .................. 30
Figure 24: Subdomains (a, b, c, d) of the analyzed assembly model ............................................ 31
Figure 25: Boundaries (a, b, c, d) of the analyzed assembly model ............................................. 32
Figure 26: Mesh analysis of the analyzed assembly model .......................................................... 33
Figure 27: Stress vs. diametric dimension of the crystal resonator ............................................. 34
Figure 28: FEA result of stress on a diametric section of the assembly model ............................ 35
Figure 29: FEA result of displacement on the assembly model.................................................... 35
Figure 30: FEA result of displacement on a diametric section of the assembly model ............... 36
Figure 31: Linear relationship between the inlet pressure and force applied on the crystal ...... 37
Figure 32: Prototype of the pressure sensor fabricated by a 3D printer ..................................... 38
Figure 33: (a) Mounting and electrical connection of the crystal, and (b) Fundamental resonance
frequency graph of the crystal when the applied force is 0 N ..................................................... 39
Figure 34: (a) Force applied on the box, (b) Force-frequency graph ............................................ 40
Figure 35: Section view of the assembly of the designed pressure sensor .................................. 41
Figure 36: Detail views of the assembly of the designed pressure sensor ................................... 41
Figure 37: Bill of material of pressure sensor assembly ............................................................... 41
Figure 38: Mounted crystal on one end cap (holder) ................................................................... 42
Figure 39: Stainless steel pressure sensor final assembly ............................................................ 42

ix
Figure 40: Final assembly of the pressure sensor with stainless steel housing ........................... 43
Figure 41: Diaphragm of the resonance frequency measurement .............................................. 43
Figure 42: Resonance frequency measurement on mounted crystal .......................................... 44
Figure 43: Schematic diaphragm of the pressure measurement experiment setup ................... 44
Figure 44: Pictorial diaphragm of the pressure measurement experiment setup ....................... 45
Figure 45: Pressure measurement experiment and graph result................................................. 46
Figure 46: Fabricated crystal oscillator circuit .............................................................................. 46
Figure 47: Pressure measurement result of the designed pressure sensor ................................. 47
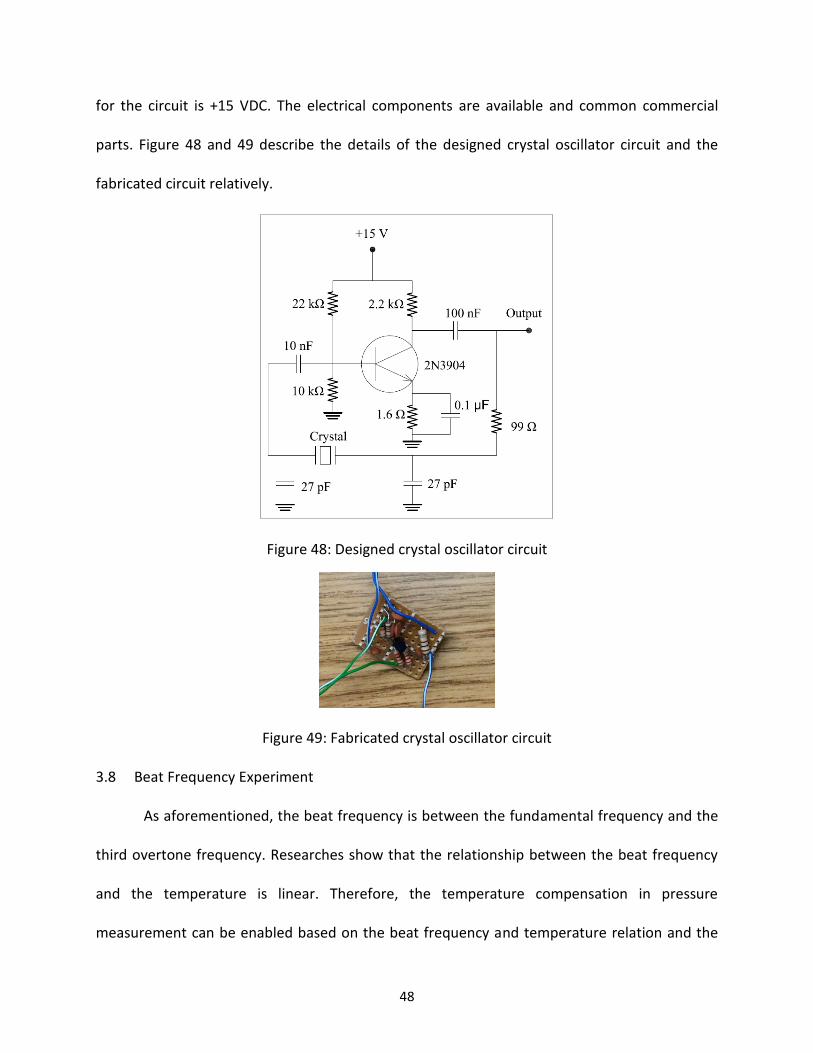
Figure 48: Designed crystal oscillator circuit ................................................................................ 48
Figure 49: Fabricated crystal oscillator circuit .............................................................................. 48
Figure 50: Diagram of the experiment setup on temperature vs. frequency .............................. 49
Figure 51: Photos of the experiment set up for beat frequency vs. temperature ....................... 50
Figure 52: Crystal resonator mounting and connection in the ceramic box ................................ 50
Figure 53: 3*fundamental frequency and 3rd overtone frequency vs. temperature in quartz... 51
Figure 54: 3*fundamental frequency and 3rd overtone frequency vs. temperature in LGS ....... 52
Figure 55: Beat frequency vs. temperature of quartz .................................................................. 52
Figure 56: Beat frequency vs. temperature of LGS ....................................................................... 53
1
CHAPTER 1
INTRODUCTION
Pressure measurement based on piezoelectric crystal resonators has advantages over
the commercially available methods like capacitive, electromagnetic, optical, potentiometric,
and piezo resistive strain gauge. Since the output of piezoelectric based sensors are digital in
format, it has the advantages like very high resolution, high accuracy, and the long-term
stability [1]. Quartz is one of the piezoelectric materials commonly used in digital pressure
sensors. This material is elastic in nature, providing high stability, high repeatability and
elasticity, repeatable mechanical behavior for large cycle of operation, and is free of hysteresis.
Quartz crystal resonator (QCR) is commonly used in industry as it has a high Q, which means
that very high vibration can be driven with a very low electric power [2]. Furthermore, since the
elastic stiffness constant of the QCR is very large, the deformation of this crystal resonator is
very small when applied with moderate external force. In pressure sensing aspect, this ensures
the linearity of the diaphragm deformation and therefore enhances the linearity of the sensor.
Also, the sensitivity of the sensor is closely similar to that of bare QCR because of the small
deformation and the thin thickness of the diaphragm. Because of the advantages of quartz and
QCR in pressure sensing as stated above, pressure sensors using quartz crystal resonators have
been developed and produced. Those pressure sensors have low noise capabilities which can
result in very high resolution, and the long-term stability of resonator can ensure the high
accuracy output.
Commercial manufacturers such as Hewlett-Packard, Quartztronics, Halliburton,
Schlumberger, and Quartzdyne are having different range of pressure sensor products, which

2
are designed using thickness-shear mode quartz piezo crystals. Currently, most of the pressure
sensors use all-quartz structure, which is constructed entirely using a single piece of quartz
piezo crystal [3]. For example, the structure of the Quartzdyne’s sensor is a thick wall hollow
cylinder with closed ends. The thickness-shear mode disc resonator divides the central part of
the hollow cylinder. Fluid pressure on the exterior hydrostatically compresses the quartz
cylinder, producing internal compressive stress in the resonator. Quartzdyne is the one of the
main manufacturer supplying the thickness-shear quartz sensors. The company has developed
the pressure sensor by decreasing its size and improving its precision up to 0.02% of full-scale
accuracy while being able to measure pressures up to 30,000 psi at 2000C [4].
Despite the good performance, the cost of commercial pressure sensors is very high,
their structures are complicated and the temperature affection on pressure measurement has
not been minimized completely. Those pressure sensors use three separated crystal resonators
to perform temperature compensation: One crystal responses to exposed pressure, the second
crystal is sensitive to temperature and the third one as a reference crystal has minimal
sensitivity to pressure and temperature [1]. Although this method can yield the temperature
compensation through microprocessor, the accuracy of the pressure measurement using this
method is affected by thermal lag which occurs when distance between the crystals exists.
Meanwhile, dual-mode excitation method can provide superior temperature compensation
since the distance between crystals is eliminated. Instead, in dual-mode excitation, two modes
occupy the same volume of quartz, and therefore minimize thermal lag problem. Also, the self-
sensing of crystal resonator or dual-mode excitation on the crystal can eliminate the
temperature control. This can simplify the structure of the sensor. Apart from quartz, Langasite
3
(LGS) is a new promising piezoelectric material that combines the advantageous properties of
quartz with its good performance at high temperatures. LGS will not undergo any phase
transitions up to its melting temperature of 14730C [5]. Hence, the application of Langasite in
measuring pressure at high temperature is necessary.
For the reasons mentioned above, this thesis focuses on the design, modeling, and
experiment of a novel pressure sensor using a dual-mode AT-cut quartz crystal resonator with
beat frequency analysis based temperature compensation technique. A novel mounting
structure of the crystal resonator is proposed and the application of LGS circular crystal
resonator is also considered in the design. The newly designed pressure sensor has advantages
in low cost, high accuracy, and simplified structure. In the proposed pressure sensor, the force
sensing element is a commonly used circular AT-cut quartz crystal resonator, which is mounted
in the two caps and excited by two modes of vibration simultaneously: fundamental mode and
third overtone mode. The pressurized air from the inlet is totally separated from the quartz
crystal by a diaphragm. An oscillator circuit which excites the crystal resonator at fundamental
vibration mode is fabricated. To verify the performance of the fabricated pressure sensor, a
pressure measurement is performed on the pressure sensor at fundamental mode of vibration
and the temperature-frequency relation experiment on both quartz and LGS crystal resonators
is performed.

4
CHAPTER 2
LITERATURE REVIEW
2.1 Pressure Measurement and Pressure Sensor
Pressure measurement is critical and common in fields such as metrology, aerospace,
hydrology, process control, meteorology, energy exploration, and oceanography. A pressure
transducer is a device that measures pressure and converts it to other means of measurement
elements such as displacement, inductance, resistance, optical signal, frequency, and
capacitance. In general, analog and digital are two basic categories of pressure sensors.
In analog pressure sensors, the input signal is the pressure of the environment. The
output is the analog signal or continuous signal. Typical analog pressure sensors are
piezoresistive strain gauges (either bonded or formed) using piezoresistive effect to detect
strain due to applied pressure, with resistance increasing as pressure deforms the material.
Capacitive pressure sensors use a diaphragm and a pressure cavity to create a variable
capacitor to detect strain caused by applied pressure, with capacitance decreasing as pressure
deforms the diaphragm. Electromagnetic pressure sensors measure the displacement of a
diaphragm by means of changes in inductance. Optical pressure sensors employ a technique
using the physical change of an optical fiber to detect strain caused by applied pressure.
Thermal pressure sensors use changes in thermal conductivity of a gas caused by density
changes to measure pressure. In dynamic pressure sensors, the direct piezoelectric effect is
utilized. That means, when a force is exerted upon a piezoelectric element, a voltage is
generated.
5
In digital pressure sensor, the signal of the output is digital (resonant) since it is a
frequency signal. Although there are many resonance based sensors, the most commonly used
especially in oil field is digital quartz crystal sensor. There are two basic types of digital quartz
sensors: thickness-shear mode resonator (TSMR) found in Hewlett-Packard design and the
vibrating beam made popular by Paroscientific [6]. The thickness-shear mode digital quartz
sensor is a hydrostatic pressure sensor, since the sensing element is totally surrounded by a
pressure media. The vibrating beam device is a force sensor when the pressure must be
converted to a force by means such as Bourdon tube, and a structure combing bellows, hinges,
and levers. Each type has its strengths and weaknesses. The thickness-shear mode quartz
sensor is based upon the well-known force-frequency effect of precision quartz resonators. The
force-frequency effect occurs when a force is exerted upon the circumference of a quartz
resonator and its resonant frequency will shift in proportion to the applied force.
Quartzdyne is a main supplier of digital (resonant) pressure sensor using an all-quartz
structure. A typical model of Quartzdyne’s pressure sensor is TMC16K-B, which has a pressure
range of 16,000 psi and a temperature range of 1770C [6]. The transient performance of
Quartzdyne’s pressure transducers (pressure sensors) has been developed, but there is still
more work to be done on the transient performance improvement for certain products [7].
In all-quartz structure pressure sensor, EerNisse [8] categorized the pressure sensor into
four groups: (1) Pressure sensor using diametric force application as in Figure 1, (2) pressure
sensor using uniform stress as in Figure 2, (3) pressure sensor using uniform stress and a
diametric force component, and (4) pressure sensor using uniaxial stress as in Figure 3.

6
Karrer and Ward [8] also constructed an all-quartz structure to measure pressure. In
their research, a quartz diaphragm squeezes on a diameter of an AT-cut quartz resonator as
seen in Figure 1. The direction of the force axis is the crystallographic axis of crystal, which has
the largest force-frequency effect coefficient. The all-quartz structure helps avoid differences in
thermal expansion. Force is applied from the diaphragm and base to the disc edges by
devitrifying glass joints [6]. This structure can be commonly found in Hewlett Packard (HP)
devices.
Figure 1: Pressure sensor using diametric force application (Hewlett Packard)
Figure 2a shows an all-quartz structure including a resonator disc which is squeezed
uniformly around the perimeter. When the structure is put in a pressure environment, a
uniform radial stress two to three times the applied pressure occurs in the resonator. The
structure has been improved, and the one used by Quartzdyne has smaller size and lower cost
than previous designs [8]. Use of non-uniform stress in the resonator would provide a new
degree of freedom to optimize the sensor performance. As in Figure 2b, flatten surface is added
to break the symmetry of the shell adding more degree of freedom for the pressure sensor.

7
(a) (b)
Figure 2: Structures where external hydrostatic pressure applies planar stress patterns in a
TSMR disc via a cylindrical shell
(a) Uniform radial stress (Hewlett Packard and Quartzdyne)
(b) Superposition of diametric force effect and uniform radial stress from the
presence of deep flats (Halliburton)
Figure 3 shows a structure where external pressure of the structure applies a uniaxial
stress in a TSMR plate through a cylindrical shell [8].
Figure 3: Pressure sensor using uniaxial stress (Schlumberger)

8
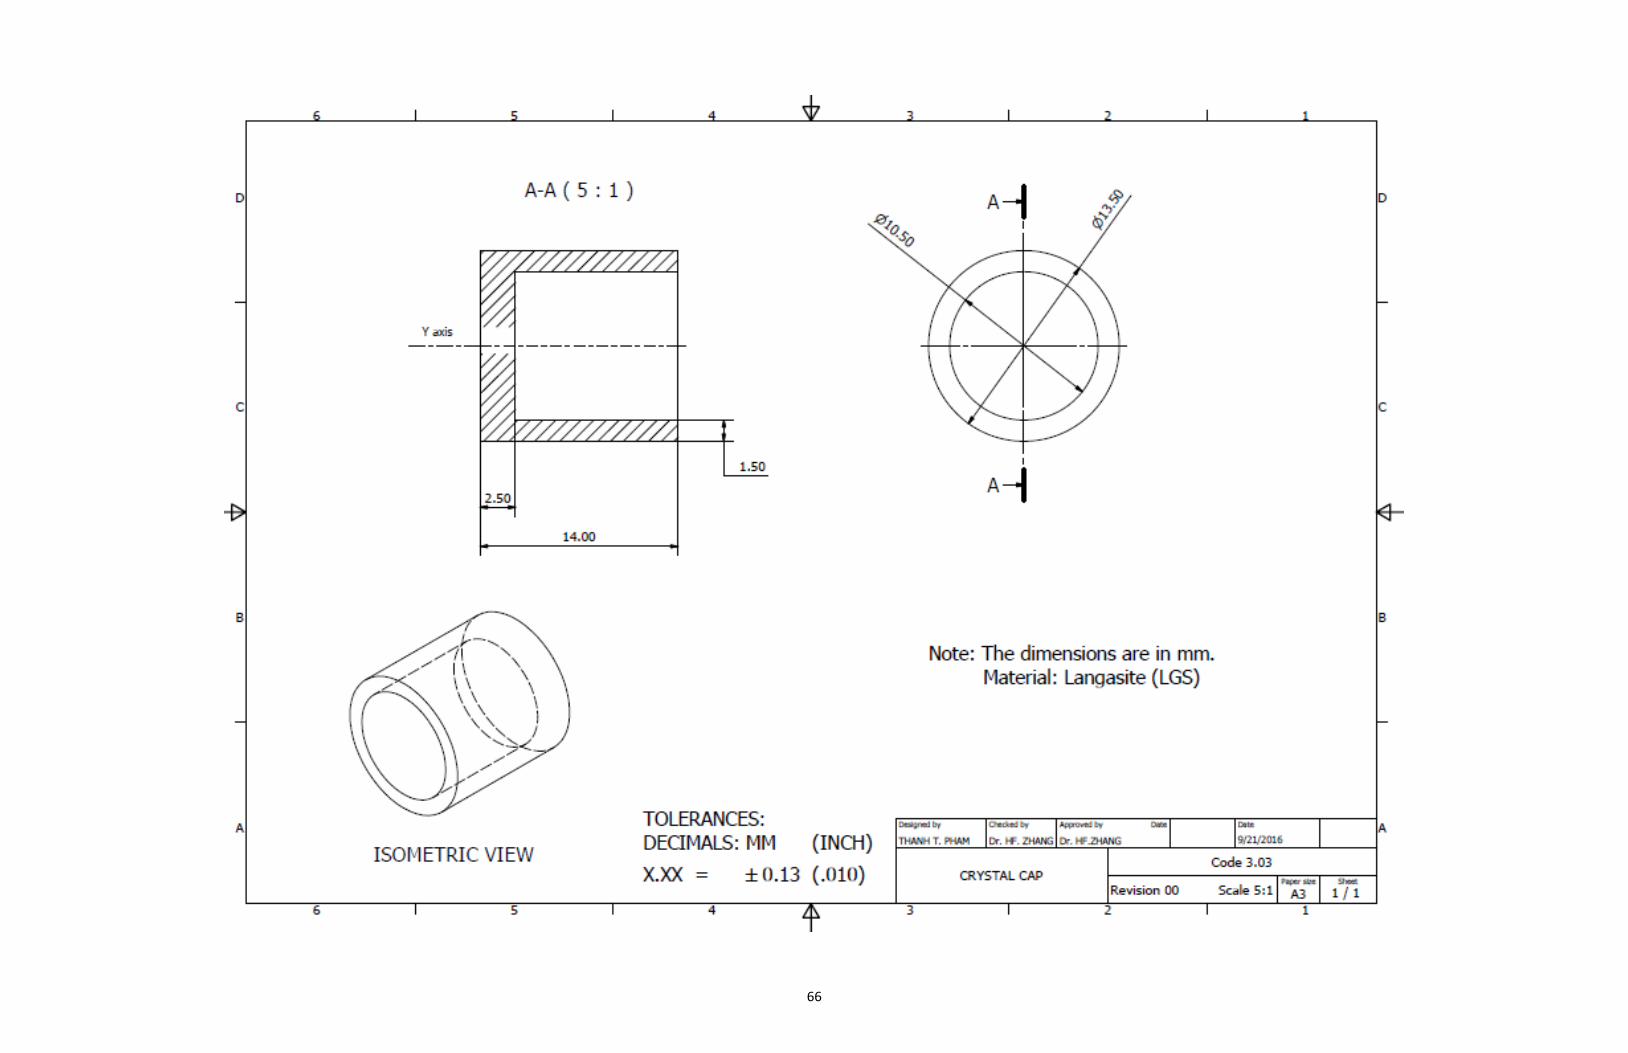
Figure 4a, b, and c introduce views of a designed all-langasite structure of pressure
sensor for future experiment on its performance at high temperatures. The structure has three
parts: two end caps and the middle section that integrates crystal resonator disc. The two end
caps are bonded with the middle section hermetically by a devitrifying glass joint. The whole
structure is made of langasite in order to minimize the thermal expansion, which affects the
accuracy of the pressure measurement. Detailed design drawings of these parts can be found in
Appendix B.
(a) (b)
(c)
(a) Section view of crystal resonator (b) Isometric view of the structure
(c) Section view of the crystal cap
Figure 4: Components of the all-langasite sensor structure
9
Karrer and Leach [9] calculated and designed a pressure transducer using a single quartz
crystal structure. A cylindrical quartz tube integrated with the circular resonator acts as a
diaphragm. Temperature control system and the complicated structure can cause high cost on
the manufacture of the pressure sensor [10]. Besson [11] presented a design of dual-mode
thickness shear quartz pressure sensor to retrieve the applied pressure and the in-situ
temperature of the sensor from the same resonator. This resonator employs doubly rotated
cuts of quartz. Asakura [12, 13] developed a compact force pressure sensor using an AT-cut
quartz crystal resonator and a new retention mechanism of the resonator. The maximum load
is 45 N and the measurement range is 104. The new retention mechanism of the AT-cut quartz
crystal resonator was improved by Keisuke group [14]. In Keisuke’s new design, the hysteresis
caused by friction in the previous design [12, 13] was eliminated by using a new retention
mechanism. The improvement on sensor resolution and miniaturization has also been achieved.
Besides bulk acoustic wave (AT-cut quartz crystal resonator) based pressure sensor,
Lucia [15] proposed a new approach for high pressure measurement using surface acoustic
wave (SAW). According to Lucia, the sensor can be cost effective and have higher sensitivity as
compared to commercial sensors.
2.2 Piezoelectric Material and Piezoelectric Effect
2.2.1 Piezoelectric Material
Piezoelectric materials can be natural or man-made. The natural piezoelectric materials
are crystal materials such as quartz (SiO2), Rochelle salt, Topaz, and Tourmaline-group minerals
and some organic substances such as silk, wood, enamel, dentin, bone, hair, and rubber. Figure
5 shows the unit cell of quartz, which has a specific atomic structure of the lattice. The lattice is

10
a tetrahedron built of oxygen atoms around a silicon atom. Each oxygen atom is located at the
same distance to the silicon atom, and the distances between the oxygen atoms are all the
same. The change in the position of the atoms due to applied stress leads to the formation of
net dipole moments that causes polarization and an electric field, respectively. Man-made
piezoelectric materials include Barium Titanate, and Lead Zirconate Titanate.
Figure 5: Unit cell of quartz [16]
Piezoelectricity as a research field in crystallographic physics was initiated by the
brothers Jacques Curie (1856–1941) and Pierre Curie (1859–1906) with their studies. They
discovered an abnormal characteristic of certain crystalline minerals including tourmaline,
quartz, topaz, cane sugar, and Rochelle salt. They found that when the tension or compression
force is applied on the crystal, voltages are generated of opposite polarity and proportional to
the applied load. This is called the direct piezoelectric effect.

11
2.2.2 Piezoelectric Effect
The direct piezoelectric effect is shown schematically in Figure 6a and b. The word
piezoelectricity comes from Greek word piezo (pressure) and refers to electricity resulting from
pressure. In the year following the discovery of the direct effect of crystal resonator, Lippman
predicted the existence of the inverse effect basing on fundamental thermodynamic principles.
Before the end of 1881, the Curie brothers experimentally verified the existence of the inverse
effect. They proved that if a piezoelectric material was exposed to an electric field, it would
lengthen or shorten in accordance with the polarity of the field, and in proportion to its
strength. This inverse effect is illustrated in Figure 7a and b [16].
Figure 6: Direct piezoelectric effect [16]
Figure 7: Inverse piezoelectric effect at applied electric field [16]

12
The piezoelectric effect is very useful in many applications that involve the production
and detection of sound, structure health monitoring, electronic frequency generation,
microbalances, and sensor technology. Some piezoelectric materials contain toxic substances
such as lead (Pb), which is harmful to humans and the environment. Therefore, the demand for
more environmentally safe options resulted in the development of new lead-free piezoelectric
materials.
2.3 AT-Cut Quartz and Langasite Piezoelectric Material
2.3.1 AT-Cut Quartz Piezoelectric Material
Quartz is the crystalline form of silicon dioxide, SiO2, and one of the most common
naturally occurring crystalline minerals. It is a hard, brittle, transparent material with a density
of 2,649 kg.m-3, and a melting point of 1,7500C [17]. When quartz is heated to 5730C, its
crystalline form changes. Most of the physical properties of a crystal are anisotropic (direction
dependent). Therefore, changes during the growth of the crystal which affect anisotropy result
in crystal imperfections. The major axis of quartz growth is called the optic axis. This axis is not
anisotropic to light, so light passes readily. The optic axis is labeled the Z axis in an orthogonal X,
Y, and Z coordinate system. A quartz crystal having six sides has three separate X axes and three
Y axes definable at 120° increments about the Z axis.
A small piece of quartz material is obtained by cutting the crystal at specific angles to
the various axes. The choice of axis and angles determines the physical and electrical
parameters for the resonator. These more common cuts provide various trade-offs between
electrical-mechanical capability and temperature coefficient. Figure 8 shows typical cuts of a
quartz crystal.

13
Figure 8: Typical cuts of quartz crystal [18]
The AT-cut quartz thickness shear mode resonator provides a high resonance frequency
and exhibits superior temperature stability near room temperature than that of other kinds of
vibration modes. Therefore, it is considered to be an applicable material for use in pressure and
force sensors. By applying an external force to the quartz crystal resonator, its resonance
frequency changes proportionally to the external force. A previous investigation showed that
when adding an external force from the direction of 34.8° of X axis of the AT-cut quartz crystal
resonator, the stress sensitivity improved mostly.
2.3.2 Langasite Piezoelectric Material
Langasite (La3Ga5SiO14), Langatate (La3Ga5.5Ta0.5O14), and Langanite
(La3Ga5.5Nb0.5O14) single crystals (LGS, LGT, and LGN, respectively; collectively called LGX) are
a group of emerging piezoelectric materials which have been shown to exhibit stable properties

14
similar to quartz and high electromechanical coupling coefficients similar to lithium niobate.
LGS and its isomorphs exhibit quality and electromechanical coupling factors which are,
respectively, four and two times greater than those of quartz [19]. One of the most important
features of LGX is its phase transition, which occurs under high temperature at its melting
temperature of 1,473°C and under high pressure at 10 GPa. These excellent properties of LGS
and its isomorphs provide promising applications on sensors and timing in high-temperature
and high-pressure environment such as oil and gas industry. Combined with the high Q, the
material is promising for yielding lower acceleration sensitivity and lower noise resonators than
quartz.
Piezoelectric resonators based on Langasite and its isomorphs have strong piezoelectric
coupling, low acoustic loss, zero temperature coefficient of frequency, and reduced nonlinear
effects occurring in simple orientations [20]. Therefore, the application of Langasite in pressure
sensors to measure pressure and temperature is promising.
2.4 Bulk Acoustic Wave (BAW), Surface Acoustic Wave (SAW), and Modes of Vibration
Bulk acoustic wave (BAW) is elastic waves propagating in solids or substrate. BAW
includes longitudinal and transverse waves. The most commonly used BAW devices are the
thickness shear mode resonator (TSMR) and the shear-horizontal acoustic plate mode
(SH-APM) sensor.
If the wave propagates on the surface of the substrate, it is known as a surface acoustic
wave (SAW). The most widely used surface acoustic wave devices are the SAW sensor and the
shear-horizontal surface acoustic wave (SH-SAW) sensor, also known as the surface transverse
wave (STW) sensor.

15
The modes of vibration depend on how the crystal was cut. For example, an X-cut crystal
exhibits an extensional vibration mode whereas the AT-cut crystal, which is cut at 35 degrees
off the Y-axis, vibrates in the thickness shear mode. An illustration of the various vibration
modes of quartz resonator is given in Figure 9.
Figure 9: Modes of vibration of quartz resonator [21]
The thickness-shear mode resonator (TSMR) widely referred to as a quartz crystal is the
best-known, oldest, and simplest acoustic wave device. The TSMR typically consists of a thin
disk of AT-cut quartz with parallel circular electrodes patterned on both sides. The application
of a voltage between these electrodes results in a shear deformation of the crystal. This device
is known as a resonator because the crystal resonates as electromechanical standing waves are
created. Figure 10 shows an isometric view of the AT-cut quartz crystal resonator. In, TSMR, the
displacement is maximized at the crystal faces, making the device sensitive to surface
interactions. TSMR offers stability, low power, frequency output, and high Q factor due to
energy trapping. These properties are critical for frequency control applications and also
beneficial in sensor technology.
16
Figure 10: Isometric view of an AT-cut quartz crystal resonator
The vibration frequency is determined by the size and shape of the resonator. For
instance, a 10 MHz fifth overtone unit has 1.2 centimeters in diameter and about 1.06 mm in
thickness. The primary frequency determining factor for the AT cut and BT cut is the thickness
since they vibrate in the thickness shear mode.
2.5 Force-Frequency Effect on Crystal Resonator
The force-frequency effect is the correlation between the force applied on the crystal
resonator and the relative response resonant frequency of the resonator to the applied force.
The measurement of this effect could provide an important reference for force and pressure
sensor design [8], [22]. Experimental research on the force-frequency effect for quartz
resonators has been performed for many years. Ratajski [23] measured the force-frequency
effect of several singly rotated quartz crystal resonators. Ballato and EerNisse [24], [25]
measured the force-frequency effect for doubly rotated quartz resonators. The first
measurement of the force-frequency effect in Langasite resonators was published by Boy, et al.
in 2001 and the force-frequency effect of Langanite (LGN) resonators was subsequently
measured by Kim and Ballato [26]. The first examination of the force–frequency effect in
Langasite was published by Boy et al. in 2001 [27].

17
The prime parameters affecting the force sensitivity of circular crystal resonator are the
orientation angle, direction of force, crystal geometry, operating frequency, and the design of
the crystal holder [28].
Figure 11: Illustration of force application and azimuth angle ψ [29]
As illustrated in Figure 11, azimuth angle ψ is the angle between the applied force
direction and the crystallographic axis of a singly rotated cut crystal.
A more thorough theoretical analysis of the force-frequency effect for doubly rotated
Langasite resonators can be found in [20]. The force-frequency effect produced in a circular
crystal plate acted upon by diametric in-plane force at the angle ψ is characterized by means of
a force-frequency coefficient Kf (m.s/N), which is defined by:
Kf =∆f
f.
(Diameter)(Thickness)
(Force)(Aucoustic velocity/2) (1)
Where ∆f
f is the normalized frequency change due to the applied force [11].
The sensitivity of the resonance frequency can be reduced by selecting correct support
orientations. The value of Kf m.s/N can be positive, negative, or zero.

18
When the force-frequency relation is identified at a certain azimuth angle, this relation
is linearized, and the slope of the line can be determined. The coefficient Kf can also be
calculated by the following formula:
Kf =df
dF.
D
f02 (2)
Where df/dF is the slope of the line (Hz/Newton), D is the diameter of the resonator (m), and f0
is the frequency (Hz) without force (0 Newton) [30].
Zhang [20] has analyzed the force-frequency relation in Langasite theoretically and
numerically and found the developed theory has good agreement with previous experimental
results.
Kosinski [31] measured the Kf of Langasite (LGS) and compared it with that of quartz.
The Kf of LGS is smaller than that of quartz as shown in Figure 12.
Figure 12: Force sensitivity coefficients in resonators of different materials and cuts [31]

19
2.6 Application of Quartz, Langasite Crystal on Pressure Sensor
As aforementioned, quartz resonators have been used in many pressure sensor
applications and have good performance. Langasite, a new piezoelectric material, can be used
in pressure measurement since it has outstanding temperature behavior with a zero
temperature coefficient compared to quartz crystal, good piezoelectric coupling, low acoustic
loss, and a high Q factor. Many manufacturers such as Hewlett-Packard, Quartztronics,
Halliburton, and Schlumberger have applied quartz for their pressure sensors. Manufacturers
have been conducting more researches to produce a sensor with higher performance. Factors
that affect the performance of the sensor are aging (short-term, long-term), drive energy,
gravity, shock, vibration, electromagnetic, retrace, hysteresis, and crystal holder. The effect of a
crystal holder on the force-frequency effect was calculated by Ratajski [29]. Furthermore,
Langasite is a piezoelectric material that can work at high temperature. Many researches have
been performed on this material to verify its performance on the measurement of pressure at
high temperature.
2.7 Temperature and Resonance Frequency Relation on Crystal Resonator
The temperature dependence of the resonance frequency of the bulk acoustic wave
crystal resonators is a function of material constants, thermal expansion coefficients, coupling
between the vibration modes and the nature and the thickness of the electrode. In Y-cut
Langasite, the relationship between temperature and frequency is parabolic on fundamental,
third, and fifth overtone frequencies [32]. In the AT-cut quartz crystal resonator, both the
fundamental and the third overtone mode frequencies are functions of the temperature and
force. Because the temperature affects the frequency of the excited crystals as mentioned, it

20
will reduce the accuracy of the pressure measurement. As a result, the temperature
compensation in pressure measurement of AT-cut quartz and LGS crystal based pressure sensor
is indispensable.
The beat frequency is defined as the formula:
fb = 3f1 − f3 (3)
After derivation, the relationship between the normalized beat frequency and the
temperature is as follows:
∆fb(T)
fb(T)=
3Tf,1(1)
−λTf,3(1)
3−λΔT (4)
Where Tf,1(1)
is the function of T0 and T.
ΔT = T0 − T, T0 is the reference temperature, and T is the arbitrary temperature.
λ ≈ 3 for AT-cut quartz resonators.
From formula (4), it can be seen that the normalized beat frequency is a linear function
of temperature and does not relate to force. Therefore, the beat frequency can be used to
measure temperature [33].

21
2.8 Dual-Mode and Temperature Compensation
Figure 13: Block diagram of the temperature compensation
of a QCR based pressure sensor [34]
The crystal resonator is excited at fundamental mode and third overtone mode
simultaneously by oscillator 1 and oscillator 2. The frequency shift of the third overtone mode is
used to measure the force, and the beat frequency is used to measure the temperature. A
microprocessor functions as a temperature identifier according to the beat frequency, and then
it compensates temperature in force or pressure measurement using calibration
equation [8], [25], [35].

22
CHAPTER 3
EXPERIMENT METHODOLOGY
3.1 Experiment on Force-Frequency Effect of Crystal Resonator
3.1.1 Experiment Procedure
The graph of force-frequency coefficient Kf illustrates the positions of azimuth angles
where the Kf reaches the greatest value or Kf = 0. Based on this graph, the positions of the
applied force on the circumference of the crystal resonator, which maximize the force-
frequency effect, are identified. The force/pressure sensor’s sensitivity is increases when the
force-frequency effect increases. As a result, in the designed pressure, the position where the
mounting and force applied positions of the crystal resonator is determined to increase the
performance of the pressure sensor. On the other hand, the performance in frequency control
application can be increased by choosing the mounting or holding positions of the crystal where
Kf has smallest value. In the research, a force loading device which is used for the measurement
of force-frequency effect was designed and manufactured as shown in Figure 14.
(a) (b)
Figure 14: 3D isometric view (a) and front view (b) of the force loading device
23
Figure 15 shows a pictorial presentation of the experiment using the force loading
device. The graph of the force-frequency relationship can be seen from the LabVIEW interface
on the computer screen.
Figure 15 Pictorial representation of the force loading device

24
Figure 16: Photo of experiment setup
Figure 16 illustrates a connection setup of the experiment. Firstly, we connect two
electrodes of the crystal resonator to the crystal oscillator circuit. The input of the crystal
oscillator circuit is DC current. This circuit excites the crystal resonator and the AC frequency
output of the circuit is connected to the frequency counter.
In manual mode, the handle of the lead screw (06 in Figure 2b) is rotated to apply force
on the crystal. The value of the applied force is shown on the digital indicator. The relative
output frequency value is read from the frequency counter. The relationship between the
applied force and the output frequency can be plotted from those two values. Based on
formula (2), we can calculate the force-frequency coefficient Kf at one azimuth angle. The
25
crystal resonator can be rotated so that we can calculate Kf at different azimuth angles. Finally
the plot of Kf vs. azimuth angle can be drawn.
In automation mode, the crystal resonator is mounted similarly to the manual mode.
However, the maximum applied force is specified in the LabVEW interface (for example 40 N),
then press the RUN button. The force applied on the crystal is increased and measured over
time automatically. At the same time, the output frequency is measured. The graph of the input
force and the output frequency is yielded and shown on the LabVIEW interface. Likewise, the
plot of Kf then can be obtained.
3.1.2 Experiment Results
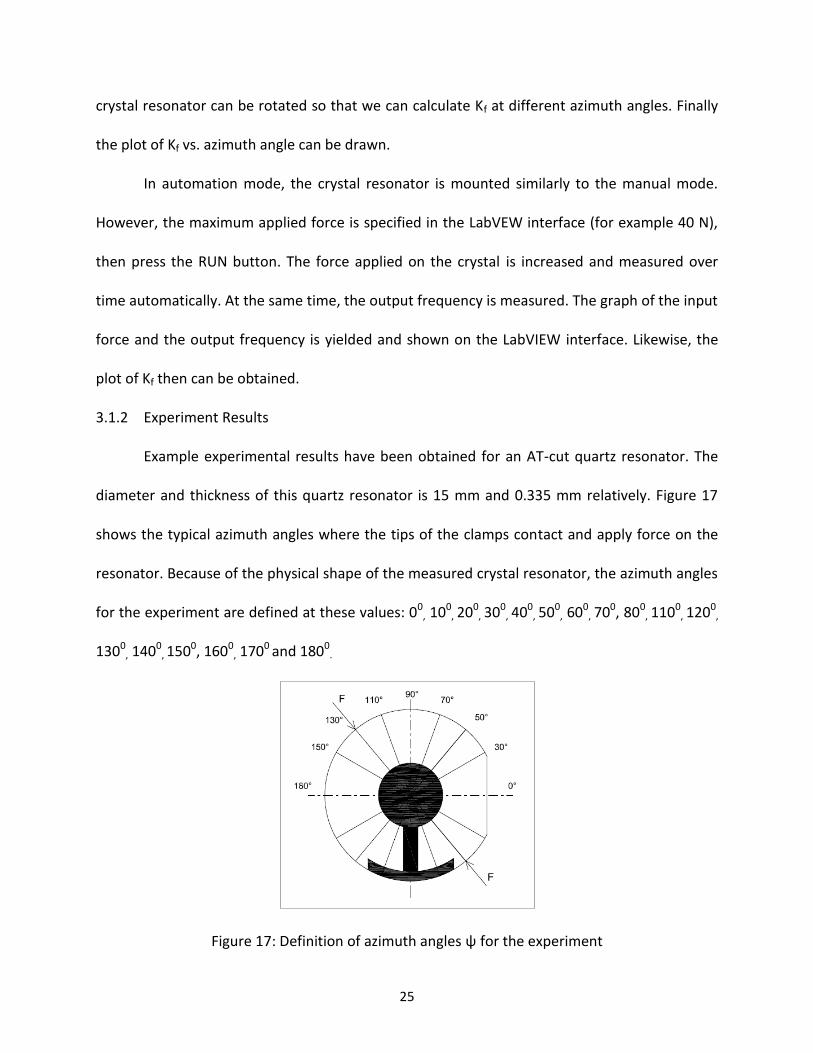
Example experimental results have been obtained for an AT-cut quartz resonator. The
diameter and thickness of this quartz resonator is 15 mm and 0.335 mm relatively. Figure 17
shows the typical azimuth angles where the tips of the clamps contact and apply force on the
resonator. Because of the physical shape of the measured crystal resonator, the azimuth angles
for the experiment are defined at these values: 00, 100
, 200, 300
, 400, 500
, 600, 700, 800
, 1100, 1200
,
1300, 1400
, 1500, 1600, 1700
and 1800.
Figure 17: Definition of azimuth angles ψ for the experiment

26
The graph in Figure 18 shows force-frequency graph obtained from LabVIEW at
aforementioned azimuth angles. The linear relation between force and frequency is found from
the graph. The force-frequency relation is measured when the force is increased and
decreased. The hysteresis error is small when using the designed apparatus. The force
sensitivity coefficients Kf are calculated based on formula (2) and plotted in Figure 19. This
result shows a good agreement with peers’ measurement results in [12], [14], [15].
Figure 18: Force-frequency relation graph at different azimuth angles ψ obtained from LabVIEW

27
Figure 19: The curve Kf of a quartz resonator from the experiment vs. peer’s curve Kf
3.2 Pressure Sensor Housing Design
3.2.1 Operation Principle of the Presssure Sensor
The mounting box is comprised of two circular caps. The AT-cut quartz crystal resonator
is placed inside box. When a air pressure at the inlet exists, the diaphragm will deform and
apply force on the crystal through the upper cap of the box. This will then create the force-
frequency effect on the crystal resonator. Based on the frequency shift relative to the applied
force on the crystal, we can measure the relative inlet pressure of the environment. To
compensate temperature affection on the accuracy of the pressure measurement, one crystal
resonator is excited at fundamental frequency and 3rd overtone mode simultaneously. The
diameter of the used AT-cut quartz crystal resonator is 0.591 inch, the thickness is 0.015 inch
and the resonance frequency is 5.297 MHz.

28
3.2.2 Preliminary Design by CAD (Computer Aided Design) Software
The material of the diaphragm can be quartz [36] or stainless steel. The stainless steel
303 is used in the proposed sensor since this material can resist corrosion especially in a
corrosive medium such as gas, oil environment, and this material is also durable and has good
machinability.
To minimize the mounting and acceleration effects on frequency stability, the location
of the mounting points of the crystal resonator where the force-frequency coefficient Kf =0
needed to be identified. Based on the results of the experiment and the graph of Kf [30], we can
identify suitable positions to mount the crystal resonator. Figure 20 illustrates typical mounting
methods of the crystal resonator.
Figure 20: Mounting methods for TSMR using either a two-point mount or a three or four-point
mount [21]

29
Figure 21 shows a section view of the sensor. The part including a diaphragm is
assembled with the housing by thread. The opposite side of this housing is the crystal holders
(two end caps) that keep the crystal inside. The conencting nut connects the housing of the
crystal holders and the housing of the oscillator circuit.
Figure 21: Dimensions and section view of the pressure sensor
Figure 22 shows detailed view of the crystal area and the view of the air pressure inlet.
One end cap of the crystal holder has a pin that goes through the middle wall of the housing
and contacts the diaphragm. When there is air pressure in the inlet, the diaphragm is bended
and it pushes the pin of the crystal holer. Hence, the crystal is compressed by a diametric force,
the frequency of the crystal is shifted. Based in this signal, the air pressure of the inlet can be
determined. View B in Figure 22 show the hexagon nut which is hollow so that air pressure can
go inside and the nut can be rotated to assemble with the housing.
Figure 22: Detailed view and side view B of the pressure sensor
30
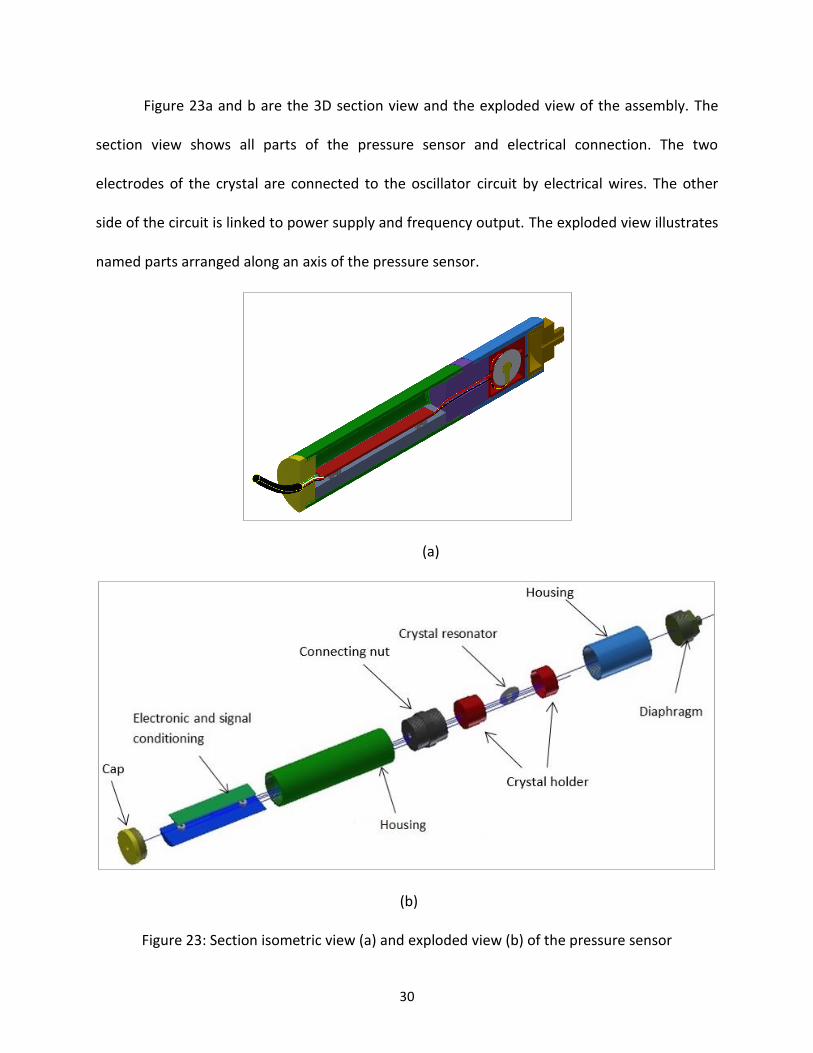
Figure 23a and b are the 3D section view and the exploded view of the assembly. The
section view shows all parts of the pressure sensor and electrical connection. The two
electrodes of the crystal are connected to the oscillator circuit by electrical wires. The other
side of the circuit is linked to power supply and frequency output. The exploded view illustrates
named parts arranged along an axis of the pressure sensor.
(a)
(b)
Figure 23: Section isometric view (a) and exploded view (b) of the pressure sensor

31
3.2.3 Finite Element Analysis (FEA) of the Pressure Sensor
The COMSOL Multiphysics software is used to perform finite element simulation on the
designed pressure sensor. The assembly including the diaphragm, two caps and the crystal
resonator is analyzed. The 3D model of this assembly is imported to the COMSOL in STEP file
format. The details of the finite element analysis of the assembly are described as follows:
First, the model is divided into 4 subdomains as shown in Figure 24. The materials for
those subdomains are also selected: The material for highlighted subdomains in Figure 24a, c,
and d is stainless steel. In Figure 24b, the material for the highlighted subdomain is quartz, and
the material type of this subdomain is anisotropic. Also, the force direction applied on the
crystal is parallel with the X axis of the model and the crystal.
(a) (b)
(c) (d)
Figure 24: Subdomains (a, b, c, d) of the analyzed assembly model

32
Next, the boundary conditions are applied for the model. There are total 72 boundaries
in the analyzed model as indicated in COMSOL. The highlighted boundaries as shown in Figure
25a, b, c are fixed boundary. A distributed load from 10,000 Pa to 490,000 Pa with increment
30,000 Pa is applied on the inner surface of the diaphragm which is highlighted in Figure 25d.
The remaining boundaries are set as free (not constrained) boundaries.
(a) (b)
(c) (d)
Figure 25: Boundaries (a, b, c, d) of the analyzed assembly model
33
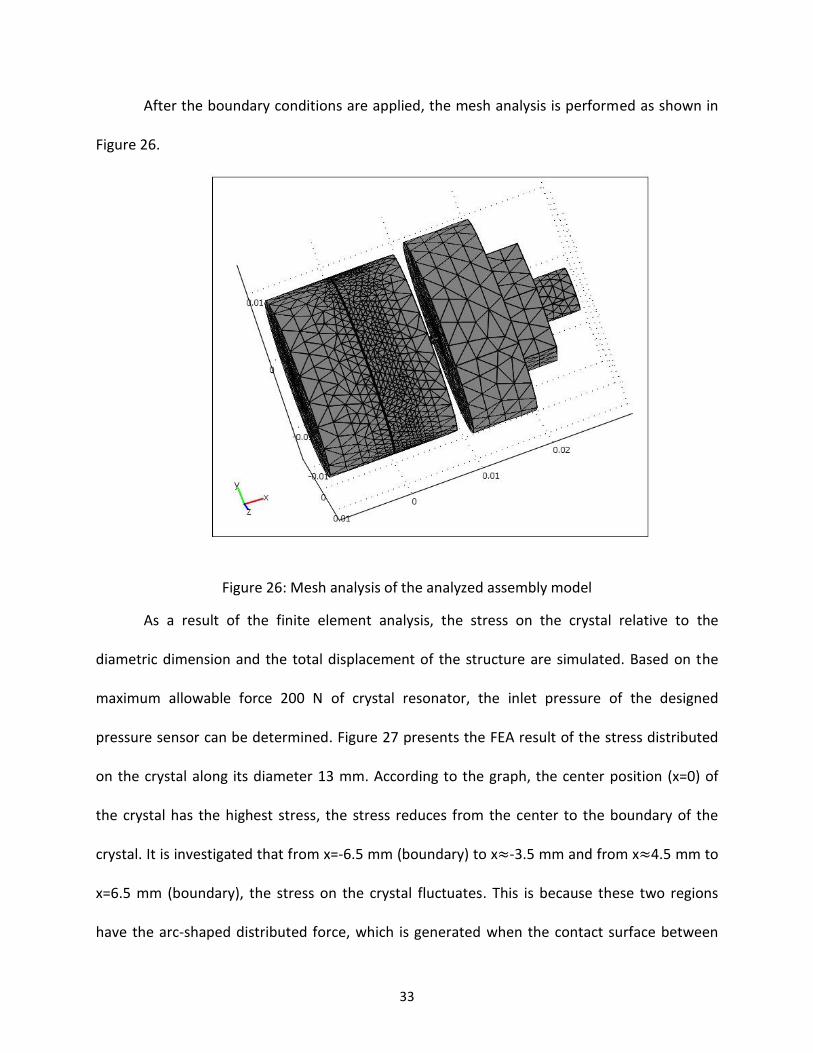
After the boundary conditions are applied, the mesh analysis is performed as shown in
Figure 26.
Figure 26: Mesh analysis of the analyzed assembly model
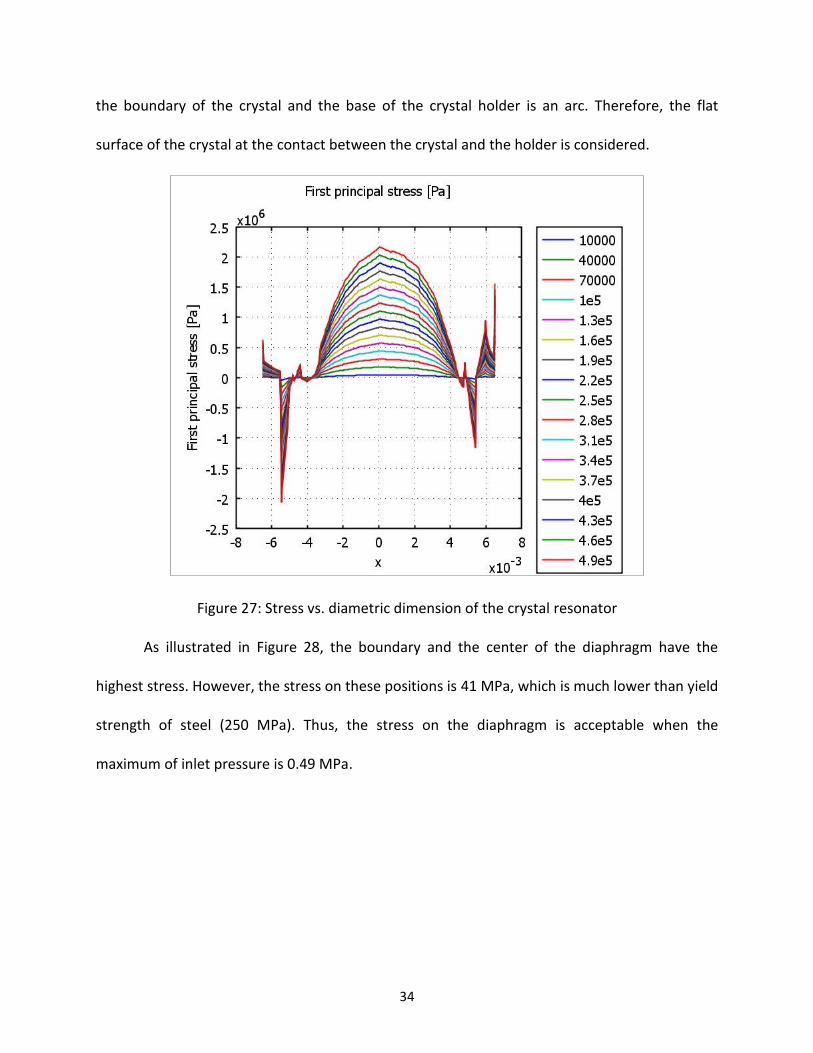
As a result of the finite element analysis, the stress on the crystal relative to the
diametric dimension and the total displacement of the structure are simulated. Based on the
maximum allowable force 200 N of crystal resonator, the inlet pressure of the designed
pressure sensor can be determined. Figure 27 presents the FEA result of the stress distributed
on the crystal along its diameter 13 mm. According to the graph, the center position (x=0) of
the crystal has the highest stress, the stress reduces from the center to the boundary of the
crystal. It is investigated that from x=-6.5 mm (boundary) to x≈-3.5 mm and from x≈4.5 mm to
x=6.5 mm (boundary), the stress on the crystal fluctuates. This is because these two regions
have the arc-shaped distributed force, which is generated when the contact surface between
34
the boundary of the crystal and the base of the crystal holder is an arc. Therefore, the flat
surface of the crystal at the contact between the crystal and the holder is considered.
Figure 27: Stress vs. diametric dimension of the crystal resonator
As illustrated in Figure 28, the boundary and the center of the diaphragm have the
highest stress. However, the stress on these positions is 41 MPa, which is much lower than yield
strength of steel (250 MPa). Thus, the stress on the diaphragm is acceptable when the
maximum of inlet pressure is 0.49 MPa.

35
Figure 28: FEA result of stress on a diametric section of the assembly model
Figure 29 shows displacement of the assembly. The highest displacement, which is
2.086 x 10⁻⁶ m, occurs near the center of the diaphragm. Nonetheless, this value is small and
acceptable.
Figure 29: FEA result of displacement on the assembly model

36
Figure 30 demonstrates displacement on a diametric section of the assembly model. The
magnitude of the displacement reduces from the diaphragm to the crystal.
Figure 30: FEA result of displacement on a diametric section of the assembly model
Table 1 presents the data achieved from FEA on the inlet pressure and the response
stress on the crystal. From the result of stress, the force applied on the crystal is calculated.
Since the maximum applied force on the crystal is 200 N, based on the table 1, the
corresponding maximum inlet pressure is 340,000 Pa = 49.31 Psi. The pressure value to be used
in the pressure measurement experiment should be less than the maximum value considering
the safety factor. Therefore, this value is 45 psi. The graph in Figure 31 represents linear
relationship between the inlet pressure and force applied on the crystal.

37
Table 1: Maximum Force Applied on Crystal
Figure 31: Linear relationship between the inlet pressure and force applied on the crystal
0 1 2 3 4
x 105
0
50
100
150
200
250
Pressure inlet (Pa)
Fo
rce a
pp
lied
on
cry
sta
l (N
)
Pressure inlet vs. Force applied on crystal

38
3.3 3D Printing Prototype
The 3D printer prototype is produced and used for the experiment before fabricating
the stainless steel pressure sensor as shown in Figure 32. The material of the prototype is ABS
plastic. The STL files of the 3D models are sent to 3D printer machine for manufacture. Because
of the accuracy of the 3D printing machine to be used, the tolerance of the 3D models is
0.007 inch to ensure the fitness when assembling the plastic parts.
The experiment on the 3D printer prototype has been performed. The purpose of the
experiment is to verify the linear relationship between applied force and the frequency output
when the crystal resonator is mounted in the prototype.
Figure 32: Prototype of the pressure sensor fabricated by a 3D printer
3.4 Experiment on 3D Printing Prototype
The crystal used in the experiment is AT-cut quartz crystal, its diameter and thickness is
13 mm and 0.66 mm relatively, and the resonance frequency is 2.5 MHz. Figure 33a shows the
mounting and electrical connection of the crystal. Figure 33b indicates the fundamental
frequency graph of the crystal when mounted on the two caps and before applying force. To

39
reduce noise, damping and yield good result, the Keysight Network Analyzer E5061B was used
in the experiment. After the crystal is mounted on the box, the two electrodes are connected to
Keysight NA).
(a) (b)
Figure 33: (a) Mounting and electrical connection of the crystal, and (b) Fundamental resonance
frequency graph of the crystal when the applied force is 0 N
Figure 34a shows the connection of the crystal and the mounting of the box on the
apparatus. By rotating the lead-screw, the applied force on the box is increased from 0 N to
45 N with 5 N increment. The output frequency is measured relatively by the network analyser.
The force-frequency relation is found linear although this relation is not perfect (Figure 34b).
Also, the frequency is increased when the applied force is increased. The imperfection of the
linear relation is because of the accuracy of the manufactured prototype, the damping and
noise affection. The force-frequency measurement has been repeated three times. Table 2 is
the data of the applied force and response frequency of the experiment used for the
graph in Figure 34b.

40
Force (N) 0 5 10 15 20 25 30 35 40 45
Freq. (MHz)
2.5
19
08
0
2.5
19
12
5
2.5
19
15
6
2.5
19
18
8
2.5
19
25
0
2.5
19
28
1
2.5
19
31
3
2.5
19
37
5
2.5
19
40
6
2.5
19
43
2
Table 2: Force-Frequency Relation
(a) (b)
Figure 34: (a) Force applied on the box, (b) Force-frequency graph
3.5 Design and Fabrication of Pressure Sensor with Stainless Steel Housing
The material of the proposed pressure sensor is stainless steel 303 as this material has
good points as mentioned previously. Figure 35 and 36 show views of the assembly of the
designed pressure sensor and Figure 37 indicates a bill of material of the pressure sensor.
Appendix A includes the desgin drawings of the pressure sensor.
0 10 20 30 402.519
2.5191
2.5192
2.5193
2.5194
2.5195
2.5196
Force (N)
Fre
qu
en
cy (
MH
z)
Force vs. Frequency
y = 8e-06*x + 2.5
Frequency
linear

41
Figure 35: Section view of the assembly of the designed pressure sensor
Figure 36: Detail views of the assembly of the designed pressure sensor
Figure 37: Bill of material of pressure sensor assembly

42
As shown in Figure 38, the AT-cut quartz crystal resonator is mounted on the stainless
steel lower cap, the two electrodes of the crystal are connected to electric wires by two spring
coils. These wires will be connected with the designed crystal oscillator circuit.
Figure 38: Mounted crystal on one end cap (holder)
Figure 39 is the exploded view illustrating all parts of the pressure sensor. The design of
the stainless steel parts are finalized and then fabricated after the FEA, 3D printing prototype,
and experiments are performed. Figure 40 presents a final assembled stainless steel product.
Figure 39: Stainless steel pressure sensor final assembly

43
Figure 40: Final assembly of the pressure sensor with stainless steel housing
3.6 Experiment on Pressure Sensor with Stainless Steel Housing
Initially, the electrical connection and the resonance frequency of the quartz crystal
resonator mounted on the lower end cap are verified from the experiment. The set up diagram
of the experiment is shown in Figure 41. Figure 42 shows the frequency graph and the
resonance frequency of the mounted crystal 5.26 MHz when the applied force on the
crystal is 0 N.
Figure 41: Diaphragm of the resonance frequency measurement

44
Figure 42: Resonance frequency measurement on mounted crystal
In next steps, the crystal is assembled in the mounting box and the housing for pressure
testing. The inlet of the diaphragm is connected to pneumatic source. The inlet air pressure is
provided from 0 psi to 45 psi with 5 psi increment. Figure 43 and 44 are schematic and pictorial
diagram for the pressure measurement respectively. The input (diaphragm inlet) of the
pressure senor is connected to air pressure source and the its output is connected to the
frequency counter and the oscilloscope to check the resonance frequency shift and the graph of
the sine wave form of the relative frequency. The pressure sensor is supplied with 3.7 VDC. This
means the input of the oscillator circuit of the pressure sensor is connected to 3.7 VDC.
Figure 43: Schematic diaphragm of the pressure measurement experiment setup

45
Figure 44: Pictorial diaphragm of the pressure measurement experiment setup
Figure 45 shows a sine wave form of the output on the oscilloscope and the relative
resonance frequency on the frequency counter. The crystal resonator is connected to the circuit
as illustrated in Figure 46.
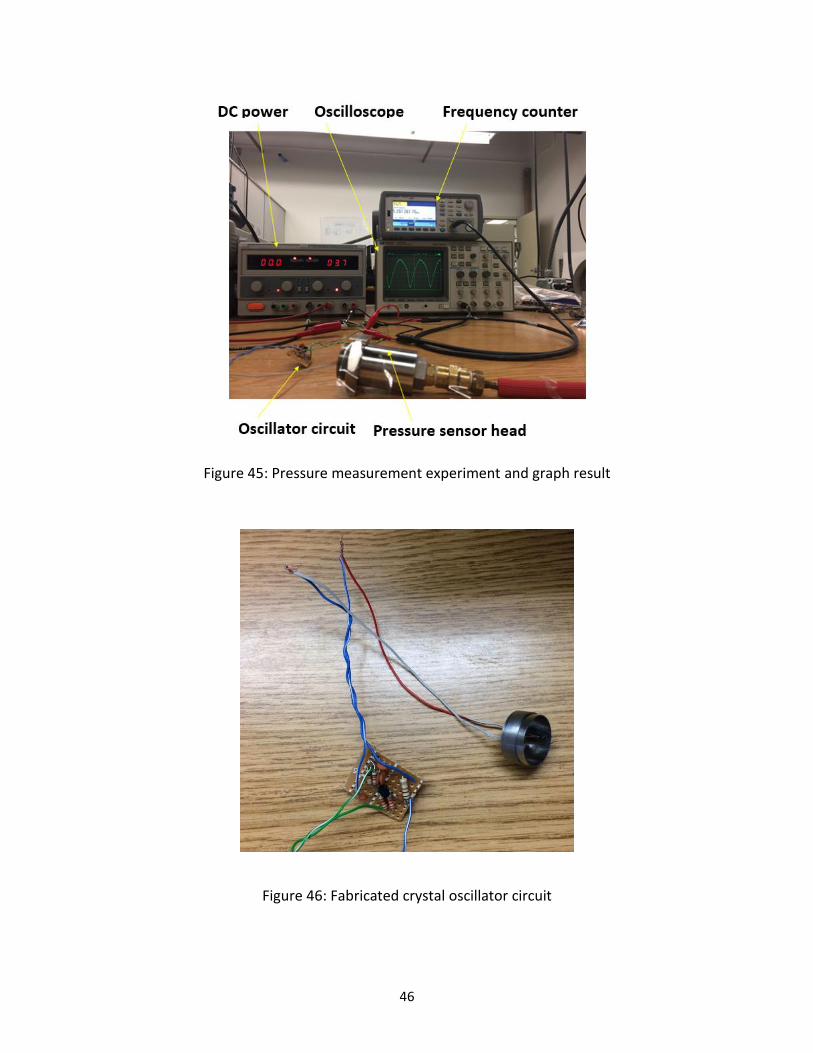
46
Figure 45: Pressure measurement experiment and graph result
Figure 46: Fabricated crystal oscillator circuit

47
The graph in Figure 47 is the result of the pressure measurement experiment on the
pressure sensor. The graph shows good linear relationship between the inlet (pressure) and the
outlet (frequency).
Figure 47: Pressure measurement result of the designed pressure sensor
3.7 Crystal Oscillator Circuit Design
Dual-mode crystal resonator circuit probes the resonator with the superposition of two
harmonic modes simultaneously. It excites crystal resonator in fundamental mode and third
overtone mode [37]. The thesis focuses on the circuit that can excite the crystal resonator in
fundamental harmonic mode and experiments based on this circuit. The crystal oscillator circuit
is desgined to excite the AT-cut quartz crystal resonator at its fundamental resonance
frequency and send the frequency signal to the output of the circuit. The input power supply
0 10 20 30 405.2966
5.2967
5.2968
5.2969
5.297
5.2971
5.2972
5.2973x 10
6
Pressure (psi)
Fre
qu
en
cy (
Hz)
Pressure vs. Frequency
48
for the circuit is +15 VDC. The electrical components are available and common commercial
parts. Figure 48 and 49 describe the details of the designed crystal oscillator circuit and the
fabricated circuit relatively.
Figure 48: Designed crystal oscillator circuit
Figure 49: Fabricated crystal oscillator circuit
3.8 Beat Frequency Experiment
As aforementioned, the beat frequency is between the fundamental frequency and the
third overtone frequency. Researches show that the relationship between the beat frequency
and the temperature is linear. Therefore, the temperature compensation in pressure
measurement can be enabled based on the beat frequency and temperature relation and the

49
microproccessor. In this research, the experiments on the beat frequency vs. temperature on
AT-cut quartz and LGS crystal resonator are performed.
Figure 50: Diagram of the experiment setup on temperature vs. frequency
Figure 50 shows a diagram of the experiment setup for the temperature vs. frequency
measurement and Figure 51 presents photos of the experiment. A furnace, KEYSIGHT E5016B
network analyzer, and LabVIEW on computer are connected through GPIB. The air flow in the
furnace can influence the measurement result when the flow contacts the crystal resonator
directly. For this reason, the crystal is mounted inside a ceramic box as shown in Figure 52 to
minimize the influence of the air flow.

50
Figure 51: Photos of the experiment set up for beat frequency vs. temperature
Figure 52: Crystal resonator mounting and connection in the ceramic box
In the experiment, the frequency vs. temperature relation of quartz and LGS are
measured at 1st and then 3rd harmonic mode of vibration. The temperature inside the furnace
is increased from room temperature to 500C. The LabVIEW program controls the temperature
and records the data of temperature and resonance frequency of the crystal. Also, the LabVIEW
controlled network analyzer program tracks the resonance frequency variation of the crystal
and yields a graph of resonance frequency vs. temperature.
51
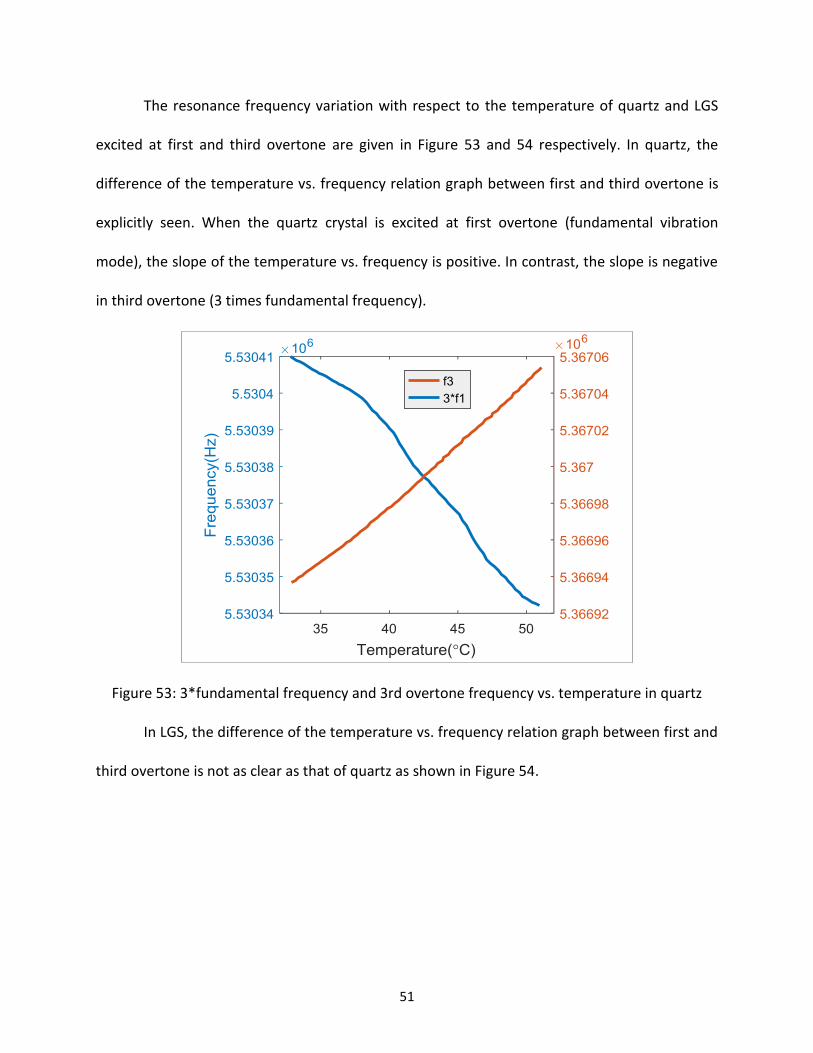
The resonance frequency variation with respect to the temperature of quartz and LGS
excited at first and third overtone are given in Figure 53 and 54 respectively. In quartz, the
difference of the temperature vs. frequency relation graph between first and third overtone is
explicitly seen. When the quartz crystal is excited at first overtone (fundamental vibration
mode), the slope of the temperature vs. frequency is positive. In contrast, the slope is negative
in third overtone (3 times fundamental frequency).
Figure 53: 3*fundamental frequency and 3rd overtone frequency vs. temperature in quartz
In LGS, the difference of the temperature vs. frequency relation graph between first and
third overtone is not as clear as that of quartz as shown in Figure 54.

52
Figure 54: 3*fundamental frequency and 3rd overtone frequency vs. temperature in LGS
The beat frequency variation with respect to temperature of quartz and LGS are
calculated and the graphs are drawn as described in Figure 55 and 56 respectively. From the
results, the linear relationship between beat frequency and temperature in quartz is verified.
Whereas, the relationship is not linear in LGS.
Figure 55: Beat frequency vs. temperature of quartz
25 30 35 40 45 50 552.3411
2.3411
2.3411
2.3411
2.3411x 10
6
Fre
qu
en
cy (
Hz)
25 30 35 40 45 50 557.0366
7.0367
7.0368
7.0369
7.037x 10
6
Temperature (C)
Fundamental mode
3rd mode
30 35 40 45 50 551.6325
1.633
1.6335
1.634
1.6345
1.635x 10
5
Temperature(C)
Beat
Fre
qu
en
cy(H
z)

53
Figure 56: Beat frequency vs. temperature of LGS
With the linear relationship found in quartz as shown in Figure 55, the temperature
compensation for the pressure measurement of quartz based pressure sensor can be
performed.
25 30 35 40 45 50 55-1.355
-1.35
-1.345
-1.34
-1.335
-1.33
-1.325x 10
4
Temperature(C)
Beat
freq
uen
cy(H
z)
54
CHAPTER 4
CONCLUSION AND FUTURE RESEARCH
The design, modeling, and experiment of a novel pressure sensor using a dual-mode AT-
cut quartz crystal resonator with beat frequency analysis based temperature compensation
technique have been accomplished. The combination of a compact design of the proposed
piezo crystal resonator structure and temperature compensation technique gives advantages
such as high accuracy, low cost, and good performance attributes. The use of a single dual-
mode crystal resonator to measure force and temperature simultaneously minimizes the
thermal lag problem which affects the accuracy of the pressure measurement. The FEA (Finite
Element Analysis) of the diaphragm and the crystal resonator are performed to verify the
design. A 3D printing prototype of the pressure sensor has been fabricated, and its
performance is verified through a force-frequency effect experiment using a designed
apparatus. In addition, a stainless steel pressure sensor and a crystal oscillator circuit have been
fabricated. The pressure measurement experiment performed on the stainless steel sensor
shows a good linear relationship between the input (pressure) and the output (frequency).
Future researches are the design and experiments on the all-LGS structure based pressure
sensor at high temperatures to find out the performance of this sensor at high temperatures.

55
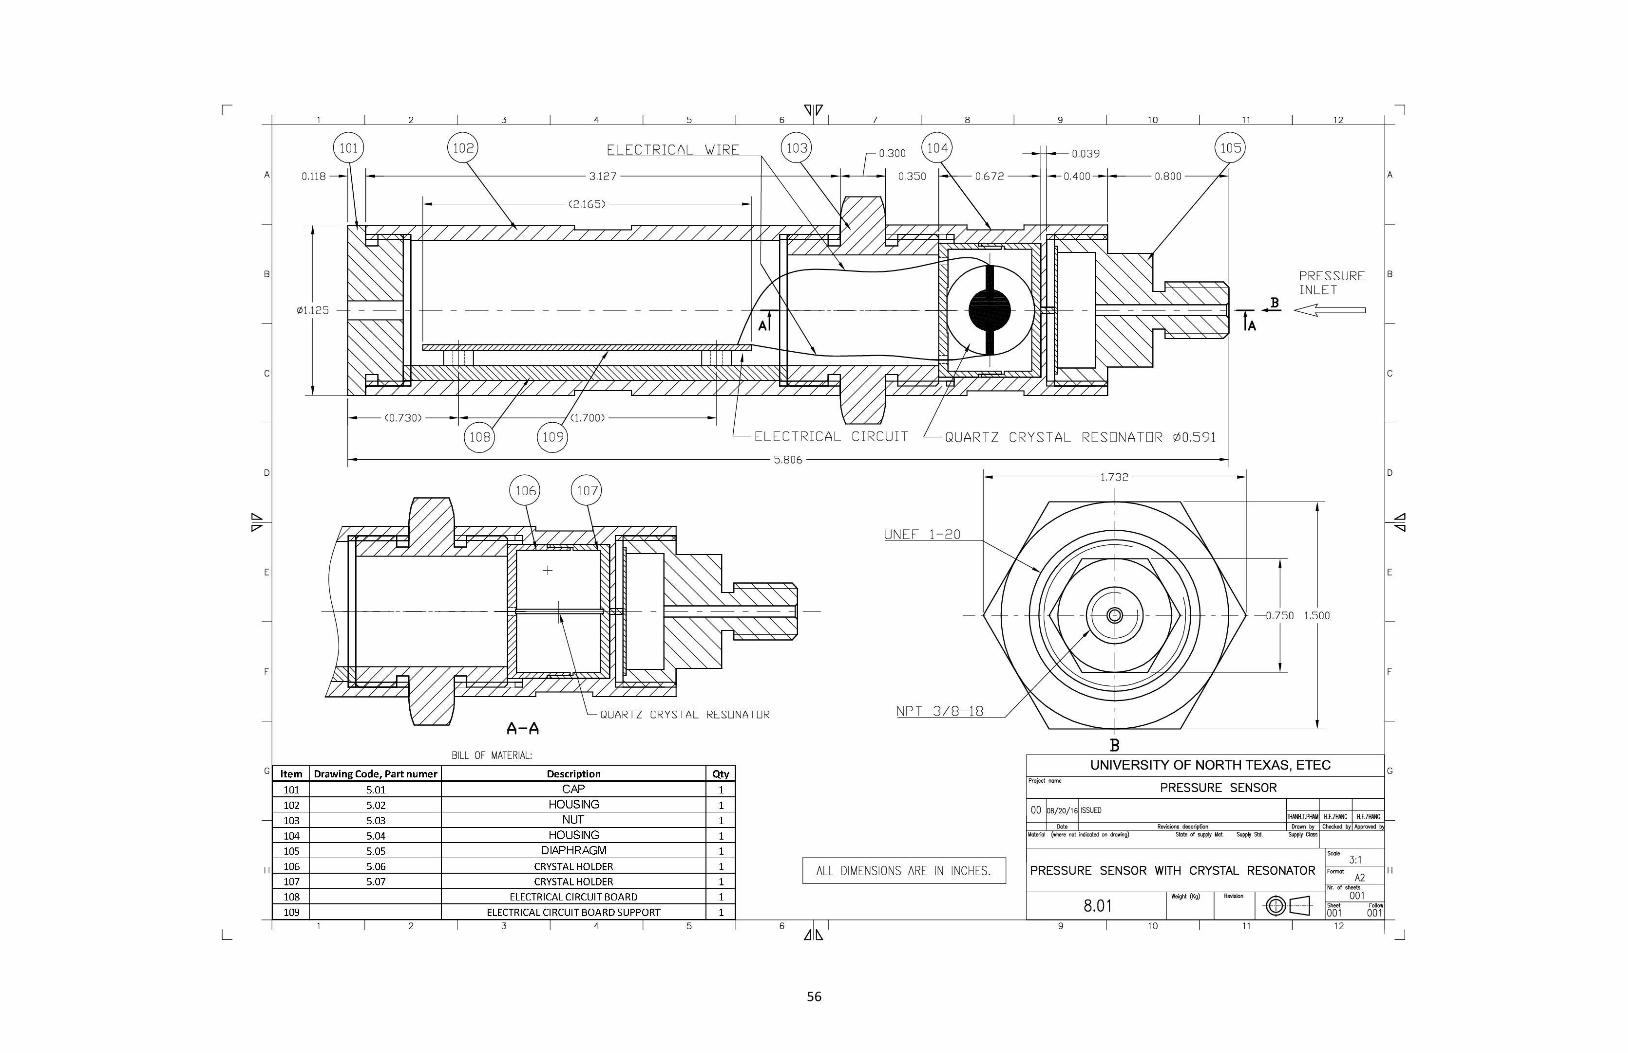
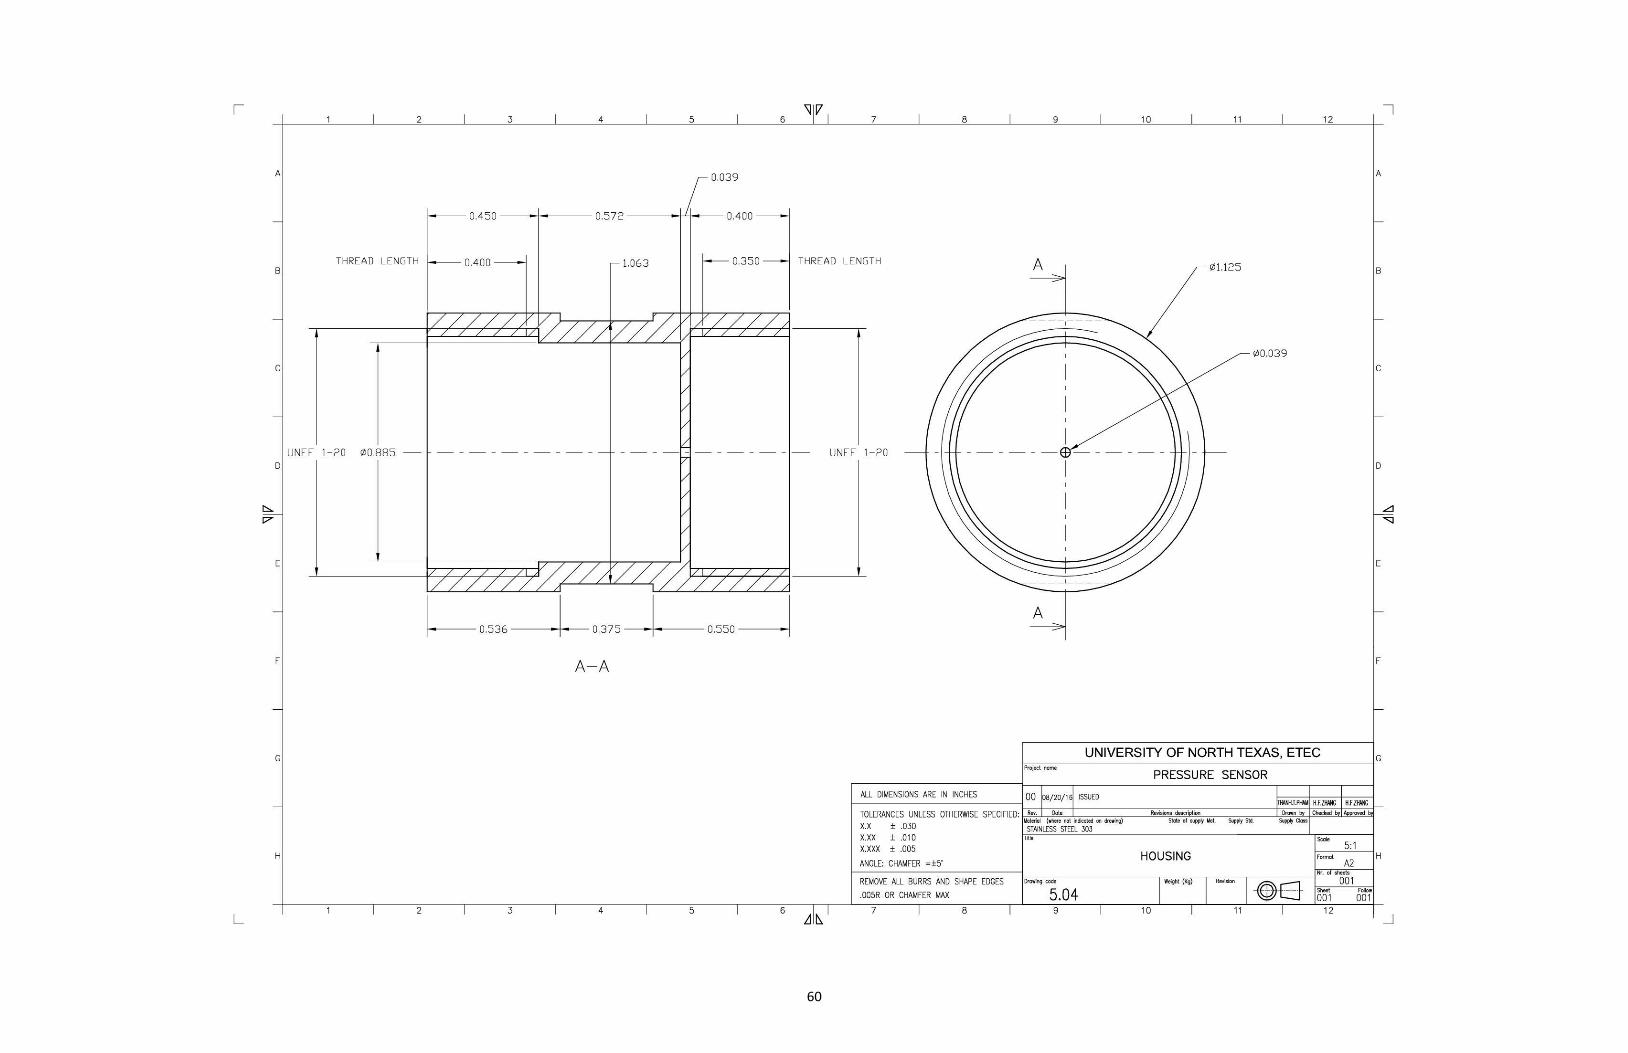
APPENDIX A
DESIGN DRAWINGS OF PRESSURE SENSOR
56
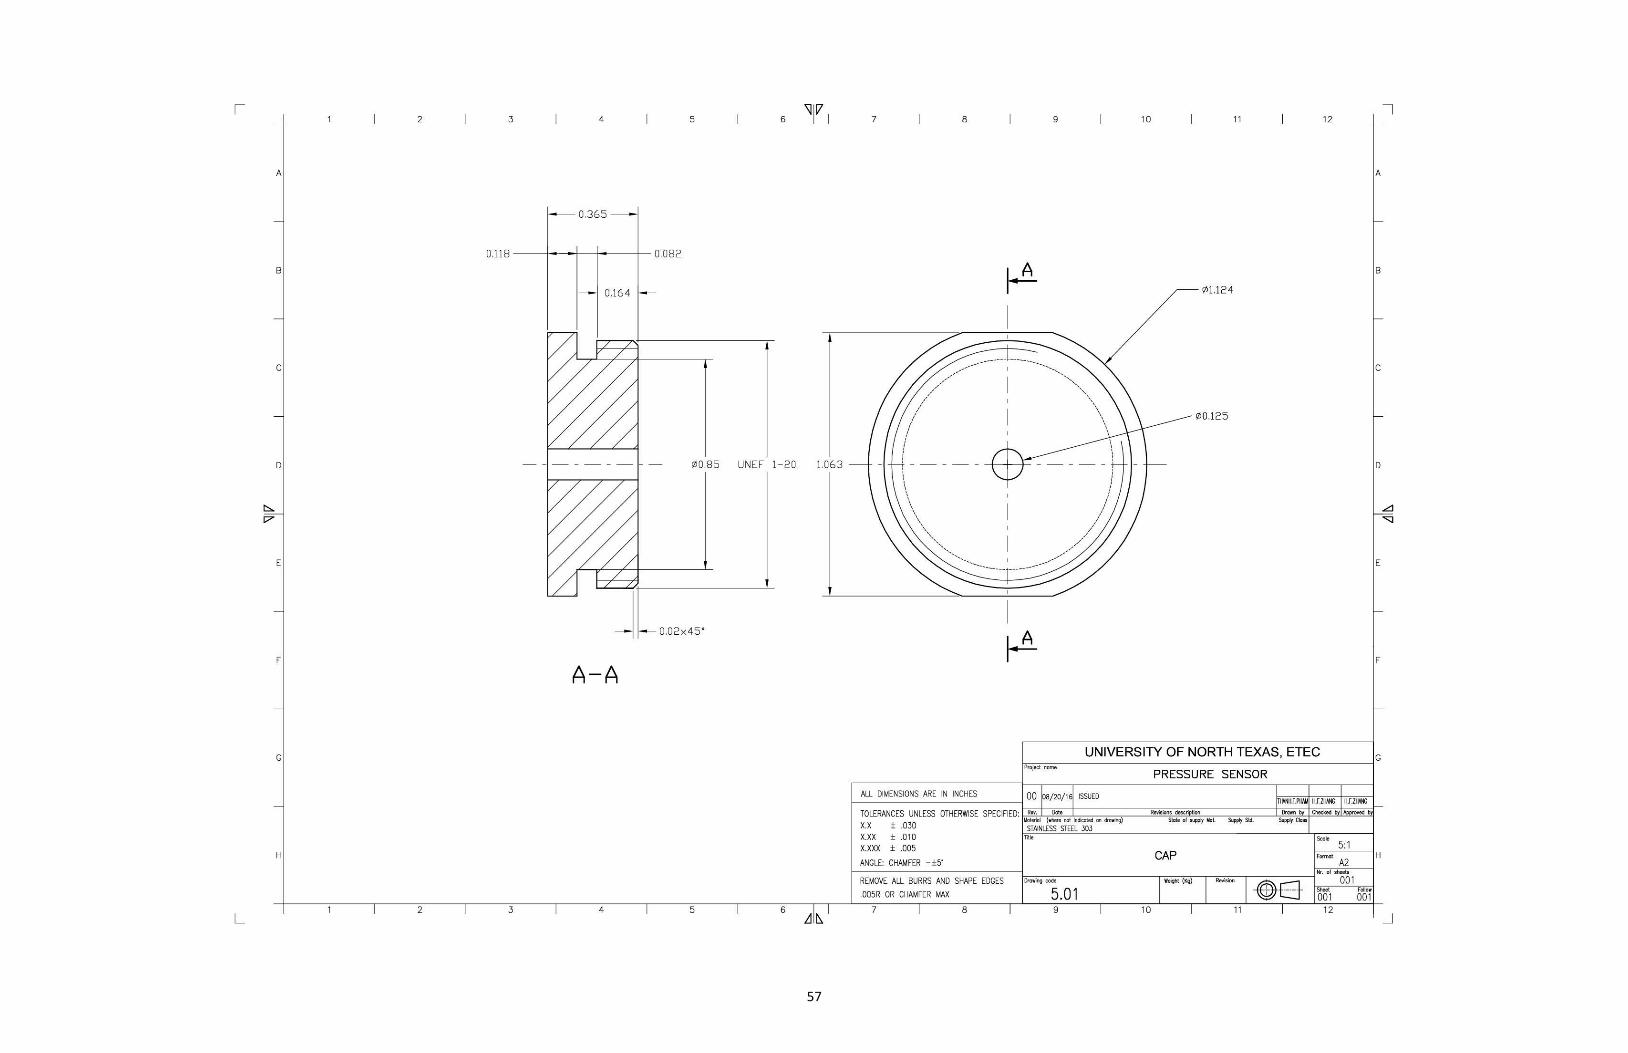
57

58

59
60

61

62

63

64
APPENDIX B
DESIGN DRAWINGS OF ALL-LANGASITE STRUCTURE
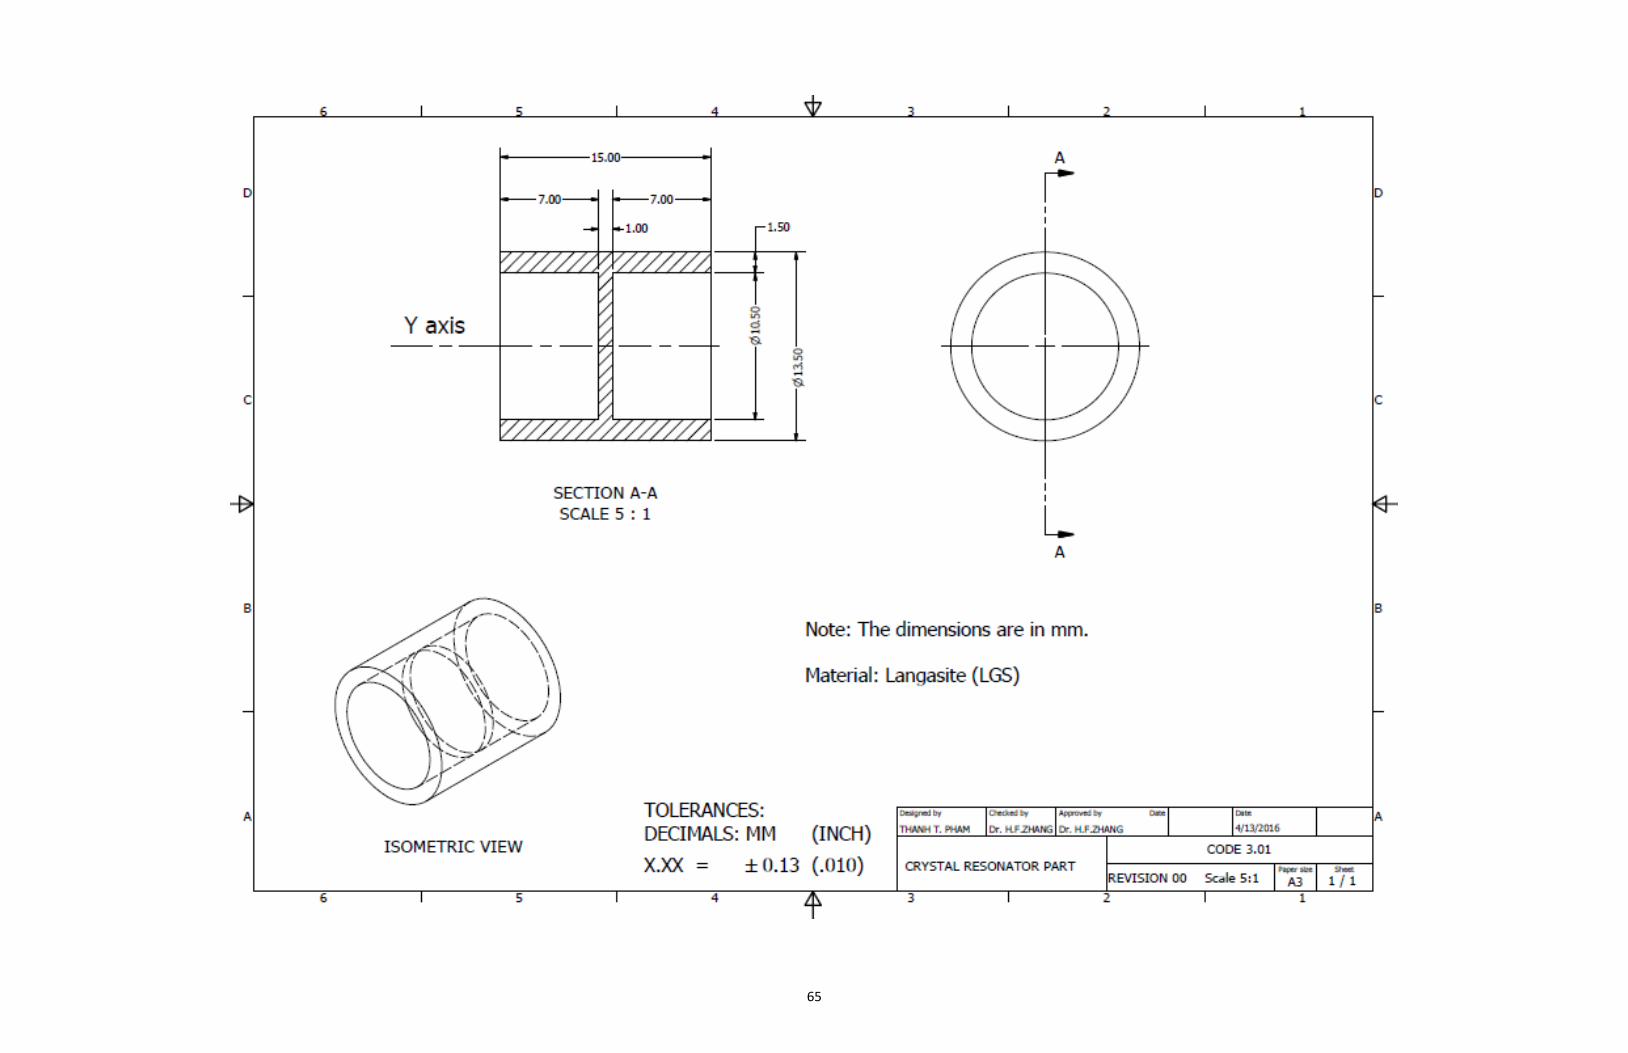
65
66

67
REFERENCES
[1] Quartzdyne, Inc., “Operation manual for Quartzdyne Digital Pressure Transducer,”
June 2012.
[2] John R. Vig., “Temperature-Insensitive Dual-Mode Resonant Sensors-A Review,” IEEE
Sensors Journal, Vol. 1, No. 1, June 2001.
[3] Zheyao Wang, Huizhong Zhu, Yonggui Dong and Guanping Feng, “ A thickness –Shear
Quartz Resonator Force Sensor With Dual-Mode Temperature Compensation,” IEEE
Sensors Journal, Vol.3, No.4, August 2003.
[4] F. Della Lucia, P. Zambrozi Jr., F. Frazatto, M. Piazzetta, A. Gobbi, “Design, fabrication and
characterization of SAW pressure sensors for offshore oil and gas exploration,”
Elsevier B.V. 2014.
[5] Haifeng Zhang, Benjamin D. Montz, Tinghui Fan and John A. Kosinski, “Wireless Langasite
Resonator as a Force Sensor,” IEEE 2012.
[6] Roger W. Ward & Robert B. Wiggins, “Quartz pressure transducer technologies,”
Quartzdyne,Inc, May 1997.
[7] Quartzdyne, Inc., “Transient performance of Quartzdyne pressure transducers,”
March 2003.
[8] Errol P. EerNisse, Robert B. Wiggins, “Review of Thickness-Shear Mode Quartz Resonator
Sensors for Temperature and Pressure,” IEEE sensors journal, June 2001.
[9] Errol P. EerNisse, “Quartz resonators vs their environment: Time base or sensor?,” The
Japan society of applied Physics, 2001.

68
[10] H. Edward, Jerry Leach, “A quartz resonator pressure transducer,” IEEE transactions on
industrial electronics and control instrumentation, Vol. IECI-16, No. 1. July 1969.
[11] R.J. Besson, J.J. Boy, B. Glotin, Y. Jinzaki, Bikash Sinha, M. Valdois, “A dual-mode thickness-
shear quartz pressure sensor,” IEEE transaction on ultrasonics, ferroelectrics, and
frequency control, vol.40, No. 5, September 1993.
[12] Yu-Ching Lin, Ayumi Asakura, Toshio Fukuda, Fumihoto Arai, “Design and fabrication of
miniaturized force sensor with quartz crystal resonators,” Proceedings of the IEEE/RSJ,
November 2007.
[13] Ayumi Asakura, Toshio Fukuda, Fumihito Arai, “Design, fabrication and characterization of
compact force sensor using AT-cut quartz crystal resonators,” IEEE/RSJ international
conference, September 2008.
[14] Keisuke Narumi, Toshio Fukuda Fumihito Arai, “Miniaturization and resolution
improvement of load sensor using AT-cut quartz crystal resonator,” IEEE SI
International 2009.
[15] F. Della Lucia, P. Zambrozi Jt., F. Frazatto, M. Piazzetta, A. Gobbi, “Design, fabrication and
characterization of SAW pressure sensors for offshore oil and gas exploration,”
Elsevier B.V. 2014.
[16] P. Dineva et al., “Dynamic Fracture of Piezoelectric Materials, Solid Mechanics and Its
Applications,” Springer International Publishing Switzerland 2014.
[17] David Salt, “Hy-Q handbook of quartz crystal devices,” Van Nostrand Reinhold
(UK) Co. Ltd, 1987.

69
[18] Hewlett Packard company “Fundamentals of quartz oscillators, application note 200-2,”
May 1997.
[19] Mihir S. Patel, Bikash K. Sinha, “Stress and temperature compensated orientations for
thickness shear langasite resonators for high temperature and high pressure
environment,” IEEE transactions on ultrasonics, ferroelectrics, and frequency control, vol.
62, no. 6, June 2015.
[20] H. Zhang, J. A. Turner, J. S. Yang, and J. A. Kosinski, “Force-frequency effect of thickness
mode langasite resonators,” Utrasonics, 50, pp.479-490, 2010.
[21] John R. Vig, “Introduction to Quartz frequency standards,” Research and development
technical report SLCET-TR-92-1 (Rev.1), Army research laboratory, October 1992.
[22] C. Barthod, “New force sensor based on a double ended tuning fork,” in Proc. IEEE Int.
Frequency Control Symp., pp. 74-78, 2000.
[23] J. M. Ratajski, “Force-frequency coefficient of singly rotated vibrating quartz crystals,” IBM
J. Res. Dev., vol. 12, no. 1, pp. 92-99, 1968.
[24] A. Ballato, E. P. EerNisse, and T. Lukaszek, “The force-frequency effect in doubly rotated
quartz resonators,” in Proc. IEEE Int. Frequency Control Symp., pp. 8-16, 1977.
[25] E. P. EerNisse, “Temperature dependence of the force frequency effect for the
AT-, FC-, SC-, and rotated X-cuts,” in Proc. IEEE Ultrasonics Symp., pp. 426-430, 1980.
[26] J. J. Boy, R. J. Besson, E. Bigler, R. Bourquin, and B. Dulmet, “Theoretical and experimental
studies of the force-frequency effect in BAW LGS and LGT resonators,” in Proc. IEEE Int.
Frequency Control Symp., pp. 223-226, 2001.

70
[27] Y. Kim, A. Ballato, Force-frequency effect of Y-cut langanite and Y-cut langatate,” IEEE
Trans. Ultrason. Ferroelectr. Freq. Control, vol. 50, no. 12, pp. 1678-1682, 2003.
[28] J. M. Ratajski, “The force sensitivity of AT-cut quartz crystal,” 20th Annual Symp. on Freq.
Control, pp. 33-49, 1966.
[29] Thanh Tuong Pham, Haifeng Zhang, “A new apparatus for the measurement of force-
frequency effect of crystal resonators,” Measurement Journal, Volume 93,
pp. 524-528, 2016.
[30] J. M. Ratajski, “Force-frequency coefficient of singly rotated vibrating quartz crystals,” IBM
J. Res. Dev., vol. 12, no. 1, pp. 92-99, 1968.
[31] J. A. Kosinski, R. A. Pastore Jr., X. M. Yang, J. S. Yang, and J. A. Turner, “Stress-induced
frequency shifts in langasite thickness-mode resonators,” IEEE Transactions on Ultrasonics,
Ferroelectrics, and Frequency Control, vol. 56, no. 1, January 2009.
[32] Irina Mateescu, Jiri Zelenka, Jaroslav Nosek, Gary Johnson, “Frequency-Temperature
Characteristics of the Langasite Resonators,” IEEE Interational Frequency Control
Symposium and PDA Exhibition, 2001.
[33] Zheyao Wang, Huizhong Zhu, Yonggui Dong and Guanping Feng, “A temperature
insensitive quartz resonator force sensor,” Meas. Sci. Technol. 11 (2000) 1565-1569,
July 2000.
[34] Zheyao Wang, Huizhong Zhu, Yonggui Dong and Guanping Feng, “Development of a High-
Resolution Quartz Resonator Force and Weight Sensor With Increased Reliability,”
IEEE/ASME Transactions on Mechatronics, Vol. 9, No.2, June 2004.

71
[35] Lawrence D. Clayton and Errol P. EerNisse, “Quartz Thickness-Shear Mode Pressure
Sensor Designed For Enhanced Sensitivity,” IEEE Transactions on Ultrasonics,
Ferroelectrics, and Frequency control, Vol. 45, No. 5, Sep. 1998.
[36] Frische et al, “Vibrating quartz diaphragm pressure sensor,” Patent 4,479,070,
Oct. 23, 1984.
[37] Marco Ferrari and Vittorio Ferrari, “An oscillator circuit for dual-harmonic tracking of
frequency and resistance in quartz resonator sensor,” Measurement science and
technology 20 (2009) 124005 (11pp).