Embed Size (px)
Citation preview

NASA / TMm2001-210820 AIAA-2001-1058
Design and Integration of a Rotor Alone
Nacelle for Acoustic Fan Testing
Tony D. Shook, Christopher E. Hughes, William K. Thompson,
Paul F. Tavernelli, and Cameron C. Cunningham
Glenn Research Center, Cleveland, Ohio
Ashwin Shah
Sest, Inc., Middleburg Heights, Ohio
Prepared for the
39th Aerospace Sciences Meeting and Exhibit
sponsored by the American Institute of Aeronautics and Astronautics
Reno, Nevada, January 8-11, 2001
National Aeronautics and
Space Administration
Glenn Research Center
April 2001
https://ntrs.nasa.gov/search.jsp?R=20010049423 2020-03-30T12:40:23+00:00Z

Acknowledgments
The authors would like to thank Vic Canacci, Jose Gonsalez, Larry Heidelberg, Tony Herrmann, Gerald Hill,
Gene Pinali, Paul Steve, and Sam Yunis for their significant efforts in making the design and integration
of RAN possible.
Available from
NASA Center for Aerospace Information7121 Standard Drive
Hanover, MD 21076Price Code: A03
National Technical Information Service
5285 Port Royal Road
Springfield, VA 22100Price Code: A03
Available electronically at http://gltrs.grc.nasa.gov/GLTRS

DESIGN AND INTEGRATION OF A ROTOR ALONE NACELLE
FOR ACOUSTIC FAN TESTING
Tony D. Shook, Christopher E. Hughes, William K. Thompson,
Paul F. Tavemelli, and Cameron C. CunninghamNational Aeronautics and Space Administration
Glenn Research Center
Cleveland, Ohio 44135
Ashwin Shah
Sest, Inc.
Middleburg Heights, Ohio 44130
Abstract
A brief summary of the design, integration andtesting of a rotor alone nacelle (RAN) in NASA
Glenn's 9'x15' Low Speed Wind Tunnel (LSWT) ispresented. The purpose of the RAN system was to
provide an "acoustically clean" flow path within thenacelle to isolate that portion of the total engine system
acoustic signature attributed to fan noise. The RAN
design accomplished this by removing the stators thatprovided internal support to the nacelle. In its place,two external struts mounted to a two-axis positioning
table located behind the tunnel wall provided the
support. Nacelle-mounted lasers and a closed-loopcontrol system provided the input to the table to
maintain nacelle to fan concentricity as thermal andthrust loads displaced the strut-mounted fan. This
unique design required extensive analysis andverification testing to ensure the safety of the fanmodel, propulsion simulator drive rig, and facility,
along with experimental consistency of acoustic dataobtained while using the RAN system. Initial testing
was used to optimize the positioning system and
resulted in concentricity errors of+ 0.0031 inches in thehorizontal direction and +0.0035/--0.0013 inches in the
vertical direction. As a result of successful testing, the
RAN system will be transitioned into other acousticresearch programs at NASA Glenn Research Center.
Bacl_round
In recent years, NASA has aggressively
studied the noise characteristics of the fan bypass stagein modem turbofan engines. The objective was to
better understand and thus mitigate aircrat_ engine noisenear airports. Previous wind tunnel testing identified
potential noise reduction concepts that contributed
significantly to the successful achievement of theaggressive milestones in NASA's aircraft noise
reduction programs. However, further investigation ofthe noise generating mechanisms in turbofan engineswas needed if additional noise reduction was to be
achieved. The knowledge gained would lend itself to
developing novel technologies targeted at specific noiseareas. As a result, an experimental program called the
Source Diagnostic Test (SDT) was initiated to
investigate these noise generating mechanismsassociated with turbofan engines in the area of fanbroadband noise. The investigation was carried out in
the acoustically treated NASA Glenn 9'x15' LSWTusing the Ultra High Bypass (UHB) fan drive rig
(Fig. 1), an air turbine driven propulsion simulator. Thetest article was a 1/5-scale model of a current genera-
tion high-bypass turbofan engine.
The RAN project, part of the SDT testprogram, called for the development of an "acoustically
clean" flow path within the nacelle. Specifically, theinternal exit guide vanes, stators, or mounting struts that
contributed to the engine system acoustic signatureneeded to be removed. Previous acoustic research has
identified that a primary source of broadband noise in aturbofan engine is the fan wake interacting with the
downstream stators. By removing this farffstatorinteraction through elimination of the stators, the fan-only noise signature could be characterized, and the
NASAJTM--2001-210820 1
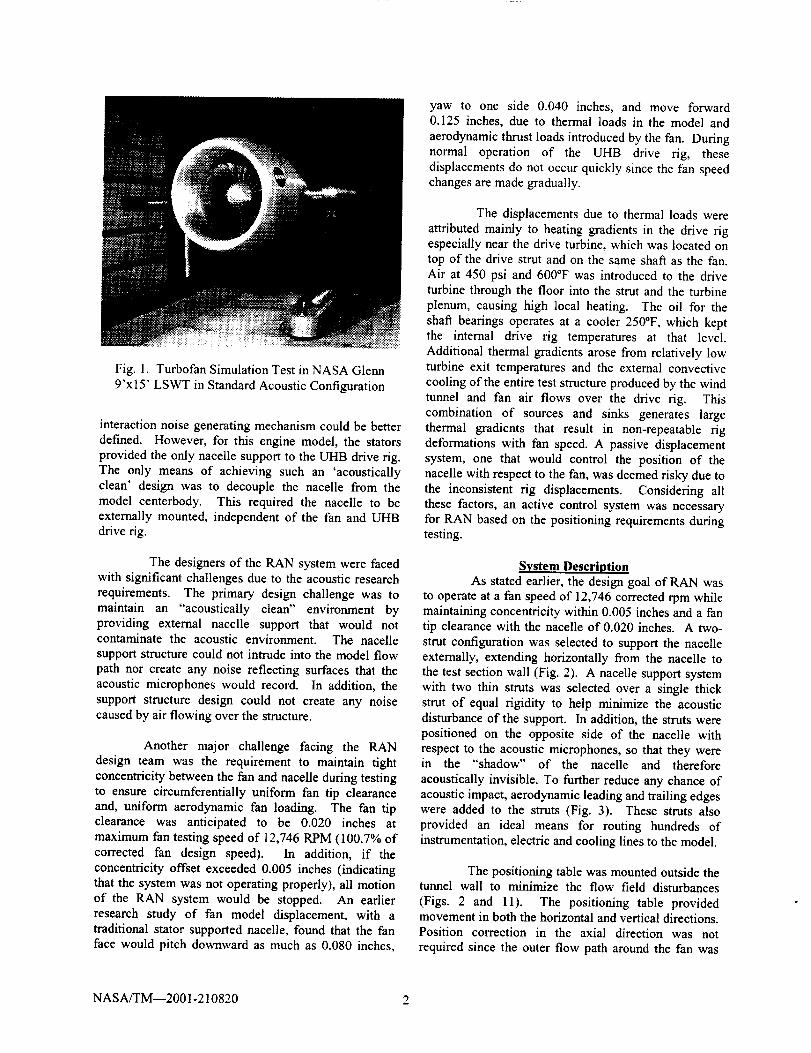
Fig.1. Turbofan Simulation Test in NASA Glenn
9'xl 5' LSWT in Standard Acoustic Configuration
interaction noise generating mechanism could be betterdefined. However, for this engine model, the stators
provided the only nacelle support to the UHB drive rig.
The only means of achieving such an 'acousticallyclean' design was to decouple the nacelle from themodel centerbody. This required the nacelle to beexternally mounted, independent of the fan and UHBdrive rig.
The designers of the RAN system were facedwith significant challenges due to the acoustic research
requirements. The primary design challenge was to
maintain an "acoustically clean" environment byproviding external nacelle support that would notcontaminate the acoustic environment. The nacellesupport structure could not intrude into the model flow
path nor create any noise reflecting surfaces that the
acoustic microphones would record. In addition, the
support structure design could not create any noisecaused by air flowing over the structure.
Another major challenge facing the RAN
design team was the requirement to maintain tightconcentricity between the fan and nacelle during testing
to ensure circumferentially uniform fan tip clearanceand, uniform aerodynamic fan loading. The fan tipclearance was anticipated to be 0.020 inches at
maximum fan testing speed of 12,746 RPM (100.7% ofcorrected fan design speed). In addition, if the
concentricity offset exceeded 0.005 inches (indicatingthat the system was not operating properly), all motion
of the RAN system would be stopped. An earlierresearch study of fan model displacement, with atraditional stator supported nacelle, found that the fan
face would pitch downward as much as 0.080 inches,
yaw to one side 0.040 inches, and move forward0.125 inches, due to thermal loads in the model and
aerodynamic thrust loads introduced by the fan. Duringnormal operation of the UHB drive rig, these
displacements do not occur quickly since the fan speedchanges are made gradually.
The displacements due to thermal loads were
attributed mainly to heating gradients in the drive rigespecially near the drive turbine, which was located ontop of the drive strut and on the same shaft as the fan.
Air at 450 psi and 600°F was introduced to the drive
turbine through the floor into the strut and the turbine
plenum, causing high local heating. The oil for the
shaft bearings operates at a cooler 250°F, which keptthe internal drive rig temperatures at that level.
Additional thermal gradients arose from relatively lowturbine exit temperatures and the external convective
cooling of the entire test structure produced by the windtunnel and fan air flows over the drive rig. This
combination of sources and sinks generates large
thermal gradients that result in non-repeatable rigdeformations with fan speed. A passive displacementsystem, one that would control the position of the
nacelle with respect to the fan, was deemed risky due tothe inconsistent rig displacements. Considering all
these factors, an active control system was necessary.for RAN based on the positioning requirements duringtesting.
System DescriptionAs stated earlier, the design goal of RAN was
to operate at a fan speed of 12,746 corrected rpm whilemaintaining concentricity within 0.005 inches and a fantip clearance with the nacelle of 0.020 inches. A two-
strut configuration was selected to support the nacelleexternally, extending horizontally from the nacelle to
the test section wall (Fig. 2). A nacelle support systemwith two thin struts was selected over a single thick
strut of equal rigidity to help minimize the acousticdisturbance of the support. In addition, the struts werepositioned on the opposite side of the nacelle with
respect to the acoustic microphones, so that they werein the "shadow" of the nacelle and therefore
acoustically invisible. To further reduce any chance of
acoustic impact, aerodynamic leading and trailing edgeswere added to the struts (Fig. 3). These struts alsoprovided an ideal means for routing hundreds of
instrumentation, electric and cooling lines to the model.
The positioning table was mounted outside thetunnel wall to minimize the flow field disturbances
(Figs. 2 and l 1). The positioning table providedmovement in both the horizontal and vertical directions.Position correction in the axial direction was not
required since the outer flow path around the fan was
NASA/TM--2001-210820 2
FRONT VIEW
FmModelCenterbody
Drh, e Rig Support strut
TOP VIEW
Air Turb_m¢ Drive Rig
_rms (2)
Fig. 2. Front and Top View of RAN Configuration
for 9' x 15' LSWT
were selected to maximize stiffness. A five horsepower
servomotor with a 100:1 gearbox drives a zero
backlash, preloaded, ball screw on each axis. Four
electric brakes, one on each ball screw shaft and one
integral to each servomotor, were used to hold table
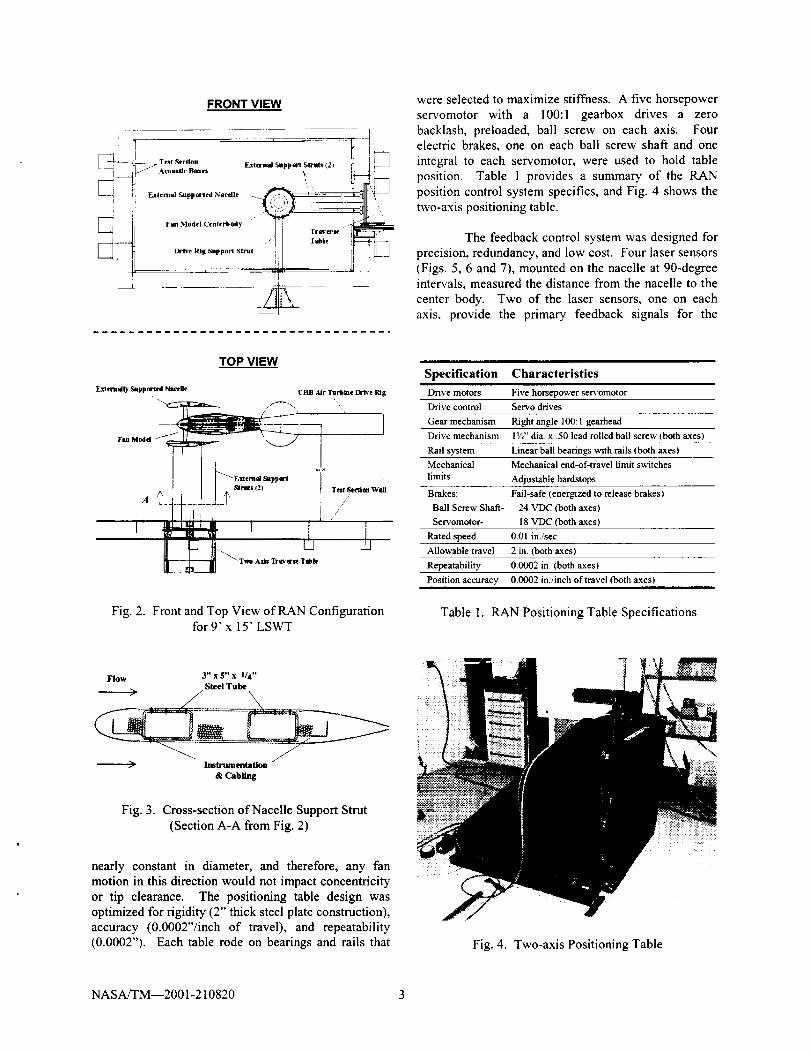
position. Table 1 provides a summary of the RAN
position control system specifics, and Fig. 4 shows the
two-axis positioning table.
The feedback control system was designed for
precision, redundancy, and low cost. Four laser sensors
(Figs, 5, 6 and 7), mounted on the nacelle at 90-degree
intervals, measured the distance from the nacelle to the
center body. Two of the laser sensors, one on each
axis, provide the primary feedback signals for the
Specification Characteristics
Drive motors Five horsepower servomotor
Drive control Servo drives
Gear mechanism Right angle 100:1 gearheadDrive mechanism 1%" alia. x .50 lead rolled ball screw (both axes)
Rail system Linear ball bearings with rails (both axes)Mechanical Mechanical end-of-travel limit switches
limits Adjustable hardstops
Brakes: Fail-safe (energized to release brakes)
Ball Screw Shaft- 24 VDC (both axes)
Servomotor- 18 VDC (both axes)
Rated speed 0.01 in./sec
Allowable travel 2 in. (both axes)
Repeatability 0.0002 in. (both axes)
Position accuracy 0.0002 in./inch of travel (both axes)
Table 1. RAN Positioning Table Specifications
Flow Y' x 5" x I/4"
Steel Tube
---_ Instrumentation
& Cabling
Fig. 3. Cross-section of Nacelle Support Strut
(Section A-A from Fig. 2)
nearly constant in diameter, and therefore, any fan
motion in this direction would not impact concentricity
or tip clearance. The positioning table design was
optimized for rigidity (2" thick steel plate construction),
accuracy (0.0002"/inch of travel), and repeatability
(0.0002"). Each table rode on bearings and rails that Fig. 4. Two-axis Positioning Table
NASA/TM--2001-210820 3

positioning table control system; the other two lasersensors were independent backups. The system waslater modified during testing by averaging the laser
sensor signals to allow more accurate positioning of thenacelle and reduce the positioning deadband, l Spaceconstraints dictated that the lasers could not be mounted
with the beams directed radial; consequently, both the
source and scatter signals were deflected 90 ° via
polished aluminum mirrors (Fig. 5). Bench testsconfirmed the validity of this approach. One inchdiameter flats were machined on the centerbody as
targets and were located 6.31" from their respectivemirror. Each laser sensor was enclosed in a sheet metal
housing that directed a cooling gas to maintain the laser
temperature below the manufacturer's limit of 120°F;beyond this the measurement drift would lead to
unacceptable position errors. The analog signals fromthe laser sensors were fed into a multi-purpose I/O card,
as were the discrete signals for each laser sensor alarm,
motor thermostats, axis faults and axis motionindicators. Discrete outputs from this card enabled
motion and placed the servo drives in manual orautomatic mode.
Fig. 8 shows the flowchart for the controlsystem. The positioning table control system consistedof two servomotors, one for each axis, and theircontrollers. The servomotor controllers executed
motion commands, tracked table position andcontrolled motor/shaft brakes. The controllersmaintained serial communication with a STD-bus based
microcomputer. The microcomputer sampled the laser
sensor signals, computed the position correctionrequired to achieve concentricity, and commanded theservomotor controllers to move the table accordingly.
The graphical user interface allowed an
operator to monitor and, if needed, operate the RAN
system during test activities (Fig. 9). The operatorcould manually move the table, activate/deactivateautomatic control, monitor table position and nacelle
concentricity, and "zero" table/laser positions, as well
as diagnose and respond to fault conditions.
A combination of parameter constraints in thesoftware, limit switches, and hard stops ensured that the
concentricity error could not reach the point where thefan blades would come into metal-to-metal contact withthe nacelle. In addition to the software and hardware
safety features, a 0.67 inch thick, low-density,polyurethane foam, abradable, material was used as a
rub strip over the fan blades. Based on the anticipated
fan/drive rig displacement and fan tip gap duringnormal testing, the clearance stack-up showed a safety
factor greater than 10.
Laser Mirror Laser Sensor
Nacelle Jy
Target/
Centerbody
Fig. 5. Laser Displacement SensorSchematic
\
Cooling Ll_
.... .._:
Fig. 6. Laser Displacement Sensor in RAN Assembly(w/Thermal Housing Removed)
Fig. 7. Internal View of Flowpath,
Aft Looking Forward
NASA/TM--2001-210820 4

RAN POSITIONING TABLE CONTROL SYSTEM
I_:,AS_E,L___LE,=_::_,_= A-_ ,=_A,LE', _,,_;o_ _ ,_ b_p_
Fig 8. Control System Flowchart
Fig. 9. Positioning Table Operator Control Interface
Analysis and VerificationAn extensive analysis and verification effort
was undertaken to ensure that the RAN system was
structurally, dynamically and aeroelastically safe. Asdescribed earlier, the hardware was designed to accept
significant incursions of the fan tips into the rub stripwithout damage to the fan or the rest of the model
hardware. The drive rig in the 9'x15' LSWT utilized
an automatic shutdown capability which was triggeredwhenever a facility-critical parameter, such as bearing
temperature, vibration, etc., exceeded its limits. As thethrust load from the fan relieved, the drive rig wouldquickly displace back toward its static position.
Because the positioning system was not designed tocontrol for rapid displacements, a significant fan
incursion into the rub strip was possible, and
stabilizing/containing such a violent event was a criticaldesign consideration. Consequently, low-density
polyurethane foam was selected for the rub stripmaterial. An analytical model was developed to verify
the rub stability for a range of rub strip materialdensities (10 to 40 lb/fi3). A test apparatus and
procedure was also developed to validate properties of
the material used in the rub stability analysis.
Because the fan and nacelle were decoupled,each was subject to a range of dynamic and steadyloads that would result in relative motion between two.
Due to the independent motion of the fan blades and the
nacelle, it was possible that a rub against the nacellecould cause instabilities in their relative motion. The
resulting "fan bounce" could cause damage to the fanand/or unsafe conditions in the wind tunnel. Since the
clearance between the fan blade tips and the rub strip
was anticipated to be 0.020", the entire system had tobe designed and analyzed very prudently. Due to therandom characteristics of loads on the test structure, a
probabilistic analysis of the loss of clearance was
deemed necessary.
The objective of the probabilistic analysis wasto analyze/design the RAN system such that the
probability of exceeding the design clearance
requirement of 0.020" was minimal and the margin ofsafety acceptable. The entire analysis/design effortwas divided into the following four main parts:
(1) preparation of a detailed finite element model, as
shown in Fig. 10; (2) developing a methodology toquantify the probability of exceeding the design
clearance; (3) verification of the methodology; and(4) computing the probability of exceeding the
clearance for the actual RAN system.
z1
x _ Roller Al_JrleNacelley_
RAN SL4_I_:Irl 5¥slefrt Ft'rdleElen_ent M,',del
Fig. 10. Finite Element Model of the RAN System(Fan and Drive Rig not Shown)
NASA/TM--2001-210820 5

Thefinite element model included the nacelle,
struts, fan drive rig, the connections between nacelle
and struts, the positioning table, the connectionsbetween the positioning table and struts, and
the positioning table bearings. A probabilisticmethodology was developed and consisted of:
(1) computing the frequency domain random loads(power spectral density [PSD] functions), (2) perform-
ing the random vibration analysis, (3) quantification ofthe probability of loss of clearance using barriercrossing analysis.: To verify the methodology, a single
strut typical of the design used in the RAN system wasmounted to the tunnel wall without a nacelle and fan to
determine the flow induced vibrations and its dynamic
response. The methodology was applied to a finiteelement model of the strut and the computed dynamic
characteristics were compared with those from the tests.
The experimentally extracted damping was used in theanalysis. A comparison of the free vibration analysisresults with the test data (Table 2) shows excellent
correlation. The mode shape correlation is given inTable 3, and is considered good when the diagonalterms are between 0.9 and 1.0 and the off-diagonalterms are between 0.0 and 0.1. The first two modes are
all in or near these ranges. However, the correlation forthe third mode (torsional) and its related off-diagonal
terms are not as close as expected, mainly due toinsufficient instrumentation required to capture thetorsional effect. The torsional mode was not expected
to contribute significantly to the loss of clearance due toits high frequency; it was computed mainly to verifythat the first two modes of vibration contained 99% of
the energy. To provide further confidence in the model,the computed accelerations of the struts at different
locations were compared with those from the test data.
The experimental and analytical results, as well as theirtrends, compared well, which provided confidence in
the methodology used. A full report of the comparisonof this acceleration data has been omitted for brevity.
Mode Test Correlated Analysis Description
Frequency Frequency Frequency
(Hz) (IDEAS) (Nastran)
1 19.92 20.11 19.48 Out-of-plane bending
2 60.44 57.54 56.3 In-plane bending
3 135.0 133.2 131.0 2 '_ Out-of-plane
Table 2. Dynamic Frequency Correlation for Struts
The experimentally verified strut design, asdescribed above, was used in the RAN support system.
Random loads, determined from hot-wire anemometer
data taken on a previous model turbofan simulation test
in the 9'x15' LSWT under a steady-state flowfield atMach 0.1 and atmospheric pressure, were converted
into the PSD functions using IDEAS computer code. Arandom vibration analysis of the RAN system wasperformed using MSC/NASTRAN computer code. 3Table 4 shows the first five free vibration modes with
the main component reacting in parenthesis.
Test Modes Analytical Modes
1 2 3
1 0.90 0.07 0.41
2 0.04 0.98 0.03
3 0.12 0.05 0.83
Table 3. Structural Dynamic Modal Correlation
Mode Description Frequency
1 Beam Bending (struts) 25.4 Hz
2 Chordwise Bending (struts) 43.6 Hz
3 Beam Torsion (struts) 73.2 Hz
4 Plate Bending (table) 83.2 Hz
5 Plate Torsion (table) 86.7 Hz
Table 4. Principle Modes of System Vibration
The root mean square loss of clearance, aswell as the auto correlation functions at different
locations around the periphery of the nacelle, were
computed. These results were used in the barrier
crossing analysis to quantify the probability ofexceeding the loss of clearance. The analysis showedthat the likelihood of losing the 0.020 inch clearance
during a typical two hour test was 62 out of 100,000.
Divergence and flutter analysis of the RANsystem was performed to verify the stability underaeroelastic conditions at Mach 0.2. Although the testcondition would not exceed 0.1 Mach, the stability
verification up to 0.2 Mach provided additional marginof safety. Aerodynamic analyses based on both the
Double-Lattice Subsonic Lifting surface and Vortex-Lattice theory revealed that the system does not diverge
up to 0.2 Mach. 4 The flutter analysis using the PKmethod showed that the system has enough structural
and aerodynamic damping to absorb the aerodynamicloads up to 181 Hz vibration frequencies and shows nosign of flutter. 5 Since the system was not expected to
respond beyond 181 Hz frequencies, the flutter analysis
for higher modes was deemed unnecessary. Thus, the
RAN support system was found to be stable with regardto divergence and flutter up to Math 0.2.
NASAJTM--2001-210820 6

Hardware Checkout and Installation
Prior to installation in the 9'x 15' LSWT, a
comprehensive checkout of RAN positioning systemwas completed. The RAN traverse table was floor-
mounted and qualified with the same hardware thatwould be used in the wind tunnel (Fig. 11). The target
centerbody (w/machined fiats) was mounted to acontrollable two-axis traverse system (Probe Actuator
Control System, or PACS) that provided motion with aresolution of 0.001 inches, allowing the RAN system
response to be compared against known inputs. Checksincluded manual and automatic operability, sampling
rate, vibrational response, and failure modes. Since the
main design goals of the RAN system was to prevent afan rub into the casing, the checkout was conducted
with verification of fail-safe operation as the principleobjective. However, this checkout could not simulate
the operating temperatures, excitation, facility noise,and aerodynamic effects found in the LSWT; follow-
on verification testing was needed. At this point, theRAN system was ready for tunnel installation.
Modifications to the wind tunnel were required
to support the positioning table and maintain theacoustic environment of the tunnel test section. By
mounting the positioning table behind the tunnel wall,the table and its support structure caused negligible
changes to the acoustic environment. The tunnel wall
that supports the positioning table was stiffened withadditional beams (Fig. 12). A platform was constructed
to support the positioning table, and was secured toboth the tunnel sidewall structure and ground for
maximum rigidity. Accurate alignment of the nacellewith the drive rig fan was critical for this test. Proper
flow-fields would not be created if the position of thenacelle and fan drive rig were not accurately
maintained. The axial location of the positioning tablewas set to a reference surface on the drive rig, whilehorizontal and vertical alignment was obtained by
shimming the positioning table. Final concentricity of
the fan and the nacelle was achieved by "jogging" thetwo-axis positioning table. New acoustic boxes werefabricated to accommodate the positioning table and
support struts (Figs. 12 and 13). These acoustic boxesmaintained a uniform aeroacoustic environment around
the new RAN support hardware.
Integrated System Performance
During initial testing, the excitation level ofthe nacelle was closely monitored, but never exceededthe noise floor of the accelerometers. A post-run
impact test confirmed that the RAN system was highlydamped. On the first 100% speed test, a fan rub ofabout 0.020 inches occurred. An alternate
configuration using a fixed nacelle supported by stators
was used to measure fan tip clearance. This test data
Fig. 11. Checkout of RAN w/PACS Traverse
Fig. 12. Wind Tunnel Modifications for RANInstallation
Fig. 13. Front View of RAN Hardware in LSWT
NASA/TM--2001-210820 7

revealedclearanceof 0.004 inches at the fan leading
edge, not 0.020 inches as originally predicted.
Consequently, modifications were needed to improvecentering performance and decrease the positioningdeadband.
Thermal drift in the laser sensor readings was
the major contributor to displacement error; therefore, athree-pronged approach was utilized to counteract drift.First, the laser cooling system was improved by
increasing the coolant flow rate and chilling the coolant
fluid, lowering the temperature at the laser head by
approximately 30°F. Second, the amount of errorintroduced by the thermal drift effect was calculatedfrom opposing lasers and subtracted from the control
readings. Third, startup and centering procedures were
developed to reduce relative drift. In addition,instrumentation filters and improved averaging
provided excellent noise immunity.
The performance gains from optimizationwere significant enough to reduce the deadband to0.0015 inches. Analysis revealed concentricity errorsin the horizontal direction and vertical direction of
0.0032 inches and 0.0036/-0.0014 inches, respectively.
A full description of the optimization of RAN, alongwith the concentricity analysis, can be found in Ref. 1.Table 5 summarizes the characteristics of RAN before
and after optimization.
a result, extremely tight tip clearances can be
maintained for moderate ramp rates of fan speed.
The RAN system met or exceeded all designrequirements and verified the feasibility of independent
fan and nacelle testing. Baseline testing showed noappreciable increase in broadband noise due to theRAN hardware and tunnel modifications.
Aerodynamically, the uniformity of the flow path
generated by the RAN system allowed the researchersto gather dynamic pressure data with confidence in its
quality. The robust mechanical design of the RANsystem proved to be structurally rigid, vibrationally
benign, and aeroelastically stable. The RAN system
displayed excellent reliability and consistencythroughout the program, and was deemed acoustically,
aerodynamically, and mechanically successful.
The successes of the RAN project will enable
its application in future NASA research programs.
Recently, a design was completed that integrates a thirdaxis that corrects for axial displacement of the fan and
drive rig. Future testing using the RAN system willalso include improvements to the laser sensor thermalcontrol system to reduce the sensor positioning error
due to thermal loads. In addition, a data recording
system will be installed to log laser sensor outputs andsensor operating temperatures at both steady and
transient operating speeds.
Characteristic Final Initial
Resolution of Motion 0.0001 in. 0.0001 in.
Sampling Rate 1 Hz 2 Hz
Deadband 0.0015 in. 0.0040 in.
Total Runs (all speeds) 25 1
Total Run Time >S0 hours 1 hour
Runs w/no robs @100% Nc 14 0
Concentricity Error (Horiz) + 0.0032 in. --, + 0.025 in.
Concentricity Error (Vert) +0.0036/-0.0014 in. _, + 0.025 in.
Table 5. RAN Performance Summary
Conclusions
The Rotor Alone Nacelle (RAN) system was a
unique design that allowed the acoustic testing of anisolated fan within the nacelle of a modem turbofan
model in the NASA Glenn 9'x15' Low Speed WindTunnel. Prior characterization of the fan and drive rig
motion showed that displacement was not predictable
enough to exclude an active nacelle positioning control
system; the data from the RAN project stronglysupported this finding. The RAN system can maintain
relative position of a decoupled nacelle with respect toan operating fan with high accuracy and precision. As
References
1. Cunningham, C.C., Thompson, W.IC, and Hughes,C.E., "Performance Optimization of a Rotor Alone Nacellefor Acoustic Fan Testing", ALgA 2001-0164, Jan. 2001.
2. Newland, D.E., "An Introduction to Random Vibration
and Spectral Analysis", Longman Group Limited, London.
3. MSC/NASTRAN User's Guide, Version 69, The
MacNeal-Scwendler Corporation.
4. Albano, E., and Rodden, W.P., "A Double-LatticeMethod for Calculating Lift Distributions on OscillatingSurfaces in Subsonic Flows", AIAA Journal, Feb. 1969,Vol. 7, No. 2, pp. 279-285.
5. "Modal Flutter Analysis Study; Vol. IV, Aero-Servo-Elastic Stability Analysis Program: PASES", Report No.SDI5204R, Hughes Aircraft Co.
NASA/TM--2001-210820 8


REPORT DOCUMENTATION PAGE FormApprovedOMB No. 0704-0188
Public reporting burden for this collection of information is estimated to average t hour per response, including the time for reviewing instructions, searching existing data sources,gathering and maintaining the data needed, and completing and reviewing the collection of information. Send comments regarding this burden estimate or any other aspect of thiscollection of information, including suggestions for reducing this burden, lo Washington Headquarlers Services, Directorate for Information Operations and Reports, 1215 JeffersonDavis Highway, Suite 1204, Arlington, VA 22202-4302, and Io the Office of Management and Budget, Paperwork Reduction Project (0704-0188), Washington, DC 20503.
1. AGENCY USE ONLY (Leave blank) 2. REPORT DATE 3. REPORT TYPE AND DATES COVERED
April 2001 Technical Memorandum
4. TITLE AND SUI_]ilLE
Design and Integration of a Rotor Alone Nacelle for Acoustic Fan Testing
6. AUTHOR(S)
Tony D. Shook, Christopher E. Hughes, William K. Thompson,
Paul F. Tavernelli, Cameron C. Cunningham, and Ashwin Shah
7. PERFORMING ORGANIZATION NAME(S) AND ADDRESS(ES)
National Aeronautics and Space Administration
John H. Glenn Research Center at Lewis Field
Cleveland, Ohio 44135-3191
9. SPONSORING/MONITORING AGENCY NAME(S) AND ADDRESS(ES)
National Aeronautics and Space Administration
Washington, DC 20546-0001
5. FUNDING NUMBERS
WU-781-13-01-00
8. PERFORMING ORGANIZATION
REPORT NUMBER
E-12738
10. SPONSORING/MONITORING
AGENCY REPORT NUMBER
NASA TM--2001-210820
AIAA-2001-1058
11. SUPPLEMENTARY NOTES
Prepared for the 39th Aerospace Sciences Meeting and Exhibit sponsored by the American Institute of Aeronautics and
Astronautics, Reno, Nevada, January 8-11, 2001. Tony D. Shook, Christopher E. Hughes, William K. Thompson,
Paul F. Tavernelli, and Cameron C. Cunningham, NASA Glenn Research Center; and Ashwin Shah, Sest, Inc.,
Middleburg Heights, Ohio 44130. Responsible person, Tony D. Shook, organization code 7725, 216--433-6373.
12a. DISTRIBUTION/AVAILABILITY STATEMENT 12b. DISTRIBUTION CODE
Unclassified - Unlimited
Subject Categories: 07, 09, 33, and 37 Distribution: Nonstandard
Available electronically at htm://_ltrs._c.nasa.eov/GLTRS
This publication is available from the NASA Center for AeroSpace Information, 301--621-0390.
13. ABSTRACT (Maximum 200 words)
A brief summary of the design, integration and testing of a rotor alone nacelle (RAN) in NASA Glenn's 9'x15' Low Speed
Wind Tunnel (LSWT) is presented. The purpose of the RAN system was to provide an "acoustically clean" flow path
within the nacelle to isolate that portion of the total engine system acoustic signature attributed to fan noise. The RAN
design accomplished this by removing the stators that provided intemal support to the nacelle. In its place, two external
struts mounted to a two-axis positioning table located behind the tunnel wall provided the support. Nacelle-mounted lasers
and a closed-loop control system provided the input to the table to maintain nacelle to fan concentricity as thermal and
thrust loads displaced the strut-mounted fan. This unique design required extensive analysis and verification testing to
ensure the safety of the fan model, propulsion simulator drive rig, and facility, along with experimental consistency of
acoustic data obtained while using the RAN system. Initial testing was used to optimize the positioning system and resulted
in concentricity errors of_+0.0031 in. in the horizontal direction and +0.0035/-0.0013 in. in the vertical direction. As a
result of successful testing, the RAN system will be transitioned into other acoustic research programs at NASA GlennResearch Center.
14. SUBJECT TERMS
Rotor blades; Turbomachinery; Fan; Wind tunnel models;
Active control; Nacelles; Acoustics
17. SECURITY CLASSIFICATION 18. SECURITY CLASSIFICATION
OF REPORT OF THIS PAGE
Unclassified Unclassified
NSN 7540-01-280-5500
19. SECURITY CLASSIFICATION
OF ABSTRACT
Unclassified
15. NUMBER OF PAGES
1416. PRICE CODE
AO_20. LIMITATION OF ABSTRACT
Standard Form 298 (Rev. 2-89)Prescribed by ANSI Std. Z39-18298-102