Embed Size (px)
Citation preview
PREDICTION OF NACELLE AERODYNAMIC INTERFERENCE EFFECTS AT LOW SUPERSONIC MACH NUMBERS
Robert M. K u l f a n Boeing Commercial A i r p l a n e Company
SUMMARY
A l i m i t e d s tudy i s c u r r e n t l y underway t o assess t h e accuracy o f a n a l y t i c a l p r e d i c t i o n s o f nacel l e aerodynamic i n t e r f e r e n c e e f f e c t s a t low supersonic speeds b y means o f t e s t versus theory comparisons. T h i s paper p resents a s t a t u s r e p o r t o f t h e study.
Comparisons shown i n c l u d e :
. I s o l a t e d wing-body l i f t, drag, and p i t c h i n g moments
. I s o l a t e d n a c e l l e drag and pressure d i s t r i b u t i o n s
. N a c e l l e i n t e r f e r e n c e shock-wave p a t t e r n s and pressure d i s t r i b u t i o n s on t h e wing lower s u r f a c e
. N a c e l l e i n t e r f e r e n c e e f f e c t s on wing-body l i f t, drag, and p i t c h i n g moments
. T o t a l i n s t a l l e d n a c e l l e i n t e r f e r e n c e e f f e c t s on lift, drag and p i t c h i n g moment.
The comparisons a l s o i l l u s t r a t e e f f e c t s of n a c e l l e l o c a t i o n , n a c e l l e s p i l l a g e , angle o f a t t a c k and Mach number on t h e aerodynamic i n t e r f e r e n c e .
The i n i t i a l r e s u l t s seem t o i n d i c a t e t h a t t h e methods can s a t i s f a c t o r i l y p r e d i c t l i f t , drag, p i t c h i n g moment and pressure d i s t r i b u t i o n s o f i n s t a l l e d engine n a c e l l e s a t low supersonic Mach numbers w i t h mass f low r a t i o s f rom 0.7 t o 1 .O f o r c o n f i g u r a t i o n s t y p i c a l o f e f f i c i e n t supersonic c r u i se a i rp lanes .
1.0 INTRODUCTION
Mutual i n t e r f e r e n c e between engine n a c e l l e s and t h e a i r f r a m e can have an
A number o f sys temat ic a n a l y t i c s t u d i e s have been made t o o b t a i n an
i m p o r t a n t e f f e c t on t h e aerodynamic e f f i c i e n c y o f a supersonic a i r c r a f t . A n a l y t i c a l methods e x i s t t h a t a1 low p r e d i c t o n o f these mutual i n t e r f e r e n c e e f f e c t s . understanding o f t h e des ign c o n s i d e r a t i o n s necessary t o o p t i m i z e t h e f a v o r a b l e aerodynamic i n t e r f e r e n c e e f f e c t s , ( r e f s . 1, 2 , 3, 4, 5 ) .
171
The validation of the necessary design "tools" by means of test-theory
Additionally, engine spillage effects on comparisons is rather limited (e.g. refs. 3, 4). for the low supersonic speed regime. aerodynamic interference are relatively unknown.
This is particularly true
The National Aeronautics and Space Administration conducted an extensive wind tunnel test program to evaluate aerodynamic performance penalties associated with the propulsion system installation and operation at subsonic through low supersonic speeds. t o provide an experimental data base of detailed force and pressure measurements for use in systematic evaluations of analytical prediction methods. references 6 through 8.
A parallel objective of this test program was
The results of the NASA experimental test program are reported in
A limited study is currently underway to assess the accuracy of the theoretical predictions of supersonic engine-airframe interference effects. The objective of this paper is to present the initial results of this study.
The NASA wind tunnel model geometry and test conditions are summarized
A brief description of wing-nacelle aerodynamic in Section 2.0. discussed in Section 3.0. interactions is given in Section 4.0.
The prediction methods being evaluated in this study are
Isolated wing plus body comparisons and isolated nacelle test versus theory comparisons are presented in Sections 5.0 and 6.0, respectively.
Nacelle interference pressures acting on the wing lower surface are shown in Section 7.0. Section 8.0 contains interference lift, drag and pitching momen t c ompar i sons .
The procedure that was used to calculate spillage effects on nacelle interference is described in Section 9.0. aerodynamic effects are presented in Section 10.0.
Comparisons of predicted spillage
2.0 MODEL GEOMETRY AND TEST CONDITIONS
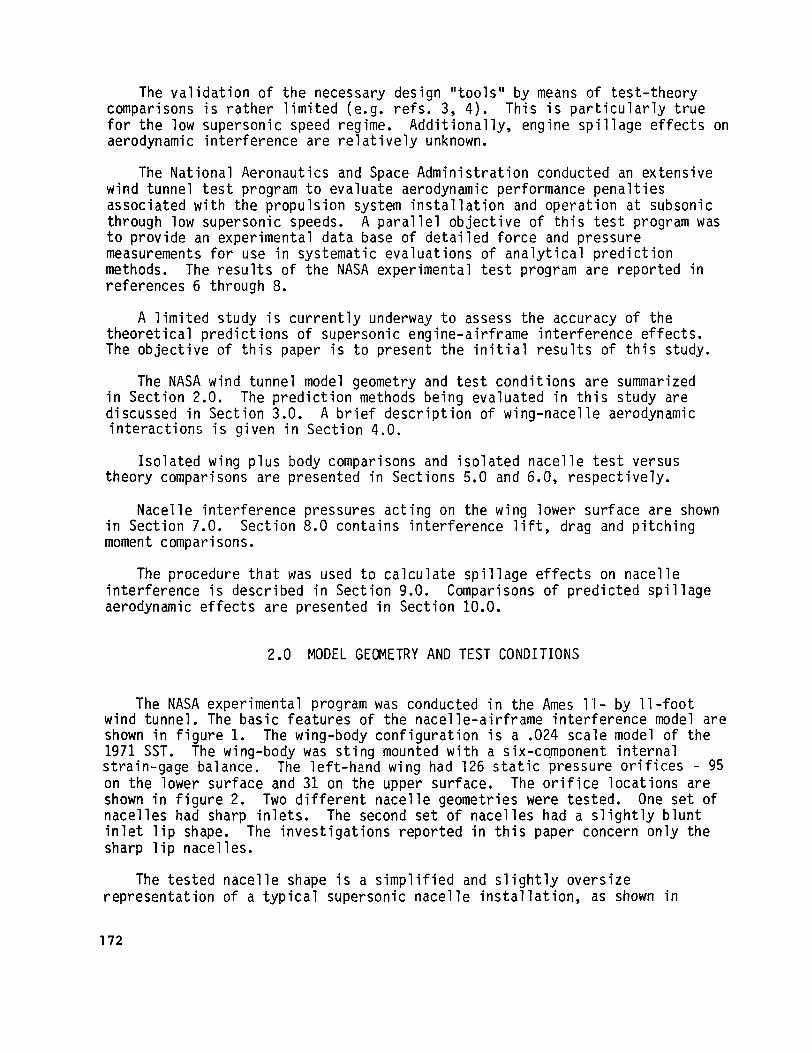
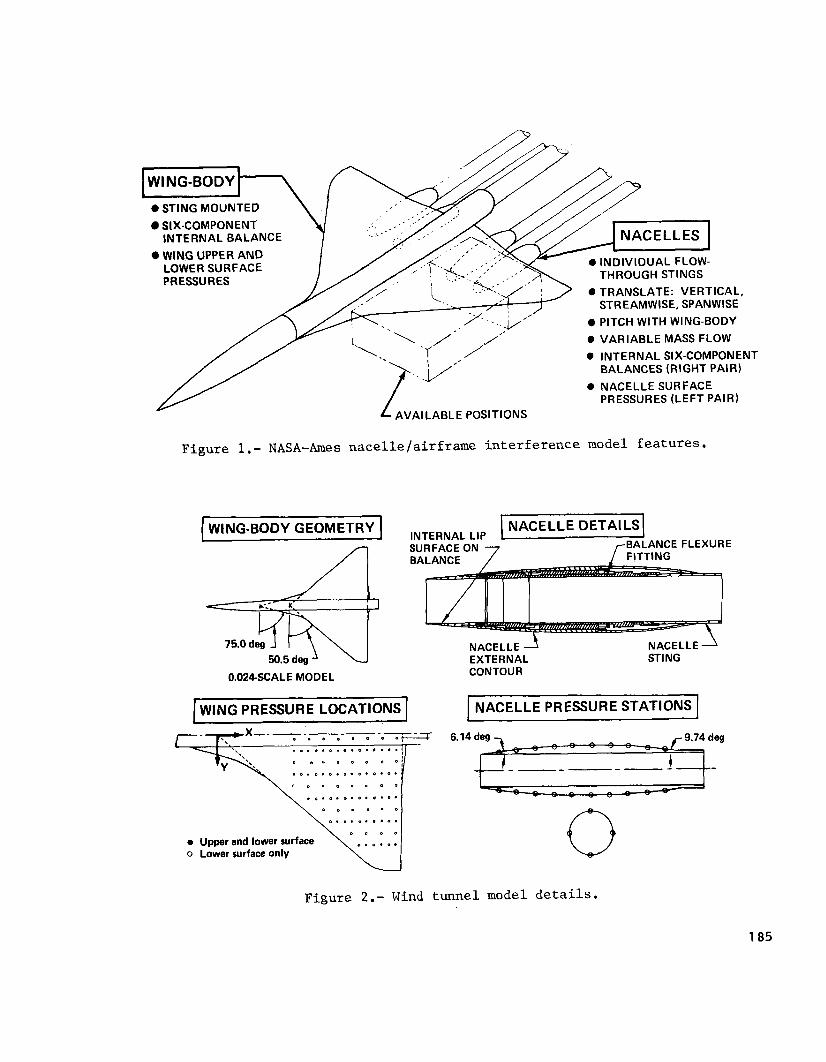
The NASA experimental program was conducted in the Ames 1'1- by 11-foot
The wing-body was sting mounted with a six-coJmonent internal
wind tunnel. The basic features of the nacelle-airframe interference model are shown in figure 1. 1971 SST. strain-gage balance. The left-hand wing had 126 static pressure orifices - 95 on the lower surface and 31 on the upper surface. shown in figure 2. One set of nacelles had sharp inlets. inlet lip shape. sharp lip nacelles.
The wing-body configuration is a .024 scale model of the
The orifice locations are
The investigations reported in this paper concern only the
Two different nacelle geometries were tested. The second set of nacelles had a slightly blunt
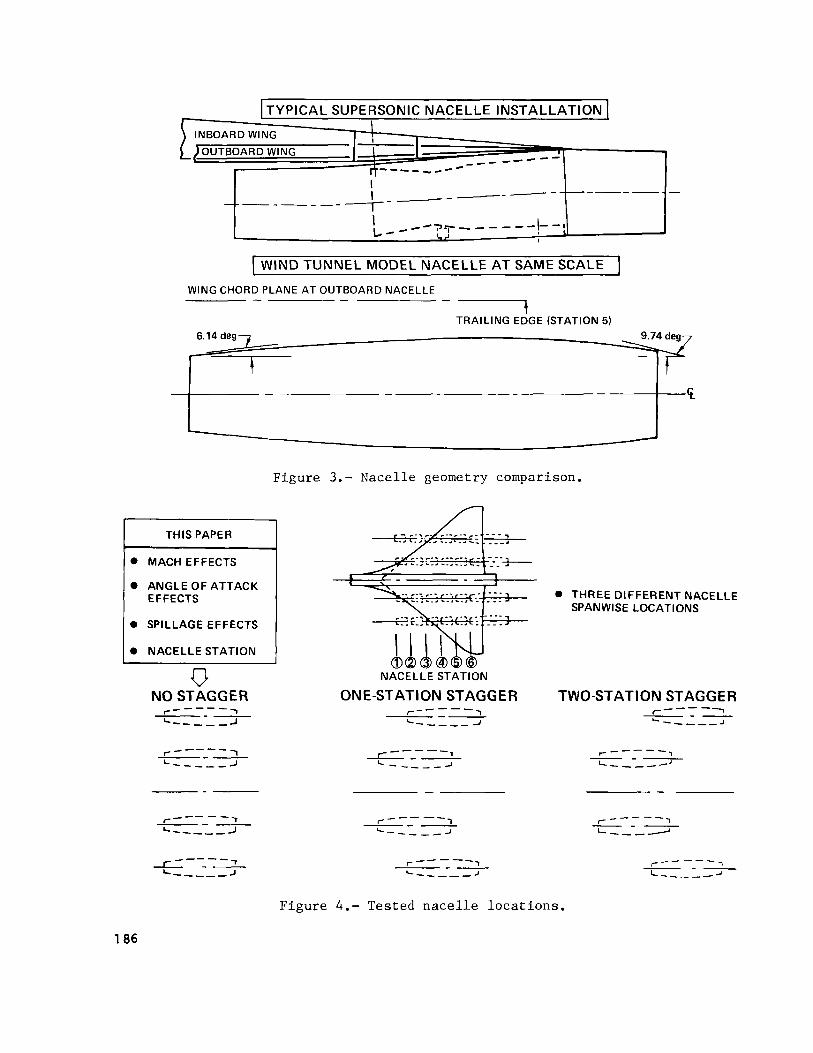
The tested nacelle shape is a simplified and slightly oversize representation of a typical supersonic nacelle installation, as shown in
172
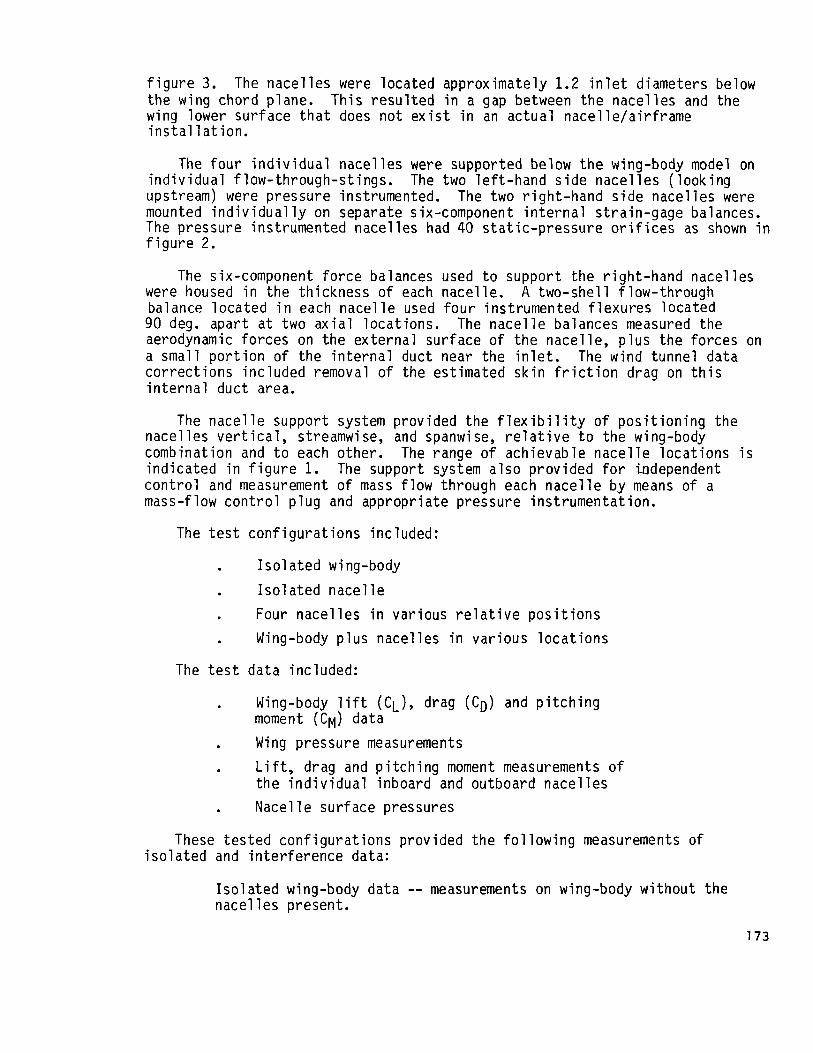
figure 3. the wing chord plane. wing lower surface that does not exist in an actual nacelle/airframe instal lat ion.
The nacelles were located approximately 1.2 inlet diameters below This resulted in a gap between the nacelles and the
The four individual nacelles were supported below the wing-body model on individual f low-through-stings. The two left-hand side nacelles (looking upstream) were pressure instrumented. The two right-hand side nacelles were mounted individual ly on separate six-component internal strain-gage balances. The pressure instrumented nacelles had 40 static-pressure orifices as shown in figure 2.
The six-component force balances used to support the right-hand nacelles were housed in the thickness of each nacelle. A two-shell flow-through balance located in each nacelle used four instrumented flexures located 90 deg. apart at two axial locations. The nacelle balances measured the aerodynamic forces on the external surface of the nacelle, plus the forces on a small portion of the internal duct near the inlet. The wind tunnel data corrections included removal of the estimated skin friction drag on this internal duct area.
The nacelle support system provided the flexibility of positioning the nacelles vertical, streamwise, and spanwise, relative to the wing-body combination and to each other. The range of achievable nacelle locations is indicated in figure 1. control and measurement of mass flow through each nacelle by means of a mass-flow control plug and appropriate pressure instrumentation.
The support system also provided for independent
The test configurations included:
. Is01 ated wing-body
. Four nacelles in various relative positions
. Wing-body plus nacelles in various locations
Is01 ated nacelle
The test data included:
.
. Wing pressure measurements
. Lift, drag and pitching moment measurements of
Wing-body lift (CL), drag (CD) and pitching moment (CM) data
the individual inboard and'outboard nacelles . Nacelle surface pressures
These tested configurations provided the fol low
Isolated wing-body data -- measurements on nacelles present.
isolated and interference data: ng measurements of
wing-body without the
173

I s o l a t e d n a c e l l e data -- measurements on a s i n g l y t e s t e d nacel le .
. Mutual n a c e l l e i n te r fe rence -- d i f f e r e n c e i n n a c e l l e measurements w i t h and w i thout t he o ther nace l les present.
Nace l le i n te r fe rence on wing-body -- d i f f e r e n c e i n wing-body measurements w i t h and w i thout t he o ther nace l les present.
Wing-body i n te r fe rence on the nace l les -- d i f f e r e n c e i n n a c e l l e measurements w i t h and w i thout the wing-body present.
To ta l wing-body p l u s nace l l e data -- sum o f wing-body data p l u s nace l l e data.
Sp i l l age in te r fe rence -- d i f f e r e n c e i n measurements on i d e n t i c a l con f i gu ra t i ons w i t h the nace l les s p i l l i n g according t o a s p e c i f i c c o n t r o l l e d mass f low r a t i o (MFR), and the corresponding data obtained w i thout s p i l l a g e .
The t e s t cond i t i ons included:
Mach Number: 0.90, 0.98, 1.1, 1.15, 1.2, 1.3, 1.4
Angle o f At tack: a = 0 t o 6 deg. Mass f l o w r a t i o : MFR = 0.6 t o 1.0
A l l con f i gu ra t i ons were t e s t e d a t the pr imary Mach numbers o f 0.9, 1.15, Some selected con f igu ra t i ons were a lso tes ted a t the remaining Mach 1.4.
numbers. than zero. a t tack.
Only a few con f igu ra t i ons were t e s t e d a t angles o f a t tack d i f f e r e n t Conf igura t ions w i t h s p i l l a g e were tes ted o n l y a t zero angle o f
The model angle of a t tack was measured r e l a t i v e t o a wing re fe rence plane. A t zero angle o f a t tack, the model a c t u a l l y experiences s i g n i f i c a n t 'negative l i f t.
Staggered and non-staggered arrangements were t e s t e d a t s i x d i f f e r e n t nace l l e s t a t i o n s and th ree d i f f e r e n t spanwise l oca t i ons as shown i n f i g u r e 4. I n t h i s paper on l y the "no-stagger" c o n f i g u r a t i o n r e s u l t s are presented as the staggered nace l l e analyses are on ly c u r r e n t l y underway.
Complete desc r ip t i ons o f t h e wind tunnel model, t e s t cond i t i ons and a v a i l a b l e t e s t data a re g iven i n re fe rence 8.
3.0 P R E D I C T I O N METHODS
The aerodynamic f o r c e and moment p r e d i c t i o n s f o r t he s tudy repor ted he re in have been made us ing t h e system of aerodynamic design and ana lys i s programs descr ibed i n re fe rence 9. c o n f i g u r a t i o n are b u i l t up through superposi t ion.
The aerodynamic f o r c e c o e f f i c i e n t s f o r a s p e c i f i e d
174
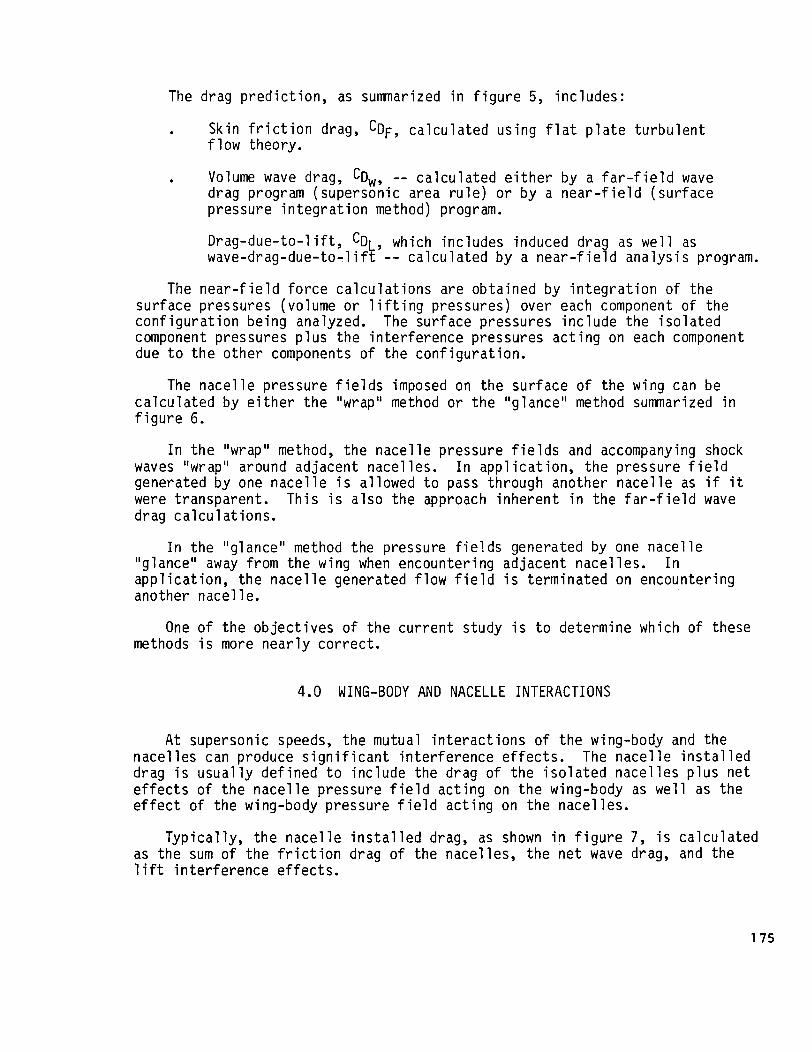
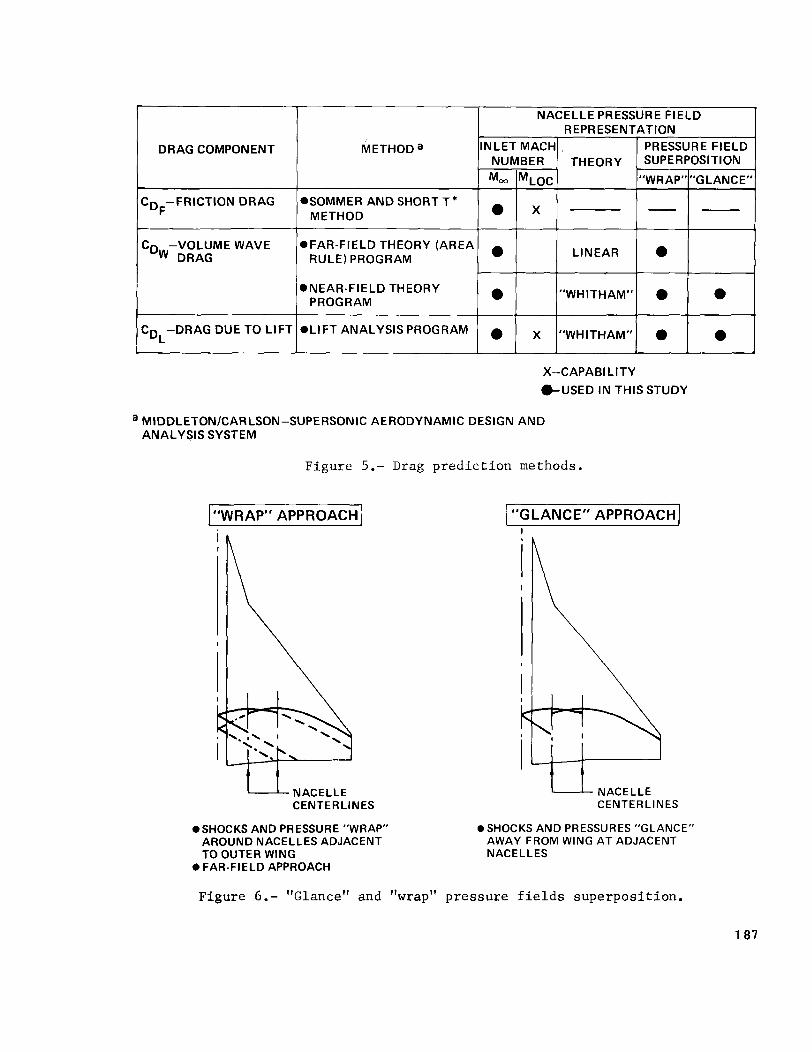
The drag p r e d i c t i o n , as summarized i n f i g u r e 5 , i nc ludes :
. Skin f r i c t i o n drag, CDF, c a l c u l a t e d us ing f l a t p l a t e t u r b u l e n t f l o w theory.
Volume wave drag, CD,, -- c a l c u l a t e d e i t h e r by a f a r - f i e l d wave drag program (supersonic area r u l e ) o r by a n e a r - f i e l d ( su r face
. pres sur e i n t eg r a t i on method ) program.
Drag-due-to-1 ift, CDL, which inc ludes wave-drag-due- to- l i f t -- c a l c u l a t e d by
The n e a r - f i e l d f o r c e c a l c u l a t i o n s are ob ta i i sur face Dressures (volume o r 1 i f t i n q Pressures)
nduced drag as w e l l as a n e a r - f i e l d ana lys i s program.
ed by i n t e g r a t i o n o f t he over each component o f t he
c o n f i g u r a t i o n being analyzed. component pressures p l u s the i n t e r f e r e n c e pressures a c t i n g on each component due t o t h e o the r components o f t he con f igu ra t i on .
The sur face pressures i n c l u d e t h e i s o l a t e d
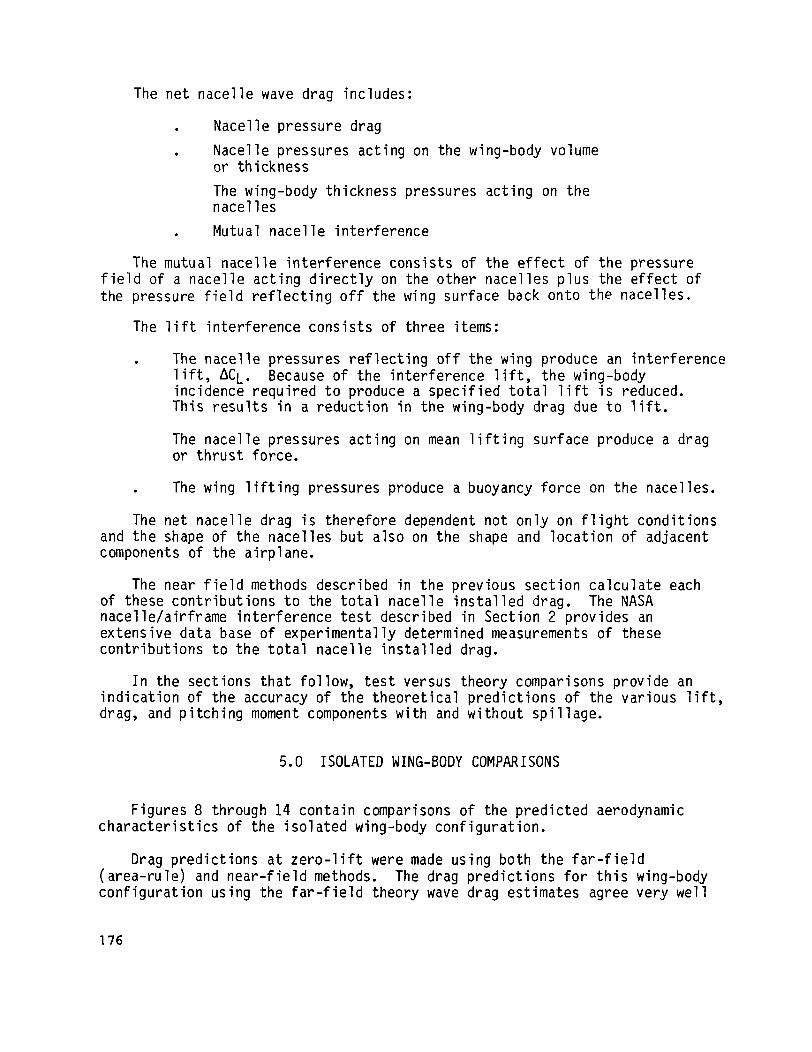
The n a c e l l e pressure f i e l d s imposed on the sur face o f t he wing can be c a l c u l a t e d by e i t h e r t h e ''wrap" method o r t h e "glance" method summarized i n f i g u r e 6.
I n t h e ''wrap" method, t h e n a c e l l e pressure f i e l d s and accompanying shock waves "wrap" around adjacent nacel les. I n app l i ca t i on , t h e pressure f i e l d generated by one n a c e l l e i s al lowed t o pass through another n a c e l l e as i f i t were t ransparent . Th i s i s a l s o t h e approach inhe ren t i n the f a r - f i e l d wave drag c a1 cu 1 a t ions.
I n the "glance" method the pressure f i e l d s generated by one nace l l e "glance" away from the wing when encounter ing adjacent nace l les . I n app l i ca t i on , t h e n a c e l l e generated f l o w f i e l d i s te rmina ted on encounter ing another nacel 1 e.
One o f t h e o b j e c t i v e s o f t h e c u r r e n t s tudy i s t o determine which o f these methods i s more n e a r l y co r rec t .
4.0 WING-BODY AND NACELLE INTERACTIONS
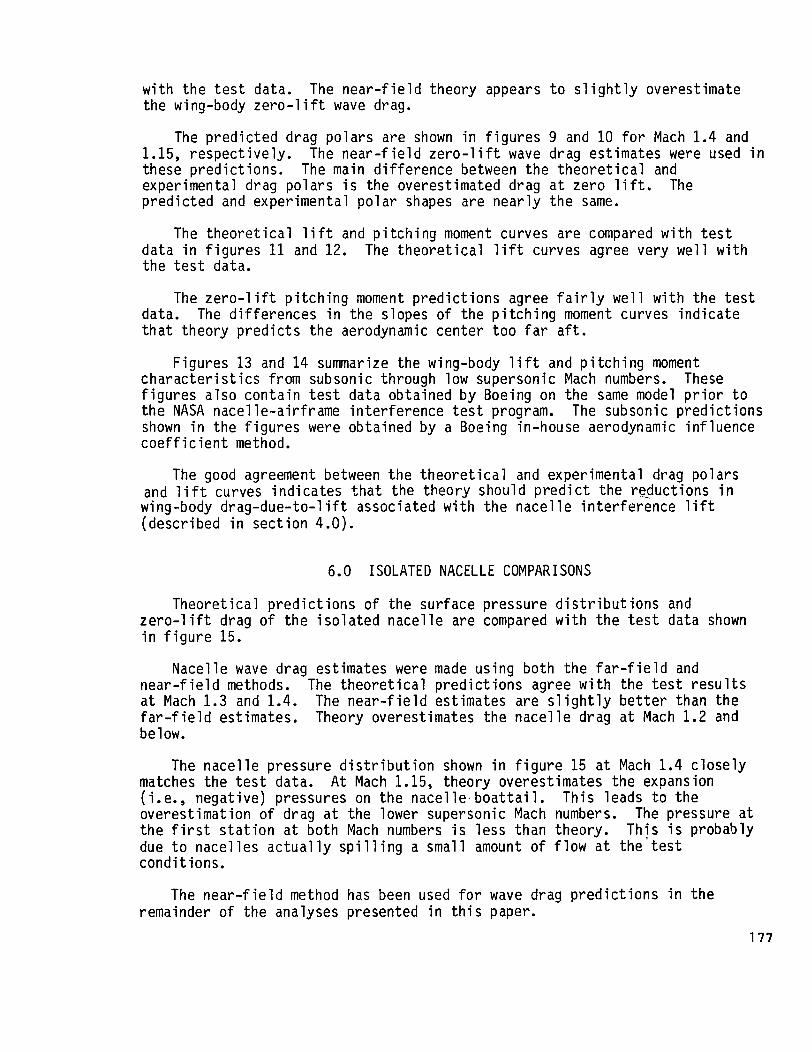
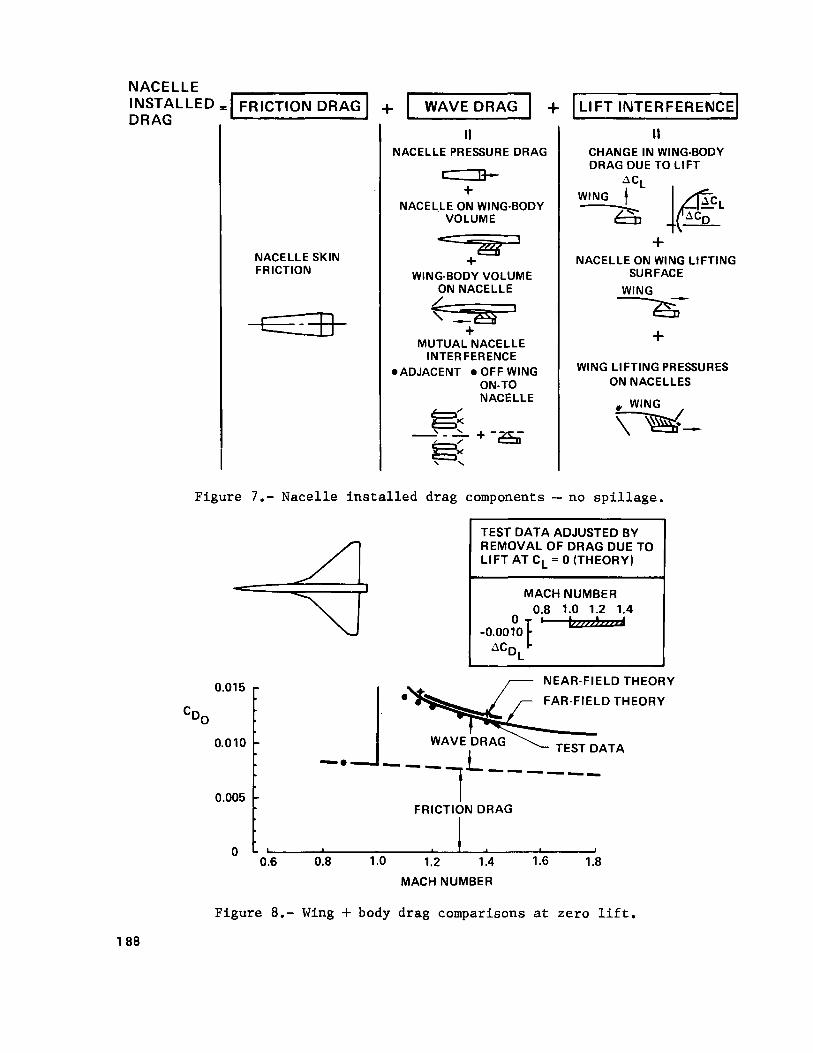
A t supersonic speeds, t he mutual i n t e r a c t i o n s o f t h e wing-body and t h e nace l l es can produce s i g n i f i c a n t i n t e r f e r e n c e e f f e c t s . The n a c e l l e i n s t a l l e d drag i s u s u a l l y de f i ned t o i nc lude the drag o f t he i s o l a t e d nace l l es p l u s ne t e f f e c t s o f t h e n a c e l l e pressure f i e l d a c t i n g on t h e wing-body as w e l l as the e f f e c t o f the wing-body pressure f i e l d a c t i n g on t h e nace l les .
Typ ica l l y , t h e n a c e l l e i n s t a l l e d drag, as shown i n f i g u r e 7, i s ca l cu la ted as the sum o f t h e f r i c t i o n drag o f t he nacel les, t h e n e t wave drag, and the 1 ift i n t e r f e r e n c e e f f e c t s .
175
The net nacelle wave drag includes:
. Nacelle pressure drag
. Nacelle pressures acting on the wing-body volume or thickness The wing-body thickness pressures acting on the nacelles
. Mutual nacelle interference
The mutual nacelle interference consists of the effect of the pressure field of a nacelle acting directly on the other nacelles plus the effect of the pressure field reflecting off the wing surface back onto the nacelles.
The lift interference consists of three items:
. The nacelle pressures reflecting off the wing produce an interference lift, ACL. incidence required to produce a specified total lift is reduced. This results in a reduction in the wing-body drag due t o lift.
Because of the interference lift, the wing-body
The nacelle pressures acting on mean lifting surface produce a drag or thrust force.
. The wing lifting pressures produce a buoyancy force on the nacelles.
The net nacelle drag is therefore dependent not only on flight conditions and the shape of the nacelles but also on the shape and location of adjacent components of the airplane.
The near field methods described in the previous section calculate each of these contributions to the total nacelle installed drag. The NASA nacel le/airframe interference test described in Section 2 provides an extensive data base of experimentally determined measurements of these contributions to the total nacelle installed drag.
In the sections that follow, test versus theory comparisons provide an indication of the accuracy of the theoretical predictions of the various lift, drag, and pitching moment components with and without spillage.
5.0 ISOLATED WING-BODY COMPARISONS
Figures 8 through 14 contain comparisons of the predicted aerodynamic characteristics of the isolated wing-body configuration.
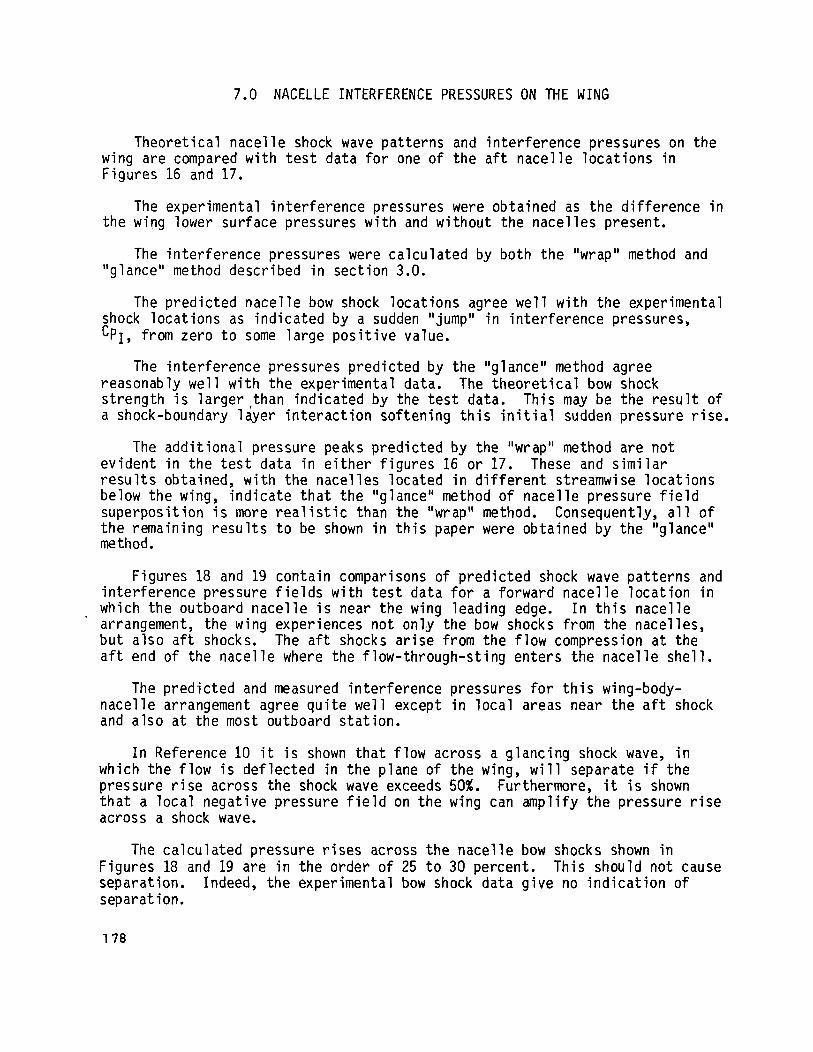
Drag predictions at zero-lift were made using both the far-field (area-rule) and near-field methods. The drag predictions for this wing-body configuration using the far-field theory wave drag estimates agree very well
176
w i t h t h e t e s t data. the wing-body z e r o - l i f t wave drag.
The n e a r - f i e l d theory appears t o s l i g h t l y overest imate
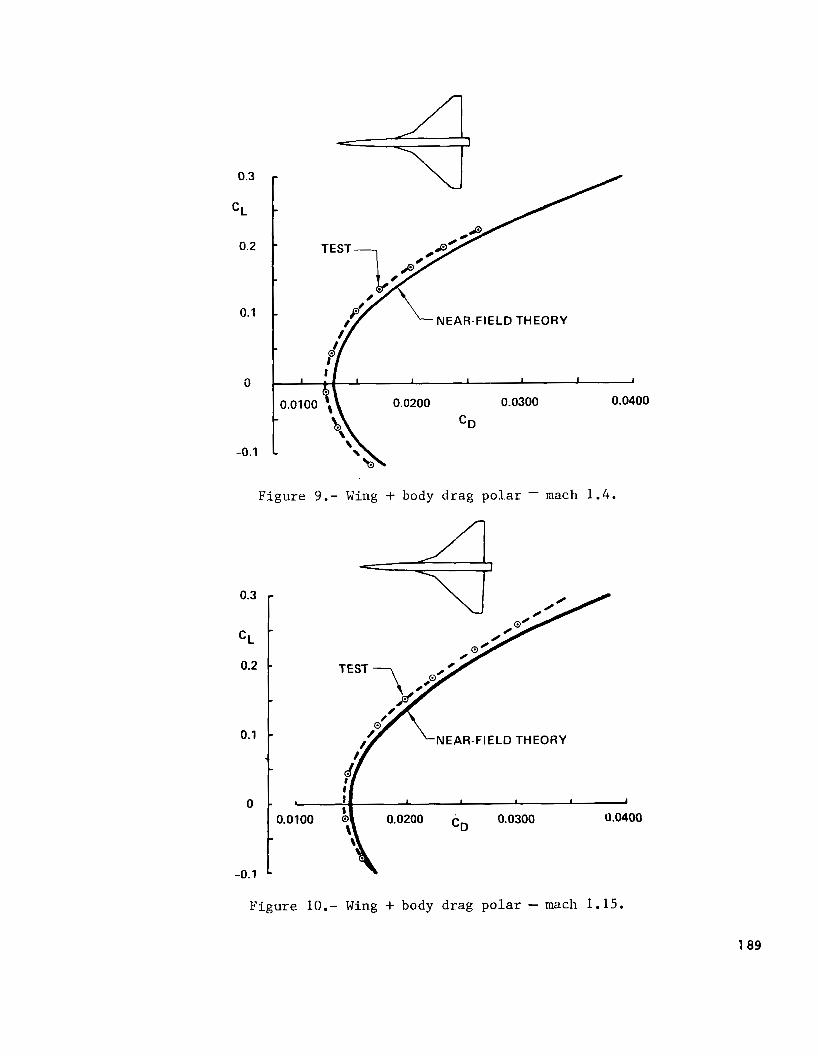
The p r e d i c t e d drag p o l a r s are shown i n f i g u r e s 9 and 10 f o r Mach 1.4 and 1.15, respec t i ve l y . these p red ic t i ons . The main d i f f e r e n c e between t h e t h e o r e t i c a l and exper imental drag po la rs i s t he overest imated drag a t zero l i f t . p red ic ted and exper imental p o l a r shapes are n e a r l y t h e same.
The n e a r - f i e l d z e r o - l i f t wave drag est imates were used i n
The
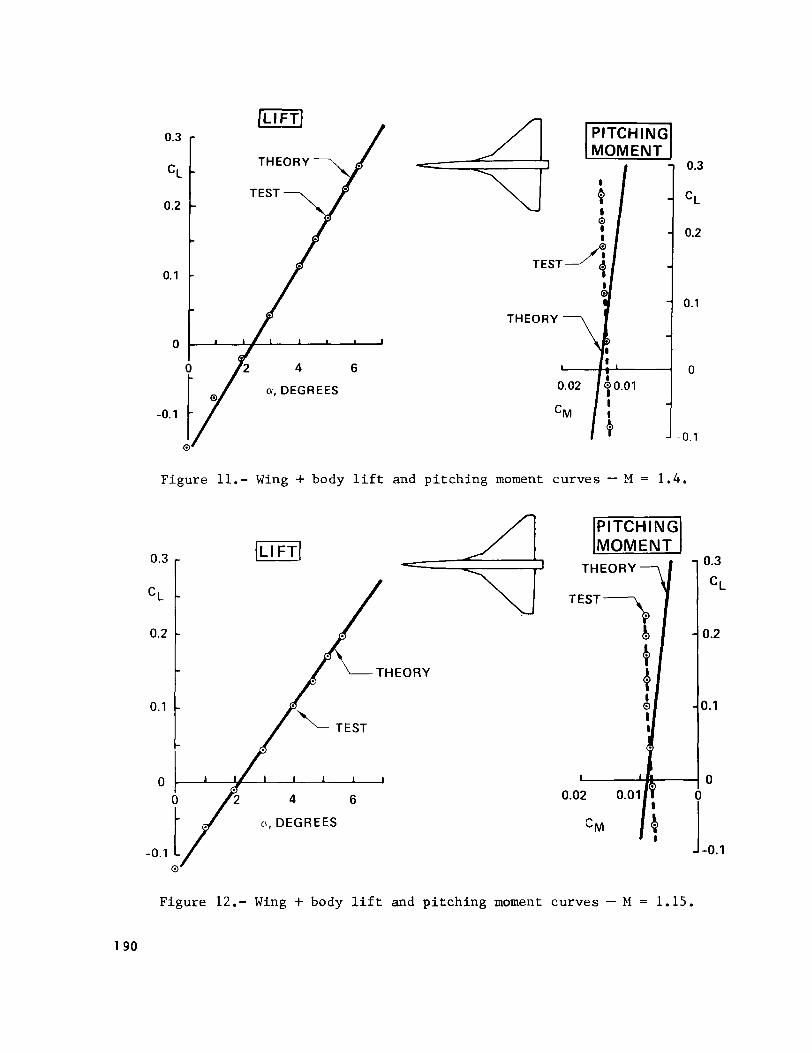
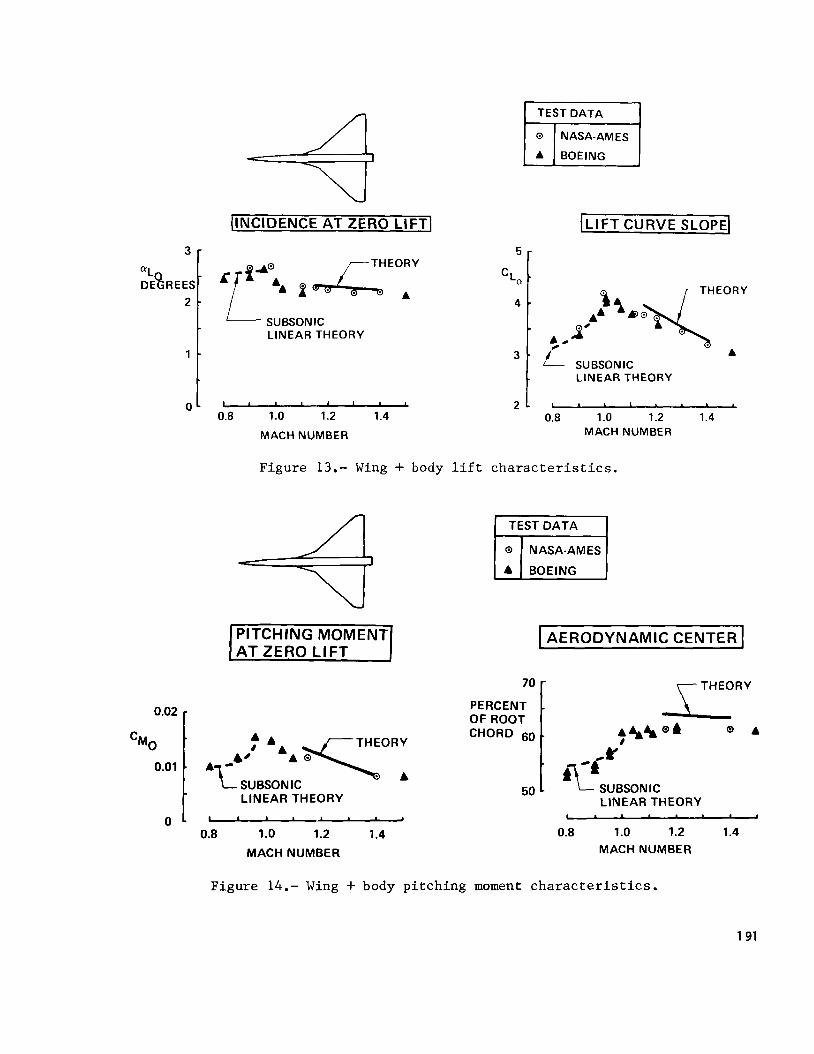
The t h e o r e t i c a l l i f t and p i t c h i n g moment curves are compared w i t h t e s t da ta i n f i g u r e s 11 and 12. t he t e s t data.
The t h e o r e t i c a l l i f t curves agree very w e l l w i t h
The z e r o - l i f t p i t c h i n g moment p r e d i c t i o n s agree f a i r l y w e l l w i t h the t e s t data. The d i f f e r e n c e s i n the slopes o f t he p i t c h i n g moment curves i n d i c a t e t h a t theory p r e d i c t s t h e aerodynamic center t o o f a r a f t .
F igures 13 and 14 summarize the wing-body l i f t and p i t c h i n g moment c h a r a c t e r i s t i c s f rom subsonic through low supersonic Mach numbers. f i g u r e s a l s o con ta in t e s t data obta ined by Boeing on the same model p r i o r t o t h e NASA nacel l e -a i r f rame in te r fe rence t e s t program. shown i n the f i g u r e s were obta ined by a Boeing in-house aerodynamic in f luence c o e f f i c i e n t method.
These
The subsonic p r e d i c t i o n s
The good agreement between t h e t h e o r e t i c a l and exper imental drag po la rs and l i f t curves i n d i c a t e s t h a t t he theory should p r e d i c t t he r-cductions i n wing-body drag-due-to-1 i f t associated w i t h t h e n a c e l l e i n t e r f e r e n c e 1 i f t (descr ibed i n sec t i on 4.0).
6.0 ISOLATED NACELLE COMPARISONS
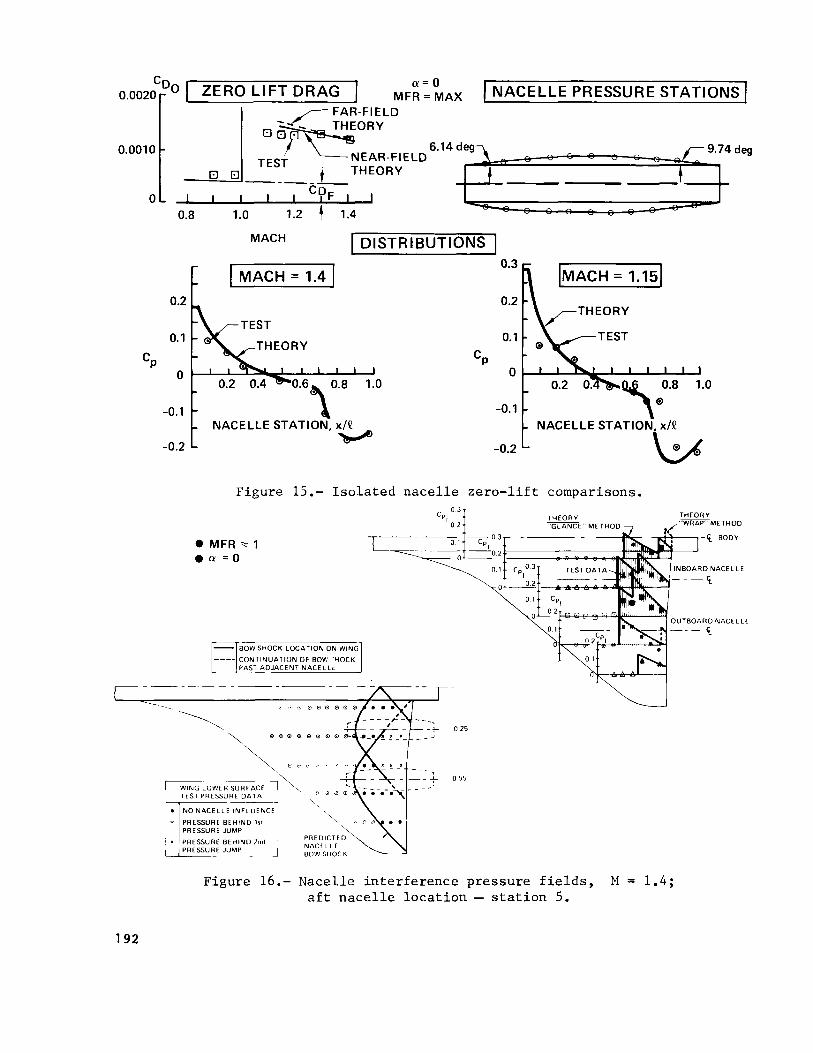
Theore t ica l p r e d i c t i o n s o f t he sur face pressure d i s t r i b u t i o n s and z e r o - l i f t drag o f t h e i s o l a t e d n a c e l l e are compared w i t h t h e t e s t data shown i n f i g u r e 15.
Nacel le wave drag est imates were made us ing both t h e f a r - f i e l d and n e a r - f i e l d methods. a t Mach 1.3 and 1.4. f a r - f i e l d est imates. below.
The t h e o r e t i c a l p r e d i c t i o n s agree w i t h the t e s t r e s u l t s The n e a r - f i e l d est imates are s l i g h t l y b e t t e r than t h e Theory overest imates the n a c e l l e drag a t Mach 1.2 and
The n a c e l l e pressure d i s t r i b u t i o n shown i n f i g u r e 15 a t Mach 1.4 c l o s e l y matches t h e t e s t data. A t Mach 1.15, theory overest imates the expansion ( i . e., negat ive) pressures on t h e nacel l e . b o a t t a i 1. overest imat ion o f drag a t t he lower supersonic Mach numbers. t h e f i r s t s t a t i o n a t both Mach numbers i s l ess than theory. due t o nace l l es a c t u a l l y s p i l l i n g a smal l amount o f f l o w a t t h e ' t e s t condi t ions.
Th is leads t o t h e The pressure a t
Th is i s probably
The n e a r - f i e l d method has been used f o r wave drag p r e d i c t i o n s i n t h e remainder o f t h e analyses presented i n t h i s paper.
177
7.0 NACELLE INTERFERENCE PRESSURES ON THE WING
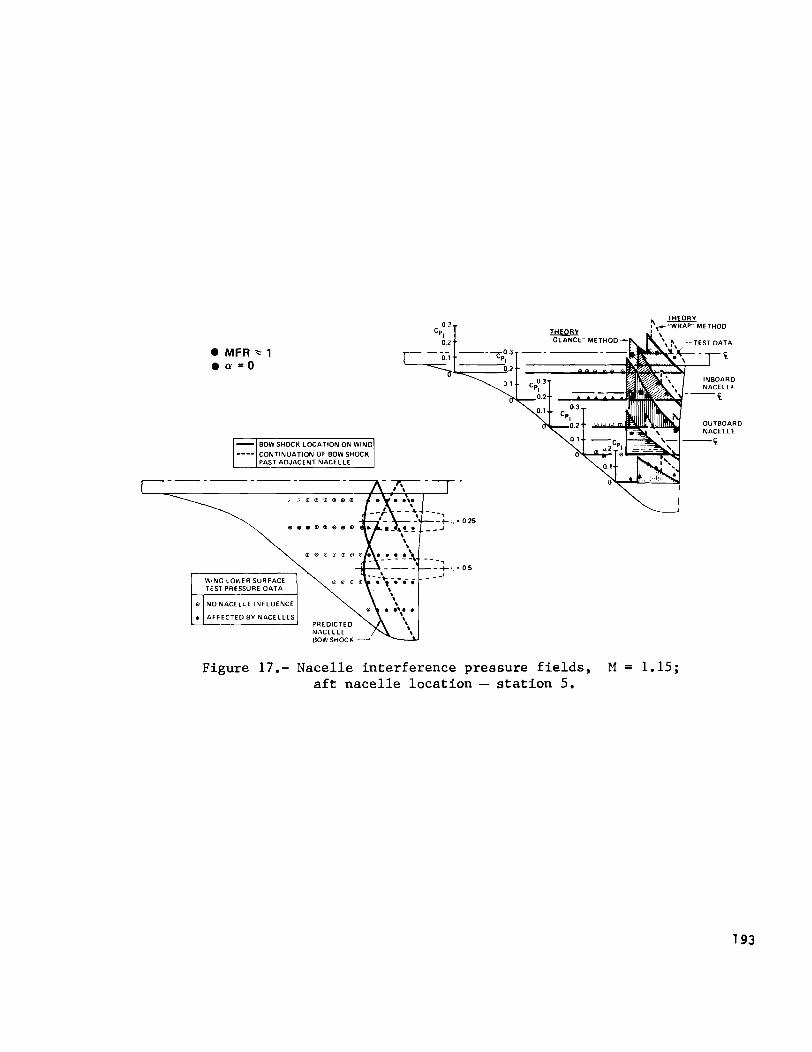
Theore t ica l n a c e l l e shock wave pa t te rns and in te r fe rence pressures on the wing are compared w i t h t e s t data f o r one o f t he a f t nace l l e l oca t i ons i n F igures 16 and 17.
The exper imental i n te r fe rence pressures were obta ined as the d i f f e rence i n the wing lower sur face pressures w i t h and w i thout t he nace l l es present.
The in te r fe rence pressures were ca l cu la ted by both t h e ''wrap" method and "glance" method descr ibed i n sec t ion 3.0.
The p red ic ted n a c e l l e bow shock l oca t i ons agree w e l l w i t h the experimental shock l oca t i ons as i nd i ca ted by a sudden Iljump" i n i n te r fe rence pressures, CPI, from zero t o some la rge p o s i t i v e value.
The in te r fe rence pressures p red ic ted by the "glance" method agree reasonably w e l l w i t h the exper imental data. The t h e o r e t i c a l bow shock s t reng th i s l a r g e r than ind i ca ted by the t e s t data. This may be the r e s u l t of a shock-boundary l aye r i n t e r a c t i o n so f ten ing t h i s i n i t i a l sudden pressure r i s e .
The a d d i t i o n a l pressure peaks p red ic ted by the llwrap" method are no t ev ident i n the t e s t data i n e i t h e r f i g u r e s 16 o r 17. r e s u l t s obtained, w i t h the nace l les loca ted i n d i f f e r e n t streamwise l o c a t i o n s below t h e wing, i n d i c a t e t h a t t he "glance" method o f nace l l e pressure f i e l d superpos i t ion i s more r e a l i s t i c than the "wrap" method. Consequently, a l l o f t he remaining r e s u l t s t o be shown i n t h i s paper were obta ined by the "glance" method.
These and s i m i l a r
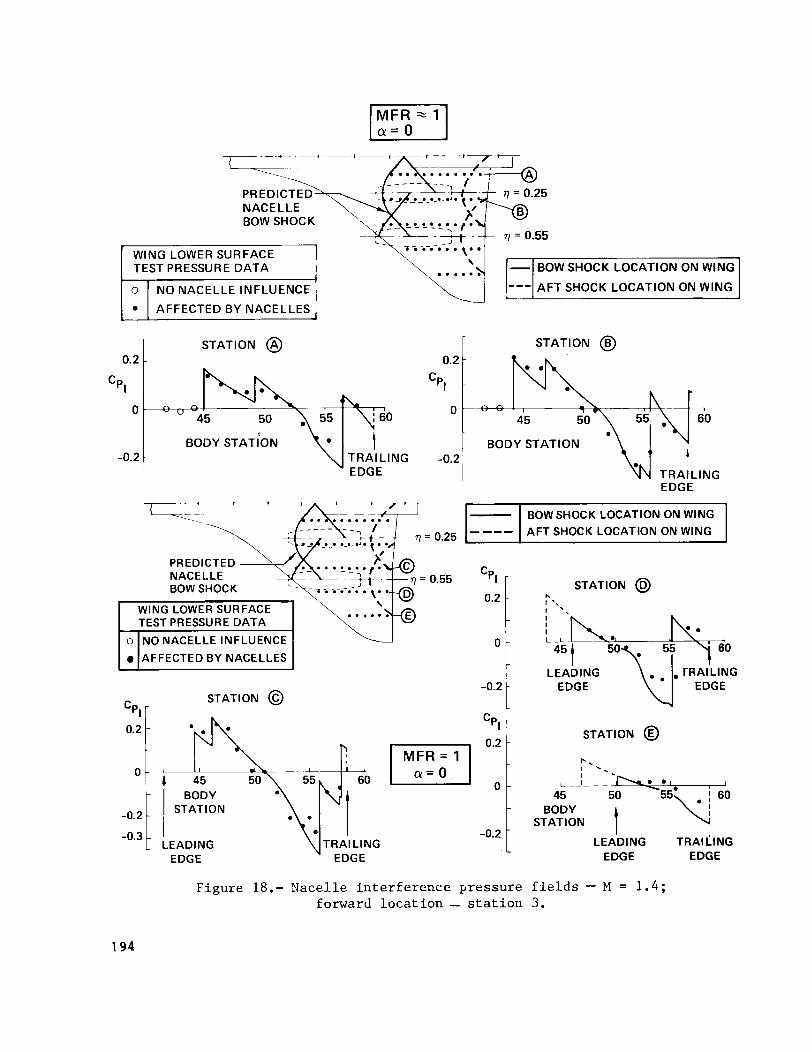
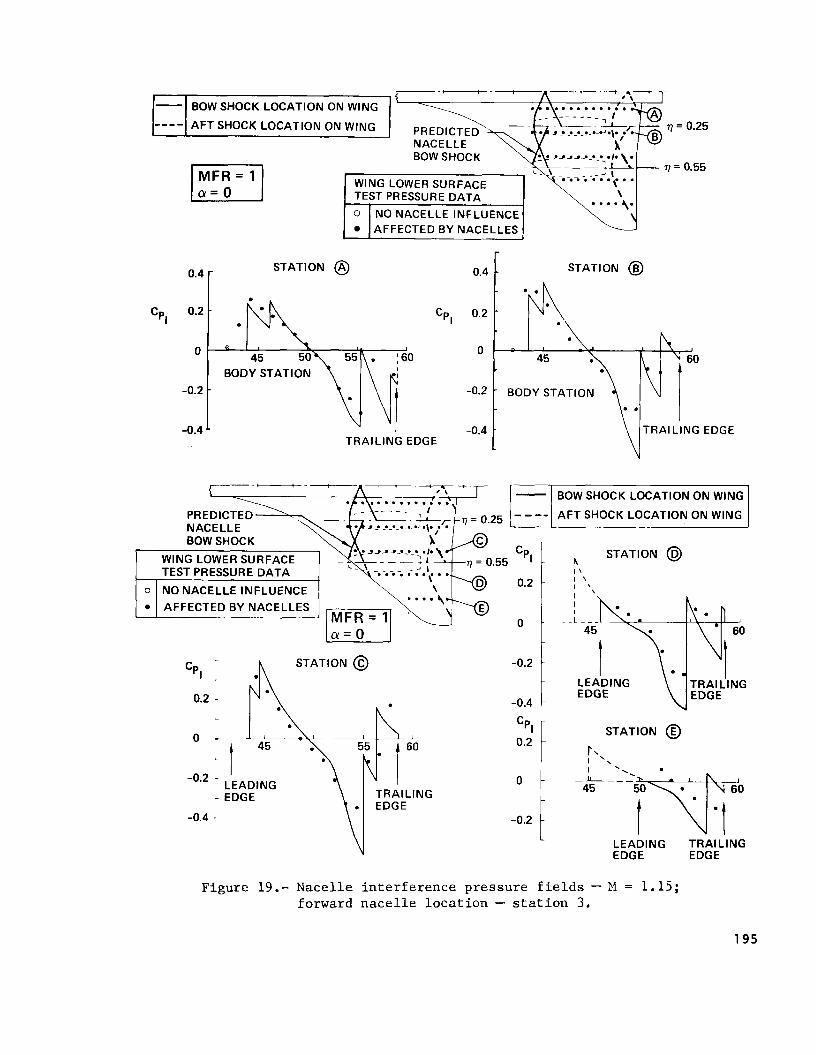
F igures 18 and 19 conta in comparisons o f p red ic ted shock wave pa t te rns and in te r fe rence pressure f i e l d s w i t h t e s t data f o r a forward n a c e l l e l o c a t i o n i n which t h e outboard n a c e l l e i s near t h e wing leading edge. I n t h i s nace l l e arrangement, the wing experiences no t on ly the bow shocks from the nacel les, b u t a l so a f t shocks. The a f t shocks a r i s e from the f low compression a t the a f t end o f the nace l l e where the f low- through-st ing en ters the n a c e l l e she l l .
The p red ic ted and measured in te r fe rence pressures fo r t h i s wing-body- nace l l e arrangement agree q u i t e w e l l except i n l o c a l areas near the a f t shock and a l so a t t he most outboard s ta t i on .
I n Reference 10 i t i s shown t h a t f l o w across a g lanc ing shock wave, i n which the f l o w i s de f l ec ted i n t h e plane o f t h e wing, w i l l separate i f the pressure r i s e across the shock wave exceeds 50%. Furthermore, i t i s shown t h a t a l o c a l negat ive pressure f i e l d on t h e wing can amp l i f y t h e pressure r i s e across a shock wave.
The ca l cu la ted pressure r i s e s across t h e n a c e l l e bow shocks shown i n F igures 18 and 19 are i n the order o f 25 t o 30 percent. separat ion. s epar a t ion.
This should no t cause Indeed, t h e exper imental bow shock data g i ve no i n d i c a t i o n o f
178
The aft shock waves from the nacelle are much stronger because of the large boattail angle at the aft end of the nacelle. Furthermore, the nacelle area reduction along the boattai 1 produces theoretically large negative expansion pressure just upstream of the aft shock waves. negative pressure field further amplifies the strength of the already strong aft shocks. Consequently, the pressure rise across the aft shocks varies from 60 percent to 100 percent across the wing. Thus, boundary layer separation is most certain to occur in the area of the aft shocks. The differences in the experimental and theoretical pressures near the aft shocks is probably due to shock induced boundary 1 ayer separation.
This local
These results demonstrate the importance of limitinq the strength of nacelle-created shock waves likely to interact with a wing, particularly in areas o f local negative pressures.
8.0 INTERFERENCE LIFT, DRAG, AND PITCHING MOMENT
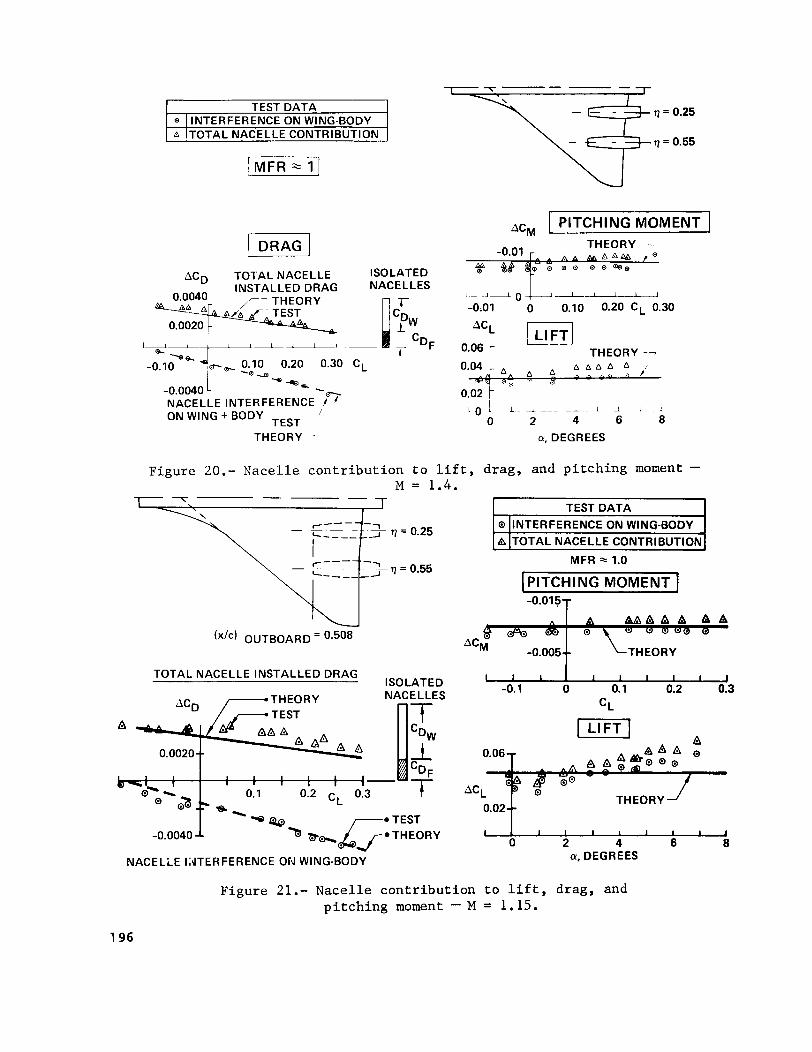
Comparisons are made in Figures 20 and 21 between calculated nacelle contributions to lift, drag, and pitching moment with the corresponding test data.
The drag comparisons include the nacelle interference on the wing-body as well as the total nacelle installed drag. agree well with the test data. The nacelle interference on the wing-body is favorable and increases with lift coefficient. This is primarily due to the reduction in wing-body drag-due-to-1 ift associated with the nacelle interference lift.'
The theoretical drag predictions
Theoretical interference lift and pitching moment increments are calculated from the nacelle interference pressure fields (discussed in the previous section) acting on the wing lower surface. The experimental lift and pitching moment data indicate that the nacelles also experience a change in lift and hence pitching moment when located in the wing lower surface pressure field. The effect of wing-body pressures on nacelle lift is not considered in the theoretical calculations.
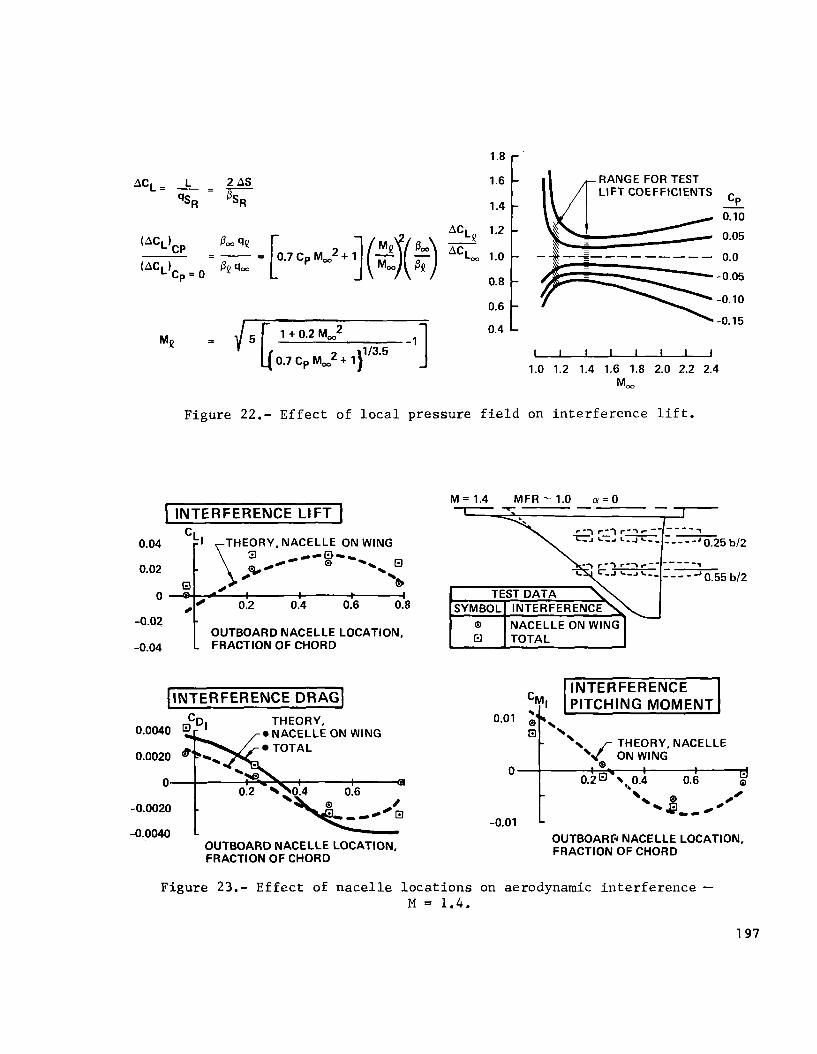
The measured interference lift increment increases with angle of attack. The theoretical interference lift calculations shown in Figures 20 and 21 were made at a constant local Mach number equal to the free-stream Mach number. Slender body theory estimates were subsequently made to explore the effect of local Mach number on interference lift. The results of these slender body theory estimates are shown in Figure 22.
A negative pressure field in the area of the nacelles, corresponding to a local Mach number greater than free stream, reduces the interference lift. Conversely, a positive pressure field, or lower local Mach number, enhances the interference lift. interference lift is seen to De greatest at the very low supersonic Mach numbers. are consistent with the experimental results shown in Figures 20 and 21.
The effect of the local pressure field on the
The calculated effects of local pressure field on ,interference lift
179
As a result of the favorable interference effects, the total nacelle drag is less than friction drag at the higher lift coefficients for the analyzed configuration arrangement.
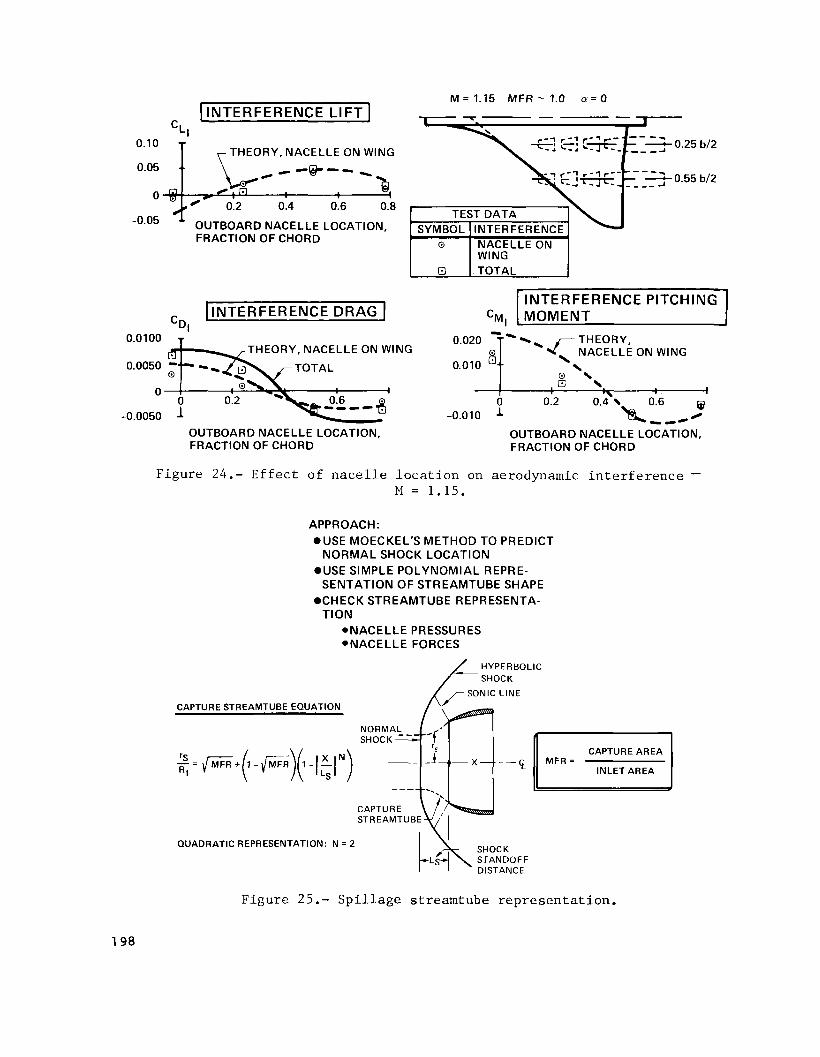
The effect of nacelle location on aerodynamic interference is shown in Figures 23 and 24. Nacelle location is seen to have a powerful effect on the nacelle interference. At the aft nacelle locations, both the interference of the nacelles on the wing-body and the wing-body on the nacelles are favorable. The nacelles in the aft locations produce a substantial level of favorable interference. As the nacelles are moved forward, both of these interference components become unfavorable. This results in considerable net unfavorable interference. well with the test data, but become less accurate at the most forward location, where the outboard nacelle moves in front of the wing leading edge.
The predicted interference effects agree reasonably
9.0 SPILLAGE INTERFERENCE CALCULATION PROCEDURE
The results that have been presented in the sections thus far correspond to engine operation without spillage (i.e., mass flow = 1.0). nacelle spillage (mass flow ratios as low as 0.7) on the interference forces were also investigated in the NASA nacel le-airframe interference test program. Experimental measurements, however, were only obtained at zero angle of attack. As previously mentioned, the wing-body produces considerable negative lift at this attitude.
The effects of
The mass flow through each nacelle was varied by a control plug in the corresponding f low-through-sting. At supersonic speeds a normal shock forms in front of the nacelle and moves progressively upstream as the mass-flow ratio through the nacelle is reduced.
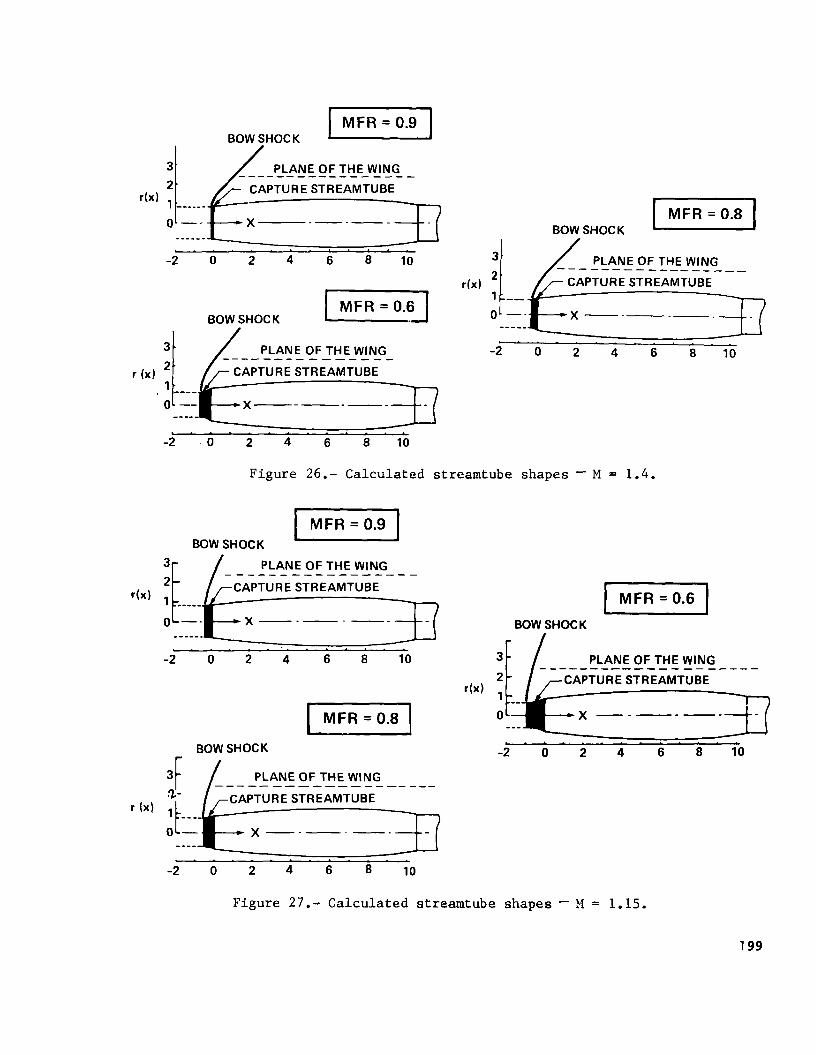
To calculate spillage effects on the nacelle pressure distribution, the capture streamtube that separates the flow into the inlet from the flow that spills around the inlet is replaced by a solid surface in the mathematical analyses. A simple approach was used in this study to calculate the inlet streamtube shape for spillage behind a normal shock. The method developed by Moeckel (Ref. 11) was used to calculate both the distance of the normal shock forward of the spilling nacelle and the capture streamtube radius at the normal shock. shown in Figure 25 by a simple polynomial equation. shape grows with zero initial slope (dr/dx = 0) at the normal shock to match the inlet radius at the nose of the nacelle.
The shape o f the capture streamtube was then represented as The calculated streamtube
The presence of the capture streamtube changes the pressure distribution over the nacelle. occurs at the lip of the nacelle due to the capture streamtube shape at the inlet. reducing the isolated nacelle drag. The isolated nacelle drag reduction is typically called "1 ip suction".
Relative to a non-spilling nacelle, a large expansion
This decreases the pressure near the front of the nacelle, thereby
180
The presence o f t h e capture streamtube changes t h e i n t e r f e r e n c e e f f e c t s associated w i t h t h e n a c e l l e pressures a c t i n g on t h e wing-body, as w e l l as on t h e i s o l a t e d n a c e l l e and t h e ad jacent nace l les . The c a p t u r e streamtube does n o t suppor t a f o r c e across i t s surface. Consequently, i n t h e analyses, o n l y t h e pressures a c t i n g on t h e n a c e l l e sur face c o n t r i b u t e d i r e c t l y t o drag on t h e n a c e l l e . Hence, t h e wing-body i n t e r f e r e n c e a c t i n g on t h e n a c e l l e s i s unchanged b y s p i 11 age.
10 SPILLAGE EFFECTS ON AERODYNAMIC INTERFERENCE
Streamtube shapes c a l c u l a t e d by t h e method descr ibed i n t h e p r e v i o u s s e c t i o n a r e shown i n f i g u r e s 26 and 27 f o r a range o f mass f l o w r a t i o s a t Mach 1.4 and 1.15, r e s p e c t i v e l y . The c a l c u l a t e d shapes i n d i c a t e r a t h e r l a r g e changes i n t h e streamtube area occur over s h o r t d i s t a n c e s r e l a t i v e t o t h e smooth shape o f t h e nace l le .
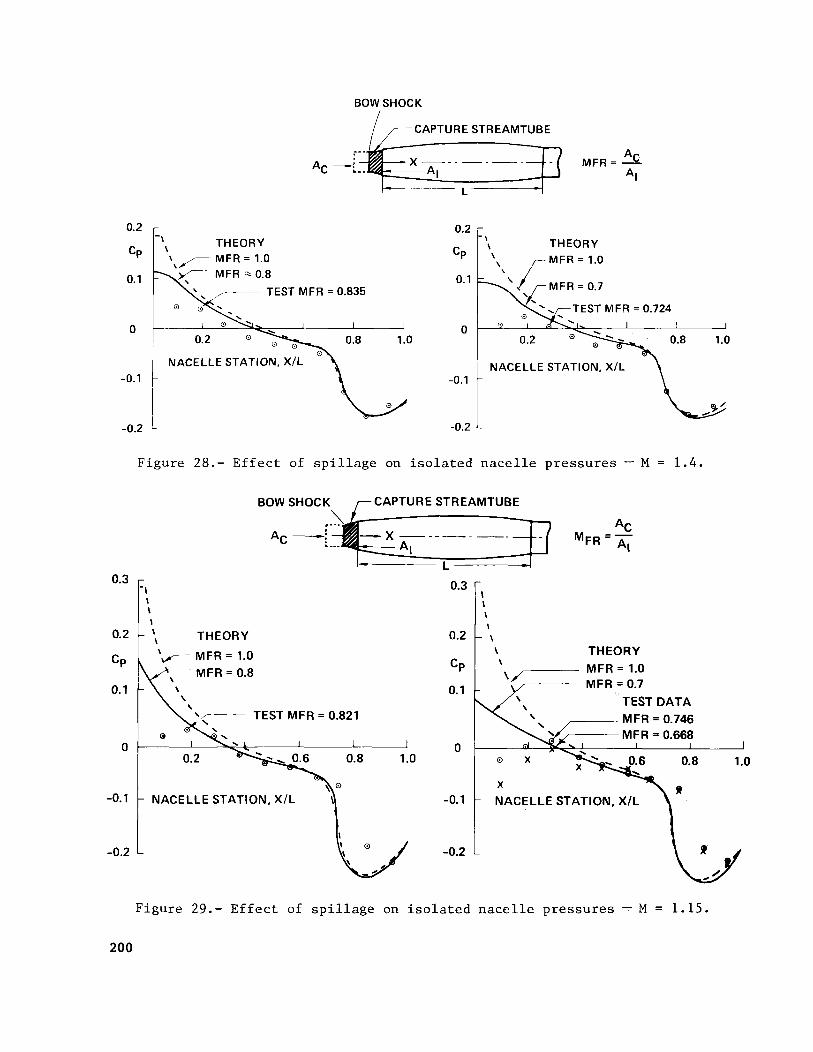
F igures 28 and 29 c o n t a i n comparisons o f p r e d i c t e d and measured i s o l a t e d n a c e l l e p ressure d i s t r i b u t i o n s f o r d i f f e r e n t amounts o f s p i l l a g e . Reduct ions i n mass f l o w r a t i o cause a decrease i n l o c a l p ressures on t h e forward s e c t i o n o f t h e n a c e l l e . b y t h e t h e o r y p a r t i c u l a r l y a t t h e lowest mass f l o w r a t i o (i.e., g r e a t e s t s p i l l a g e ) . T h i s i s p r o b a b l y because t h e t h e o r e t i c a l a n a l y s i s t r e a t s t h e c a p t u r e streamtube as a s o l i d shape i n a supersonic f l o w f i e l d , whereas t h e a c t u a l n a c e l l e exper iences a compl ica ted mixed subsonic-supersonic f l o w f i e l d .
The exper imenta l p ressure r e d u c t i o n i s g r e a t e r than p r e d i c t e d
The exper imenta l d a t a i n F i g u r e 30 show l a r g e r e d u c t i o n s i n i s o l a t e d n a c e l l e drag assoc ia ted w i t h t h e reduced nose pressures.
Slender body t h e o r y es t imates o f t h e e f f e c t o f s p i l l a g e on i n t e r f e r e n c e l i f t a r e shown i n F i g u r e 31. i n t e r f e r e n c e l i f t depend o n l y on t h e n e t area change o f t h e c a p t u r e streamtube and n o t t h e shape. agree w e l l w i t h t h e t e s t data.
The s lender body t h e o r y c a l c u l a t i o n s of
The t r e n d s p r e d i c t e d b y t h e s lender body t h e o r y est imates
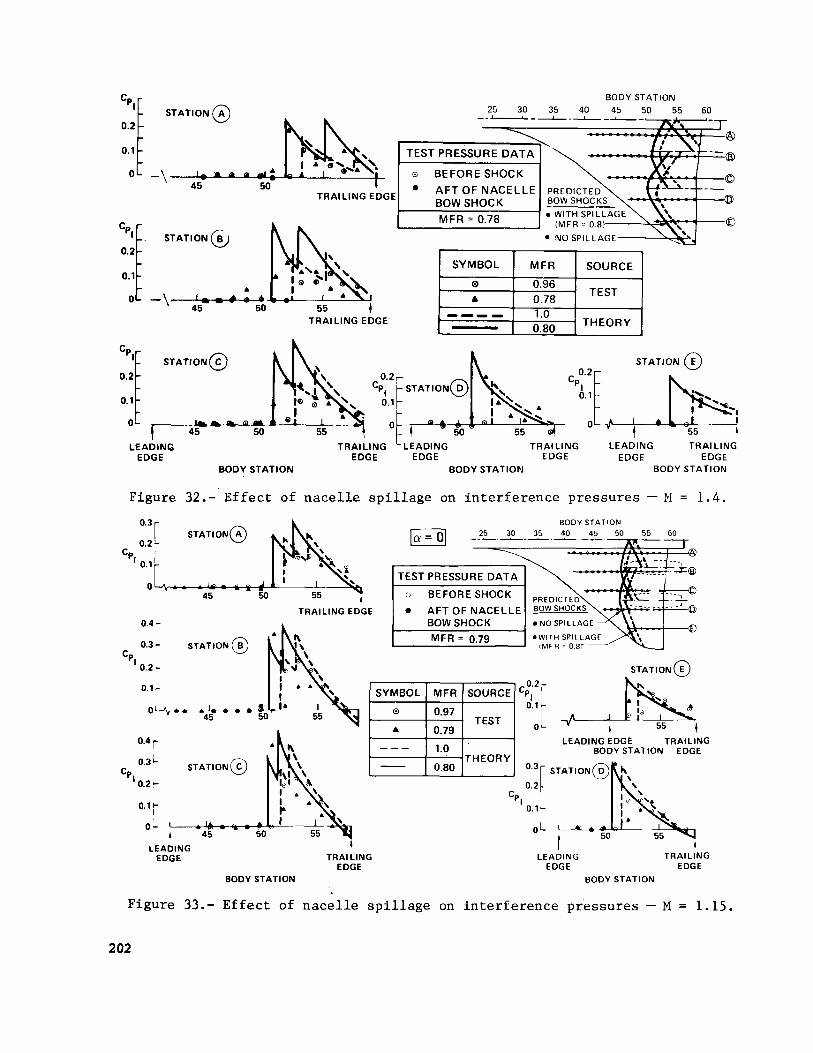
C a l c u l a t e d shock wave p a t t e r n s and n a c e l l e p r e s s u r e d i s t r i b u t i o n s on t h e wing a r e compared w i t h t e s t d a t a f o r t h e n a c e l l e s w i t h and w i t h o u t s p i l l a g e a t Mach 1.4 and 1.15 i n F i g u r e s 32 and 33, r e s p e c t i v e l y . These c a l c u l a t i o n s were made w i t h t h e streamtube geometr ies shown i n F i g u r e 26.
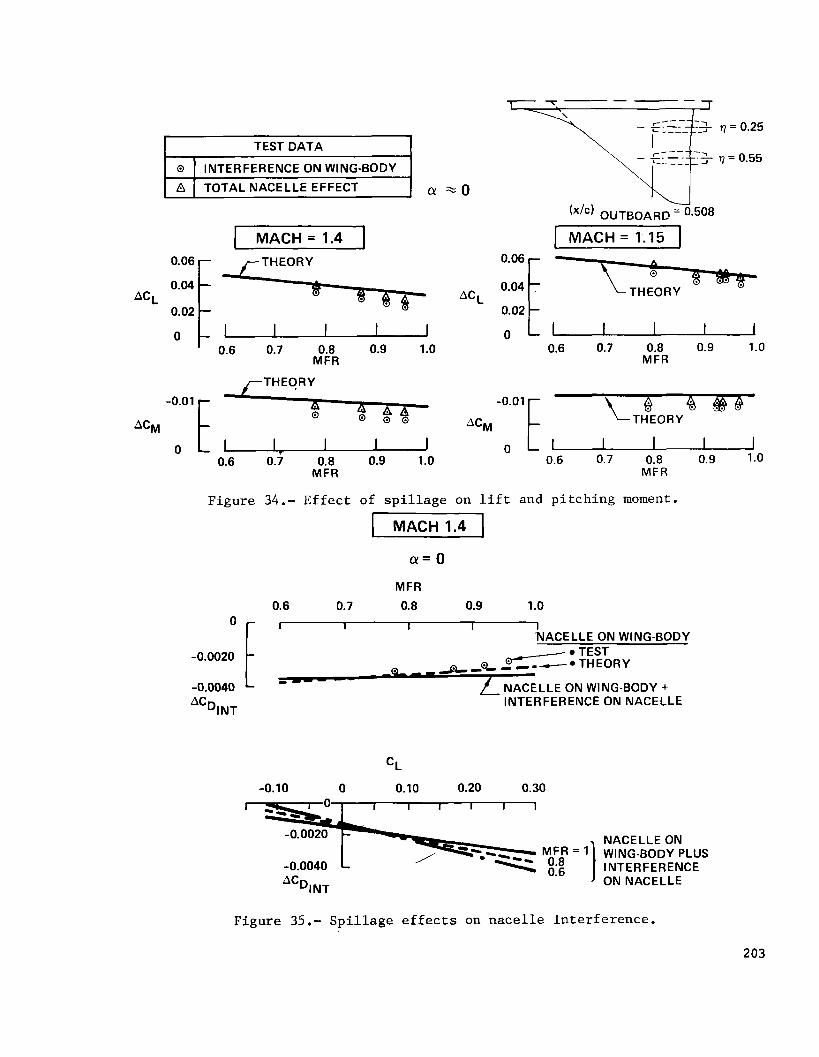
The p r e d i c t e d e f f e c t o f s p i l l a g e on n a c e l l e bow-shock l o c a t i o n s agrees w i t h t h e t e s t data. The p r e d i c t e d e f f e c t s o f s p i l l a g e on t h e i n t e r f e r e n c e pressures on t h e wing a r e i n f a i r agreement w i t h t h e t e s t r e s u l t s . corresponding i n t e r f e r e n c e l i f t and p i t c h i n g moment d a t a a r e shown i n F i g u r e 34. 1 i ft.
The
S p i l l a g e i s seen t o have a r a t h e r l a r g e e f f e c t on t h e i n t e r f e r e n c e
F i g u r e 35 c o n t a i n s comparisons o f c a l c u l a t e d n a c e l l e i n t e r f e r e n c e drag w i t h t e s t d a t a f o r d i f f e r e n t mass f l o w r a t i o s ( i .e. , amounts o f s p i l l a g e ) . The drag o f t h e i s o l a t e d n a c e l l e , measured a t t h e average mass f l o w f o r t h e
181
nace l les a t each nominal t e s t cond i t ion , was removed f rom t h e corresponding measured t o t a l wing-body-nacelle drag. S i m i l a r l y the t h e o r e t i c a l i n te r fe rence drag p r e d i c t i o n s do no t i nc lude the ca l cu la ted i s o l a t e d n a c e l l e drag.
The in te r fe rence o f the nace l l e pressure f i e l d a c t i n g on the wing-body produces near l y a l l o f t h e l a r g e favorab le i n t e r f e r e n c e f o r t h i s con f igu ra t i on arrangement. mass f low, has o n l y a smal l e f f e c t on t h e n e t i n t e r f e r e n c e drag a t a f i x e d angle o f a t tack. For example, a more favorab le i n te r fe rence drag increment o f 2 counts (ACD = -.0002) i s i n d i c a t e d r e l a t i v e t o the n o - s p i l l i n g c o n d i t i o n f o r a mass f l o w r a t i o o f 0.6. i n te r fe rence on the wing-body, agree q u i t e w e l l w i t h the p red ic t i ons .
Increased n a c e l l e sp i 1 lage, which corresponds t o reduced engine
The t e s t data, which inc ludes o n l y the nace l l e
As p rev ious l y mentioned, nace l l e s p i l l a g e has a r a t h e r l a r g e e f f e c t on the i n t e r f e r e n c e l i f t . Hence, the e f f e c t s o f s p i l l a g e on n e t wing-body p l u s nace l l e i n te r fe rence should become more s i g n i f i c a n t when comparisons are made a t constant t o t a l l i f t . p l u s nace l l e i n te r fe rence v a r i a t i o n s w i t h l i f t c o e f f i c i e n t f o r d i f f e r e n t amounts o f sp i l l age . l i f t i s increased. a re p red ic ted t o produce a favorab le i n te r fe rence drag increment o f approximately 7 courl'ts (ACg = -.0007) r e l a t i v e t o t h e nace l l es w i thout s p i l l a g e a t a l i f t c o e f f i c i e n t o f 0.2.
cond i t i ons (Fig. 35) p l u s reduced i s o l a t e d nace l l e drag (Fig. 30) can r e s u l t i n a t o t a l n a c e l l e i n s t a l l e d drag l ess than zero. Th is occurs, f o r example, f o r l i f t c o e f f i c i e n t s g rea ter than 0.12 f o r an engine mass f l o w r a t i o o f 0.6 (i.e., 40% s p i l l a g e ) a t Mach 1.4. a supersonic i n l e t (Mach 2.4 t o 2.7) operat ing a t t ranson ic speeds.
F igure 35 conta ins p r e d i c t i o n s o f t he ne t wing-body
The favorab le i n te r fe rence indeed becomes grea ter as For example, the nace l les w i t h a mass f low r a t i o o f 0.6
The combined e f f e c t s o f t h e increased favo rab le i n t e r f e r e n c e a t l i f t i n g
This i s t h e approximate mass f l o w r a t i o o f
11.0 CONCLUDING REMARKS
"No-Spil lage" Conclusions:
. F a r - f i e l d and n e a r - f i e l d methods adequately p r e d i c t wing p l u s body aero dyn ami c c h a r ac t e r i s t i c s . F a r - f i e l d and n e a r - f i e l d p r e d i c t i o n s o f t he i s o l a t e d n a c e l l e drag are good a t Mach 1.4. t h e t e s t r e s u l t s because o f an overest imate o f t h e n a c e l l e b o a t t a i l pressures.
. The drag p r e d i c t i o n s a t Mach 1.15 a re h igher than
. The "glance" method o f nace l l e pressure f i e l d superpos i t ion i s more accurate than the "wrap" method.
. The l o c a t i o n s o f nace l l e shocks are p red ic ted accura te ly by t he theory.
182
Predictions of nacelle interference pressures on the wing are good except in local areas near strong shocks where separation occurs.
Predictions of Mach number, nacelle location and angle of attack on nacelle aerodynamic interference are good, but become less accurate as the nacelles are moved forward of the wing leading edge.
. With the nacelles located aft near the wing trailing edge, the favorable interference effects of the nacelle on the wing-body become increasingly large as CL increases. measured and calculated, was less than skin friction drag.
The net installed drag, both
"With Spillage" - Conclusions
. The analysis method developed in the study does not properly account for spillage effects on the isolated nacelle pressure distribution near the lip. Consequently, the method overpredicts the drag of the isolated nacelle with spillage.
The method predicts the forward movement of the nacelle bow shocks on the wing due to spillage.
The method adequately predicted spillage interference effects on Sift, drag and pitching moment at zero angle of attack and Mach = 1.4.
The predicted spillage interference effects are favorable and improve with lift coefficient. With spillage, the nacelle installed drag can be less than zero due to the reduction in isolated nacelle drag, plus the increased favorable lift interference.
These initial results seem to indicate that satisfactory methods are available to predict interference lift, drag, pitching moment and pressure distributions of intalled engine nacelles at Mach 1.15 and 1.4 with mass flow ratios from 0.7 to 1.0 for configurations typical of efficient supersonic cruise airplanes.
183
REFERENCES
Swan, W. C.: Aerodynamics of Powerplant Installation, Part 11, AGARDograph 103, October 1965
Nichols, M. R.: Aerodynamics of Airframe-Engine Integration of Supersonic Aircraft, NASA TND-3390, 1966
Sigalla, A; Hallstaff, T. H.: Aerodynamics of Powerplant Installation on Supersonic Aircraft, Journal of Aircraft, July-August 1967, pp 273-277
Kane, E. J.; and Middleton, W. D.: Considerations of Aerodynamic Interference in Supersonic Airplane Design, AGARD Conference on Aerodynamic Interference, Proceedings No. 71, paper 3, September 1970
Bencze, D. P. : Nacelle-Airframe Interference at Low Supersonic Mach Numbers, AIAA Paper No. 72-1113, November 1972
Bencze, D. P.: Wind Tunnel Investigation of Nacelle-Airframe Interference at Mach Numbers of 0.90 to 1.4 - Data Report - Force Data,
Bencze, D. P.: Wind Tunnel Investigation of Nacelle - Airframe Interference at Mach Numbers of 0.9 to 1.4 - Data Report - Pressure Data, Volume I - NASA TM X-73, 149, Volume I1 - NASA TM X-73, 088, 1976
Bencze, D. P.: Experimental Evaluation of Nacelle-Airframe Interference Forces and Pressures at Mach Numbers of 0.9 to 1.4, NASA TM X-3321, March 1977
Middleton, W. D.; Lundry, J. L.; and Coleman, R. G.: A Computational System for Aerodynamic Design and Analysis of Supersonic Aircraft, Part 2 - User's Manual, NASA CR-2716, August 1976
NASA TM X-62, 489, 1976
(10) Kulfan, R. M.; Sigalla, A.: Real Flow Limitations in Supersonic Airplane Design, Journal of Aircraft, Vol 16, No. 10, pp 645-658, October 1979
(11) Moeckel, W. E.: Approximate Method for Predicting Form and Location of Detached Shock Waves Ahead of Plane or Axially Symmetric Bodies, NACA TN 1921, June 1949
184
' f \/g WING-BODY
WING PRESSURE LOCATIONS
0 STING MOUNTED SIX-COMPONENT INTERNAL BALANCE
0 WING UPPER AND LOWER SURFACE PRESSURES THROUGH STINGS
0 TRANSLATE: VERTICAL, STR E AMW ISE, SP ANW ISE PITCH WITH WING-BODY
0 VARIABLE MASS FLOW 0 INTERNAL SIX-COMPONENT
BALANCES (RIGHT PAIR)
PRESSURES (LEFT PAIR) 0 NACELLE SURFACE
AVAILABLE POSITIONS
NACELLE PRESSURE STATIONS
Figure 1.- NASA-Ames nacellelairframe interference model features.
0 0
. * . D . O . O . # . D .
o o o e *
0 . a . e . 0 . 0 .
Upper and lower surface 0 . 0 . 0 .
Lower surface only
Figure 2.- Wind tunnel model details.
185
- I I _------ 7- --- - - - _ -
I --!--I
WING CHORD PLANE AT OUTBOARD NACELLE
-7 - - TRAILING EDGE (STATION 5)
I THISPAPER
F i g u r e 3. - Nacelle geometry comparison.
I 0 MACH EFFECTS
0 ANGLE OF ATTACK EFFECTS
0 SPILLAGE EFFECTS
0 NACELLE STATION
0 THREE DIFFERENT NACELLE SPANWISE LOCATIONS
NACELLE STATION
ONE-STATION STAGGER --- r---2 L - - - - - d
TWO-STAT1 ON STAGG E R I---- -7 - - - - - _ _ _ J L
F i g u r e 4.- Tes ted n a c e l l e l o c a t i o n s .
186
I 1 I NACELLE PRESSURE FIELD I
METHOD a
OSOMMER AND SHORT T * METHOD
DRAG COMPONENT
REPRESENTATION INLET MACH PRESSURE FIELD
NUMBER THEORY SUPERPOSITION
M, MLOC "WRAP" "GLANCE"
- - o x -FRICTION DRAG cDF
.FAR-FIELD THEORY (AREA RULE) PROGRAM
C -VOLUME WAVE DW DRAG LINEAR 0 0
CD -DRAG DUE TO L I F l L
I 1 I I I I
X-CAPABI L l TY @-USED IN THIS STUDY
a MIDDLETON/CARLSON-SUPERSONIC AERODYNAMIC DESIGN AND ANALYSIS SYSTEM
F i g u r e 5.- Drag p r e d i c t i o n methods.
IJJWRAP" APPROACHJ
CENTERLINES
.SHOCKS AND PRESSURE "WRAP" AROUND NACELLES ADJACENT TO OUTER WING
0 FAR-FIELD APPROACH
1 "GLANCE" APPROACH/
CENTERLINES
0 SHOCKS AND PRESSURES "GLANCE" AWAY FROM WING AT ADJACENT NACELLES
F i g u r e 6.- "Glance1' and "wrap" p r e s s u r e f i e l d s s u p e r p o s i t i o n .
187
NACELLE INSTALLED =vJ I WAVE DRAG I + I LIFT INTERFERENCE^ DRAG
NACELLE S'KIN FRICTION
II - NACELLE PRESSURE DRAG
+ NACELLE ON WING-BODY
VOLUME
Y +
+5iF +
WING-BODY VOLUME ON NACELLE
MUTUAL NACELLE INTERFERENCE
.ADJACENT 0 OFF WING
NACELLE ON-TO
/
I t CHANGE IN WING-BODY DRAG DUE TO LIFT
+ NACELLE ON WING LIFTING
SURFACE WING -2s
+ WING LIFTING PRESSURES
ON NACELLES
WING pi&-
Figure 7.- Nacelle i n s t a l l e d d r a g components - no s p i l l a g e .
REMOVAL OF DRAG DUE TO LIFT AT CL = 0 (THEORY)
- e t 0.01 5
cDO
0.010
I 0.005
I MACH NUMBER I 0.8 1.0 1.2 1.4
-0.0010 1 ACDL
7 NEAR-FIELD THEORY
FAR-FIELD THEORY
WAVE DRAG TEST DATA
---fL------ FRICTION DRAG
t I
0.6 0.8 1 .o 1.2 1.4 1.6 1.8 0 t ,
MACH NUMBER
F i g u r e 8.- Wing + body d r a g comparisons a t z e r o l i f t .
188
0.3
CL
0.2
0.1
-0.1
F i g u r e 9.- Wing + body d r a g p o l a r - m a c h 1 .4 .
0.3
CL
0.2
0.1
0
-0.1
F i g u r e 10.- Wing + body d r a g p o l a r - mach 1.15.
189
0.3 ,-
CL - 0.2 -
0.1 - -
0 - ’ 1
0 4 6
a, DEGREES
-0.1
THEORY -
- TEST-b I
b Q Q I 0 1 8
-
Figure 1 1 . - Wing + body l i f t
0.3
CL
0.2
0.1
0.3
CL
0.2
0.1
0
-0.1
/ -TEST v 0, DEGREES
Figure 12.- Wing + body l i f t and p i t c h i n g moment
190
I TESTDATA I
5 -
L* I g A @ A A ~ C
4 - A
SUBSONIC LINEAR THEORY
ILIFT CURVE SLOPE^
.
A 3’ A #
LINEAR THEORY
Figure 13.- Wing + body lift characteristics.
OF ROOT CHORD 6 0 .
C MO f A * A q o R Y
0.01 - A r b * A SUBSONIC
TEST DATA
$ 4 4 0 4 @ A
- *yF SU BSON IC
AERODYNAMIC CENTER
PERCENT 70 [
0 1 I I 1 L
0.8 1.0 1.2 1.4 MACH NUMBER
0.8 1 .o 1.2 1.4 MACH NUMBER
Figure 14.- Wing + body pitching moment characteristics.
191
[ NACELLE PRESSURE STATIONS I a=O MFR = MAX “““I ZEROLIFTDRAG 1
1 7 FAR-FIELD
I I I “Li’F I I 0.8 1.0 1.2 1 1.4
1 DISTRIBUTIONS 1 MACH
0.2
0.1
0 cP
-0.1
-0.2
1 1 1 1 1 J
- 0.2 0.4a0.610.8 1.0
- NACELLE STATION, x/P - - .bp
1 1 1 1 1 J
- 0.2 0.4a0.610.8 1.0
- NACELLE STATIO< x/P
.bp
piEiGTG1 0.2 O a 3 k F T H E O R Y
cP
-0.1 - C NACELLE STATIO^, x / a
-0.2 L
Figure 15.- I s o l a t e d n a c e l l e z e r o - l i f t comparisons.
0 MFR 5 1 .a = o
OUTBOARD NACELLE
w PRESSURE BEHIND 111 PRESSURE JUMP
PRESSURE BEHIND Z n i l N A C E L L f BOW SHOCK JUMP ~ ~~ 1
Figure 16.- Nacelle i n t e r f e r e n c e p r e s s u r e f i e l d s , M = 1.4; a f t n a c e l l e l o c a t i o n - s t a t i o n 5.
192
0 MFR a 1 o a = o
OUTBOARD
\ I
CONTINUATION OF BOW SHOCK PAST ADJACENT NACELLE
--
AFFECTED BY NACELLES
BOW SHOCK-
Figure 17.- Nacelle i n t e r f e r e n c e pressure f i e l d s , M = 1.15; a f t n a c e l l e l o c a t i o n - s t a t i o n 5.
193
NACELLE BOW SHOCK
g = 0.55 ....... I* BOW SHOCK LOCATION ON WING
--- AFT SHOCK LOCATION ON WING NO NACELLE INFLUENCE
AFFECTED BY NACELLES
STATION @ STATION @ 0.2 0.2 h, - 1
----
BODY STATiON BODY STATION -0.2 TRAILING -0.2 .
TRAILING EDGE
BOW SHOCK LOCATION ON WING AFT SHOCK LOCATION ON WING
i
0.2
0 -
-0.2 STATION @
-
- EDGE
t
STATION @ :., I '.
LEADING TRAIL
1 60
.ING
STATION @
Figure 18.- Nacelle interference pressure fields - M = 1.4; forward location - station 3.
194
- ----
BOW SHOCK
WING LOWER SURFACE TEST PRESSURE DATA
MFR= 1
NO NACELLE INFLUENCE
BOW SHOCK LOCATION ON WING
AFT SHOCK LOCATION ON WING PREDICTED
STATION @ 0.4 r STATION @ 0.4
0.2
0
-0.2
-0.4 1 TRAILING EDGE
NACELLE BOW SHOCK
cpl
0.2 -
0 -
-0.2 I
-0.4 -
.
TRAILING LEADING EDGE
-0.4 C -
0.2 PI
-
0 -
-0.2 -
EDGE
AFT SHOCK LOCATION ON WING
STATION @ L
I '
I \ I \ I '
LEADING TRAILING EDGE EDGE
STATION @ r \ I '\ I ' -4---:;m 45
LEADING TRAILING EDGE EDGE
Figure 19.- Nacel le i n t e r f e r e n c e p res su re f i e l d s - M = 1.15; forward n a c e l l e l o c a t i o n - s t a t i o n 3 .
195
1 DRAG I ACD TOTAL NACELLE ISOLATED
I NSTAL LED DRAG NACELLES
I 1
-0.10 0.10 0.20 0.30 CL
-0.0040 NACELLE INTERFERENCE !v ON WING + BODY TEST
THEORY
’
A
* @ @ a b AC,S -0.005.-
I I 1
q = 0.55 Y 7
A U A Q A A B 0
1 I I I I I
“M I PITCHING MOMENT I THEORY --
A A &
1.- - J 1 O L- -0.01 0 0.10 0.20 CL 0.30
THEORY -- . ..) t’
AcL (I 0.06 r
A A A A A
I I O I 1 - I - ~ - -I... I 1 I 2
0 2 4 6 8
a, DEGREES
Figure 20.- Nacelle c o n t r i b u t i o n t o l i f t , d r a g , and p i t c h i n g moment - M = 1.4.
-.- -- q = 0.55 I----
C-----J _ - _ _ _
TOTAL NACELLE INSTALLED DRAG ISOLATED NACELLES
NACELLE 1;UTEHFERENCE OF4 WING-BODY
0.02--
1 1 1 I I I 1 I I J
0 2 4 6 8 a, DEGREES
F i g u r e 21.- Nacelle c o n t r i b u t i o n t o l i f t , d rag , and p i t c h i n g moment - M = 1.15.
196
-'3 - Ml! - 0.7 Cp M,
1.4 1.6 I 0.8
0.6
0.4
RANGE FOR TEST LIFT COEFFICIENTS
1 - 0 . 1 5
I 1 1 1 1 1 I I
1.0 1.2 1.4 1.6 1.8 2.0 2.2 2.4 M,
F i g u r e 22.- E f f e c t of l o c a l p r e s s u r e f i e l d on i n t e r f e r e n c e l i f t .
[ INTERFERENCE LIFT 1 C
0.04 kl ,THEORY, NACELLE ON WING
OUTBOARD NACELLE LOCATION, -0.04 -0-02 - t FRACTION OF CHORD
a
(INTERFERENCE DRAG^ THEORY,
e NACELLE ON WING TOTAL
0.0020 w'p.*-
0 U
h
-0.0020
-0.0040 ._ OUTBOARD NACELLE LOCATION, FRACTION OF CHORD
-1
PITCHING MOMENT 0.01 $',
0 ' 0.6 d
t -0.01 L
OUTBOARD NACELLE LOCATION, f RACTION OF CHORD
F i g u r e 23. - E f f e c t of n a c e l l e l o c a t i o n s on aerodynamic i n t e r f e r e n c e - M = 1.4.
197
INTERFERENCE PITCH I N G
OUTBOARD NACELLE LOCATION, FRACTION OF CHORD
THEORY, NACELLE ON WING
P
OUTBOARD NACELLE LOCATION, FRACTION OF CHORD
0 0.2 -0.010 * 0
F i g u r e 24.- E f f e c t o f n a c e l l e l o c a t i o n on aerodynamic i n t e r f e r e n c e - M = 1.15.
APPROACH: .USE MOECKEL'S METHOD TO PREDICT
NORMAL SHOCK LOCATION
SENTATION OF STREAMTUBE SHAPE
TION
.USE SIMPLE POLYNOMIAL REPRE-
.CHECK STREAMTUBE REPRESENTA-
*NACELLE PRESSURES *NACELLE FORCES
HYPERBOLIC
CAPTURE STREAMTUBE EQUATION
CAPTURE AREA
= *+(l - q l - I y ) INLET AREA
STR E AMTUB
QUADRATIC REPRESENTATION: N = 2
F i g u r e 25.- S p i l l a g e s t r e a m t u b e r e p r e s e n t a t i o n .
198
BOW SHOCK
PLANE OF THE WING - - - _ _ _ _ _ _ CAPTURE STREAMTUBE
)(-------r-
r (x)
e---_
-2 0 2 4 6 8 1 0
c . . . - . I - L
-2 0 2 4 6 8 1 0
Figure 26.- Calculated streamtube shapes - M = 1.4.
1 MFR=0.9 1 BOW SHOCK
I MFR=0.8 I BOW SHOCK
PLANE OF THE WING ------ -----_---- CAPTURE STREAMTUBE
)(--- --
L
-2 O 2 4 6 8 IO
&
6 8 10 - 2 0 2 4
Figure 27.- Calculated streamtube shapes - M = 1.15.
199
CP THEORY -\
\,A- MFR = 1.0
F i g u r e 28.- E f f e c t of s p i l l a g e on i s o l a t e d n a c e l l e p r e s s u r e s - M = 1 .4 .
- \ THEORY
BOW SHOCK CAPTURE STREAMTUBE
AC MFR=F
t NACELLE STATION, X/L -4
0.3 [I: \ 0.2
CP
0.1
0
-0.1
-0.2
THEORY
< MFR = 1.0 - MFR = 0.8
\
- TEST MFR = 0.821
1 I 0.8 1.0
Om3 p, 0.2
CP
0.1
0
-0.1
' \
- \ \ THEORY
TEST DATA
I 1.0
X
- NACELLE STATION, X/L
-0.2 1
F i g u r e 29.- E f f e c t of s p i l l a g e on i s o l a t e d n a c e l l e p r e s s u r e s - M = 1.15.
200

THEORY (MFR = 1) 0.0015
cDN 0.0010
0.0005
MFR
DN C
THEORY (MFR = 1) /-
1 MACH= 1.15 I
t C
-2 DF
C -
0.0015
0.0010
15 0.000
0.6 0.7 0.8 0.9 1 .o f MFR
Figure 30.- E f f e c t of s p i l l a g e on i s o l a t e d n a c e l l e drag.
(%) OUTBOARD ' = -0.035 'U
1 M = 1.15 1 ~ - ? ? - ~ - ? - 3 *
CL) 0.02
0.7 0.8 0.9 1 .o
= 0.25
= 0.55
-0.04 - O * 0 2 t \
SYMBOL I INTERFERENCE
1 IWV;LEONWING~ LINEARY THEORY IMFR = 1.0)
I SPILL
,LlNEARY THEORY
- 1 MFRl A ~ N L E T
Li
-0.02 o.ol -0.02
1111111 0.7 0.8 0.9 1.0
MFR
L I I l 1 1 1
0.7, 0.8 0.1) 1.0
MFR
Figure 31.- Slender body theory estimates s p i l l a g e i n t e r f e r e n c e l i f t .
2 01
BODY STATION 25 30 35 40 45 50 55 60
50 TRAILING EDGE
0.1
55 TRAILING EDGE
LEADING TRAILING L~~~~~~~ TRAILING LEADING TRAl LING EDGE EDGE EDGE EDGE EDGE EDGE
BODY STATION BODY STATIOF! BODY STATION
Figure 32. - E f f e c t of n a c e l l e s p i l l a g e on i n t e r f e r e n c e p r e s s u r e s - M = 1.4 .
0.4 - TRAILING EDGE L
0.3- STATION @ 0.2 - 0.1-
0- A l e 0 0 0 45
0.4 r
0.1 I- I
I
EDGE
LE AD IN G EDGE TRAILING
BODY STATION
BODY STATION 25 30 35 40 45 50 55 60
N O SPILLAGE
* W I T H SPl l L
STATION@
"~ ,h, 55 L
LEADING EDGE TRAILING RODY STATION EDGE
55 L
TRAILING I
LEADING EDGE EDGE
BODY STATION
Figure 33.- E f f e c t of n a c e l l e s p i l l a g e on i n t e r f e r e n c e p r e s s u r e s - M = 1.15.
202
I TEST DATA I 0
A INTERFERENCE ON WING-BODY
TOTAL NACELLE EFFECT cY*o
I MACH = 1.4 I
A 0.8 0.9 1.0
MFR 0.6 0.7
r THEORY
[ M A C H = 1.15
THEORY 0.04
0.02 0 t 0 0.6 0.7 0.8 0.9 1 .o
MFR
O L- 0.6 0.7 0.8 0.9 1.0 0.6 0.7 0.8 0.9 1.0
0
MFR MFR
Figure 3 4 . - E f f e c t of s p i l l a g e on l i f t and p i t c h i n g moment.
a = 0
MFR 0.6 0.7 0.8 0.9 1.0
'NACELLE ON WING-BODY TEST
-0.0020 ,,.-.THEORY @-----
NACELLE ON WING-BODY + INTERFERENCE ON NACELLE
-0.0040
CL
-0.10 0 0.10 0.20 0.30
NACELLE ON WING-BODY PLUS INTERFERENCE ON NACELLE
0.6 -0.0040
''DINT
Figure 35.- S p i l l a g e e f f e c t s on n a c e l l e i n t e r f e r e n c e .
203