Embed Size (px)
Citation preview

Design and Experimental Investigation of a
Hydroxyl Ammonium Nitrate Based
Workhorse Microthruster
Richard Grist
A thesis
submitted in partial fulfillment of the
requirements for the degree of
Master of Science in Aeronautics and Astronautics
University of Washington
2016
Committee:
Carl Knowlen, Chair
James Hermanson
Program Authorized to Offer Degree:
Aeronautics and Astronautics

© Copyright 2016
Richard Grist

University of Washington
Abstract
Design and Experimental Investigation of a
Hydroxyl Ammonium Nitrate Based Workhorse
Microthruster
Richard Grist
Chair of the Supervisory Committee:
Research Associate Professor Carl Knowlen
Aeronautics and Astronautics
Hydroxylammonium nitrate-based (HAN-based) monopropellant is being investigated as an
alternative to hydrazine due to its lower inherit hazard of handling and higher energy density. It is
hypothesized the light-off temperature and corresponding preheat power required for
microthrusters using HAN-based monopropellants decrease with decreasing droplet size. The
viscous nature of this propellant, however, creates significant challenges in its atomization. Having
developed a means to control the droplet size down to 50 micrometers in diameter, experiments
are proceeding with a laboratory-scale workhorse thruster apparatus designed for the operation in
the 0.1 - 1 Newton thrust range. As part of this program, the injector atomization capabilities in a
pressurized test cell were examined with high speed photography, flow-through light-off
experiments were carried out at ambient pressure using interchangeable steel and quartz
heated-catalyst housings, and thruster tests were performed at elevated chamber pressures. Results
from these experiments show discrepancies between ambient pressure ignition testing of the
HAN-based monopropellant and those conducted in the pressure building workhorse thruster. This

may suggest a link between the complete combustion of the propellant and chamber pressure. In
the workhorse thruster, successful ignition of the HAN-based monopropellant was obtained with
a combustion efficiency of approximately 75 percent.

i
TABLE OF CONTENTS
List of Figures ................................................................................................................................ iv
Chapter 1. Introduction ................................................................................................................... 1
Chapter 2. High-Pressure Atomization ........................................................................................... 3
2.1 Purpose ............................................................................................................................ 3
2.2 Design ............................................................................................................................. 3
2.3 Test Results ..................................................................................................................... 4
Chapter 3. Flow-Through Reactor .................................................................................................. 7
3.1 Purpose ............................................................................................................................ 7
3.2 Design ............................................................................................................................. 7
3.3 Test Series and Results ................................................................................................... 8
Chapter 4. Visible Flow-Through Reactor .................................................................................... 11
4.1 Purpose .......................................................................................................................... 11
4.2 Design ........................................................................................................................... 11
4.3 Test Results ................................................................................................................... 12
4.3.1 Single Catalyst Testing ............................................................................................. 13
4.3.2 Two-Catalyst Testing ................................................................................................ 15
Chapter 5. Development of the Workhorse Microthruster ........................................................... 18
5.1 Purpose .......................................................................................................................... 18
5.2 Workhorse Microthruster Design Requirements .......................................................... 18
5.3 Workhorse Microthruster Concept ............................................................................... 19

ii
5.4 Workhorse Microthruster Sizing................................................................................... 20
5.4.1 Nozzle Throat Sizing ................................................................................................ 20
5.4.2 Combustor Length .................................................................................................... 21
5.4.3 Monopropellant Residence Time .............................................................................. 22
5.4.4 Pressure Vessel Sizing .............................................................................................. 23
5.5 Thermal Modeling ........................................................................................................ 24
5.5.1 Setup ......................................................................................................................... 24
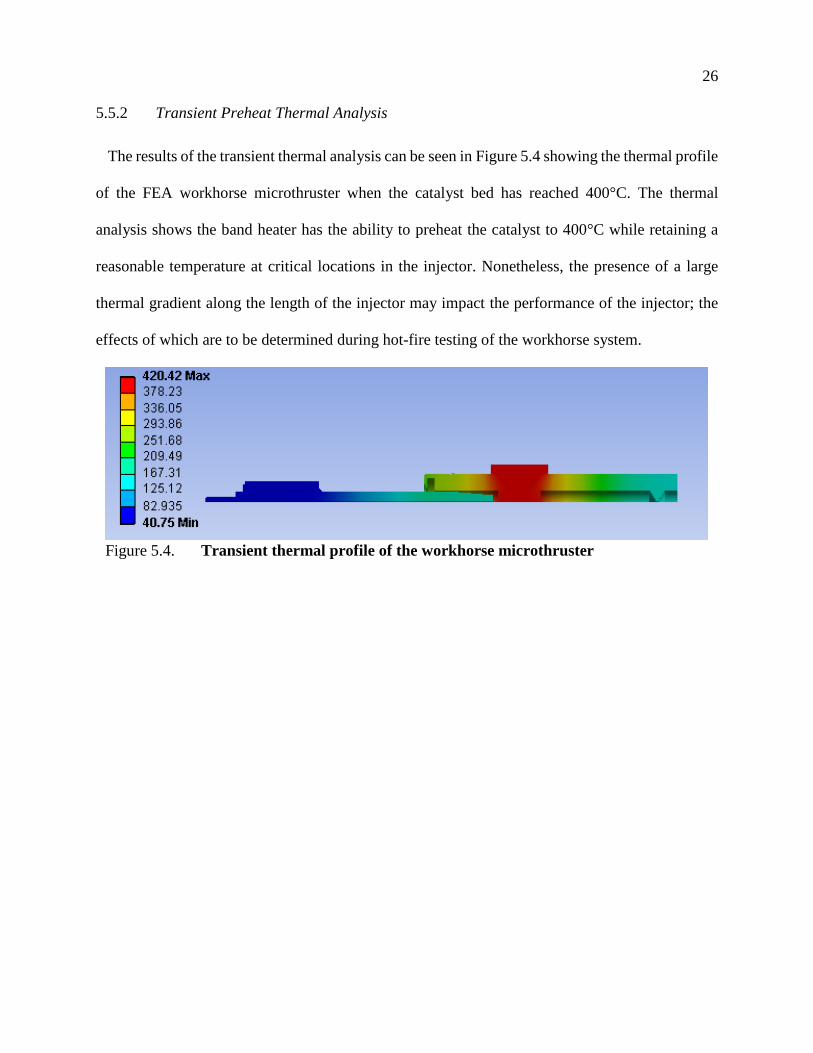
5.5.2 Transient Preheat Thermal Analysis ......................................................................... 26
5.5.3 Steady State Thermal Analysis ................................................................................. 28
5.5.4 Heat Flux into Injector Assembly ............................................................................. 29
5.5.5 Comparison with Testing .......................................................................................... 30
Chapter 6. Workhorse Microthruster Testing ............................................................................... 32
6.1 Purpose .......................................................................................................................... 32
6.2 Testing Hardware and Software .................................................................................... 32
6.2.1 Hardware ................................................................................................................... 32
6.2.2 Software .................................................................................................................... 35
6.3 Configuration ................................................................................................................ 36
6.4 Open Nozzle Hot-Fire Tests ......................................................................................... 36
6.5 Pressurized Hot-Fire Test Results ................................................................................. 39
6.5.1 Single Catalyst Test without Volume Reducing Insert ............................................. 39
6.5.2 Single Catalyst Test with Volume Reducing Insert .................................................. 41
6.5.3 Frequency Analysis of Pressure Data ....................................................................... 42
6.5.4 Single Catalyst Test Outlier ...................................................................................... 44

iii
6.5.5 Single Catalyst Pulsed Testing.................................................................................. 45
6.5.6 Workhorse Thruster Combustion Efficiency ............................................................ 46
Chapter 7. Conclusions ................................................................................................................. 51
References ..................................................................................................................................... 52
Appendix A: Procedures ............................................................................................................... 53
Appendix B: Drawings ................................................................................................................. 65
Appendix C: Matlab Data Extract Code ....................................................................................... 70
Appendix D: Matlab FFT Code .................................................................................................... 73

iv
LIST OF FIGURES
Figure 2.1. Pressurized test cell for injector studies.................................................. 3
Figure 2.2. Propellant simulant atomization ............................................................. 4
Figure 2.3. Propellant simulant atomization with large droplet spitting ................ 4
Figure 2.4. Maximum atomizing flow rate vs. backpressure ................................... 5
Figure 3.1. Design of stainless steel flow-through reactor ........................................ 7
Figure 3.2. Stainless steel flow-through temperature ............................................... 8
Figure 3.3. Stainless steel reactor flow-through test, 400°C, 1 mL/min .................. 9
Figure 3.4. Stainless steel reactor flow-through test, 350°C, 1 mL/min .................. 9
Figure 4.1. Quartz flow through reactor .................................................................. 11
Figure 4.2. Quartz flow-through test: 2 mL/min ..................................................... 13
Figure 4.3. Quartz flow-through test: 20 mL/min ................................................... 13
Figure 4.4. Quartz flow-through test: 2 mL/min ..................................................... 15
Figure 4.5. Quartz flow-through test: 15 mL/min ................................................... 16
Figure 4.6. Quartz flow-through test: 5 mL/min ..................................................... 17
Figure 5.1. Workhorse microthruster schematic .................................................... 19
Figure 5.2. Workhorse microthruster schematic with insert ................................. 22
Figure 5.3. FEA microthruster model ...................................................................... 25
Figure 5.4. Transient thermal profile of the workhorse microthruster ................ 26
Figure 5.5. Temperature during preheat for locations along the injector ............ 27
Figure 5.6. Steady state thermal profile of the workhorse microthruster ............ 28
Figure 5.7. Power dissipated through the injector system during preheat ........... 29
Figure 5.8. Temperature of microthruster during preheat and steady state ........ 30
Figure 6.1. Workhorse microthruster test stand ..................................................... 32
Figure 6.2. Propellant feed pump ............................................................................. 33
Figure 6.3. Workhorse PID Diagram ....................................................................... 34
Figure 6.4. Open combustor testing, preheat 415°C ............................................... 37
Figure 6.5. Open combustor testing, preheat 325°C ............................................... 38
Figure 6.6. Microthruster test: 20 mL/min flow rate without chamber insert ..... 40

v
Figure 6.7. Microthruster test: 20 mL/min flow rate with chamber insert .......... 41
Figure 6.8. Time-frequency response of workhorse pressure data ........................ 43
Figure 6.9. Microthruster test: 2.5 mL/min flow rate ............................................. 44
Figure 6.10. Pulse test: 20 mL/min flow rate, 1.5 s pulse cycle ................................ 45
Figure 6.11. Combustion efficiency vs chamber pressure ........................................ 47
Figure 6.12. Combustion efficiency vs propellant flow rate ..................................... 49

vi
ACKNOWLEDGEMENTS
First and foremost I would like to thank Dr. Carl Knowlen, my research advisor and principal
investigator for the microthruster work conducted at the University of Washington. His guidance
and knowledge passed along over the course of this project have proven to be invaluable. I also
give my thanks to Dr. Jim Hermanson for sharing his lab space to conduct experiments and being
on my master’s thesis committee.
I would also like to recognize the NASA Glenn Research Center for sponsoring the research
with partnership with Systima Technologies Inc. of whom I appreciate their partnership and
cooperation with on the project. From Systima, I would like to give thanks to Gautam Shah and
Stephanie Sawhill for all of the time and resources they have invested into the project and for
putting up with any of the headaches I may have caused in the process of reviewing papers to be
published.
I appreciate fellow graduate research assistant Jeff Glusman for keeping myself sane during the
long hours working in the ‘grad’ room. I would also like to thank undergraduate research associate
Greg Derk who has spent countless hours in the research lab running experiments and was
instrumental in developing the LabVIEW® script that controls the entire experiment. I also
appreciate Charlie Yang for doing all of the random machining work that needed to be done over
the course of the project
Lastly, I am grateful for my family who have supported me through my undertakings. They have
given me the yearning, willpower, and fortitude to pursue my dreams and have taken the liking of
calling me a rocket surgeon.

1
Chapter 1. INTRODUCTION
Although hydrazine monopropellant has a strong heritage in spacecraft propulsion
applications, its toxicity leads to very high costs for shipment, storage, and handling. Green
propellants with low toxicity and less inherent hazard have been identified and developed for use
in the space industry [1]. In addition to offering greatly reduced handling costs, green
monopropellants may provide higher thruster performance than hydrazine propellants, permit
shorter launch processing times, and have greater density efficiency that could lead to substantial
cost savings and extended mission life for spaceflight missions [2]. Green monopropellants that
have been selected for next generation thrusters include HAN-based ionic-salt monopropellants.
Green propellants pose several challenges that this new technology seeks to overcome:
1. HAN-based monopropellants are generally more dense and viscous than hydrazine
propellant. However, due to viscous effects HAN-based propellants are particularly
difficult to accommodate when designing microthrusters, which rely on small flow paths.
Traditional propellant-injection technology can achieve atomization but at the cost of high
feed pressures with a large injector pressure drop. By finely atomizing the propellant into
a uniform spray, it is possible to wet the catalyst bed more evenly than with conventional
injector designs to minimize localized erosion caused by high propellant impingement
velocity on the catalyst due to the high injection pressure and extend the usable thruster
life [3].
2. Current engine designs using HAN-based propellants require a high catalyst bed pre-heat
temperature of approximately 300°C to 350°C to initiate propellant ignition and minimize
catalyst degradation [4]. Utilizing a finely atomized propellant spray may more efficiently

2
engage the catalyst. Finer atomization of the monopropellant may promote a greater degree
of reaction with the catalyst by increasing the rate of heat transfer and thus decomposition
of the HAN-based propellant. This may also allow for lower catalyst bed pre-heat
temperatures which results in less heater power required to operate the thruster.
Meeting the challenge of atomizing HAN-based monopropellant to increase thruster
performance may stimulate greater utilization of this green propellant in microthruster systems.
The ability to generate a fine propellant spray on demand reduces the logistics of generating small
impulse bits for precision flying and spacecraft orientation applications. Having developed a very
promising technology for droplet atomization, the benefits in terms of reduced input power to
catalysts for propellant ignition are being explored. To this end, a workhorse thruster has been
designed and fabricated to enable testing of the new injector technology. Light-off characteristics
and combustion characteristics will be quantified with this device as function of catalyst initial
temperature, catalyst bed length, propellant flow rate, and chamber pressure. The following
chapters describe the experimental apparatus used in various subsystem tests carried out and the
detailed design of the laboratory scale workhorse thruster. The experimental program had three
phases of testing: 1) verification of droplet atomization at high pressure, 2) flow-through ignition
tests using heated catalyst without combustion chamber, and 3) workhorse thruster operation over
a thrust range of 0.1 – 1 Newton.
3
Chapter 2. HIGH-PRESSURE ATOMIZATION
2.1 PURPOSE
A pressurized test cell (155 mm-ID x 1000 mm-long) with a pressure rating of 70 bar was used
to examine injector operation and atomization quality at the elevated pressures expected during
thruster operation. In order to determine operational capability at the expected chamber pressures
of the workhorse microthruster system, reliable and complete atomization must first be achieved
in a controlled environment.
2.2 DESIGN
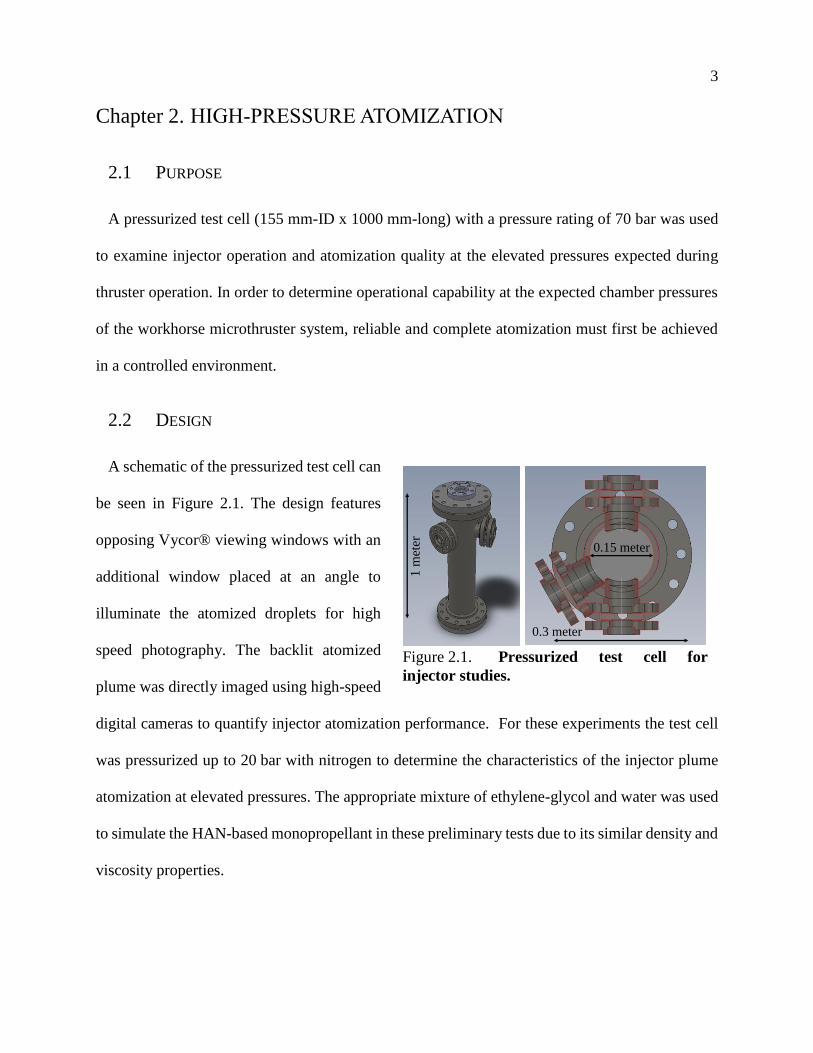
A schematic of the pressurized test cell can
be seen in Figure 2.1. The design features
opposing Vycor® viewing windows with an
additional window placed at an angle to
illuminate the atomized droplets for high
speed photography. The backlit atomized
plume was directly imaged using high-speed
digital cameras to quantify injector atomization performance. For these experiments the test cell
was pressurized up to 20 bar with nitrogen to determine the characteristics of the injector plume
atomization at elevated pressures. The appropriate mixture of ethylene-glycol and water was used
to simulate the HAN-based monopropellant in these preliminary tests due to its similar density and
viscosity properties.
Figure 2.1. Pressurized test cell for
injector studies.
1 m
eter
0.3 meter
0.15 meter

4
2.3 TEST RESULTS
Testing was conducted of three
custom-built injectors that were developed
for use in the workhorse microthruster
system and associated testing apparatus. A
video frame from a representative injection
test using injector number one is seen in
Figure 2.2, with a nitrogen backpressure
fill of 8.6 bar (125 psia) and a propellant
volume flow rate of 10 mL/min. Each
atomized fluid particle was subpixel size where one pixel is approximately 200 micrometers in
length.
Maximum atomizing flow rate was determined from visual inspection of the plume. Acceptable
atomization was characterized as having a uniform flow pattern with no discernable difference in
the size of the atomized droplets. Atomization was deemed to be unacceptable when droplets were
seen in the plume caused by injector
spitting, or when atomization stopped
completely and droplets fell from the
injector. Figure 2.3 shows a representative
still of an atomization test where spitting of
the HAN-simulant was seen and a
combination of atomized fluid particles
and droplets were formed from the injector.
Figure 2.2. Propellant simulant atomization
50 mm
Figure 2.3. Propellant simulant atomization
with large droplet spitting

5
The plot in Figure 2.4 shows the maximum flow rate at which three different injector designs
were able to atomize the HAN-simulant from ambient up to a nitrogen backfill pressure of 20.7 bar
(300 psia). Differences in the injector designs included geometry variations, material construction,
and method of mounting the injector. From tests conducted the best performing injector was found
to be injector number two. High-pressure testing with injector number two initially produced a
maximum flow rate at which atomization can be achieved and maintained to be 34 mL/min at
ambient. Between 3.5 to 5 bar (50 - 75 psia), the atomizing flow rate decreased to 28 mL/min, then
recovered and leveled off at 32 mL/min flow rate. Even with the small drop in injector
performance, the operational margin was deemed adequate for use in the workhorse thruster testing
where flow rates up to 20 mL/min and 20 bar were to be expected.
Figure 2.4. Maximum atomizing flow rate vs. backpressure
0
2
4
6
8
10
12
14
16
18
20
22
24
26
28
30
32
34
36
0 25 50 75 100 125 150 175 200 225 250 275 300
Flo
w R
ate,
mL/
min
Pressure, psia
Injector 1 Injector 2 Injector 3

6
Although injector three was not able to atomize the propellant simulant at as high of a flow rate
as injector two for the back pressures tested, injector three showed increased atomization
performance as the back pressure increased as determined by visual inspection of the test. The
injector initially started with a maximum atomizing flow rate of 18 mL/min at ambient pressure.
The injector then passed through a minimum flow rate of 10 mL/min at 10.3 bar (150 psia), the
maximum atomizing flow rate then increased to 21 mL/min at the maximum tested pressure of
20.7 bar (300 psia), beyond the maximum atomizing flow rate obtained at ambient pressure.
Injector number one initially showed promise at lower backfill pressures, being able to atomize
the HAN simulant at flow rates up to 20 mL/min at fill pressures of 6.9 bar (100 psia). Once the
nitrogen backpressure rose above 6.9 bar, injector one showed diminishing results and ceased to
atomize the propellant simulant at chamber pressures in excess of 13.8 bar (200 psia). Testing of
injector one was not conducted at pressures above 13.8 bar, as such it is unclear whether injector
one would show the same trend as injectors two and three and begin to start atomizing once again
at a higher chamber pressure. All hot-fire tests have been conducted using injector two due to its
reliability and known operational envelope.

7
Chapter 3. FLOW-THROUGH REACTOR
3.1 PURPOSE
The interaction between the atomized propellant and a heated catalyst bed was examined at
ambient pressure through use of a flow-through reactor where atomized propellant was sprayed
downward onto the face of a catalyst exposed to an open ambient atmosphere. The metal foam
monolithic catalyst used in testing was provided by Plasma Processes, Inc. The propellant ignition
characteristics were determined as a function of propellant mass flow rate, catalyst temperature,
and catalyst length. Results of these tests helped establish the minimum catalyst length (number
of catalysts) needed for microthruster operation. It was anticipated that less catalyst will be
required for propellant light-off when the combustor is operated at higher pressurized conditions.
3.2 DESIGN
The flow-through reactor was comprised of
three main pieces as seen in Figure 3.1. A two-
piece outer stainless steel shell threaded together
and housed the temperature instrumentation port
for monitoring the catalyst outer surface
temperature. The threaded shell was sized to
accommodate the dimensions of the electric band
heater used during microthruster testing. The
other component was an alumina sleeve that was
inserted into the stainless steel shell. This served the purpose of minimizing the potential of catalyst
poisoning from the back flow of metal oxides that may have formed in the stainless steel combustor
Figure 3.1. Design of stainless steel
flow-through reactor

8
during preheat and elevated temperature phases of testing. Once assembled, a clamp attached to a
ring stand held the flow-through reactor in place. The injector, which was attached to another
stand, was positioned over the flow-through reactor assembly and aligned such that the injector
face was approximately 10 millimeters from the top face of the catalyst.
3.3 TEST SERIES AND RESULTS
Tests have been performed in the
stainless steel flow-through reactor at
preheat temperatures of 350°C down to
275°C in 25°C increments at a flow rate
of 1 mL/min. Data is shown for this series
of tests in Figure 3.2.
The minimum temperature for light-off
of the HAN propellant was found to be
365°C. This was determined in both
visual and temperature examination of the flow-through test with a catalyst bed preheat of 350°C.
The time-temperature data for this test is the top most data trace in Figure 3.2. For the first 3
seconds of the test after propellant injection started, the flow-through reactor was emitting
greyish/white smoke from the propellant interactions with the heated catalyst bed, once the catalyst
bed temperature reached 365°C the atomized propellant began to combust on contact with the
catalyst bed. In the 325°C test, the second highest temperature trace shown in grey, small air
bubbles in the injector line resulted in catalyst temperature pulsations over the course of the run.
The end of the propellant injection period corresponds with the drop in catalyst temperature for
each test run.
Figure 3.2. Stainless steel flow-through
temperature
270
280
290
300
310
320
330
340
350
360
370
380
0 5 10 15 20 25 30 35 40 45 50 55 60
Tem
per
atu
re,
oC
Time, s
350 C 325 C 300 C 275 C

9
In all runs conducted, a temperature rise was observed in the thermocouple monitoring the outer
face of catalyst as the propellant was injected/sprayed onto its top face. For catalyst preheat
temperatures below that of the auto-ignition temperature of 365°C, the propellant still underwent
an exothermic reaction with the catalyst as seen by the temperature rise in each run. Once the
catalyst temperature rose above the minimum ignition temperature, flaring of the propellant
occurred as observed through visual examination.
Video recordings were taken of all experiments with a Canon EOS Rebel T4i and GoPro Hero 4
Black. The video frame in Figure 3.3 shows the HAN-based propellant flaring on top of the reactor
due to reaction of the propellant with the top surface of the catalyst when the catalyst temperature
rose above 365°C. The combustion spreading out over the top of the reactor was caused from the
lack of a containment system on the upstream side of the reactor. With ambient air pressure on the
upstream and downstream sides of the reactor, the combustion and products advanced in the
direction of least resistance which was radially outwards and not through the catalyst bed. The
video frame in Figure 3.4 shows fuming at the top surface of the catalyst when the catalyst bed
was preheated to 350°C. In this test, much like with that seem in Figure 3.3, there were no
Figure 3.3. Stainless steel reactor flow-
through test, 400°C, 1 mL/min
Figure 3.4. Stainless steel reactor
flow-through test, 350°C, 1 mL/min

10
indications of combustion products passing through the flow-through reactor and catalyst bed.
These tests showed that backflow arising from vigorous reactions on the catalyst top surface
prevented propellant from flowing through the catalyst in an unpressurized system. In order to
obtain useful data in the actual behavior and characteristics of how the monopropellant interacts
with and passes through the catalyst bed, a test apparatus that provided a flow path restriction in
the region around the upstream area of the catalyst bed was needed.

11
Chapter 4. VISIBLE FLOW-THROUGH REACTOR
4.1 PURPOSE
To better evaluate the injector performance and HAN-based monopropellant combustion over
the catalyst bed, a see-through reactor was manufactured from fused quartz. This combustor
allowed visual examination of both the injector spray as it exits the injector and comes into contact
with the top face of the catalyst and of the propagation of exothermic reactions as propellant passes
through the catalyst. A relatively tight slip-fit between the injector and upstream tube segment of
the quartz reactor prevented backflow from escaping at the top of the reactor.
4.2 DESIGN
The test setup for the quartz combustor
testing is shown in Figure 4.1. This
combustor was fabricated by joining two
tubes of fused quartz together, one with an
inside diameter of 12.7 millimeters which
housed the catalyst bed and another with
an inside diameter of 12 millimeters to
create a step on which the catalyst bed could rest. The top portion of the quartz combustor created
a slip fit seal against the mounting hardware of the injector. By restricting the upwards flow path,
combusted products were forced to flow through the catalyst bed and exit out the bottom of the
quartz combustor tube. The band heater from the stainless steel flow-through reactor experiments
was used with an internal steel sleeve to conduct heat into the catalyst region of the quartz
combustor. The quartz combustor flow-through tests were conducted in the same ambient
Figure 4.1. Quartz flow through reactor
BandHeater
Thermocouple in Contact with Downstream Face of Catalyst
Quartz Tube Containing Catalyst Bed
Catalyst (2)
Injector Face

12
atmosphere environment that the steel flow-through tests were carried out in. If successfully
implemented, the flow restriction between the outside of the quartz reactor tube and the injector
test stand will build a slight pressure rise upstream of the catalyst bed which will force the reactions
to pass through the catalyst bed and exit the quartz reactor on the downstream end.
The preheating process was done without the injector inserted as shown in Figure 4.1 - left. In
order to obtain an unobstructed view of the catalyst and the reactions taking place, the band heater
was typically removed once the cat-bed temperature had been preheated to 75 to 100°C above the
target temperature. The injector stand assembly was then positioned around the quartz combustor,
as seen in Figure 4.1 - right, and the cat-bed was allowed to cool until the desired catalyst
temperature was reached, as indicated by the Type K thermocouple in contact with the downstream
face of the catalyst. The propellant flow was then turned on and the reaction process was observed
with video and time-temperature measurements from the thermocouple that remained in contact
with the downstream face of the catalyst.
4.3 TEST RESULTS
The quartz combustor test series focused on how catalyst bed length and preheat temperature
affected the decomposition of the HAN-based monopropellant. Tests were conducted with one
catalyst of length 7.2 millimeters and two catalysts for a total cat-bed length of 14.4 millimeters at
propellant flow rates from 1 to 20 mL/min. Pre-heat temperatures ranged from 335 to 450°C.

13
4.3.1 Single Catalyst Testing
For the test shown in Figure 4.2, the
catalyst-bed temperature is shown in
blue, the start and end of propellant
injection are signified by the green and
red lines respectively. The catalyst
preheat temperature was 360°C, with a
propellant flow rate of 2 mL/min for 15 seconds. Due to the nature of the test and the configuration
of the apparatus, only the temperature of the downstream face of the catalyst was recorded. It was
estimated that due to the limit heat transfer paths, the upstream face of the catalyst was of
approximately equal temperature as the downstream face at the start of the test. Visual examination
of this test showed the monopropellant initially reacting with the top surface of the catalyst bed
and exothermic reactions propagated downward through the catalyst. Furthermore, the
representative video frame in Figure 4.2 indicates that the flame front is not uniform as it
progressed downward.
Tests were conducted up to
20 mL/min in the quartz combustor,
this flow rate was the maximum
expected flow rate used in the
workhorse microthruster. The catalyst
time-temperature results are shown in
Figure 4.3 along with a representative still taken from the video of the test. The temperature profile
of the catalyst-bed showed an immediate spike up to 750°C from a preheat temperature of 400°C.
Figure 4.2. Quartz flow-through test: 2 mL/min
Figure 4.3. Quartz flow-through test: 20 mL/min

14
After the spike, the thermocouple temperature reading dropped and contained two small prominent
temperature spikes, including one that occurred after propellant injection had stopped. The drop in
temperature and corresponding spikes were likely caused by unreacted propellant seeping between
the outside cylindrical face of the catalyst and the inside of the quartz tube. The unreacted
propellant cooled down the exposed thermocouple bead and proceeded to react downstream of the
catalyst bed.
As seen in the still frame in Figure 4.3, the flames coming out of the bottom of the quartz reactor
were caused by the propellant that was reacting inside the region of the quartz combustor
downstream of the catalyst. From video footage of the test the cause for propellant seepage around
the catalyst was pooling occurring on the upstream face of the catalyst, this is evident from the
dark region on top of the catalyst bed which was the pooled propellant. The pooling on the catalyst
was seen on tests at a flow rates of 10 mL/min and greater, it is believed the pooling was caused
by the propellant reaction rate with the catalyst not occurring fast enough for the mass flow of
incoming propellant to the catalyst activation sites at ambient pressure. Unreacted propellant may
pose a risk to the operation of the workhorse microthruster since the possibility of a large amount
of propellant reacting simultaneously existed; as a result extra design precautions were considered
for the workhorse thruster. Unclear in this test was whether pressure had an effect on the reaction
rate of the propellant. In the workhorse microthruster pressure and temperature measurements will
be able to determine if a correlation exists.

15
4.3.2 Two-Catalyst Testing
The experimental results from an
experiment using two catalysts of the
same form factor stacked on top of
each other are given in Figure 4.4. This
test was conducted at a target preheat
temperature of 445°C with a
propellant flow rate of 2 mL/min for 15 seconds. The temperature on the lower surface of the
bottom catalyst increased by 130°C in the course of this experiment. The propagation of the flame
front appeared to be inhibited by the interface between the catalysts, as evident in the video frame
shown. Visual examination revealed the upper catalyst was very bright whereas the lower one had
a dull red glow. The difference in visual temperature lead to the conclusion that very little to no
reactions were taking place in the downstream catalyst. When compared with the test in Figure
4.2, the higher and more uniform temperature observed in the upper catalyst in this test is believed
to be caused by flow impedance through the second catalyst bed. The temperature differential
between the two catalysts was also enhanced by the thermal contact resistance between the two
catalysts. This limited the downward rate of heat conduction and because the surfaces of the
catalyst are irregular, the conduction path was limited and can in part explain the large temperature
gradient between the two catalysts.
Figure 4.4. Quartz flow-through test: 2 mL/min
16
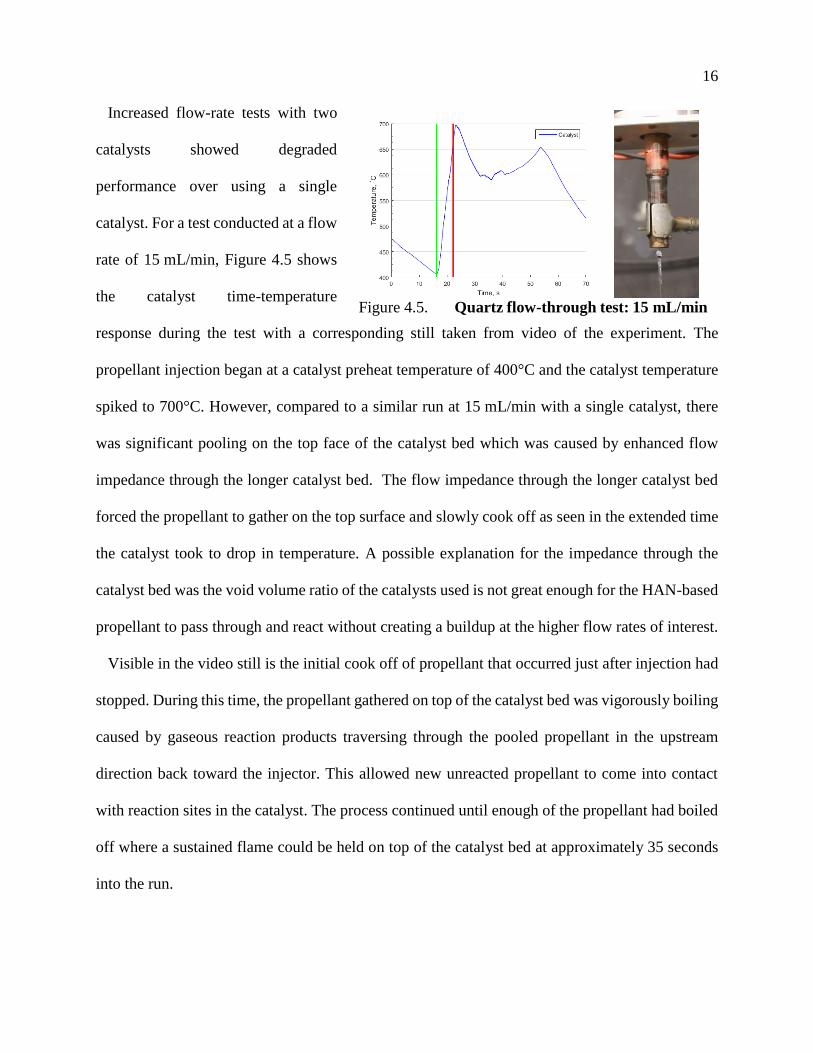
Increased flow-rate tests with two
catalysts showed degraded
performance over using a single
catalyst. For a test conducted at a flow
rate of 15 mL/min, Figure 4.5 shows
the catalyst time-temperature
response during the test with a corresponding still taken from video of the experiment. The
propellant injection began at a catalyst preheat temperature of 400°C and the catalyst temperature
spiked to 700°C. However, compared to a similar run at 15 mL/min with a single catalyst, there
was significant pooling on the top face of the catalyst bed which was caused by enhanced flow
impedance through the longer catalyst bed. The flow impedance through the longer catalyst bed
forced the propellant to gather on the top surface and slowly cook off as seen in the extended time
the catalyst took to drop in temperature. A possible explanation for the impedance through the
catalyst bed was the void volume ratio of the catalysts used is not great enough for the HAN-based
propellant to pass through and react without creating a buildup at the higher flow rates of interest.
Visible in the video still is the initial cook off of propellant that occurred just after injection had
stopped. During this time, the propellant gathered on top of the catalyst bed was vigorously boiling
caused by gaseous reaction products traversing through the pooled propellant in the upstream
direction back toward the injector. This allowed new unreacted propellant to come into contact
with reaction sites in the catalyst. The process continued until enough of the propellant had boiled
off where a sustained flame could be held on top of the catalyst bed at approximately 35 seconds
into the run.
Figure 4.5. Quartz flow-through test: 15 mL/min

17
The advantages of injecting finely
atomized HAN-based monopropellant
was demonstrated in the test shown in
Figure 4.6. In this experiment, two
catalysts were used with a target
preheat temperature of 420°C and a
propellant flow rate of 5 mL/min. During testing, the injector atomized the HAN-based propellant
for the first 3 seconds of the run and normal reactions occurred as shown in the temperature vs.
time graph in Figure 4.6. After 3 seconds, atomization stopped and propellant droplets fell on the
catalyst face which quenched the reaction and flooded the catalyst. This is seen in the sudden flat
lining in the temperature of the downstream catalyst face 15 seconds into the test as shown in the
figure. The unreacted propellant then proceeded to ignite uncontrollably as seen in the dramatic
spike in the temperature profile of the test and the corresponding frame taken from video of the
test. By finely atomizing the monopropellant, this test showed that a controlled reaction and burn
can be initiated at preheat temperatures lower than that needed if the propellant was not atomized.
Figure 4.6. Quartz flow-through test: 5 mL/min

18
Chapter 5. DEVELOPMENT OF THE WORKHORSE
MICROTHRUSTER
5.1 PURPOSE
The following describes the development of a laboratory scale 0.1 – 1 Newton HAN-based
monopropellant workhorse microthruster. Utilizing the thermochemical data provided by the
sponsors, the rocket thruster operating conditions and performance characteristics were determined
for the final design. Transit times in both the catalyst bed and rocket chamber for flow rates of
interest to microthrusters were also estimated. Factors of safety for the combustion chamber were
evaluated based on worst case scenarios which led to preliminary thruster designs that could be
readily fabricated and tested in the laboratory. Results of these theoretical considerations are
discussed, followed by the modeled thruster concept, and finite element analysis thermal modeling.
5.2 WORKHORSE MICROTHRUSTER DESIGN REQUIREMENTS
The primary design requirement of the workhorse microthruster was to operate at flow rates
between 2 and 20 ml/min with an initial target operating chamber pressure of approximately 21 bar
(305 psig). The design required the ability to utilize various nozzle throat diameters to
accommodate changes in flow rate and desired chamber pressure. The combustion chamber was
required to be sized such that it could accommodate from one to three cylindrical monolithic
foamed-metal catalysts, each of which are 12.7 millimeters in diameter and 7.2 millimeters in
height. The exact number of catalysts to be used in testing was dependent on the results from
flow-through testing. The catalyst bed required the ability to be heated in excess of 400C using
an external heat source. Provisions to minimize the potential for catalyst poisoning at the expected
operational temperatures due to leeching of the chamber walls was to be incorporated. Pressure
19
and temperature instrumentation ports was to be included to enable monitoring of the flow
upstream and downstream of the catalyst bed as well as the catalyst bed temperature.
5.3 WORKHORSE MICROTHRUSTER CONCEPT
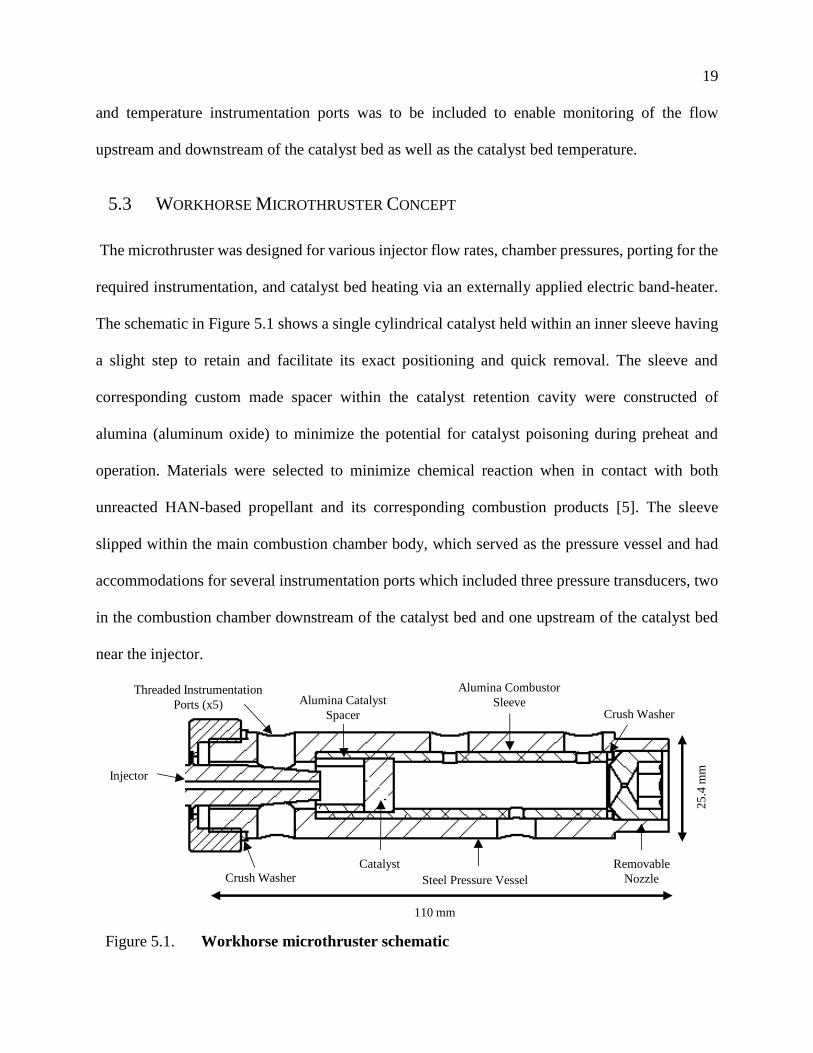
The microthruster was designed for various injector flow rates, chamber pressures, porting for the
required instrumentation, and catalyst bed heating via an externally applied electric band-heater.
The schematic in Figure 5.1 shows a single cylindrical catalyst held within an inner sleeve having
a slight step to retain and facilitate its exact positioning and quick removal. The sleeve and
corresponding custom made spacer within the catalyst retention cavity were constructed of
alumina (aluminum oxide) to minimize the potential for catalyst poisoning during preheat and
operation. Materials were selected to minimize chemical reaction when in contact with both
unreacted HAN-based propellant and its corresponding combustion products [5]. The sleeve
slipped within the main combustion chamber body, which served as the pressure vessel and had
accommodations for several instrumentation ports which included three pressure transducers, two
in the combustion chamber downstream of the catalyst bed and one upstream of the catalyst bed
near the injector.
Figure 5.1. Workhorse microthruster schematic
Crush Washer
Alumina Catalyst
Spacer
Injector
Catalyst Removable
NozzleSteel Pressure Vessel
Alumina Combustor
SleeveCrush Washer
Threaded Instrumentation
Ports (x5)
110 mm
25
.4 m
m

20
Temperature instrumentation ports included one near the injector, two at the catalyst bed, and
one in the combustor downstream of the catalyst bed. The removable nozzle was threaded into the
recess at the end of the combustion chamber to press against a crush washer to retain the alumina
sleeve and seal the combustion chamber. The threaded nozzle will prolong the operational lifetime
of the microthruster over the course of testing by providing an easy means of replacing a burned
out or otherwise damaged nozzle and allow a methodology for testing fixed flow-rate thruster
operation at various chamber pressures. The injector was held with a retaining nut on external
threads upstream of the catalyst bed and the injector face was positioned approximately
10 millimeters from the front of the catalyst. Complete drawings can be found in Appendix B.
5.4 WORKHORSE MICROTHRUSTER SIZING
5.4.1 Nozzle Throat Sizing
A combustion chamber diameter of 11 millimeters was chosen based on the catalyst bed form
factor and allow the catalyst bed to rest on a machined step in the combustor. The chemical
composition and enthalpy of formation of the propellant were used in the NASA Chemical
Equilibrium with Applications (CEA) computer program to determine combustor properties over
a range of operating pressures and flow rates. The adiabatic flame temperature was determined to
have very little variation across flow rates and chamber pressures. The value found will be used to
determine if complete decomposition and reaction of the HAN-based propellant has occurred.
Using the combusted propellant properties from CEA, the relationship between nozzle diameter
and mass flow rate was determined for the desired chamber operating pressure of the test. Using
these data provides a means to readily determine nozzle throat diameter for a wide range of
operating conditions.

21
5.4.2 Combustor Length
Combustion chamber length was determined with empirical characteristic chamber length, L*
guidelines for thrust chambers and the relation in Eq. 5.1, where Vc is combustion chamber volume
and At is the nozzle throat area.
𝐿∗ =𝑉𝑐𝐴𝑡
(5.1)
The characteristic chamber length L* can vary between 0.8 and 3.0 meters for bipropellant rocket
engines while monopropellant thrusters have characteristic lengths typically slightly higher [5].
This is because monopropellants have an extra reaction step with the catalyst bed to decompose
the molecule. Without experimental data for monopropellant microthrusters using HAN-based
monopropellant and to promote complete combustion at all flow rates and chamber pressures of
interest, an L* near the upper range was selected to be used as an initial test platform with plans to
investigate shorter characteristic chamber lengths after initial testing. Using the prescribed
chamber inner diameter of 11 millimeters and the range of nozzle throat diameters as determined
from CEA, the combustion chamber length for varying nozzle throat diameters was then
determined.
22
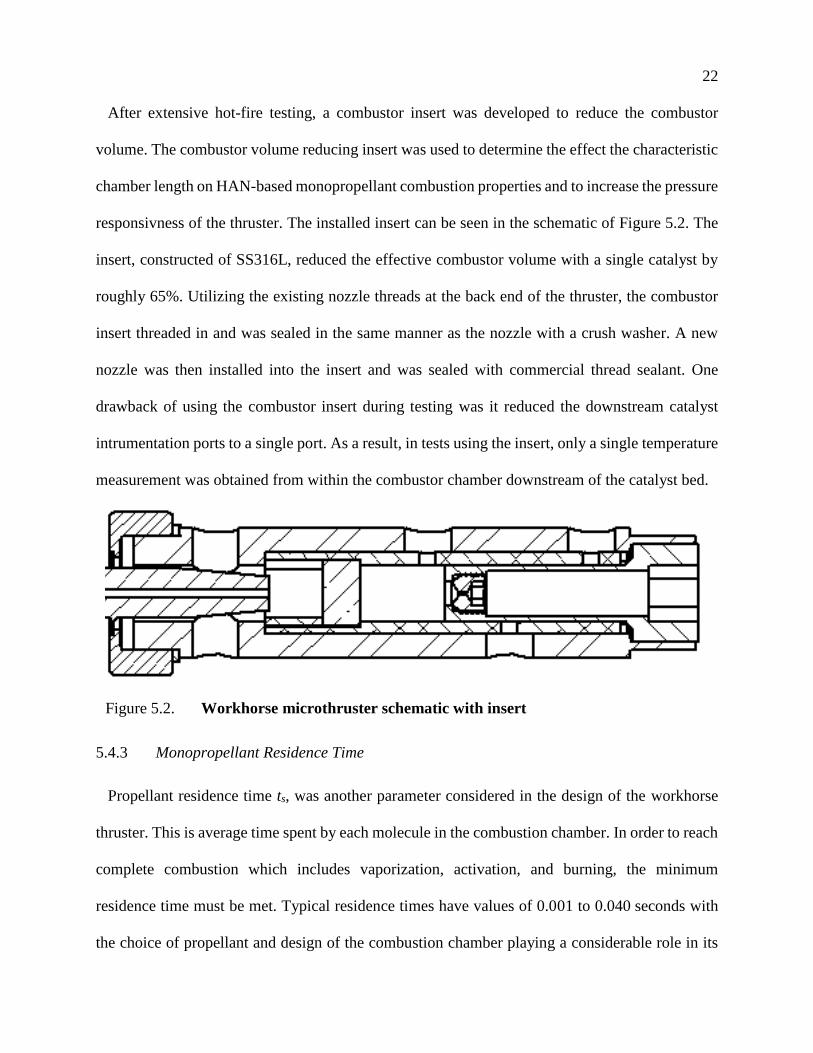
After extensive hot-fire testing, a combustor insert was developed to reduce the combustor
volume. The combustor volume reducing insert was used to determine the effect the characteristic
chamber length on HAN-based monopropellant combustion properties and to increase the pressure
responsivness of the thruster. The installed insert can be seen in the schematic of Figure 5.2. The
insert, constructed of SS316L, reduced the effective combustor volume with a single catalyst by
roughly 65%. Utilizing the existing nozzle threads at the back end of the thruster, the combustor
insert threaded in and was sealed in the same manner as the nozzle with a crush washer. A new
nozzle was then installed into the insert and was sealed with commercial thread sealant. One
drawback of using the combustor insert during testing was it reduced the downstream catalyst
intrumentation ports to a single port. As a result, in tests using the insert, only a single temperature
measurement was obtained from within the combustor chamber downstream of the catalyst bed.
5.4.3 Monopropellant Residence Time
Propellant residence time ts, was another parameter considered in the design of the workhorse
thruster. This is average time spent by each molecule in the combustion chamber. In order to reach
complete combustion which includes vaporization, activation, and burning, the minimum
residence time must be met. Typical residence times have values of 0.001 to 0.040 seconds with
the choice of propellant and design of the combustion chamber playing a considerable role in its
Figure 5.2. Workhorse microthruster schematic with insert

23
determination [5]. The residence time is given by Eq. 5.2 where ts is the average propellant
residence time, m is the mass flow rate, and υ is the specific density of the products from
combustion.
𝑡𝑠 =𝑉𝑐𝑚.𝜈
(5.2)
The values calculated for the initial combustor length tend on the higher side of the typical
values. Having a higher propellant residence time may lead to increased opportunity for the
combustion products to react with the chamber walls; however, without previous experimental
data to determine the minimum residence time of HAN-based monopropellant, the workhorse
microthruster was designed to provide a higher residence time than likely needed to promote
complete propellant combustion at all flow rates.
5.4.4 Pressure Vessel Sizing
The wall thickness of the combustion chamber was sized such that it can be capable of
withstanding the maximum pressure rise expected during a constant volume combustion process
within a closed combustion chamber with a margin of safety. This condition arises when the
propellant does not ignite immediately upon injection and proceeds to react in a single event. A
CEA constant volume combustion analysis with expected propellant injection volumes was
conducted to determine a maximum combustion chamber pressure of 970 bar (14,100 psig) is
produced in such an event. To determine the burst pressure of the thruster design, the stress was
determined using closed end thick walled cylinder equations given by Eqs. 5.3 - 5.5 where σa is

24
the axial stress, σh is the hoop stress, σr is the radial stress, Pi is the internal pressure, Po the external
pressure, ri the internal radius and ro is the external radius.
𝜎𝑎 =𝑃𝑖𝑟𝑖
2 − 𝑃𝑜𝑟𝑜2
𝑟𝑜2 − 𝑟𝑖2
(5.3)
𝜎ℎ =𝑃𝑖𝑟𝑖
2 − 𝑃𝑜𝑟𝑜2
𝑟𝑜2 − 𝑟𝑖2 −
𝑟𝑖2𝑟𝑜
2(𝑃𝑜 − 𝑃𝑖)
𝑟2(𝑟𝑜2 − 𝑟𝑖2)
(5.4)
𝜎𝑟 =𝑃𝑖𝑟𝑖
2 − 𝑃𝑜𝑟𝑜2
𝑟𝑜2 − 𝑟𝑖2 −
𝑟𝑖2𝑟𝑜
2(𝑃𝑖 − 𝑃𝑜)
𝑟2(𝑟𝑜2 − 𝑟𝑖2)
(5.5)
Stresses were calculated at the internal radius and using an external pressure of zero. Due to
additional design considerations that will be discussed in the next section, a value of
15.9 millimeters was used for the inside diameter of the thrust chamber. Including a temperature
correction factor of 0.8 and using properties of SS316L, it was determined an outside diameter of
25.4 millimeters would give a factor of safety of 1.6 for the case of a constant volume combustion
within a closed combustion chamber. During normal operating pressure of up to 21 bar (305 psig),
the workhorse microthruster pressure vessel had a factor of safety of 70.
5.5 THERMAL MODELING
5.5.1 Setup
The thermal analysis of the microthruster design was conducted using ANSYS Mechanical
V16.2. Material properties were selected to match those used in the design of the workhorse
microthruster thruster; this included SS316 for the microthruster body and electric band heater,
6Al-4V-Ti for the injector and injector nut, and rhenium with a density of 50% to simulate the
porosity characteristics of the foamed metal catalyst. The thermal characteristics of the

25
microthruster design were investigated under two different thermal conditions; the first was a
steady state operation condition where the catalyst was held at a temperature of 400°C to determine
the temperature gradient and field of the workhorse thruster when preheated; the second was a
transient preheat to a catalyst preheat temperature of 400°C starting from an ambient temperature
of 22°C.
The steady state and transient thermal analysis were carried out using a quarter symmetry model
with an element size of 1 millimeter. In order to reduce computation time, the thermal model design
as seen in Figure 5.3 was simplified by incorporating the combustor sleeve and nozzle into the
main body, removing the instrumentation ports, and modeling the electric band-heater as a cylinder
with an outer diameter of 34 millimeters.
The initial thermal conditions for the microthruster were set to standard temperature and pressure
conditions of 22°C and 1 atmosphere. Constant convection coefficients of 10 W/m2-K were used
on exposed surfaces and a radiation emissivity value of 0.19 was used for the stainless steel and
titanium surfaces. Internally, surface to surface radiation conditions were defined for the pre-
catalyst chamber and combustion chamber, with an emissivity of 0.5 for the catalyst faces. Bench
tests with the band-heater found that it had a power draw of 151 watts, with a volume of
approximately 10.2 centimeters3, resulting in a power density of 1.49 x 10⁷ W/m3, thus this value
was used in the thermal model as internal heat generation provided by the band heater.
Figure 5.3. FEA microthruster model
26
5.5.2 Transient Preheat Thermal Analysis
The results of the transient thermal analysis can be seen in Figure 5.4 showing the thermal profile
of the FEA workhorse microthruster when the catalyst bed has reached 400°C. The thermal
analysis shows the band heater has the ability to preheat the catalyst to 400°C while retaining a
reasonable temperature at critical locations in the injector. Nonetheless, the presence of a large
thermal gradient along the length of the injector may impact the performance of the injector; the
effects of which are to be determined during hot-fire testing of the workhorse system.
Figure 5.4. Transient thermal profile of the workhorse microthruster

27
Shown in Figure 5.5 is the time-temperature data for the transient preheat analysis for four
locations on the FEA model of the workhorse system. The locations selected were the catalyst-bed
temperature, and three locations spaced across the length of the injector to capture the temperature
profile of the injector. The time the system took to preheat the catalyst bed to a temperature of
400°C was 630 seconds (10.5 minutes). The time-temperature response of the points along the
length of the injector showed there is considerable thermal impedance in the injector system and
that there is an approximate 4 minute delay between when the heater is given power and a
temperature response is seen in the rear part of the injector.
Figure 5.5. Temperature during preheat for locations along the injector
0
50
100
150
200
250
300
350
400
450
0 50 100 150 200 250 300 350 400 450 500 550 600 650
Tem
per
atu
re,
oC
Time, s
Catalyst Rear Injector Injector Filet Injector Flange

28
5.5.3 Steady State Thermal Analysis
Under steady-state conditions the predicted temperature field of the workhorse microthruster is
shown in Figure 5.6. The required band heater power to maintain a catalyst temperature of 400°C
was 9.0 x 10⁶ W/m3. By using the volume of the CAD created band heater, this determined the
power input to be 91.7 Watts. This was 60% the maximum available power of the band heater. As
in the transient thermal analysis, minimal thermal soak back into the injector was observed.
However, comparing the temperature at the flange where the injector attaches to the thruster which
shows an approximate value of 250°C and that of the rear of the injector, a large temperature
gradient of approximately 150°C is apparent.
Figure 5.6. Steady state thermal profile of the workhorse microthruster

29
5.5.4 Heat Flux into Injector Assembly
The power dissipated through the injector was determined by monitoring the heat flux through a
cross-sectional area of 71.3 millimeters2 in close proximity to the flange of the injector. The heat
flux passing through the injector to the upstream flow control components during the preheat stage
is seen in Figure 5.7. Under the steady-state operating condition where the catalyst was maintained
at a temperature of 400°C, the heat flux through the injector was found to be 140 kW/m2. This
determines that 9.98 Watts must be dissipated through the injector body in the form of radiative
and convective heat transfer. While the system may never reach this condition, it was a useful
quantity to know to be able to determine the cooling power needed to dissipate the thermal soak
into critical injector components in a steady state operational condition. During the preheat stage,
the maximum heat flux passing through the injector was found to be greater than that found in the
steady state analysis due to the heater supplying 100 percent of its available power.
Figure 5.7. Power dissipated through the injector system during preheat
0
2
4
6
8
10
12
14
0 50 100 150 200 250 300 350 400 450 500 550 600 650
PO
WE
R , W
TIME, S

30
5.5.5 Comparison with Testing
Preheat and steady state temperature profiles of the actual workhorse microthruster system are
seen in Figure 5.8. Comparing to the ANSYS FEA transient thermal results in Figure 5.5, the time
required to preheat was approximately 60% greater taking the actual system close to 1000 seconds
(16.7 minutes) for the catalyst bed to reach 400°C. This preheat test was conducted with the PID
controller turned off so that the heater was supplied with its maximum amount of available power.
The experimental test temperatures were also higher than that predicted in the FEA model. At the
flange on the injector, where the injector is attached to the workhorse thruster, the recorded
temperature was 80°C higher than expected. The rear of the injector was also approximately a
factor of two greater in temperature than that obtained through the analysis.
Although the transient thermal predictions are off, the steady state temperatures shown in the
table in Figure 5.8 show a good correlation at the injector flange and rear injector when compared
Time Catalyst Injector Flange Rear Injector Thruster Bottom
Steady State 400°C 293°C 108°C 174°C
Figure 5.8. Temperature of microthruster during preheat and steady state

31
with the thermal image profile in Figure 5.6. However, the downstream side of the workhorse
thruster shows approximately 100°C less than what was expected from the FEA thermal analysis.
The discrepancies between the predicted temperatures and the actual test temperatures may have
arisen from a number of causes. The leading belief was thermal contact resistance barriers between
parts in the workhorse system was not modeled in the FEA analysis. This would have the effect of
increasing the time required to preheat the catalyst and produce lower predicted temperatures in
the transient analysis. Another parameter that may have added error to the analysis was the use of
constant nominal emissivity and convection coefficients used in the analysis. This would play a
role in the magnitude of the thermal gradient seen in the system which would show up when
comparing the results at the extreme ends of the model, such as at the downstream end of the
workhorse microthruster.

32
Chapter 6. WORKHORSE MICROTHRUSTER TESTING
6.1 PURPOSE
Initial tests examined the required input power for catalytic ignition at a specified catalyst bed
temperature as a function of propellant flow rate. Temperature and pressure measurements will
indicate the degree of combustion completion within the chamber length provided.
6.2 TESTING HARDWARE AND SOFTWARE
6.2.1 Hardware
An aluminum test stand was constructed to be used
as a test platform in all atmospheric tests with the
workhorse thruster. Seen in Figure 6.1, the stand was
constructed with two rings, one of which acted as a
base and allowed the three threaded vertical rods to
be installed. The workhorse microthruster was then
installed with a thin circular plate in-between the
injector mounting nut and the upstream
instrumentation ports onto the vertical rods. This
plate added additional securement of the thruster during instrumentation and assembly of the
combustor/nozzle prior to a test. A second ring was then placed on the vertical rods, this ring had
three thumb screws which clamped down onto the injector nut which provided a secure hold onto
the workhorse microthruster. Tests were conducted in a downward firing orientation with the test
stand placed on top of a steel topped table.
Figure 6.1. Workhorse
microthruster test stand

33
For hot-fire testing of HAN-based monopropellant at the University of Washington, tests were
conducted within a secure lab environment under a fume hood. Even though HAN-based
propellant are “green” propellants, partial decomposition of the propellant could result in
hazardous gases generated. The fume hood was blocked off with plastic sheeting on three of the
four sides to enhance containment of the exhaust gases.
The preheat operation for all hot-fire tests was performed using a commercial off the shelf band
heater from Tempco. The heater utilized was a Mi-Plus® band heater which provided the high
watt density needed for the form factor of the workhorse system. The particular heater purchased
had a 1 inch inside diameter and was 1 inch in length; this heater provided a power of 150 Watts
with a maximum temperature rating of 760°C. The heater operation was controlled through a
proportional-integral-derivative (PID) controller, the catalyst temperature thermocouple was
utilized for both data recording and had a y-split to be used as the temperature input source for the
PID controller. This allowed preheat set point temperatures to be programmed in to create a steady
state temperature of the workhorse thruster prior to testing.
The propellant feed system utilized a positive
displacement syringe pump and stainless steel
syringe obtained from New Era Pump Systems
as shown in Figure 6.2. The pump was capable
of a maximum flow rate of 38 mL/min and
200 lbf at low rates and 100 lbf at high rates.
Coupled with a 5 milliliter syringe with an inside diameter of 12.7 millimeters, the maximum feed
pressure capacity was between 35 to 70 bar (510 - 1020 psi) depending on the flow rate of interest.
Figure 6.2. Propellant feed pump

34
1/8 inch Peek tubing was used to connect the propellant feed syringe to the injector mounted on
the workhorse microthruster.
A series of electromagnetic valves was
constructed in order to aid in filling, bleeding,
and purging the feed system. Pressure and
temperature data were also incorporated into
the feed system in order to record pre-injector
propellant flow properties.
Figure 6.3 shows a diagram of the setup
which included two three-way electromagnetic
valves. The valve nearest to the syringe was
used for filling and bleeding of the syringe
while the valve nearest to the injector was used
for bleeding of the feed line. Two
electromagnetic isolation valves are also
depicted in the schematic, the first is in line with the three-way valves and was used to isolate the
injector side of the feed system from the propellant in the syringe. The second isolation valve is
located at a tee just downstream of the first isolation valve, this valve controled the nitrogen purge
line.
During hot-fire microthruster testing, it was found the feed valve system could not be fully bled
with residual air pockets residing within the temperature and pressure ports, purge line, and valve
mechanisms. Uniform feed and bleed was accomplished by simplifying the feed system down to
its core components of a syringe that is directly attached to the injector by a length of Peek tubing.
Figure 6.3. Workhorse PID Diagram
35
During testing, this configuration proved to be the most effective at obtaining a fully bled system,
an additional benefit of proceeding with this solution was the propellant dead volume in the feed
system dramatically reduced from the reduction in fluid flow paths.
Data acquisition was carried out through a National Instruments CompactDAQ® system. The
DAQ made use of separate modules capable of performing various tasks. Modules used for this
experiment were two voltage measurement modules, one for the 0 to 5 volt pressure transducers
and the other for Type-C thermocouple data which was preconditioned using an in-house built
instrumentation amplifier; both modules were able to sample up to a nominal 10,000 samples/s. A
standard thermocouple module was used for reading the Type-K thermocouples with a maximum
sample rate of 95 samples/s. A relay module was also used for controlling the electromagnetic
valves while they were in use.
6.2.2 Software
A LabVIEW® script and control interface were developed to read in the temperature and pressure
data as well as controlling the feed system. The control panel allowed real time viewing of the
pressure and temperature during a test via three different scrolling graphs: one for pressure and
separate graphs for Type-C and Type-K thermocouple data. Raw and filtered data were available
from the pressure and Type-C sensors. Feed pump parameters built into the control panel included
flow rate and volume to be injected as well as more advanced options for use in pulsed mode
testing and flow rate ramping. These options included pulse width and pause time, number of
pulses, specific injector parameters to be run between and after injection, propellant flow rate ramp
start and end rates, and the volume and total time of ramping. A full overview of the control panel
can be seen in Appendix A with operating instructions and procedures. To process the data,

36
Matlab® was implemented to read in the temperature and pressure output files from LabVIEW®,
the data extraction script can be seen in Appendix C.
6.3 CONFIGURATION
Preliminary tests were configured with two pressure transducers (0 - 34.5 bar range) installed in
the combustor section downstream of the catalyst bed. After these tests, it was deemed that one
transducer was sufficient to characterize the combustor pressure and two thermocouples could then
be installed in the combustor section, one just after the cat-bed and another just before the throat.
Other instrumentation that remained the same for this test series was a Type-K thermocouple in
contact with the outside cylindrical edge of the upstream catalyst to monitor its temperature during
preheat and testing. Two more Type-K thermocouples were placed upstream of the catalyst, one
in contact with the outside face of the alumina catalyst spacer and the other exposed to the upstream
volume on the side of the injector head. The pressure upstream of the catalyst was monitored to
determine the magnitude of the pressure differential across the catalyst. Throughout a wide range
of operating parameters, it was determined that there was no significant pressure drop across the
catalyst bed, as such pressure data are presented from only the combustor transducer downstream
of the catalyst bed in tests that incorporated multiple pressure transducers.
6.4 OPEN NOZZLE HOT-FIRE TESTS
The first propellant tests conducted in the workhorse thruster were an extension of the flow-
through testing. The male threaded piece from the stainless steel flow-through holder was inserted
into the rear of the thruster in place of a nozzle. This series of tests had several different purposes;
one of which was to run a shakedown test of the control panel for the data acquisition system and
feed system to ensure reliable operation and workability, the other was to examine the

37
monopropellant reaction with the catalyst at various preheat temperatures to draw insight on what
the initial operating envelope may be for the system.
Figure 6.4 presents the temperature data from a test conducted at a catalyst bed preheat
temperature of 415°C with a propellant flow rate of 1 mL/min, a representative frame from the
video taken of the test is shown. During this test, the exhausted products were not visually
discernible. Shown in red in the plot, the catalyst temperature experienced a slow but steady
temperature rise from its preheated temperature of 415°C up to its maximum temperature of 530°C.
The large difference in catalyst temperature history between these tests and those conducted in the
quartz flow-through combustor may be due to the effects of a large amount of heat being
transferred to the inside walls of the workhorse thruster; this could also be compounded by the low
flow rate used during this test sequence.
Figure 6.4. Open combustor testing, preheat 415°C
0
50
100
150
200
250
300
350
400
450
500
550
0 10 20 30 40 50 60 70 80 90 100 110 120 130 140
Ter
mp
era
ture
, oC
Time, s
Feed Catalyst Pre-Catalyst Chamber Pre-Catalyst Spacer Combustor End

38
A test performed at catalyst preheat temperature of 325°C with a propellant flow rate of
1 mL/min is shown in Figure 6.5. This test showed a steady catalyst temperature rise up to 390°C.
During this time the thruster exhausted grayish smoke from the nozzle-less combustor exit; this is
seen in the representative still taken from the test as shown in the picture on the right in Figure 6.5.
Once the catalyst bed thermocouple reached 390°C, the grayish plume became clear and was
similar to that seen in the test at a catalyst bed preheat temperature of 415°C. This indicated a
change in the decomposition and reaction of the HAN-based propellant occurred. Upon the catalyst
reaching 390°C, the temperature then abruptly increased to 510°C and after approximately
20 seconds the catalyst bed temperature reached thermal equilibrium and leveled off for the
remainder of the test.
The dramatic change in the temperature profile of the catalyst temperature during this test
signifies that initially the monopropellant was only partially decomposing and reacting when the
atomized spray from the injector came into contact with the catalyst bed. Once the catalyst bed
reached a critical temperature for the propellant, a higher degree of reactions started to take place
resulting in the increase in temperature. In neither of these tests did the combustor temperature or
Figure 6.5. Open combustor testing, preheat 325°C
0
50
100
150
200
250
300
350
400
450
500
550
0 10 20 30 40 50 60 70 80 90 100 110 120 130 140 150 160
Tem
per
atu
re,
oC
Time, s
Feed Catalyst Pre-Catalyst Chamber Pre-Catalyst Spacer Combustor End

39
catalyst temperature approach the calculated adiabatic flame temperature. Discussed previously,
this could be caused by a combination of low propellant flow rate and the thermal mass of the
workhorse microthruster system. Pressure effects may also play a role in the decomposition of the
HAN-based monopropellant used and is investigated further in the pressurized hot-fire testing in
the workhorse microthruster.
6.5 PRESSURIZED HOT-FIRE TEST RESULTS
Testing has been conducted with the workhorse microthruster system as detailed in the following
sections. This experimental series mainly focused on determining the temperature and pressure
characteristics of steady state operation. The results from preliminary pulsed operation testing are
presented here as well.
6.5.1 Single Catalyst Test without Volume Reducing Insert
Data from a run conducted in the standard configuration without the combustor volume reducing
insert are presented in Figure 6.6. For this test, the cat-bed preheat was 400°C and propellant flow
rate was 20 mL/min. The pressure data shown in black indicate the workhorse thruster had an
initial pressure rise rate of approximately 180 psi/s. After the initial large increase in chamber
pressure a slow steady rise at 5 psi/s is seen which increases up to a maximum pressure of
approximately 340 psig. The slow rise in the pressure data is believed to be caused by thermal heat
transfer effects with the combustor chamber walls of the workhorse thruster.

40
The maximum catalyst temperature during the 10 seconds of injection for the run was
approximately 1300°C, and is one of the highest recorded temperatures seen during testing. The
instrumentation in the downstream chamber consisted of one Type-K thermocouple in the
instrumentation port just downstream of the catalyst bed, labeled Combustor 1; and a Type-C
thermocouple installed in the instrumentation ports just upstream of the removable nozzle labeled
Combustor 2. The difference in recorded temperature between Combustor 1 and 2 without the
insert installed shows there is a thermal gradient inside the combustor volume downstream of the
catalyst bed. The thermal gradient was most likely caused by thermal interactions with the chamber
walls which transferred heat from the combustion products. This was also seen by the temperature
increase throughout the test, which indicated that heat transfer to the walls may be a factor. The
temperatures in the catalyst and post-catalyst regions were less than that predicted for the adiabatic
flame temperature of the HAN-based monopropellant expected from the test. Whether this was
due to heat transfer losses or incomplete combustion remains to be determined.
Figure 6.6. Microthruster test: 20 mL/min flow rate without chamber insert

41
6.5.2 Single Catalyst Test with Volume Reducing Insert
Data from a typical run with a single catalyst with the volume reducing insert are shown in Figure
6.7. For this test, the catalyst bed preheat temperature was 400°C and propellant flow rate was
20 mL/min. The pressure data indicated an initial rise rate of 400 psi/s which more than doubled
that found in tests without the chamber insert installed. The pressure data also had a smaller
pressure drift during the steady state period of the run at approximately 3 psi/s, just under half that
seen without the insert installed. At the conclusion of the run a pressure spike is seen in the data
after the pressure in the combustor has dropped to 20 psig. This spike was caused by the propellant
feed system relaxing after the syringe pump was shut off and a droplet fell from the injector face
onto the catalyst bed. This has been mitigated by running a different injector profile at the end of
the run such that a droplet does not form.
The catalyst temperature shown in blue and downstream chamber temperature in red
reached approximately 1200°C and 1150°C, respectively, with the catalyst reaching steady state
after 2 seconds of propellant injection. Comparing the catalyst temperature data to the previous
test show the catalyst temperature was lower in the test with the insert installed by approximately
100°C. The Combustor 1 data also showed a drop by approximately 50°C with the volume
Figure 6.7. Microthruster test: 20 mL/min flow rate with chamber insert

42
reducing insert installed. A possible explanation for the lower catalyst and combustor temperature
with the volume reducing insert is the residence time of the propellant is less in this configuration
than without the insert installed. Given the overall lower temperatures than the calculated adiabatic
flame temperature, incomplete combustion is believed to exist. With the insert installed, there was
an approximate 65% reduction of the internal volume in region downstream of the catalyst bed. A
smaller combustor volume would give the propellant less time to react after initial decomposition,
thus providing a possible explanation for the lower temperatures seen from the reaction products.
The upstream pre-catalyst chamber temperature taken around the side of the injector presented
in green shows some temperature instability within that region. However, comparing the
temperature recorded there and that at the catalyst and in the combustion chamber, the measured
temperature is much less in this region. This leads to the conclusion that the monopropellant was
reacting within the catalyst bed with very little to no reactions occurring downstream of the catalyst
or around the side of the injector head. There was also no evidence of pooling occurring on the
catalyst as was seen in the see-through quartz reactor testing at these flow rates with or without
the volume reducing insert installed. Evidence of this would have been elevated pressure and
temperatures continuing after injection had stopped, as well as greater fluctuation in pressure and
temperature data caused by irregular reactions.
6.5.3 Frequency Analysis of Pressure Data
In the pressure trace of Figure 6.7 an oscillatory signal was seen during the course of the run
when the test had reached steady state operation. Using the Matlab® script found in Appendix D,
the underlying frequency can be found in the pressure data and plotted as a time-frequency
response as seen in Figure 6.8. The top plot shows a mean subtracted and normalized 5 second
sample of the pressure signal from the run. The second plot depicts the component frequencies

43
found in the pressure trace; visible is a peak at approximately 0.5 Hertz which corresponds to the
large slow oscillation seen in the pressure data. There is also a prominent rise in the 21 - 25 Hertz
frequency range which links to the higher frequency wave pattern visible in the 5 second sample
of data selected. The third graph displays the frequency spectrum of the signal over the time of the
sample data and shows the time evolution of the frequency. At the start of the sample, the higher
frequency was approximately at 25 Hertz; as time went on the frequency decreased to just over 20
Hertz. This phenomena is the reason why the second plot in Figure 6.8 has a sweep of frequencies
between 21 and 25 Hertz. The slow drop in frequency can be explained by the heating of the gases
inside of the thruster causing a change in sound speed.
Figure 6.8. Time-frequency response of workhorse pressure data

44
6.5.4 Single Catalyst Test Outlier
Figure 6.9 represents a workhorse microthruster test that was an outlier in terms of the general
trends that had been observed in the workhorse system. A single catalyst was installed and
preheated to 400°C, the propellant flow rate was 2.5 mL/min with a target combustion chamber
pressure of 3.8 bar (40 psig) using an appropriately sized nozzle throat diameter, the volume
reducing insert was not installed.
The temperature and pressure time profiles are shown for the test. This test was conducted near
the beginning of the workhorse microthruster test series and as such the instrumentation in the
combustor section of the thruster consisted of one Type-K thermocouple and two pressure
transducers, of which data from only one is shown. The combustor temperature profile had an
immediate rise 22 seconds into the experiment. Subsequently the combustor temperature increased
to beyond 1400°C and melted the exposed bead of the Type-K thermocouple. Comparing the
temperature data elsewhere in the workhorse microthruster, it was apparent this combustion event
only took place in the downstream portion of the catalyst combustor section, otherwise there would
Figure 6.9. Microthruster test: 2.5 mL/min flow rate

45
have been evidence of a large temperature increase in the catalyst bed and upstream of the catalyst
as well. Another aspect to note about the test depicted in Figure 6.9 is that the nozzle throat became
partially blocked from products of combustion which resulted in the increase of the chamber
pressure well above the expected 3.8 bar. This pressure increase coincided with the temperature
spike in the combustor section.
6.5.5 Single Catalyst Pulsed Testing
Tests were also performed under pulsed operation with data from a representative pulsing test
plotted in Figure 6.10. This test used the same configuration and flow parameters as presented in
Figure 6.7 except in pulsed mode operation to examine the transients of the workhorse
microthruster. The pulses were configured to have 1.5 seconds of injection followed by a
1.5 second pause. The chamber pressure rapidly rose in every pulse except for the first pulse. The
weak and irregular first pulse was caused by the feed system bleeding out approximately
0.3 milliliters of air from the injector assembly.
Figure 6.10. Pulse test: 20 mL/min flow rate, 1.5 s pulse cycle

46
Repeatable operation was seen to occur after three injection pulses where the chamber pressure
and catalyst temperature became consistent from pulse to pulse. However, the combustor
temperature continued to rise upon each consecutive pulse. This signaled all of the monopropellant
was reacting within the catalyst bed and only products of reaction were continuing through the
catalyst bed and into the chamber downstream of the catalyst. The combustor temperature was
well below the theoretical combustion temperature and experimental temperatures seen during
steady flow rate testing. During the pulsed operation, the catalyst reached a maximum temperature
of approximately 1150°C, slightly lower than that found in steady state operation. Upon the last
injection pulse, the chamber pressure rose to approximately 350 psig, slightly below that of the
corresponding steady state operating pressure. Given a longer injection pulse, the trend in the
pressure rise for the pulse test shows comparable pressures to those found in steady-state testing
would have been obtained.
6.5.6 Workhorse Thruster Combustion Efficiency
A figure of merit for comparing the performance of the workhorse microthruster from test to test
and to theory is by determining the experimental characteristic velocity, c*. The experimental
characteristic velocity can be calculated two ways; one of which is pressure based and is given by
Eq. 6.1 where 𝑃1 is the chamber pressure, 𝐴𝑡 is the area of the nozzle throat, and 𝑚. is the propellant
mass flow rate. The other method is temperature based and is given by Eq. 6.2 where 𝑘 is the ratio
of specific heat, 𝑅 is the individual gas constant, and 𝑇1 is the temperature inside the combustion
chamber of the thruster. The ratio of specific heat and individual gas constant were both determined
theoretically through CEA. The experimental characteristic velocity can then be compared to the
theoretical characteristic velocity as given in Eq. 6.3 where η is the combustion efficiency.

47
𝑐𝑒𝑥𝑝∗ =
𝑃1𝐴𝑡𝑚.
(6.1)
𝑐𝑒𝑥𝑝∗ =
√𝑘𝑅𝑇1
𝑘√[2/(𝑘 + 1)](𝑘+1)/(𝑘−1)
(6.2)
𝜂 =𝑐𝑒𝑥𝑝∗
𝑐𝑡ℎ𝑒𝑜𝑟𝑦∗
(6.3)
The combustion efficiency allows the direct comparison of the performance of the workhorse
thruster across all of the tests conducted where a steady state temperature and pressure was
reached. Figure 6.11 presents the combustion efficiency when compared to the operating chamber
pressure during each respective test. The pressure based efficiencies are shown with blue diamonds
Figure 6.11. Combustion efficiency vs chamber pressure
0.50
0.55
0.60
0.65
0.70
0.75
0.80
0.85
0 100 200 300 400 500 600 700
Co
mb
ust
ion
Eff
icie
ncy
Chamber Pressure, psig
Pressure-Based Temp-Based

48
while the temperature based calculated efficiencies are orange squares. Both the temperature based
and pressure based efficiencies reside between 70 to 80 percent combustor efficiency with some
outliers.
At pressures where the majority of testing took place, the pressure calculated efficiency and the
temperature calculated efficiency are on average 3 percent of each other with some test pairs
overlapping each other. As a general trend, the pressure based efficiencies show a slightly higher
combustion efficiency within this range. At higher pressures, the trend appears to drop in the
pressure calculated efficiency. This could be caused by small leaks in the instrumentation port
fittings or in the nozzle assembly for tests with the volume reducing insert installed. This would
have the effect of reducing the given chamber pressure of the test and thus reducing the calculated
experimental characteristic velocity.

49
The same data are shown in Figure 6.12 but as a function of flow rate in mL/min. The pressure
calculated and temperature calculated efficiencies show the trend of increasing efficiency at as
flow rate increased. Once again there are a few outliers in the higher flow rate efficiencies showing
three tests that only had 61 to 64 percent combustor efficiency. As stated previously, this could
have been caused by improperly sealed instrumentation ports or nozzle piece which would have
reduced the steady state chamber pressure obtained.
For low propellant flow rate tests of under 10 mL/min, the results obtained have shown
underperformance of the workhorse system when compared to theory. One possible explanation
for the cause of the lower chamber efficiency at the low flow rates could be due to the original
design considerations of the workhorse thruster. Since the thruster was designed with a nominal
Figure 6.12. Combustion efficiency vs propellant flow rate
0.50
0.55
0.60
0.65
0.70
0.75
0.80
0.85
0 5 10 15 20 25
Co
mb
ust
ion
Eff
icie
ncy
Flow Rate, mL/min
Pressure-Based Temp-Based

50
propellant flow rate of 20 mL/min in mind, when the flow rate is reduced the nozzle throat diameter
must be smaller to maintain the same operating chamber pressure which causes the characteristic
chamber length to become larger. The result is is the thermal mass and internal surface area per
unit flow rate is increased to the point where heat transfer effects could play a considerable role at
these lower flow rates.

51
Chapter 7. CONCLUSIONS
By utilizing a pressurized test cell, atomization characteristics and performance have been
investigated for the injector technology used in a microthruster system using HAN-based
monopropellant. In these tests, favorable results have been produced showing the capability of
finely atomizing HAN-based monopropellant simulant.
In the flow-through reactor and open nozzle microthruster tests, the light off temperature of
HAN-based monopropellant through a restricted environment has been established. By utilizing a
see-through combustor design, the interaction between the atomized propellant and heated catalyst
was observed and indicated a shorter length catalyst bed can be used for flow rates of interest.
Tests with the see-through quartz combustor clearly showed that by finely atomizing the HAN-
based monopropellant, a controlled reaction and burn can be initiated at preheat temperatures
lower than that needed if the propellant was not fully atomized.
In workhorse microthruster hot fire tests conducted, the temperatures expected for complete
combustion of HAN-based have not been definitively reached in the combustor. The combustion
efficiency of the workhorse thruster was determined to be nominally 75 percent. Tests conducted
with a volume reducing insert installed showed greater thruster responsiveness although at the cost
of lower recorded temperatures in the catalyst bed and combustor region downstream of the
catalyst. Pulsed operation testing showed that the monopropellant was reacting solely inside the
catalyst bed with no post catalyst burning occurring. It was also found decomposition of HAN-
based monopropellant may have a dependence on chamber pressure since there were no indications
of propellant pooling on the catalyst in the workhorse thruster tests at flow rates where pooling
was evident in the see-through quartz reactor tests.

52
REFERENCES
[1] Hawkins, T.W., Brand, A.J., McKay, M.B., Tinnirello, M., “Reduced Toxicity, High
Performance Monopropellant at the U.S. Air Force Research Laboratory”, 4th International
Association for the Advancement of Space Safety Conference, Huntsville, AL, 19-21 April
2010.
[2] Jankovsky, R.S., and Oleson, S.R., “HAN-Based Monopropellant Propulsion System with
Applications”, NASA TM-107407, January 1997.
[3] Masse, R.K., Overly, J.A., Allen, M.Y., Spores, R.A., “A New State-of-the-Art in AF-
M315E Thruster Technologies”, 48th AIAA/ASME/SAE/ASEE Joint Propulsion
Conference & Exhibition, AIAA 2012-4335, Atlanta, GA, 30 July – 1 August 2012.
[4] Persson, M., Anflo, K., Dinardi, A., Bahu, J., "A Family of Thrusters for ADN-Based
Monopropellant LMP-103S", 48th AIAA/ASME/SAE/ASEE Joint Propulsion Conference
& Exhibit, AIAA 2012-3815, Atlanta, GA, 30 July – 1 August 2012.
[5] Sutton, G., and Biblarz, O., Rocket Propulsion Elements, 8th ed., John Wiley & Sons, Inc.,
New Jersey, 2010.
[6] Schmidt, E.W., “Hydroxylammonium nitrate compatibility tests with various materials – A
Liquid Propellant Study”, Ft. Belvoir: Defense Technical Information Center, 1990. Print.

53
APPENDIX A: PROCEDURES
Hardware Setup
1. Obtain Propellant from locked cabinet on first floor.
2. Obtain Catalyst (locked cabinet) and HAN water bucket (fire cabinet) from Shockwave
lab.
3. Decide if the chamber insert is to be used.
4. Decide on throat diameter for nozzle. If using the insert, put the nozzle in the insert using
the thread sealant.
5. Decide which catalyst and which face is to be used.
6. Insert catalyst into bored-out end of the alumina sleeve. Use gloves to touch the catalyst
and ensure nothing else touches it (grease, thread sealant, etc). This keeps the catalyst
from becoming contaminated.
7. Put alumina spacer on top of catalyst.
8. Put wave washer on top of spacer.
*Note, steps 6-8 are dependent on which alumina sleeve needed. If sleeves are changed,
the order may change, and the wave washer may not be needed at all. The goal is to have
alumina spacer or washer to be flush with the top of the sleeve.
9. Insert sleeve assembly into thruster body from the bottom, ensuring that the
instrumentation holes in the sleeve align with those in the body.
10. Insert the upper temperature probes or put an allen wrench in the open instrumentation
port to hold the sleeve in place for now.
11. Add a copper crush washer to the insert and add thread sealant to the threads. (Sealant
not needed if the insert in step 13 is replaced)
12. Screw the insert in until it is tight. Ensure the instrumentation holes still line up. Note, if
an allen wrench is used in step 10 to hold the sleeve in place, remove it before putting the
insert in.
13. If the full combustor length is used and the insert is not wanted, remove the insert and
screw in the threaded black nozzle. Put thread sealant on the threads before assembly.
(The insert was used to make sure the crush washer was aligned properly.
14. Add thread sealant to the instrumentation plug’s threads and assemble.
15. Insert remaining temperature probes and tighten down to appropriate level for Swagelok
fittings. The proper placement is shown below.

54
NOTE: If unclear which temperature sensor is which, load up the HAN_Control_Panel.vi, and
start the data. Touch each thermocouple to see which one moves on the chart.
16. Connect Injector to the generator. Red to red… black to black.
17. Turn on the band heater.
18. Once the band heater has reached approximately 350° C, re-tighten either the insert or the
black nozzle. These become loose as the thruster body heats up.
Software setup
1. Turn on Pump
2. Turn on power supply and verify it is set to 16V and 0.2A
3. Turn on Generator
4. Open HAN_Control_Panel_Vx.x.vi and run it. Probably will get the Power Interrupted
message and need to restart the VI to get the pump connected
5. Configure generator software for current injector.
6. Create a new folder to house logs for the day’s tests. Name it with the current date.
Current location is under:
C:\Users\microthruster\OneDrive\Documents\HAN\Testing\Microthruster\logs\Workhors
e Thruster\Tests
7. Create an instrumentation file for the current test run and place it in the root of the test
folder. Use the format of previous instrumentation files since data automation relies on
that exact format.

55
Filling Procedures
NOTE: Use gloves when handling HAN. It’s not as toxic as hydrazine, but it is an irritant.
NOTE: Always fill from clean propellant and push into used propellant. This prevents the clean
propellant from being contaminated. (the exception is if you are intending to burn the used
propellant.
1. Remove fill line from injector. The syringe can remain in the upright pump.
2. Withdraw 5ml from clean propellant bottle.
3. Push that 5ml into the used propellant bottle. This bleads the line to remove air.
4. If the propellant came out a little pink, repeat step 2-3.
5. Finally, withdraw 5ml, from the clean propellant bottle for testing.
6. Wipe off excess propellant from the tip of the line and attach the line to the injector.
Re- Filling Procedures
1. Use pump to withdraw 500 μL to prevent propellant from spilling out when
disconnecting the line.
2. Disconnect line and inset into clean propellant.
3. Withdraw 5ml, from the clean propellant bottle for testing.
4. Wipe off excess propellant from the tip of the line and attach the line to the injector.
NOTE, there is now approx. 500 μL of dead volume in the injector. The next test should
account for this dead volume.
DAQ Overview
This document describes the features of the Lab View program used to run HAN testing.
Material here refers to version 2.1 of the program.
To launch the program, Open the Microthruster folder on the desktop
(C:\Users\microthruster\Desktop\Microthruster) and click on the “DAQ” folder. Open the file
named: “HAN_Control Panel v2.1.vi”.
Click the White arrow in the upper left of the screen to run the program.
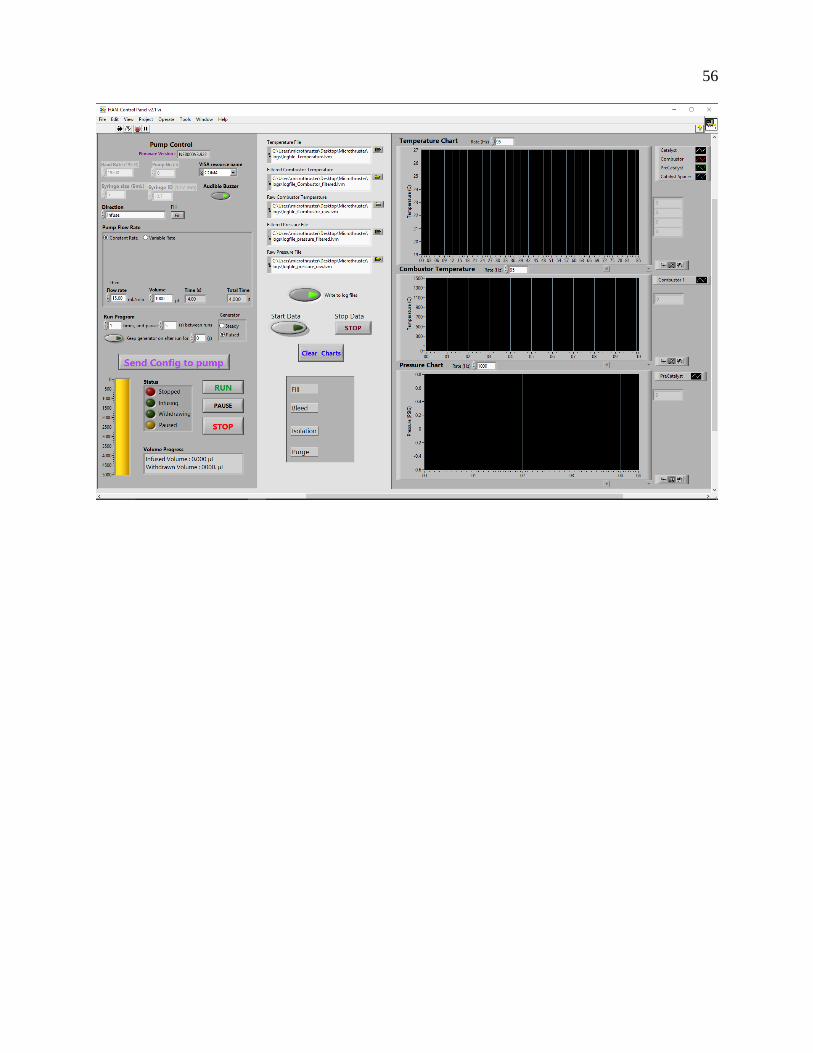
56

57
Pump Connection Section:
This section controls the connection to the syringe pump.
Most of the features here are read-only and don’t need to be changed. Of note in this section are:
1. If this number is blank, the program is not connected to the pump. Make sure the pump
is turned on. NOTE: The first time the program is run after the pump has been turned on,
this number will be blank, and a popup saying “The power was interrupted” will display.
If this happens, close the popup and restart the VI.
2. This is the COM port the pump is connected to on the local computer. If the pump is
running and it can’t connect, try changing this number
3. When this is lit, the pump will give audible beeps as feedback. One beep when
commands are sent to the pump, and two beeps when the test completes.
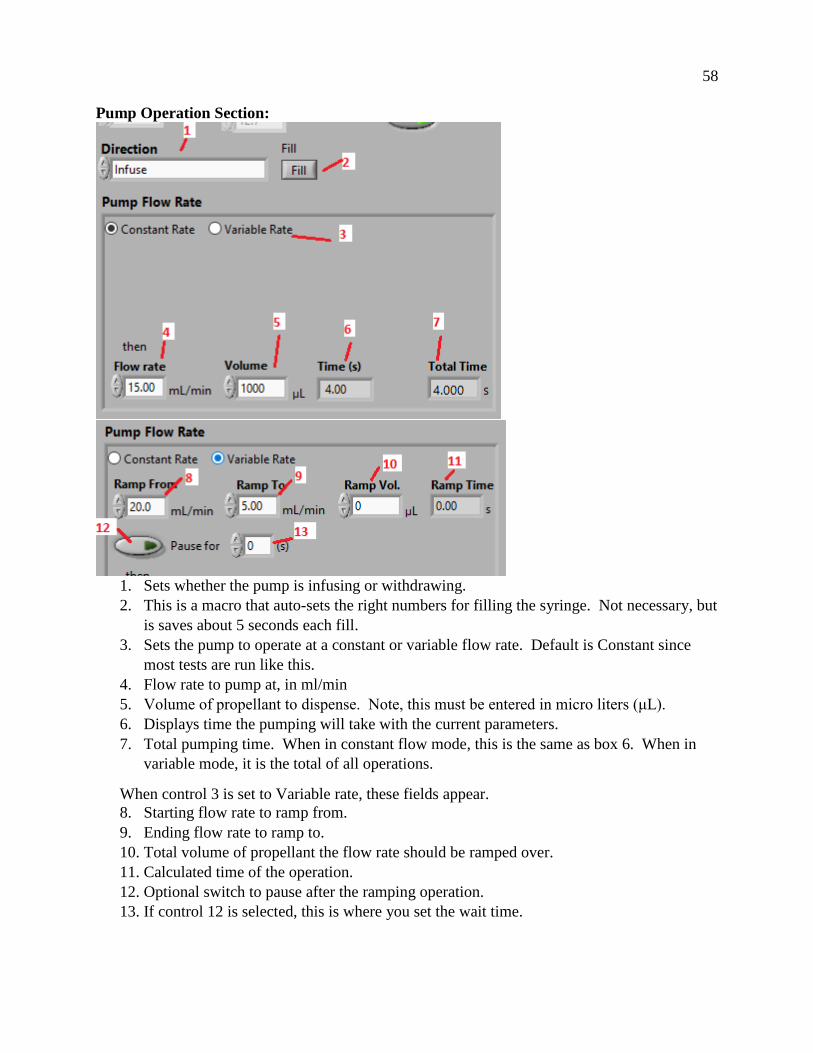
58
Pump Operation Section:
1. Sets whether the pump is infusing or withdrawing.
2. This is a macro that auto-sets the right numbers for filling the syringe. Not necessary, but
is saves about 5 seconds each fill.
3. Sets the pump to operate at a constant or variable flow rate. Default is Constant since
most tests are run like this.
4. Flow rate to pump at, in ml/min
5. Volume of propellant to dispense. Note, this must be entered in micro liters (μL).
6. Displays time the pumping will take with the current parameters.
7. Total pumping time. When in constant flow mode, this is the same as box 6. When in
variable mode, it is the total of all operations.
When control 3 is set to Variable rate, these fields appear.
8. Starting flow rate to ramp from.
9. Ending flow rate to ramp to.
10. Total volume of propellant the flow rate should be ramped over.
11. Calculated time of the operation.
12. Optional switch to pause after the ramping operation.
13. If control 12 is selected, this is where you set the wait time.

59
Optional Pump Commands:
This section can be left as default if there is nothing fancy with your run.
1. If the pumping program is wanted to be run more than once, i.e. for a pulsed test, change
this number.
2. Pause time between runs.
3. If doing more than 1 pulse (control 1 is > 1), this tells the generator whether to stay on
constantly (“Steady”), or to turn off between pulses (“Pulsed).
4. Option to keep the generator on for a fixed time after the pumping has ended. The
default is to stay on for 3 seconds to clear any remaining propellant from the injector
face.
5. Number of seconds to keep generator on.

60
Run Program Section
1. When all pump commands are set for the run, click this button to lock them in. This
button must be clicked before the Run button will become operational. If a command
needs to be changed after clicking this button, the VI will need to be stopped and
restarted. Once the pump has completed its run. The pump commands can be edited
again.
2. Indicator for amount of fluid remaining in the syringe. This resets every time the
program starts and stops, so only useful if doing multiple runs on a single syringe.
3. Current pump status.
4. Run – This button executes the pumping /generator program. If the run has completed,
but this button is still showing depressed, it is because the stops on the pump were hit
before the total volume could be pumped. Click the stop button if this happens.
5. Pauses the run. Once paused, click the Run button (Control 4) to resume execution.
6. Stops the run at any point.
7. Displays the amount of fluid the pump infused or withdrew.

61
Data Control Section:
1. Optional section to change the
path and/or filename of the log
files. Can be left as default.
2. Turn off to disable writing to the
log file. Useful when wanting to
watch temperatures or pressures
but don’t care about saving the
data.
3. Start data collection
4. Stop data collection
5. Clear the charts.
IMPORTANT: If the log files have
been moved or deleted, the program
needs to be restarted before attempting
to write to log files again.

62
Data Chart Section:
These three options are the only things configurable for the charts. Max Temperature rate for the
type K chart (top one) is 95 Hz. If changing one of these numbers, VI needs to be restarted.
Hot-fire Checklist:
Before Test Run:
1. Verify Blast shield is in place and locked down with clamp.
2. Ensure syringe has enough propellant for test
3. Ensure all personnel have safety glasses on
4. Verify test parameters for the pump in the VI.
5. Ensure Generator software is set to correct numbers for test.
6. Ensure Write to Log Files button is selected.
7. Ensure Generator software has the start button highlighted.
8. Turn on Fume hood
9. Wait for catalyst to reach 400° C.
10. Click Send Command To Pump Button
11. Start Data
12. Click Run
After Test Run has Completed:
1. Stop Data
2. Move log files to archive location. Currently
(C:\Users\microthruster\OneDrive\Documents\HAN\Testing\Microthruster\logs\Workhor
se Thruster\Tests)
3. Restart VI since the logs were moved.
4. Turn off the Fume hood.
Hot-fire Cleanup:
IMPORTANT: Pretty much everything you do here is dealing with hot metal and ceramic.
Pay attention at all times to what is being touched. Trust me.
1. Turn off band heater.
2. Turn off pump, generator, and power supply.
3. Remove the insert/black nozzle from the bottom of the thruster body. The best method to
do this without touching the hot metal is to unscrew using the long end of the allen
wrench and balance it on the end of the wrench to lay it down. Lay it down on the metal
table to cool.

63
4. Remove the plug that is approx. 1.5” up from the bottom, on the left side of the thruster
body.
This guy:
5. Insert a small allen wrench in the instrumentation hole that is uncovered. This will keep
the sleeve from falling down prematurely.
6. Loosen and remove the Catalyst Spacer, Catalyst, and Combustor thermocouples.
7. Use the inserted allen wrench to gently push down on the alumina sleeve. This will pop
out the copper crush washer. IMPORTANT: Don’t remove the allen wrench yet or the
sleeve with fall down, shatter, and you are going to have a very bad day.
8. Find another allen wrench and stick the short end in the end of the sleeve. This wrench
will support the sleeve.
9. Remove the upper allen wrench and let the bottom allen wrench support the sleeve.
Work the sleeve down until you can fit the upper allen wrench back into the hole.
10. Use the two allen wrenches to maneuver the sleeve down to the table without touching it.
(Again, it’s HOT). Always set the sleeve sideways to prevent it from falling over and
breaking.
11. Once the sleeve is set down, use the wrenches to tip it up and slide the spacer and catalyst
out.
12. Discard the used wave washer and copper crush washer.
13. Disconnect the syringe from the pump and flush the syringe and line with D.I. water.
a. Insert line into di water and fill syringe.
b. Move syringe around to ensure all sides get covered.
c. Push water into HAN water bucket.
d. Repeat a-c until the water comes out clear (approx. 3-4 times)
14. Flush the injector.
a. Wait for the injector and thruster to fall below 100° C. Catalyst thermocouple
may have to be pushed back in the body to get an accurate reading.
b. Fill the syringe with D.I. water and push into injector. Catch the water with a
beaker to be dumped into the HAN water bucket.
c. Repeat step b until the water comes out clear. (approx. 2-3 times)

64
15. Fill syringe with air and push air out to get extra water out of line. Do this 4-5 times until
water spray stops coming out.
16. Connect N2 line to injector and blow 20-40 psi of N2 into injector for 10 or so seconds to
get rid of remaining water.
17. Clean out any container that held HAN water and dump into HAN water bucket.
18. Return Catalyst to its bag (again without touching the catalyst directly with your hands.)
19. Return Catalyst bag, propellant, and HAN water bucket to their respective storage places.

65
APPENDIX B: DRAWINGS

66

67

68

69

70
APPENDIX C: MATLAB DATA EXTRACT CODE
clear all; close all; clc; %%%%%%%%%%%%%%%%%%%%%%%%%%%%%%%%%%%%%%%%%%%%%%%%%%%%%%%%%%%%%%%%%%%%%%%%%%%%%
%%%%%%%%% %% User Inputs %%%%%%%%%%%%%%%%%%%%%%%%%%%%%%%%%%%%%%%%%%%%%%%%%%%%%%%%%%%%%%%%%%%%%%%%%%%%%
%%%%%%%%% instFileDir = '\'; %Directory of Instrumentation file location, including
trailing '\' ex: 'd:\logs\' instFile = 'Instrumentation.xlsx';
logFileDir = '\'; %Directory of Log File location, including trailing '\' %If no typeC thermocouple, you can ignore the filename1, ch1, and plot1
inputs.
filename1 = 'logfile_Combustor_filtered.lvm'; %type c ch1=2; %number of channels + time plot1=2; %number of channels to plot + time filename2 = 'logfile_pressure_filtered.lvm'; %pressure ch2=2; %number of channels + time plot2=2; %number of channels to plot + time filename3 = 'logfile_Temperature.lvm'; %type k ch3=5; %number of channels + time plot3=3; %number of channels to plot + time
%timestamp to start and end graph. Both values must be a number timeStart = 0; timeEnd = 80; %Pressure levels to start and end graph. Defaults are 0 to inf pressureStart = 0; pressureEnd = inf; %Temperature levels to start and end graph. Defaults are 300 to inf temperatureStart = 300; temperatureEnd = inf; %%%%%%%%%%%%%%%%%%%%%%%%%%%%%%%%%%%%%%%%%%%%%%%%%%%%%%%%%%%%%%%%%%%%%%%%%%%%%
%%%%%%%%% %% NO NEED TO CHANGE ANYTHING BELOW HERE :)
%read in the instrumentation file to get names of channels [channelNums,channelTxt] = xlsread([instFileDir,instFile],'Sheet1','A6:D13'
);
%only run typeC code if the channel is defined typeC = ~strcmp(channelTxt(1,2),''); if typeC==0 %clear out bogus input data filename1=''; ch1=0; plot1=0; end
%pull legend titles from instrumentation file legTitles = [channelTxt(:,1);channelTxt(:,2);channelTxt(:,3)]; legTitles(strcmp(legTitles,'')) = [];

71
%% Data procurement from LABview output file and Instrumentation Log %creates color scheme of most diverse colors %count=ch1+ch2+ch3; colors=distinguishable_colors(7); %hardcode numbers so they are always the
same colors(4,:)=[]; colors(6,:)=[];
if typeC == 1 fid = fopen([logFileDir,filename1]); %A = textscan(fid,'%f','headerlines',22,'delimiter',','); A = textscan(fid,'%f','delimiter',','); check=length(A{1})/ch1; big_data1=reshape(A{1},ch1,check)'; fclose(fid); end
%Pressure fid = fopen([logFileDir,filename2]); %A = textscan(fid,'%f','headerlines',23,'delimiter',','); A = textscan(fid,'%f','delimiter',','); check=length(A{1})/ch2; big_data2=reshape(A{1},ch2,check)'; fclose(fid);
%Type-K Temperature fid = fopen([logFileDir,filename3]); %A = textscan(fid,'%f','headerlines',25,'delimiter',','); A = textscan(fid,'%f','delimiter',','); check=length(A{1})/ch3; big_data3=reshape(A{1},ch3,check)'; fclose(fid);
if typeC == 1; time1=big_data1(:,1); end time2=big_data2(:,1); time3=big_data3(:,1);
f=figure();
hold on count = 1; cc = 1; %colorcount for jj=2:plot3 leg(count)=plot(time3,big_data3(:,jj),'Color',colors(cc,:),'LineWidth',
2); count=count+1; cc = cc+1; end if typeC == 1 for j=2:plot1 leg(count)=plot(time1,big_data1(:,j),'Color',colors(end,:)); count=count+1; end

72
end hold off; xlabel('Time, s') ylabel('Temperature, ^{\circ}C')
ax1=gca; ax1.XAxis.Visible = 'off';
ax2= axes('Position',get(ax1,'Position'),... 'XAxisLocation','bottom',... 'YAxisLocation','right',... 'Color','none',... 'XColor','k','YColor','k'); linkaxes([ax1 ax2],'x');
hold on; %'leg' var keeps track of inidvidual line handles for the combined legend
call for jjj=2:plot2
leg(count)=plot(time2,big_data2(:,jjj),'Color','k','Parent',ax2);%,'LineWidth
',2); count=count+1; end hold off;
%set the post-plot graph limits ax1.YGrid = 'on'; ax1.YMinorTick = 'on'; ylim(ax1,[temperatureStart,temperatureEnd]); ax2.XMinorTick = 'on'; ax2.YMinorTick = 'on'; xlim(ax2,[timeStart,timeEnd]); ylim(ax2,[pressureStart,pressureEnd]); set(ax2,'Xtick',timeStart:5:timeEnd);
%Define the legend values if typeC == 1 % legend([leg],{'Combustor','Catalyst','Pre-Catalyst Chamber','Catalyst
Spacer','Chamber Pressure'},'Location','NorthEast'); legend([leg],legTitles,'Location','NorthEast'); else legend([leg],{'Catalyst','Combustor','Chamber
Pressure'},'Location','NorthEast');%'Pre-Catalyst Chamber','Catalyst
Spacer','Chamber Pressure'},'Location','NorthEast'); % legend([leg],legTitles,'Location','NorthEast'); end %title(figureTitle); ylabel('Pressure, PSIG') xlabel('Time, s')

73
APPENDIX D: MATLAB FFT CODE
clear all; close all; clc;
logFileDir = '\'; %Directory of Log File location, including trailing '\' filename2 = 'logfile_pressure_raw.lvm'; %pressure ch2=2; %number of channels + time
%Read in Pressure File fid = fopen([logFileDir,filename2]); %A = textscan(fid,'%f','headerlines',23,'delimiter',','); A = textscan(fid,'%f','delimiter',','); check=length(A{1})/ch2; big_data2=reshape(A{1},ch2,check)'; fclose(fid);
%Truncate Pressure Data...Useful with pressure gradient d=big_data2(13000:18000,:); % plot(v(:,2)) % xlabel('Time [sec]'); % ylabel('Amplitude'); % title('Signal of Interest, v(n)');
tf=d(:,1); t=tf(:)-tf(1); L=tf(end)-d(1,1); d=d(1:end-1,2); t=t(1:end-1); t=reshape(t,1,length(t));
%subtracts mean value of number of sections, depends on pressure gradient nsect=5; lsect=length(d)/nsect; vn=[]; for jj=0:nsect-1 startsect=jj*lsect+1; endsect=startsect+lsect-1; vsect=d(startsect:endsect); vsects=vsect-mean(vsect); vn=[vn; vsects]; end
v=vn/max(abs(vn)); n=length(v); %same number of points as in data
v=reshape(v,1,n); t=reshape(t,1,n); k=(1/(2*L))*[0:n/2-1 -n/2:-1];
ks=fftshift(k); vt=fft(v);
%% Preview of Size of Wavelet % width=25;

74
% g=exp(-width*(t-2).^2); % gm=2/((3*width).^(1/2).*pi.^(1/4))*(1-(t-2).^2/width.^2).*exp(-(t-
2).^2/(2*width.^2)); % plot(t,v,'b',t,g,'g') % title('Wavelet')
%% Gaussian Wavelet
n=0; %used for counter for the subplot dt=[.05]; %time step width=[50]; %gaussian width, larger number is smaller width spec=[]; for jjj=1:length(width); for tt=1:length(dt) tslide=0:dt(tt):9; for jj=1:length(tslide)
g=exp(-width(jjj)*(t-tslide(jj)).^2); vg=g.*v; vgt=fft(vg);
spec=[spec; abs(fftshift(vgt))/max(abs(vgt))]; end
n=n+1; % figure subplot(length(width),length(dt),n), pcolor(tslide,ks,spec.'),shading interp axis([0 5 0 50]) xlabel('Time (S)'); ylabel('Frequency (Hz)'); title(['Dt=' num2str(dt(tt)) ', Width=' num2str(width(jjj))]); %saveas(gcf,['dt=' num2str(dt(tt)) ' Filter Width='
num2str(width(jjj))],'png');
subplot(3,1,1), plot(t,v) xlabel('Time, s') ylabel('Amplitude') subplot(3,1,2), plot(ks,abs(fftshift(vt))/max(abs(vt))) axis([0 100 0 1]) xlabel('Frequency, Hz') ylabel('Amplitude') subplot(3,1,3), pcolor(tslide,ks,spec.'),shading interp axis([0 t(end)+.001 0 50]) xlabel('Time, s'); ylabel('Frequency, Hz');
spec=[]; end end