Embed Size (px)
Citation preview

Derived Backscatter Values from JERS-1 Digital Number Distributions Over Ross Island, Antarctica
(McMurdo Station)
(j'o (j'o
0
(j' (j' 0 (j' 0
McMurdo Station - 0 (j'
T W f Ott!O ST .-. TE UNIII'E R S !l V
· ...

Compiled in 1996 by the
BYRD POLAR RESEARCH CENTER
This report may be cited as:
Noltimier, Katy F. , Hong-Gyoo Sohn, and Kenneth C. Jezek. 1996. DerivedBackscaner Values From JERS-1 Digital Number Distributions Over Ross Island, Antarctica (McMurdo Station). BPRC Technical Note No. 96-01 , Byrd Polar Research Center, The Ohio State University, Columbus, Ohio, 12 pages.
The Byrd Polar Research Center Report Series is edited by Lynn Tipton-Everett.
Copies of tills and other publications of the Byrd Polar Research Center are avai lable from:
Publication Distribution Program Byrd Polar Research Center The Ohio State University
1090 Carmack Road Columbus, Ohio 43210-1002
Telephone: 614-292-6715

DERIVED BACKSCA TIER VALUES FROM JERS-1 DIGITAL NUMBER DISTRIBUTIONS OVER ROSS ISLAND,
ANTARCTICA (MCMURDO STATION)
Katy F. Noltimier, Hong-Gyoo Sohn, and Kenneth C. Jezek
Byrd Polar Research Center The Ohio State University
Columbus, Ohio
Byrd Polar Research Center, The Ohio State University Columbus, Ohio 43210
BPRC Technical Note 96-01

TABLE OF CONTENTS
Table of Contents ............. .... ............. ....... ... ................ .................... .... ....... iii
Abstract. ........................ ........................... .................. ................................ v
1.0 Introduction........................................ .............................................. .... 1
2.0 Derived Backscatter Values from JERS-1 Digital Number Distributions................. ........ ........ .. .. ..... ... .. ....... ................. .... ..... .... ...... . 1
2.1 Procedure.. .... ..................................................... .. .......................... ...... 1
2.2 Discussion.. ......................... ............ ........ ......... .. ... .............. ................. 2
References ... .......... ....... .... ..... ... ........................ ..... ....... .. ......... ................. .. 3
Apendix ................ .... .... ... ... ........ ......................... ....................... .... ...... ...... 4
iii

ABS1RACT
This report examines the derived backscatter values for different physical
properties from one JERS-1 image over Hut Point Peninsula on Ross Island in the
McMurdo Station area. The results discussed in this report will be used to determine a
suitable location for transponder testing for the Radarsat Antarctic Mapping Project.
Histograms of digital number (DN) values (0-255) were created to determine the
DN distribution and approximate backscatter value for five locations on a single JERS-1
image. Two locations were chosen over first year sea ice, and one location each over
glacial ice, exposed rock, and the McMurdo Station. From published backscatter values
for first year ice of -15dB and a DN of 40, estimated from histograms, an approximation
of the calibration constant K was calculated and subsequent backscatter coefficients were
computed for the remaining locations. Digital numbers peaked at 255 for both glacial ice
and McMurdo Station indicating that an area outside of McMurdo Station would be
preferable for transponder testing.
v

DERIVED BACKSCA TIER VALUES FROM JERS-1 DIGITAL NUMBER DISTRIBUTIONS OVER ROSS ISLAND,
ANTARCTICA (MCMURDO STATION)
1.0 IN1RODUCTION:
This report examines the derived backscatter values for different physical
properties from one JERS-1 image over Hut Point Peninsula on Ross Island in the
McMurdo Station area. The JERS-1 SAR operates at L-band, HH polarization, and with
a viewing geometry (incidence angle) of 40°. The results discussed in this report will be
used to determine a suitable location for transponder testing for the Radarsat Antarctic
Mapping Project.
2.0 DERNED BACKSCA TIER VALVES FROM JERS-1 DIGITAL NUMBER DISTRIBUTIONS:
Histograms of digital number (0-255) values (figures 1-5) were created to
determine the digital number distribution and subsequent backscatter value for five
locations on a single JERS-1 image over Hut Point Peninsula, Antarctica (figures 6 and 7).
Two locations were chosen over first year sea ice (figures 1 and 2), and one location each
over glacial ice, bare rock, and the McMurdo Station (figures 3-5).
2.1 Procedure:
The JERS-1 image (figure 6) is a AprilS, 1995, 8-bit, 1-byte uncompressed image
obtained from ASF processed 8 m.m tape. A section of the image (figure 7) indicates
where the locations of each of the histograms (figures 1-5) were sampled from.
A backscatter value (a j for first year sea ice of -15dB (figure 8) (\)nstott, 1992)
and a digital number, DN, of 40 estimated from patch! and patch2 (figures 3 and 4) were
used to estimate the calibration constant K value as follows:
1

where,
<l >ds = 10 log (DN1). where I is the pixel illlensity and DN is the digital number
of a given pLre/ (0 -255).
Kds= 47 ± 2 .
Figure 8 shows the resulting cr 0 approximations versus digital number disoiburion for
K IID = 47 ± 2.
2.2 Discussion:
Histograms of digital number (0-255) values were created to determine the digital
number distribution and subsequent backscatter value for five locations on a single JERS-1
image over Hut Point Peninsula, Antarctica. The average digital number for first year ice
ranged from 35 to 40. The corresponding estimated cr o for first year sea ice ranged from
-15dB to -16d.B. The average digital number for bare rock was 90 with a corresponding
estimated cr o of -8dB. The digital number for both McMurdo Station and glacial ice
peaked at 255 giving an estimated cr 0 of +ldB.
The results discussed above are summarized in the following table:
Tabl~ 1
Site Average DN A v~rage cr 0 d.D_
Figure 1 (First year sea ice) 40 -15
Figure 2 (First year sea ice) 35 -16
Figure 3 (McMurdo Station) 255 + 1
Figure 4 (Glacial Ice) 255 +1
Figyre: 5 (Bar~ Rock) 9Q - 8
ForK=47
According to these results an area outside of McMurdo Station would be preferable for transponder testing.
2

REFERENCE:
Onstott, R. G., 1992. SAR and Scatterometer Signatures of Sea Ice. In F. D. Carsey (ed.). Microwave Remote Sensing of Sea Ice. A.G.U. Geophysical Monograph Series 68. 73-104.
3

APPENDIX
4 . r

patch 1-seo_ice ( -15 dB) 150 I I I I I
100 ~ -
-
0 ~=~~~~~~~~-=~~~~~~~~~~L-~~~~~~~~~~~~~~~~~ 0 50 100 150 200 250 300
Digital Number
Figure 1. Digital number (0-255) distribution of first year sea ice.
5
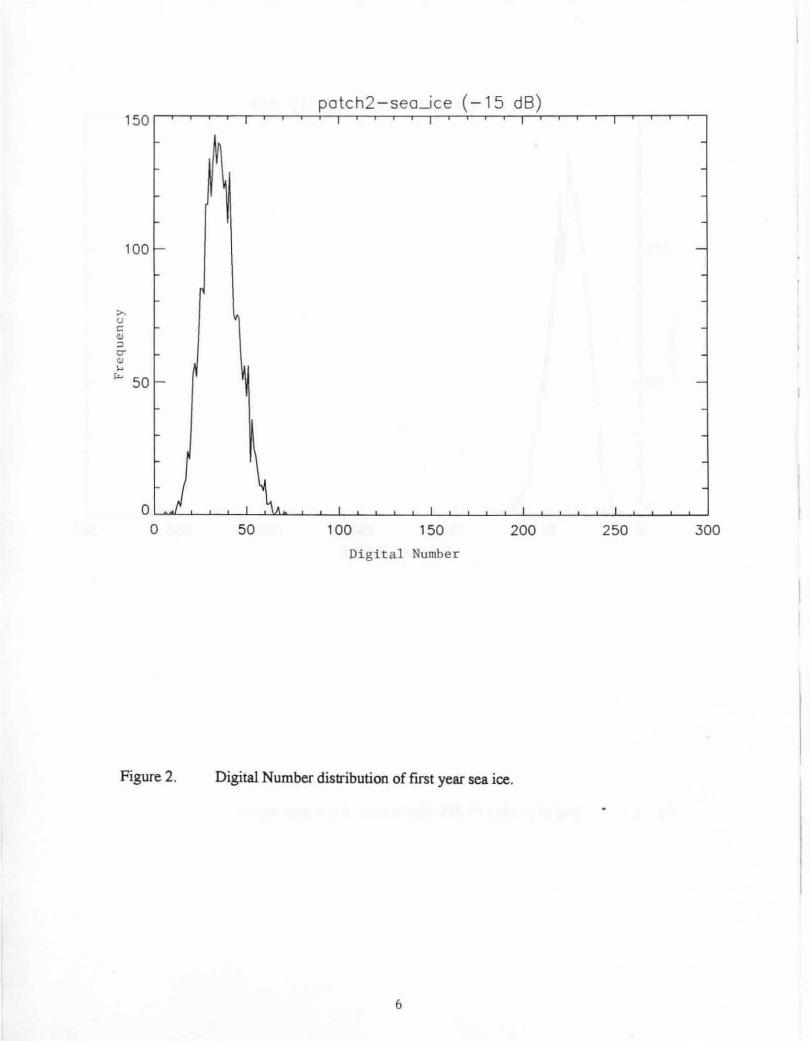
potch2-seo_ice ( - 15 dB) 150
100
0 50 100 150 200 250 300
Digital Number
Figure 2. Digital Number distribution of first year sea ice.
6
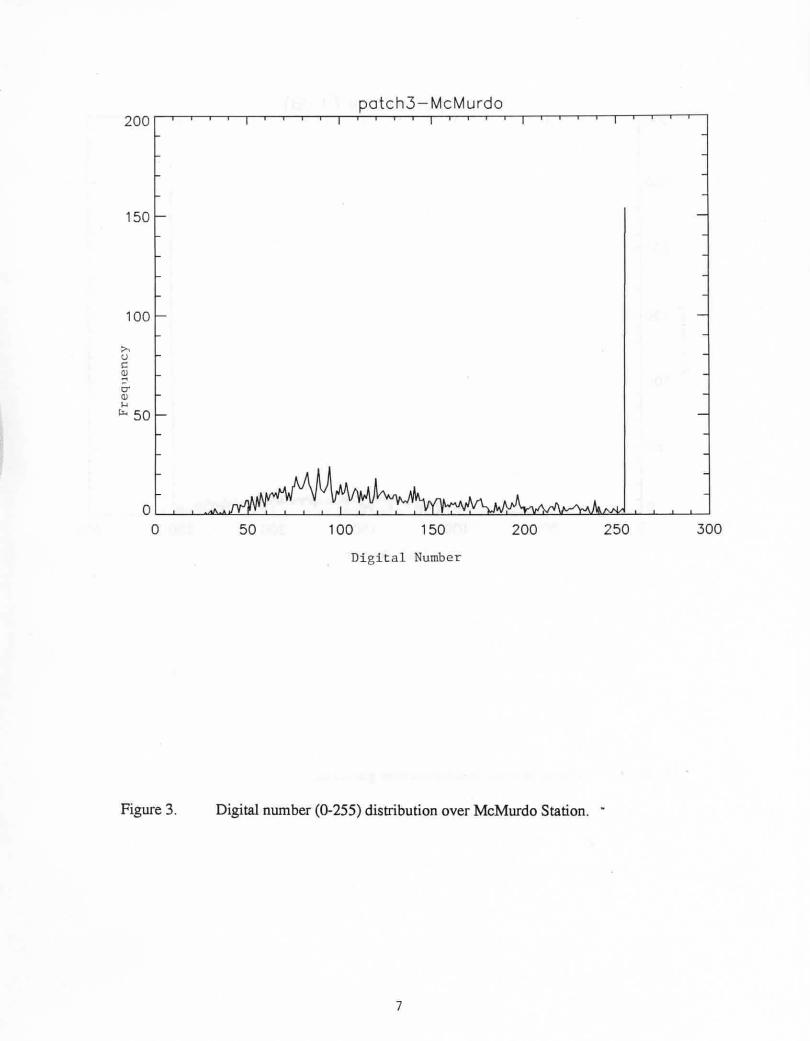
patch3 - McMurdo 200
150
100
0" Q) ,_. ~ 50
0 50 100 150 200 250 300
Digital Number
Figure 3. Digital number (0-255) distribution over McMurdo Station. ·
7

300
250
200
;>, (.) 150 c: Q) :J c:r Q) )..j
"""' 100
50
0
Figure4.
patch4-ice (0 dB)
50 100 150 200 250 300
Digital Number
Digital Number distribution over glacial ice.
8

10
;:... u c: Q) :J 0'
8
6
~ 4 !:Lo
2
0
f.-
1-
~
f.-
0
Figure 5 .
patch5-land I I I I I
----
.
-
-
II~ -
I I I I
50 100 150 200 250 300 Digital Number
Digital number (0-255) distribution over bare rock.
9

Figure 6. Full JERS-1 image Hut Point Peninsula area on Ross Island. Boxed area corresponds to figure 7. 10

Figure 7 . Locations of cligital number histograms (figure 1-5) where patch 1 corresponds to figure 1 and so on.
1 1

-.c 0> ::J ctS
Digital Number vs. Sigma Naught 10r-------.--------.--------.-------~------~--------.
0
-10
z -20 ctS E 0>
Ci5
-30
-40 Conversion equation: a 0cm = 10 log (DN2
)- K
-50~----~~----~------~------~-------L------~ 0 50 150
Digital Number 100 200 250 300
For a 0 = -15dB and DN = 40 (estimated from patch! and patch2), K = 47+ 2
1.3 GHz, W Polnriznlion .otr--------- -
0 {;;11111~1 • MutllynJr tc11 • Thock F1rst • Yoar leo • Pressure R1dgol
" Freahwater Lake • a=------. . ~
.. ~ -28 fl. ... _ -~~~---~----~~--~~L-~~
IS JO 60
Anglo of tnc1donco. degrees
Figure 8. The top graph represents the range of estimated backscatter (sigma naught) versus digital number for calibration constant K=47±2. The bottom graph is the source for sigma naught value used for first year ice (-15d.B) L-Band, 40° incidence angle used to estimate the calibration constant (Onstott, 1992).
12
t I I
l
r I

![15 Sediment Gages - USGS · 0.2707 c,S372 Velccty and backscatter seres C] Depth-averaøed streamwise vebcfy RMS Curr.tive u at depths backscatter Depth-averaged backscatter Contour](https://img.pdfslide.us/doc/110x75/5fd8133cbc6723794903cbd2/15-sediment-gages-usgs-02707-cs372-velccty-and-backscatter-seres-c-depth-averaed.jpg)


![Ultrasound backscatter tensor imaging (BTI): analysis of ... · cardiac function such as cardiac output, derived from the measure of diastolic and systolic ventricular volume [16]](https://img.pdfslide.us/doc/110x75/60633fcb9adee63abc71437b/ultrasound-backscatter-tensor-imaging-bti-analysis-of-cardiac-function-such.jpg)