Embed Size (px)
Citation preview

DEPOSIT DOLLARIZATION AND THE FINANCIAL SECTOR
IN EMERGING ECONOMIES
Patrick Honohan and Anqing Shi
Development Research Group The World Bank
Abstract
Despite declines in a few countries, new data shows that the general trend to increased use of foreign-currency-denominated bank deposits in emerging markets has continued. Analysis of the new data suggests that a sizable fraction (about half on average) of funds switched to dollar deposit accounts are effectively exported through the banking system, thereby reducing the supply of credit. Furthermore, increases in deposit dollarization are associated with increases in offshore deposits also. This likely helps explain why we find that dollarization is associated with an increase in banking spreads. The conjecture that dollarization would tend to raise wholesale interest rates systematically through a peso-premium is supported, though as yet only weakly, by our evidence. In contrast, greater dollarization is clearly associated with a higher pass-through coefficient from exchange rate change to consumer prices, potentially increasing nominal risk in the economy. _________________________________________________ Corresponding author: Patrick Honohan ([email protected]). Helpful comments were received from Gerard Caprio, James Hanson, Giovanni Majnoni, Maria Soledad Martinez-Peria, Fernando Montes-Negret and Augusto de la Torre.

Deposit Dollarization and the Financial Sector in Emerging Economies
Patrick Honohan and Anqing Shi Development Research Group, The World Bank
Introduction In many countries, usually following episodes of high inflation and sudden depreciation, banks and their customers have spontaneously shifted part of their business to foreign currency-denominated deposits and loans, a trend known as dollarization (even though other foreign currencies such as the DM/Euro have been involved in some countries1). Although not altogether irreversible -- macro stabilization and legislation prohibiting it has reduced dollarization in some countries -- it seems clear that this is a phenomenon that will be with us for the foreseeable future. This paper reviews recent trends in partial dollarization2 of bank deposits in developing countries, assembling an expanded data set on deposit dollarization. It identifies empirical regularities in the data and considers some implications for financial sector stability and performance. Though the quality and comparability of the data is not uniformly high, we do now have quantitative information on deposit dollarization for 58 emerging economies, several more than were covered in the important survey by Balino et al (1999). In addition, we have added up to five years to those countries that were in the earlier paper (its data ended at 1995). Comparing the most recent data with that for dollarization in 1995 shows that there has been a continued trend to increased dollarization. Much of the policy discussion has rightly focused on monetary stabilization issues, which are not discussed in this paper. Instead we examine issues of risk and pricing. At the level of the individual depositor, availability of foreign currency deposits offer risk-reduction possibilities, the importance of which will depend inter alia on the degree of macro volatility and the extent to which foreign currency is a useful inflation hedge. But at the level of the system as a whole, increased deposit dollarization can be associated with a change in the system's vulnerability to shocks. It can also affect the supply and cost of credit, depending on how it influences the supply of deposits to banks, and their
1 Interestingly, the dominance of the US dollar can survive even when a currency board with a peg against the euro has been established, as has recently been the case in Bulgaria. 2 This is to be distinguished from �official� or �full� dollarization, i.e. formal adoption of the US dollar as the sole legal tender and unit of account in a country (as recently in Ecuador) Related but distinct concepts are (i) use of foreign currency bills or notes, which is known as �currency substitution�; (ii) adoption of a fixed peg against the dollar, backed by a currency board, as in Hong Kong. (Indeed, currency board arrangements have sometimes been associated with prohibition of denominating bank deposits or loans in foreign currency.)

3
currency composition. For example, banks need to hedge the currency risk and may not safely be able to pass it on by lending foreign currency to local borrowers who do not have foreign currency receivables. The market power of banks may also be affected, resulting in higher spreads. Finally, if increased dollarization is associated with a higher risk premium on local currency assets, real interest rates on large deposits and money market assets denominated in local currency may also increase to clear the market. Recent papers have clarified many of the policy issues involved but there remain wide differences of opinion, some of them attributable to a lack of agreement on the ultimate causes and mechanisms involved. In this paper we throw empirical light on several of the most important building blocks of an understanding of how dollarization works. In particular, we explore
(a) whether pass-through of exchange rate changes tends to be higher with higher dollarization � we find that it is;
(b) to what extent there is an irreversibility or �ratchet effect� involved � here we find evidence of considerable time-variation in dollarization and some examples of reversibility;
(c) the relation between dollarization and the degree to which nonbank residents have deposits in off-shore banks � we find that these two appear to rise and fall together;
(d) the link between deposit dollarization and the volume and currency composition of bank lending � we find that banks tend to place offshore as much as half of increased dollar deposits received;
(e) whether bank interest margins are systematically associated with the degree of dollarization � the indications are that spreads rise with increased dollarization; and
(f) whether real deposit interest rates increase with dollarization � there is some evidence that they do.
The paper is organized as follows. We begin with a brief review of theoretical predictions about the relationships (mentioned above) between dollarization, the supply of credit, interest rates and spreads and the speed of price pass-through. This is followed (Section 2) by a description of recent developments in deposit dollarization as revealed by the data, including evidence on the supposed ratchet effect. For the remaining five issues, Section 3 presents regression results based on our new data. Section 4 considers consequences for risk in the banking system. Section 5 concludes with some remarks on policy implications. 1. Causes and Consequences of Dollarization: Review of Some Theoretical Points The degree of dollarization is something that is endogenously determined by agents optimizing within the constraints presented to them by policy and technology. Therefore it would be unwise to jump to causal conclusions when one observes correlations between the degree of deposit dollarization and other macro or financial sector variables.

4
Nevertheless, a sizable body of theory about the behavior of different classes of agent faced with the choice between home and foreign-currency denominated instruments3 does help us interpret why some such correlations may be observed. We focus on six distinct aspects, as listed in the introduction. Determinants of dollarization - the role of pass-through Holding dollar deposits helps protect against devaluation of the local currency, but this protection is usually bought at a price, in the form of lower nominal interest rates, inasmuch as interest rate differentials will adjust to offset, at least partially, the expected rate of depreciation.4 But nominal devaluation of the local currency is not the only risk to be borne in mind. Real exchange rate fluctuations mean that holding dollar deposits is not itself a risk-free strategy for a depositor whose consumption patters include local as well as imported goods. In order to minimize the variance of a portfolio's real value the mix of foreign and local currency assets must be chosen with reference both to the variance of inflation and to the variance of the real exchange rate, as well as to covariances. The higher the variance of domestic inflation, the higher the share of dollars in the minimum variance portfolio; but the higher the variance of the real exchange rate, the lower the share of dollars. Note that the minimum variance approach is relevant to borrowers as well as to lenders. The optimal portfolio will differ from the minimum variance portfolio to the extent that investors are prepared to accept a higher risk in return for a higher expected return. Nevertheless, inasmuch as both borrowers and lenders can benefit from reduced real variance, the minimum variance calculations point to likely important influences on the equilibrium share of dollarization in the economy. Indeed, empirical results reported by Ize and Levy Yeyati (1998) confirm the predicted correlations between the degree of dollarization and these determinants of the minimum variance portfolio.5 Alternative specifications, for example those expressed in terms of the risk of rare but large devaluations, may perform equally well; and other considerations may also be important.6
3 This builds in part on an older literature on the use of foreign currency notes and coin � so-called currency substitution (see Box 1). 4 As the expression goes in Latin America, one has to choose between eating (higher interest rate) and sleeping (protection against devaluation). 5 The model of Ize and Levy-Yeyati has depositors choosing between three assets: onshore local currency and both on-and -offshore forex deposits. Simple diversification arguments suggest holding some of each. The minimum variance portfolio (MVP) depends on the variance of real return of each and their covariance; deviations from MVP will be reflected in inflows or outflows. These calculations show that the dollarization ratio should increase with volatility of inflation but decline with the volatility of real exchange rate depreciation (their equation 14). This implies, somewhat counterintuitively that allowing the exchange rate to float, while targeting inflation could have the effect of reducing dollarization, whereas a pegged exchange rate will have this effect even if it reduces inflation & inflation volatility. 6 Hausman (2000) introduces an additional dimension of covariance, namely of exchange rates and interest rates with income. He argues that devaluation expectations may be correlated with income (low-income periods having high devaluation expectations) and suggests that, because of the perverse correlation between financial returns and income, people will prefer to save in foreign currency.

5
A rapid pass-through of exchange rate changes into local prices will tend to stabilize real exchange rates, which in turn will boost dollarization, according to the above reasoning (cf. Ize and Levy-Yeyati, 1998). But, although the determinants of pass-through and dollarization certainly overlap, models differ as to how closely related they are related.7 The degree of correlation between the two is thus an empirical question.8 Hysteresis or the �ratchet effect� While the initial impetus for dollarization often comes from disruption or extreme volatility in financial markets, it has often been observed that the share of dollarization remains high even when domestic financial conditions settle down. For one reason or another, once depositors become used to holding foreign currency-denominated deposits, they are slow to divest themselves of them even if the initial cause that triggered the holdings is reversed. This hysteresis or ratchet effect could be due to the set-up costs of establishing a dollar deposit and adjusting one's business accordingly. Once one has paid the set-up costs one may as well continue to benefit from the risk-reduction that can be gained from holding a mixed portfolio of currencies (Guidotti and Rodriguez, 19929, Uribe, 199710). Alternatively, the persistence of a high rate of dollarization long after the crisis could result from the persistence of long-lived residual anxieties of a recurrence that one episode of volatility can bring. Deposit dollarization vs. offshore holdings Even where FX deposits are permitted,11 depositors may prefer to place their FX deposits abroad, sometimes in banks that are officially offshore but have a significant de facto onshore presence. They will do so especially if there is a risk of expropriation, or of enforced conversion of onshore FX deposits at an unfavorable exchange rate.12 7 For example, Calvo 2000b works with a model of imperfect competition between firms with staggered price-setting; his model generates little influence of bank loan) dollarization (which he calls �liability dollarization�) on pricing decisions and hence on pass-through. 8 Some have suggested that there is no correlation in practice (cf. Gonzalez, 2000). 9 Guidotti and Rodriguez provide a useful review of the early experience of dollarization in four Latin American countries Bolivia (1986-1990), Mexico (1972-1981), Peru (1978-1984) and Uruguay (1972-1989). Their conclusion on the irreversible nature of dollarization is worth quoting in extenso �... two of the four dollarization episodes examined � those of Mexico and Peru ...ended with a forced de-dollarization. In addition, Bolivia experienced a forced de-dollarization in November 1982 ... In all of these cases, de-dollarization took the form of a de facto conversion of foreign currency deposits held by the private sector into domestic currency. In all cases, the de-dollarization implied devaluations. In addition, de-dollarization was accompanied, in all cases, by the imposition of capital and exchange controls, designed to impede any rapid reconstitution of private foreign assets holdings. Foreign currency deposits were allowed back in Bolivia in 1984 and in 1990 in Peru. The fact that dollarization have been reversed only through confiscation schemes suggests a stylized fact: in itself dollarization appears to be, to a large extent, an irreversible phenomenon.� (op. cit., p. 8). 10 In Uribe's model, society accumulates a stock of "dollarization capital" depending on what proportion of transactions are done in dollars last period. This lowers the cost of doing so in the future. But some goods are infinitely costly to buy in dollars, so there is always a demand for local currency. He shows that such an economy has two steady states, one with no dollars, other with both currencies in use. 11 Banks in several countries are restricted in the extent to which they are allowed to offer foreign-currency denominated deposits and loans to domestic customers. For example, dollarization is outlawed in Brazil and Venezuela (but not in Argentina.) 12 Hanson (2001) shows that small countries with disproportionately small values for M2 have higher than average offshore holdings of deposits as recorded in the BIS statistics.

6
Furthermore, several countries have experienced a form of round-tripping where offshore borrowing are fully backed by offshore deposits made by the borrower. The goals of such back-to-back arrangements may include tax avoidance and protection against expropriation. Impact of deposit dollarization on bank lending A shift by depositors in favor of dollars is unlikely to be associated with a corresponding one-for-one shift in the currency composition of the banks' lending. Faced with the need to hedge an increase in dollar deposits banks can denominate more of their loans in dollars and/or reinvest some of the deposited dollars abroad. There is a limit to which the first route can be done safely: after all, dollar-denominated loans to local firms is an imperfect hedge for dollar liabilities, especially if the borrower has no foreign currency receivables (or more precisely unless the borrower stands otherwise to benefit from a nominal depreciation). Many banks have found to their cost that they have merely substituted credit risk for exchange rate risk. The sizable risk of an open foreign exchange position and prudential limitations thus implies that, once the limit to safe and profitable FX lending at home has been reached, the remainder of the resources raised through dollar deposits at the bank will be placed into the international money market. An obviously relevant consideration in this regard is how fast exchange rate changes pass through into local prices. If the pass-through is very fast, then local borrowers may be able to assume the exchange risk of a foreign-currency denominated loan even if they have no foreign currency receivables. Furthermore, banks typically have more market power in lending than in deposits. This also argues that the impact of changes in deposit dollarization on the share of dollars in bank lending could be limited. By the same token, an increase in the FX share of a constant total of deposits could result in a lower volume of lending overall. Banks' market power If overall lending declines (for the reasons outlined above), this may be associated with higher bank lending spreads. More generally, availability of foreign currency resources can open profitable new lines of business and help enhance the profitability of loan markets by segmenting sub-markets.13 Dollarization and currency risk premium If the experience or risk of sharp devaluation has often been the trigger for deposit dollarization, so too it is possible that the degree of dollarization might in turn influence the risk of a policy-induced devaluation. Where deposit dollarization is high, will governments be more tempted to engineer a surprise devaluation? If so, local currency
13 Catao and Terrones (2000) provide a model in which oligopolistic banks segment the two classes of borrower, international trading or not, making the strong assumption that dollar loans are offered only to the former. They explore the theoretical impact of changes in the international interest rate on the degree of dollarization and the intermediation spread.
7
depositors will protect themselves from such risks by insisting on a higher interest rate differential, which will show up as a higher real interest rate over a period where the devaluation does not occur. Although there is no general agreement on the point, 14 it can be argued that high dollarization and speed of pass-through might increase the risk of a sizable devaluation being engineered by the authorities to relieve fiscal pressure.15 Here we picture a heavily indebted government wishing to impose a one-off capital loss on holders of government debt denominated in local currency, in order to reduce the real value of the government�s debt. If pass-through is rapid, then any change in relative prices will be short-lived; indeed relative prices and the real exchange rate will be essentially fixed. If, in addition, dollarization is high, then the impact of a devaluation on a well-hedged banking system will also be slight. The temptation for a surprise devaluation to improve the fiscal position will be especially high in such conditions, in that the real value of local-currency denominated debt can be reduced with little impact on competitiveness conditions or the banking system.16 These are thus the conditions for a high currency risk premium. This can be seen as an application of the fiscal theory of the price level according to which a major influence on inflation and exchange rate developments comes through the government's incentive to run a deficit. In order to finance this deficit, the government may have recourse to the inflation tax. If prices and wages are somewhat sticky this will lead to exchange rate overshooting and a costly period of misaligned relative prices. The degree of dollarization and the speed of pass-through both influence the incentive for reliance on the inflation tax and hence the degree to which shocks affecting the fiscal accounts will pass through to the exchange rate. In particular, the base for the inflation tax is lower if dollarization is higher, a factor that increases the size of devaluation needed to generate a given amount of revenue. This might stay the hand of government, making it more reluctant to adopt inflationary policies (Calvo and Guidotti, 1990; Calvo, 1996). On the other hand, the perceived cost of devaluing may be smaller where pass-through is high - as relative prices of goods will be relatively unaffected by currency movements. Thus, with the inflation tax often a residual source of funds (rather than being planned to achieve tax rate smoothing), a combination of dollarization (reducing the inflation tax base) and higher pass-through (lowering the real economy effects of nominal devaluation) would tend to increase nominal exchange rate volatility and thereby add a risk-premium to real interest rates. 14 For instance, Hausmann, Panizza and Stein (2000) argue that countries which are de facto unable to borrow in their own currencies will have a "fear of floating", regardless of the speed of exchange rate pass through to prices; on the other hand, countries able to borrow will float only if they have a low pass-through. If the banking system is dollarized, then this may be seen by the government as an implicit liability and put it into the same category as if it were directly borrowing in foreign currency itself. Cf. World Bank (2001). 15 An alternative motivation for engineering a surprise devaluation is to respond to a loss of price and wage competitiveness. Rapid pass-through increases the scale of nominal depreciation needed to achieve a given improvement in competitiveness. 16 With the bulk of banking being carried out in foreign currency, and prices essentially determined externally, the real value of local currency-denominated debt (including currency) has no fixed anchor, and the efficiency costs of surprise inflation are low. In such conditions, government debt denominated in local currency (including banknotes) may take on some of the character of lottery tickets.
8
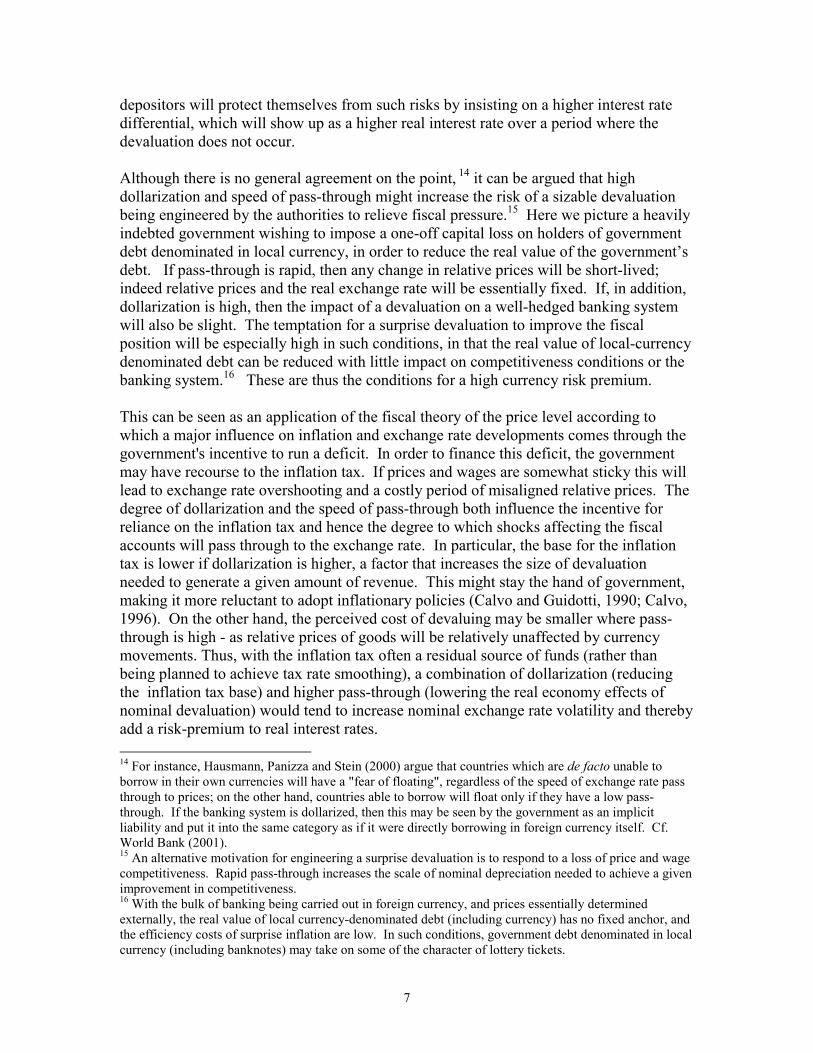
Where government macro policy lacks credibility, currency risk and country risk (as measured by the premium paid on government's FX borrowing) will both be high.17 They are in fact correlated across Latin America (suggesting a wide variation in policy credibility across this region), but not elsewhere (suggesting that other considerations can also be important). The above discussion suggests that the degree of dollarization could be a factor influencing currency risk more than country risk. 2. Recent Trends in Deposit Dollarization Although availability of data is still quite patchy, it continues to improve, and as it does, it confirms the growing importance of deposit dollarization in emerging economies. Our data set, shown in the Annex Table, contains data for 58 emerging economies.18 The share of dollar-denominated deposits in total onshore bank deposits for countries in our sample has been growing by about 1.7 percentage points per annum during the 1990s. (This is a regression based estimate, drawn from a panel regression covering the period 1990-2000.)19 For the 25 emerging economies for which we have data in respect of both 1995 and 1999, the unweighted mean share of foreign currency deposits in total bank deposits rose from 37.1 per cent to 44.2 per cent and the median share rose even more sharply from 31.6 to 43.2. The more traditional measure: foreign currency deposits as a share of M2, is available in both years for 32 emerging economies. It rose from 25.8 per cent to 30.9 per cent, while the median rose from 21.2 to 25.9; and the regression estimate of its annual rate of increase over the decade of the 1990s is 1.2 percentage points per annum. In a score of countries, data for recent years shows half or more of deposits are denominated in foreign currencies (Figure 1).
17 Powell (2000) suggests that such a correlation is a significant indicator of a lack of macroeconomic policy credibility or trustworthiness. An alternative and more traditional measure of this state of "original sin" (as it is known in the literature) is when a country's currency is not used to denominate long-term contracts or for borrowing abroad. 18 The data are drawn from four main sources. We use data from International Financial Statistics for about 19 countries and from individual IMF country reports for about 29 countries. We also drew on the data in Balino et al (1999), which runs up to 1995. Finally we employ data from national central bank sources for 9 countries, mostly in Latin America, previously collected and kindly provided by Maria Soledad Martinez-Peria. Where conflicts existed between different sources, some judgement had to be applied, with a preference for the longer consistent series. 19 Including country fixed effects and a first-order autoregressive coefficient.
9
Figure 1: Foreign Currency Deposits as a Share of Total Deposits Countries with the highest deposit dollarization, highest year 1990-2000
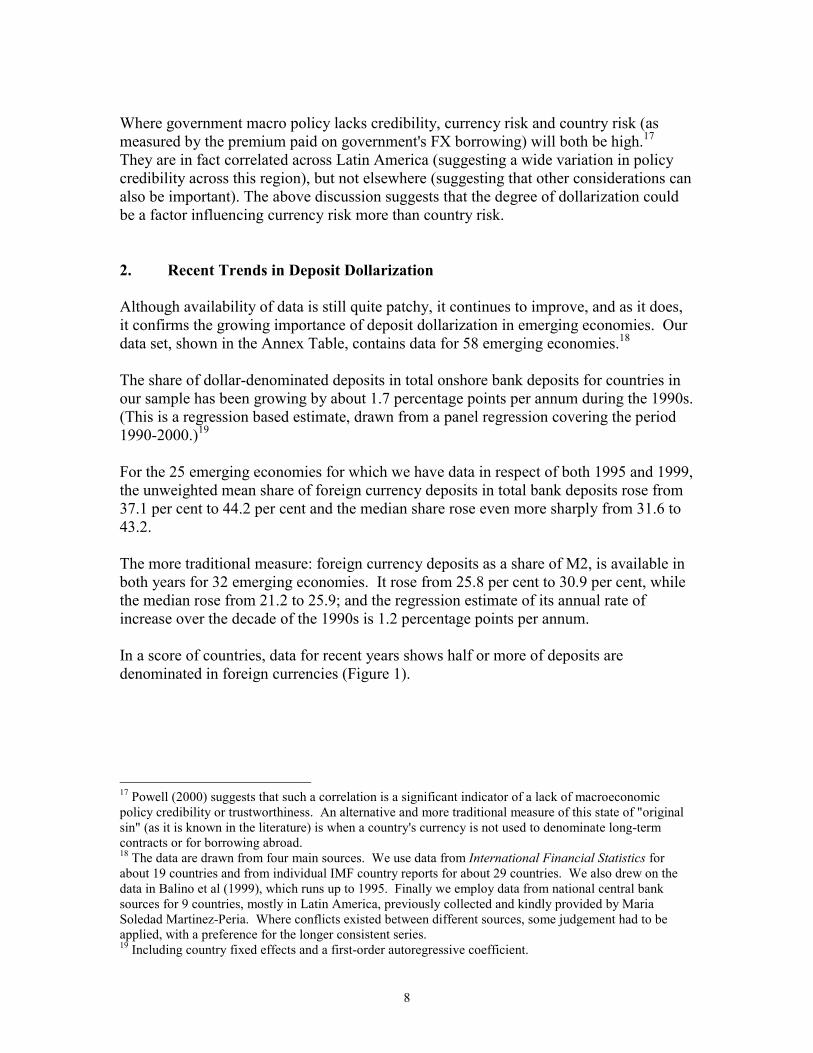
Source: dollarization.xls A ratchet effect? The increase in average dollarization reflects increases in most of the individual countries also, as seen in Figures 2-3. However, there has been a sharp decline in a handful of Eastern European countries. Without denying that a form of "ratchet effect" (discussed above) could apply with spontaneous dollarization, the recent declines in several countries do indicate that the process is not impossible to reverse. Poland is probably the most striking example in the data of an apparently sizeable and sustained decline in dollarization. The figures for Estonia and Lithuania are also interesting in that they suggest a decline, followed by a gradual resumption of the use of foreign currency deposits as the decade of the 1990s progressed.
0 20 40 60 80
Sao Tome & Principe
Turkey
Paraguay
Mozambique
Greece
Egypt
Bulgaria
Guinea Bissau
Argentina
Lithuania
Belarus
Peru
Nicaragua
Laos
Azerbaijan
Armenia
Tajikistan
Croatia
Lebanon
Georgia
Zaire
Angola
Bolivia
Cambodia

10
T re n d in d e p o s it d o lla r iz a t io nF X d e p o s its a s % M 2
0
2 0
4 0
6 0
8 0
Boliv
ia
Ango
la
Arge
ntin
a
Rom
ania
Arm
enia
Moz
ambi
que
Sao
Tom
e &
Prin
cipe
Rus
sia
Tajik
ista
n
Egyp
t
Ukr
aine
Mac
edon
ia F
YR
Saud
i Ara
bia
Net
herla
nds
Antil
les
Cze
ch
Hun
gary
1 9 9 9 /2 0 0 01 9 9 5
Figure 2: Trends in Dollarization, 1995-2000
Source: dollariz9599.xls
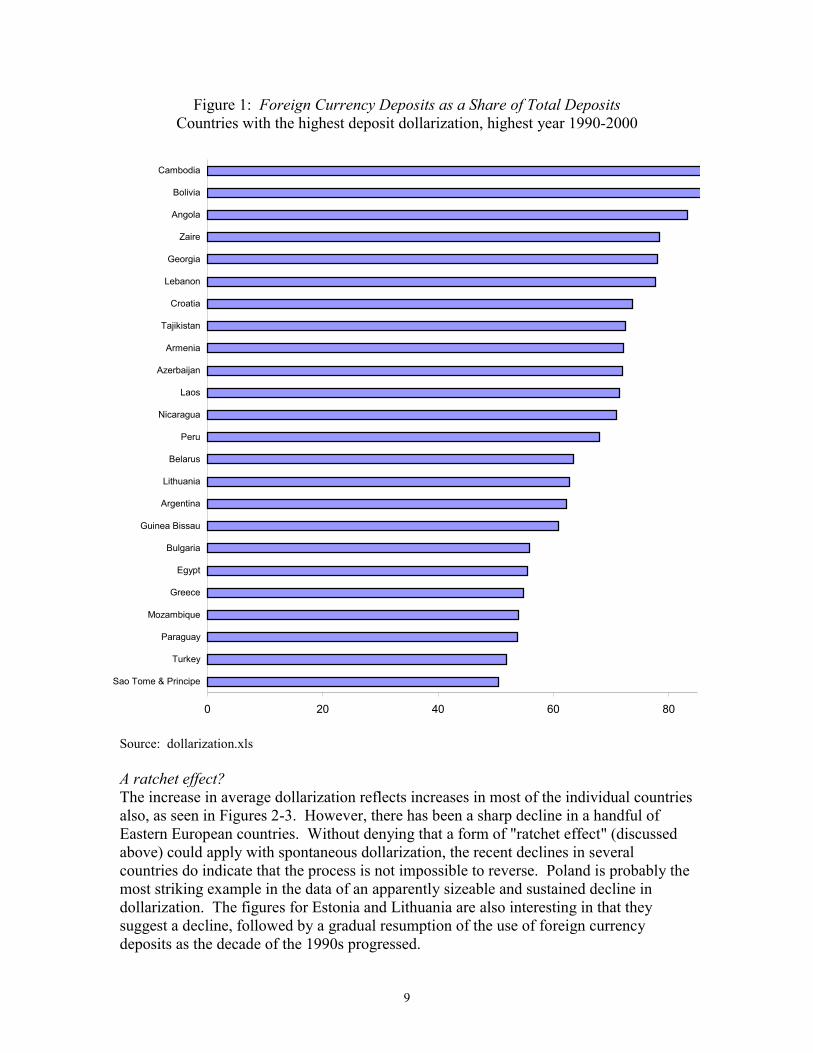
Figure 3: Trends in dollarization, 1995-2000
Source: dollariz9599.xls
Trend in deposit dollarizationFX deposits as % M2
0
20
40
60
80
100
0 20 40 60 80
1995
1999
-200
0
11
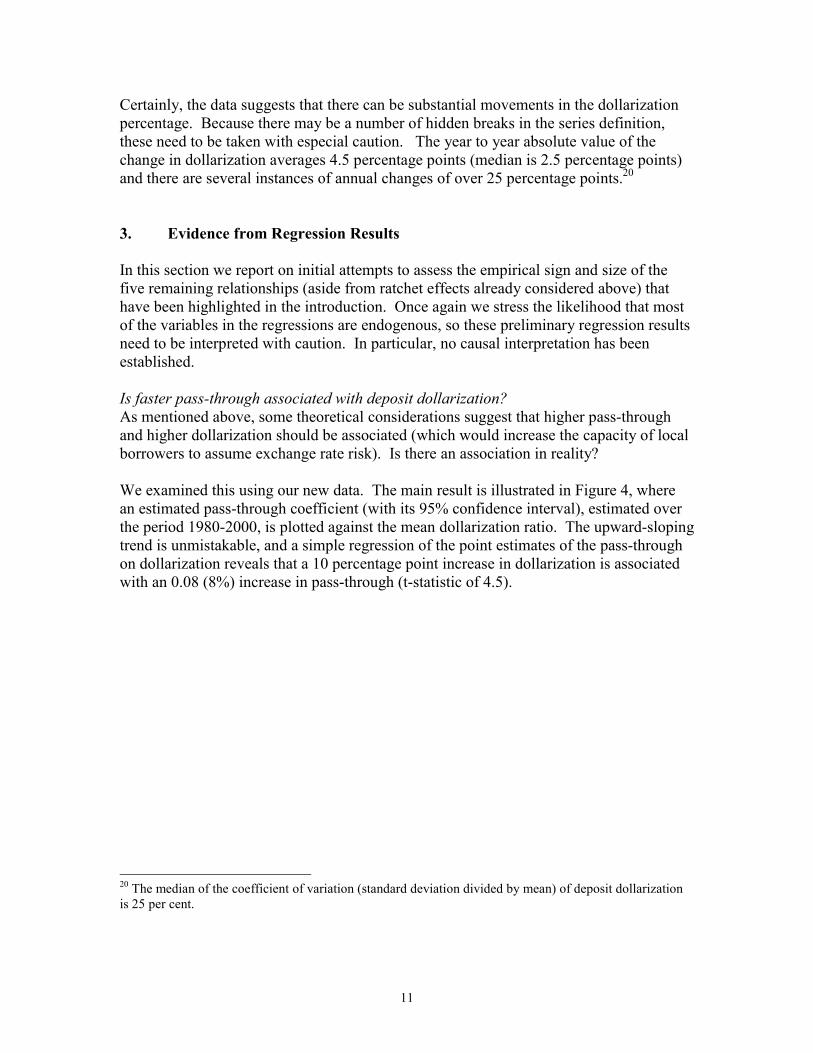
Certainly, the data suggests that there can be substantial movements in the dollarization percentage. Because there may be a number of hidden breaks in the series definition, these need to be taken with especial caution. The year to year absolute value of the change in dollarization averages 4.5 percentage points (median is 2.5 percentage points) and there are several instances of annual changes of over 25 percentage points.20 3. Evidence from Regression Results In this section we report on initial attempts to assess the empirical sign and size of the five remaining relationships (aside from ratchet effects already considered above) that have been highlighted in the introduction. Once again we stress the likelihood that most of the variables in the regressions are endogenous, so these preliminary regression results need to be interpreted with caution. In particular, no causal interpretation has been established. Is faster pass-through associated with deposit dollarization? As mentioned above, some theoretical considerations suggest that higher pass-through and higher dollarization should be associated (which would increase the capacity of local borrowers to assume exchange rate risk). Is there an association in reality? We examined this using our new data. The main result is illustrated in Figure 4, where an estimated pass-through coefficient (with its 95% confidence interval), estimated over the period 1980-2000, is plotted against the mean dollarization ratio. The upward-sloping trend is unmistakable, and a simple regression of the point estimates of the pass-through on dollarization reveals that a 10 percentage point increase in dollarization is associated with an 0.08 (8%) increase in pass-through (t-statistic of 4.5).
20 The median of the coefficient of variation (standard deviation divided by mean) of deposit dollarization is 25 per cent.

Figure 4: Estimated Pass-Through Coefficient and Dollarization
Source: plot.xls The pass-through coefficient shown in Figure 4 is measured as follows from a simple panel of quarterly data from over 50 countries, 1980-2000.21 The dependent variable p is the log of the consumer price index; changes in it are modeled as impacted by changes in the log dollar exchange rate e with a lagged 4-quarter change in p as well as the real exchange rate q (local consumer prices compared with dollar-adjusted US wholesale prices) as an error-correction or catch-up term. Thus the estimated equation is:
4351210 )( −−− +−+∆+=∆ qppep αααα (1)
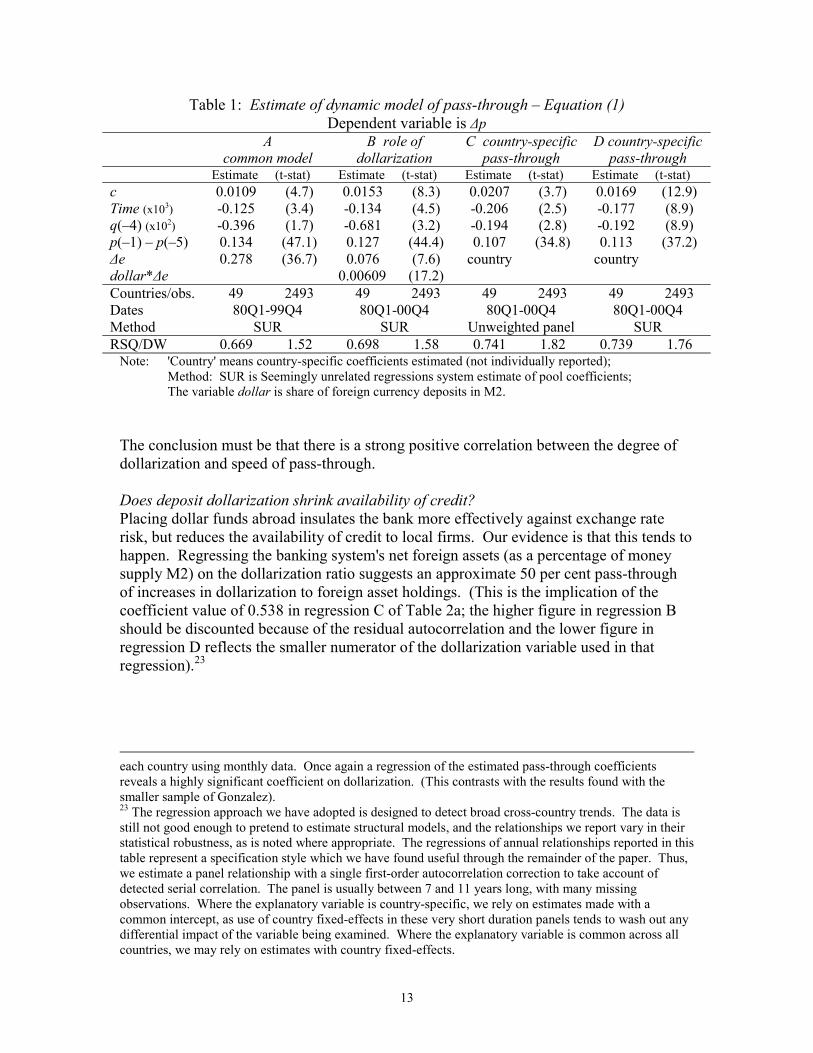
The coefficient α1 is taken as the pass-through coefficient. (Little difference is made by employing instead a combination of α1 and α3 as in the cumulative pass-through after one-year, or half-life etc). Even using common coefficients for all countries, this model explains two-thirds of the sample variability, as can be seen from regression A of Table 1. Making α1 a function of the mean dollarization rate, as in regression B, improves the fit significantly and the coefficient is positive and highly significant. An increase of 10 percentage points in dollarization increases estimated pass-through by 0.064 (over 6 per cent). Allowing country-specific values of α1 improves the fit even more. The pass-through coefficients used in Figure 4 are the point estimates from regression C of the country-specific coefficients α1.22 21 Except where specified, all quarterly data employed is from IFS and all annual data from WDI. 22 A wide variety of methods is available to model pass-through, and there is also the question of time-varying pass-through. Following Gonzalez (2000), we also estimated annual pass-through coefficients for
Pass-through coefficient and dollarization
-0.5
0
0.5
1
0 20 40 60 80
dollarization (% of M2)
estim
ated
pas
s-th
roug
h co
effic
ient
13
Table 1: Estimate of dynamic model of pass-through � Equation (1) Dependent variable is ∆p
A common model
B role of dollarization
C country-specific pass-through
D country-specific pass-through
Estimate (t-stat) Estimate (t-stat) Estimate (t-stat) Estimate (t-stat) c 0.0109 (4.7) 0.0153 (8.3) 0.0207 (3.7) 0.0169 (12.9) Time (x103) -0.125 (3.4) -0.134 (4.5) -0.206 (2.5) -0.177 (8.9) q(�4) (x102) -0.396 (1.7) -0.681 (3.2) -0.194 (2.8) -0.192 (8.9) p(�1) � p(�5) 0.134 (47.1) 0.127 (44.4) 0.107 (34.8) 0.113 (37.2) ∆e 0.278 (36.7) 0.076 (7.6) country country dollar*∆e 0.00609 (17.2) Countries/obs. 49 2493 49 2493 49 2493 49 2493 Dates 80Q1-99Q4 80Q1-00Q4 80Q1-00Q4 80Q1-00Q4 Method SUR SUR Unweighted panel SUR RSQ/DW 0.669 1.52 0.698 1.58 0.741 1.82 0.739 1.76
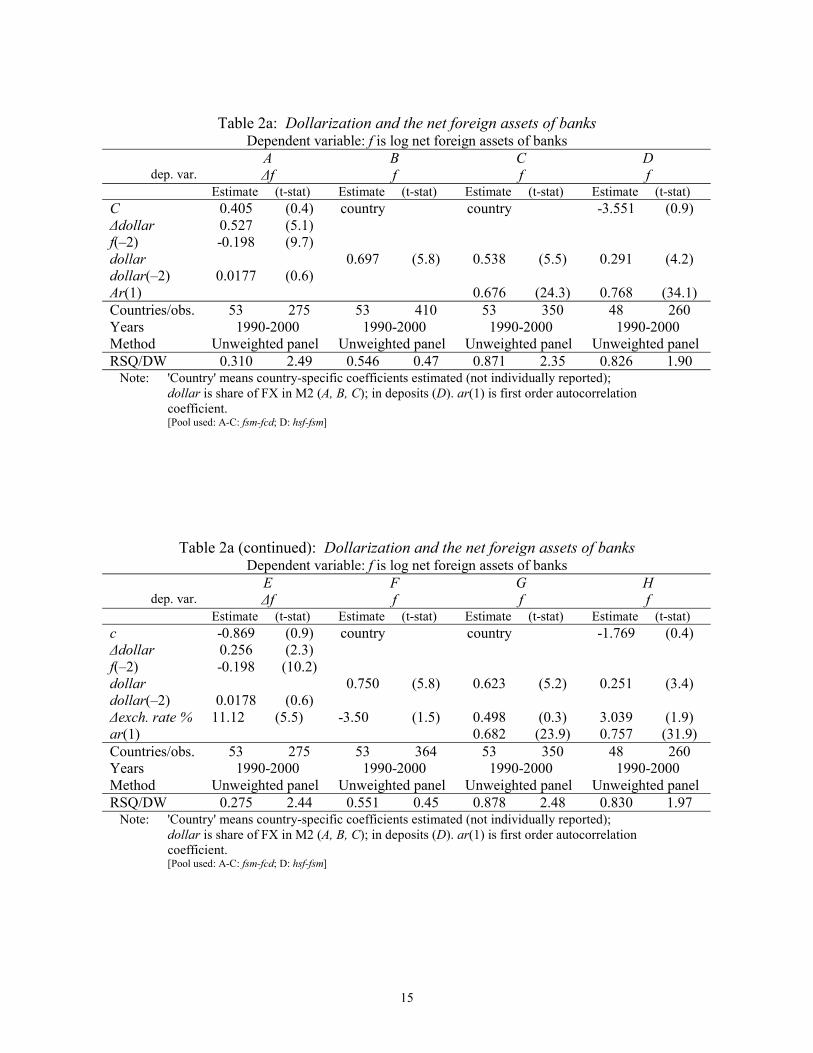
Note: 'Country' means country-specific coefficients estimated (not individually reported); Method: SUR is Seemingly unrelated regressions system estimate of pool coefficients; The variable dollar is share of foreign currency deposits in M2. The conclusion must be that there is a strong positive correlation between the degree of dollarization and speed of pass-through. Does deposit dollarization shrink availability of credit? Placing dollar funds abroad insulates the bank more effectively against exchange rate risk, but reduces the availability of credit to local firms. Our evidence is that this tends to happen. Regressing the banking system's net foreign assets (as a percentage of money supply M2) on the dollarization ratio suggests an approximate 50 per cent pass-through of increases in dollarization to foreign asset holdings. (This is the implication of the coefficient value of 0.538 in regression C of Table 2a; the higher figure in regression B should be discounted because of the residual autocorrelation and the lower figure in regression D reflects the smaller numerator of the dollarization variable used in that regression).23
each country using monthly data. Once again a regression of the estimated pass-through coefficients reveals a highly significant coefficient on dollarization. (This contrasts with the results found with the smaller sample of Gonzalez). 23 The regression approach we have adopted is designed to detect broad cross-country trends. The data is still not good enough to pretend to estimate structural models, and the relationships we report vary in their statistical robustness, as is noted where appropriate. The regressions of annual relationships reported in this table represent a specification style which we have found useful through the remainder of the paper. Thus, we estimate a panel relationship with a single first-order autocorrelation correction to take account of detected serial correlation. The panel is usually between 7 and 11 years long, with many missing observations. Where the explanatory variable is country-specific, we rely on estimates made with a common intercept, as use of country fixed-effects in these very short duration panels tends to wash out any differential impact of the variable being examined. Where the explanatory variable is common across all countries, we may rely on estimates with country fixed-effects.

14
Some of this effect, especially where change in the dollarization rate is an explanatory variable, as in Equation A, could be seen as a mechanical valuation change effect, in that appreciation of the dollar would increase both dollarization and the net foreign holdings as a share of the portfolio even if no other change occurred. Nevertheless, albeit mechanical, it is real. A simple and rough way of gauging the importance of the mechanical exchange rate effect is to include the rate of exchange rate change in the previous year as an additional explanatory variable. Equation E shows that this still leaves a sizable and significant non-mechanical effect about twice the original estimate of Equation A. Including the exchange rate change in the other equations in which dollarization enters only in its level, and not in the rate of change, suggests that there is no significant mechanical valuation effect influencing those estimates (compare Equations F-H with B-D). Dollarization thus does appear to shrink the availability of credit, as compared with a situation where the same amount of deposits are held onshore, but in local currency.
15
Table 2a: Dollarization and the net foreign assets of banks
Dependent variable: f is log net foreign assets of banks A B C D
dep. var. ∆f f f f Estimate (t-stat) Estimate (t-stat) Estimate (t-stat) Estimate (t-stat) C 0.405 (0.4) country country -3.551 (0.9) ∆dollar 0.527 (5.1) f(�2) -0.198 (9.7) dollar 0.697 (5.8) 0.538 (5.5) 0.291 (4.2) dollar(�2) 0.0177 (0.6) Ar(1) 0.676 (24.3) 0.768 (34.1) Countries/obs. 53 275 53 410 53 350 48 260 Years 1990-2000 1990-2000 1990-2000 1990-2000 Method Unweighted panel Unweighted panel Unweighted panel Unweighted panel RSQ/DW 0.310 2.49 0.546 0.47 0.871 2.35 0.826 1.90
Note: 'Country' means country-specific coefficients estimated (not individually reported); dollar is share of FX in M2 (A, B, C); in deposits (D). ar(1) is first order autocorrelation
coefficient. [Pool used: A-C: fsm-fcd; D: hsf-fsm]
Table 2a (continued): Dollarization and the net foreign assets of banks Dependent variable: f is log net foreign assets of banks
E F G H dep. var. ∆f f f f
Estimate (t-stat) Estimate (t-stat) Estimate (t-stat) Estimate (t-stat) c -0.869 (0.9) country country -1.769 (0.4) ∆dollar 0.256 (2.3) f(�2) -0.198 (10.2) dollar 0.750 (5.8) 0.623 (5.2) 0.251 (3.4) dollar(�2) 0.0178 (0.6) ∆exch. rate % 11.12 (5.5) -3.50 (1.5) 0.498 (0.3) 3.039 (1.9) ar(1) 0.682 (23.9) 0.757 (31.9) Countries/obs. 53 275 53 364 53 350 48 260 Years 1990-2000 1990-2000 1990-2000 1990-2000 Method Unweighted panel Unweighted panel Unweighted panel Unweighted panel RSQ/DW 0.275 2.44 0.551 0.45 0.878 2.48 0.830 1.97
Note: 'Country' means country-specific coefficients estimated (not individually reported); dollar is share of FX in M2 (A, B, C); in deposits (D). ar(1) is first order autocorrelation
coefficient. [Pool used: A-C: fsm-fcd; D: hsf-fsm]
16
Table 2b: Dollarization and offshore deposits Dependent variable: ∆f: change in nonbank holdings of deposits in reporting offshore banks as % M2
A B C D Estimate (t-stat) Estimate (t-stat) Estimate (t-stat) Estimate (t-stat) c 1.519 (1.5) 0.254 (0.3) 0.648 (0.6) -0.310 (0.3) ∆dollar 0.546 (4.6) 0.602 (5.0) 0.441 (4.6) 0.492 (4.3) lagged f -0.096 (3.9) -0.016 (0.6) -0.098 (3.9) -0.015 (0.6) lagged dollar -0.019 (0.7) -0.012 (0.5) 0.010 (0.5) 0.011 (0.5) ar(1) -0.239 (4.1) -0.447 (4.8) -0.256 (4.4) -0.452 (4.5) Countries/obs. 45 127 45 83 45 117 45 74 Years 1995-2000 1995-2000 1995-2000 1995-2000 Method Unweighted panel Unweighted panel Unweighted panel Unweighted panel RSQ/DW 0.282 2.16 0.362 1.82 0.298 2.27 0.324 2.09
Note: dollar is share of FX in M2 (A,B); in deposits (C,D); Lag length: 1 year (A,C); 2 years (B,D). ar(1) is first order autocorrelation coefficient. [Pool used: A-C: offshore]
Table 2b (continued): Dollarization and offshore deposits Dependent variable: ∆f: change in nonbank holdings of deposits in reporting offshore banks as % M2
E F G H Estimate (t-stat) Estimate (t-stat) Estimate (t-stat) Estimate (t-stat) c 1.129 (1.2) 0.161 (0.2) 0.207 (0.6) -0.749 (0.9) ∆dollar 0.250 (2.1) 0.262 (2.4) 0.191 (1.9) 0.195 (2.0) lagged f -0.115 (5.1) -0.043 (2.2) -0.117 (5.2) -0.044 (2.1) lagged dollar -0.032 (1.3) -0.017 (0.9) 0.009 (0.0) 0.006 (0.3) ∆exch. rate % 8.894 (5.1) 9.040 (6.1) 9..070 (5.2) 9.293 (6.0) ar(1) -0.274 (5.2) -0.576 (7.0) -0.279 (5.4) -0.595 (6.5) Countries/obs. 45 127 45 82 45 117 45 74 Years 1995-2000 1995-2000 1995-2000 1995-2000 Method Unweighted panel Unweighted panel Unweighted panel Unweighted panel RSQ/DW 0.408 2.13 0.560 1.42 0.434 2.20 0.546 1.49
Note: dollar is share of FX in M2 (A,B); in deposits (C,D); Lag length: 1 year (A,C); 2 years (B,D). ar(1) is first order autocorrelation coefficient. [Pool used: A-C: offshore]
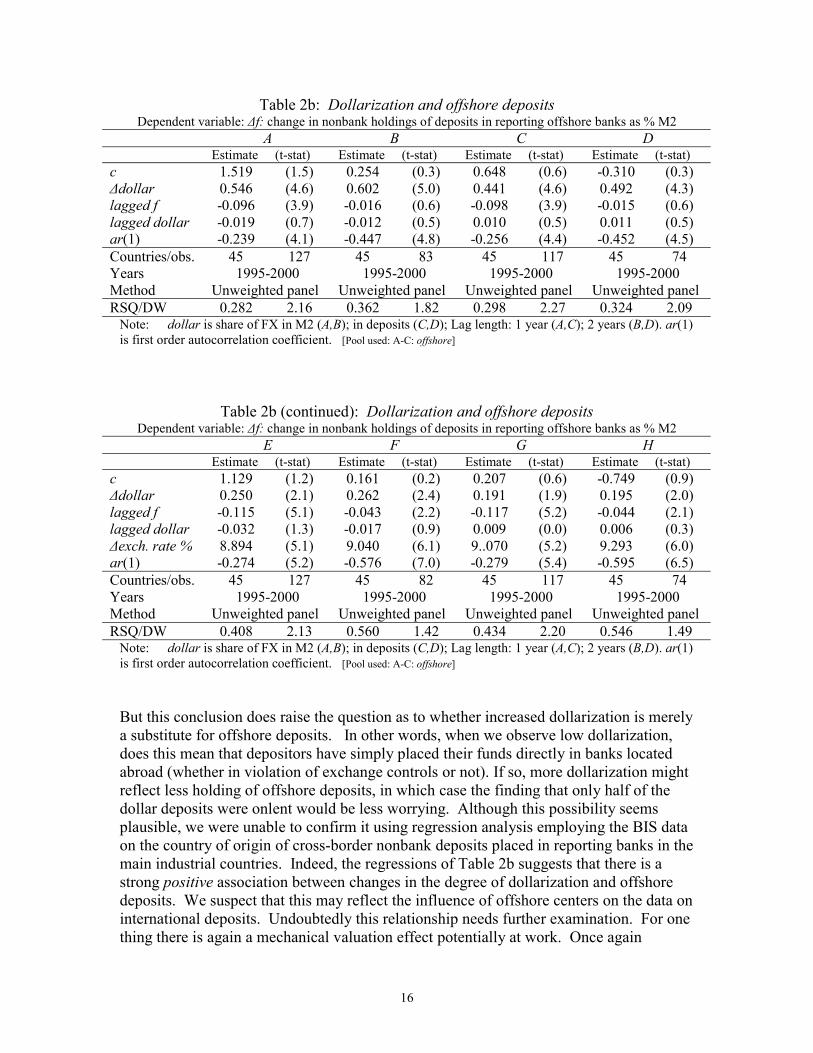
But this conclusion does raise the question as to whether increased dollarization is merely a substitute for offshore deposits. In other words, when we observe low dollarization, does this mean that depositors have simply placed their funds directly in banks located abroad (whether in violation of exchange controls or not). If so, more dollarization might reflect less holding of offshore deposits, in which case the finding that only half of the dollar deposits were onlent would be less worrying. Although this possibility seems plausible, we were unable to confirm it using regression analysis employing the BIS data on the country of origin of cross-border nonbank deposits placed in reporting banks in the main industrial countries. Indeed, the regressions of Table 2b suggests that there is a strong positive association between changes in the degree of dollarization and offshore deposits. We suspect that this may reflect the influence of offshore centers on the data on international deposits. Undoubtedly this relationship needs further examination. For one thing there is again a mechanical valuation effect potentially at work. Once again

17
correcting for this by including the rate of exchange rate change confirms that there still is a non-mechanical effect of about half the original estimate (compare Equations E-H with A-D).24 Dollarization and interest spreads If increased dollarization does squeeze availability of credit, we would expect an increase in interest spreads. Indeed, this appears to be the case (using the difference between loan and deposit interest rates quoted in IFS). A simple panel regression as shown in Table 3a indicates a correlation with a sizeable impact of increases in dollarization: the point estimates associate a ten percentage point increase in deposit dollarization with an increase of about 150 basis points in quoted spreads (regressions A and C). Of course these can be seen as very under-specified equations, especially insofar as coverage of country characteristics are concerned: nevertheless, inclusion of country fixed effects to partially does not reduce the size of the effect or eliminate its significance of dollarization, at least when expressed as a share of M2 (regression B).
Table 3a: Dollarization and intermediation spread Dependent variable: difference between quoted loan and deposit interest rates spr
A B C D Estimate (t-stat) Estimate (t-stat) Estimate (t-stat) Estimate (t-stat) c 8.209 (3.9) Country 6.474 (3.8) Country dollar 0.155 (2.7) 0.344 (2.5) 0.144 (3.9) 0.113 (1.0) ar(1) 0.470 (16.7) 0.343 (10.0) 0.423 (15.1) 0.330 (8.8) Countries/obs. 50 182 50 182 48 168 48 168 Years 1994-2000 1994-2000 1994-2000 1994-2000 Method Unweighted panel Unweighted panel Unweighted panel Unweighted panel RSQ/DW 0.621 1.44 0.798 2.38 0.614 1.67 0.731 2.37
Note: dollar is share in M2 (A,B); in deposits (C,D). ar(1) is first order autocorrelation coefficient. [pools used: spread]
Table 3b: Dollarization and intermediation spread Dependent variable: difference between quoted loan and deposit interest rates spr
A B Estimate (t-stat) Estimate (t-stat) c -4.357 (0.2) 9.935 (0.5) dollar -0.106 (0.5) -0.218 (1.4) spread-fx 1.240 (3.8) 1.375 (4.1) ar(1) 0.947 (17.0) 0.934 (19.5) Countries/obs. 7 19 7 19 Years 1994-2000 1994-2000 Method Unweighted panel Unweighted panel RSQ/DW 0.931 2.18 0.938 2.55
Note: dollar is share in M2 (A); in deposits (B). spread-fx is the difference between quoted loan and deposit interest rates for FX-denominated business. ar(1) is first order autocorrelation coefficient. [pools used: spread] 24 It should be mentioned that we have not been able to examine directly the various forms of round-tripping which may occur, notably the practice of dollar borrowing from local banks with the proceeds placed abroad or in local dollar deposits for tax, exchange control or other reasons.

18
However, the interesting hypothesis of Catao and Terrones that an increase in dollarization would widen interest spreads for local currency borrowers more than for foreign currency borrowers does not seem to find support in this data. Using the very limited data available for foreign currency spreads (just eight countries - see Figure 5), Table 3b implies that the level of dollarization does not influence the relationship between dollar-based spreads and local currency based spreads.
Figure 5: Intermediation Spreads: Local Currency and Foreign Exchange Business
Source: spreads8cntr.xls / IFS Dollarization and currency risk A possible correlation between the degree of dollarization and the currency risk premium has been discussed above. Preliminary examination of this issue suggests that there may indeed be a positive statistical association between dollarization and real interest rates; however, it is not clear that the relation is a robust one. We used real deposit interest rates, as these are available for a much wider range of countries than wholesale rates. Included on its own in a panel regression (along with the first order autocorrelation coefficient), dollarization does appear to increase the level of real deposit interest rates (regression A of Table 4). The effect becomes insignificant when country fixed effects are included, though this should not be considered decisive given the small number of cross-sections (regression B). More important, the effect remains of similar size and still significant when data on the fiscal deficit (regression C)
Spreads: local currency and FXmonthly average 1997-99
0 10 20 30 40 50
ARGENTINA
EL SALVADOR
MOLDOVA
HONDURAS
PARAGUAY
GEORGIA
BOLIVIA
URUGUAY
% per annum
fx spreadlocal spread

19
and the current account of the balance of payments (regression D), variables that are used to explain the real interest rate, are is also included. However, these results hold only when dollarization is expressed as a percentage of deposits; when M2 is the denominator, the variable becomes insignificant (Regressions E-H). Nevertheless, this preliminary analysis suggests that there may be something to the conjecture that dollarization increases the real rate of interest.
Table 4: Dollarization and real interest rates Dependent variable is real deposit interest rate r
A B C D Estimate (t-stat) Estimate (t-stat) Estimate (t-stat) Estimate (t-stat) c 3.516 (0.8) country -1.582 (0.3) -2.859 (0.6) dollar 0.247 (2.7) 0.194 (1.0) 0.255 (2.8) 0.206 (2.1) deficit 1.322 (2.7) 1.084 (2.1) bop ca 0.764 (2.5) ar(1) 0.474 (9.1) 0.235 (3.2) 0.378 (6.1) 0.440 (6.8) Countries/obs. 34 147 34 147 34 109 34 108 Years 1990-1999 1990-1999 1990-1999 1990-1999 Method Unweighted panel Unweighted panel Unweighted panel Unweighted panel RSQ/DW 0.403 1.84 0.559 1.94 0.370 1.32 0.406 1.50
Note: 'Country' means country-specific coefficients estimated (not individually reported); dollar is share of foreign currency deposits in total deposits. ar(1) is first order autocorrelation coefficient. [pool: avail_hsf_int]
Table 4 continued: Dollarization and real interest rates Dependent variable is real deposit interest rate r
E F G H Estimate (t-stat) Estimate (t-stat) Estimate (t-stat) Estimate (t-stat) c 12.62 (3.0) 8.200 (1.8) 2.327 (0.4) 1.923 (0.3) dollar 0.006 (0.1) 0.163 (1.4) 0.201 (1.5) 0.134 (1.0) deficit 1.544 (2.8) 1.181 (2.1) bop ca 0.754 (2.2) ar(1) 0.563 (4.5) 0.522 (11.3) 0.445 (7.5) 0.494 (8.2) Countries/obs. 51 249 34 176 34 125 34 124 Years 1990-1999 1990-1999 1990-1999 1990-1999 Method Unweighted panel Unweighted panel Unweighted panel Unweighted panel RSQ/DW 0.467 1.95 0.450 1.89 0.411 1.47 0.435 1.63
Note: 'Country' means country-specific coefficients estimated (not individually reported); dollar is share of foreign currency deposits in M2. ar(1) is first order autocorrelation coefficient. [pool: A: int_not_ury; others: avail_hsf_int]

20
4. Dollarization and Banking System Risk Drawing the strands together and simplifying we see the elements of a potential structural problem: factors leading to increased deposit dollarization could result in higher interest rates, lower credit supply and greater vulnerability of the banking system. Even if bank margins widen, the net impact of increased dollarization on the sustained profitability of banks is unclear. For example, to the extent that dollar lending does also increase, this may also increase vulnerabilities to indirect currency risk (when borrowers cannot absorb the FX risk). There may also be an increase in banking risks associated with waves of currency speculation when depositors can choose the currency of denomination. This may not be obvious at first sight: after all, if deposit dollarization were not allowed, an increase in the perceived risk of a major devaluation would tend to result in deposit outflows presenting each bank with a liquidity problem.25 Thus, at first sight, availability of dollar deposits appears to have the potential to insulate banks against deposit outflows triggered by a change in exchange rate expectations. Depositors need not withdraw their deposits if they can simply adjust the currency denomination of their deposit portfolio with a telephone call to the bank.26 But currency switching by depositors, notably in response to shifting expectations about future exchange rate movements, is a source of volatility to banks, increasing their need for liquid assets and further reducing the supply of loanable funds. Thus, faced with an abrupt change in the currency composition of its deposits, a bank suddenly finds itself exposed to foreign exchange risk and will need to hedge this, effectively putting pressure on the value of the local currency. Clearly the bank will again need to have sufficient liquidity to face the risk of this happening suddenly - perhaps more so because of the ease with which local depositors can make these switches (again putting downward pressure on the availability of loanable funds). Even with adequate liquidity in local currency, the bank is vulnerable in these conditions. After all, forced sale of these local currency liquid assets will, unless the central bank intervenes, depress the currency and result in capital losses for the bank. This risk can be met with adequate procedures to make sure that the rates of exchange offered by the retail deposit desks of the bank are up to date and embody a risk cushion. However, it is not hard to see that, especially where a quasi-fixed exchange rate regime has been in effect for some time, such procedures may not be fully in effect. Overall, the bank may not
25 The ability of the central bank as lender of last resort to compensate such outflows may be limited, either de facto or de jure by its attempt to maintain the parity (Fischer, 1999). 26 Though this will not be enough for depositors who fear that their dollar deposits might be frozen as part of the currency crisis.
21
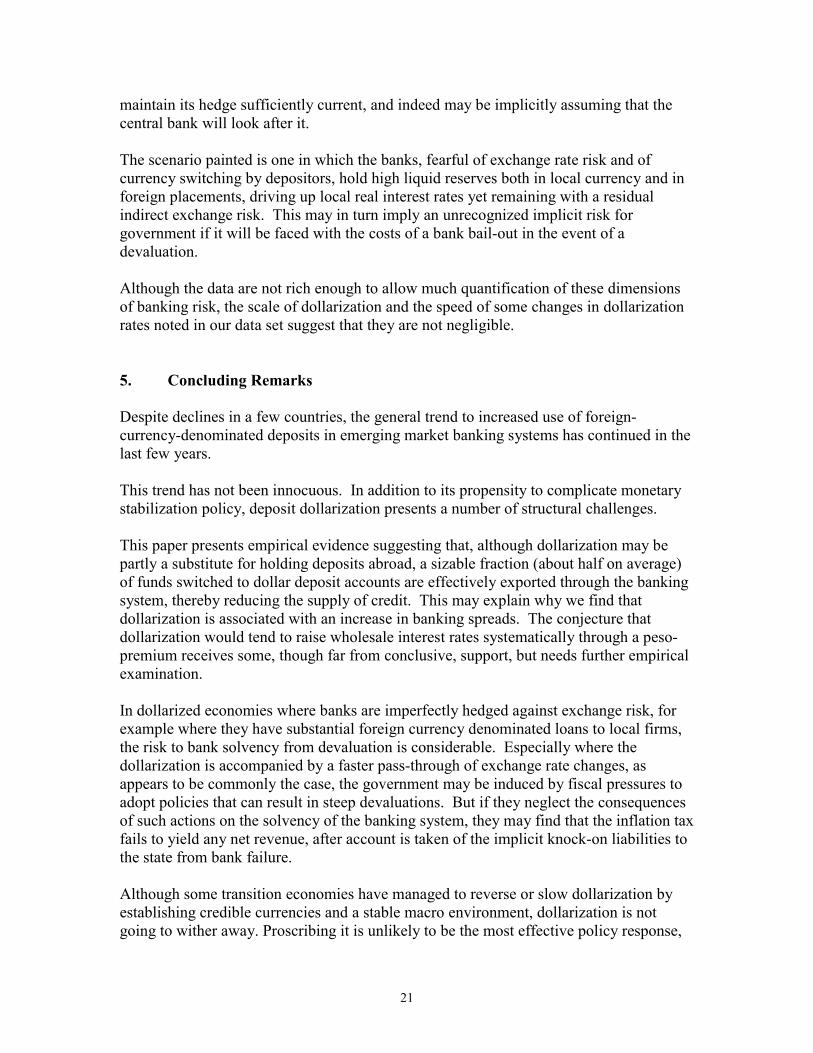
maintain its hedge sufficiently current, and indeed may be implicitly assuming that the central bank will look after it. The scenario painted is one in which the banks, fearful of exchange rate risk and of currency switching by depositors, hold high liquid reserves both in local currency and in foreign placements, driving up local real interest rates yet remaining with a residual indirect exchange risk. This may in turn imply an unrecognized implicit risk for government if it will be faced with the costs of a bank bail-out in the event of a devaluation. Although the data are not rich enough to allow much quantification of these dimensions of banking risk, the scale of dollarization and the speed of some changes in dollarization rates noted in our data set suggest that they are not negligible. 5. Concluding Remarks Despite declines in a few countries, the general trend to increased use of foreign-currency-denominated deposits in emerging market banking systems has continued in the last few years. This trend has not been innocuous. In addition to its propensity to complicate monetary stabilization policy, deposit dollarization presents a number of structural challenges. This paper presents empirical evidence suggesting that, although dollarization may be partly a substitute for holding deposits abroad, a sizable fraction (about half on average) of funds switched to dollar deposit accounts are effectively exported through the banking system, thereby reducing the supply of credit. This may explain why we find that dollarization is associated with an increase in banking spreads. The conjecture that dollarization would tend to raise wholesale interest rates systematically through a peso-premium receives some, though far from conclusive, support, but needs further empirical examination. In dollarized economies where banks are imperfectly hedged against exchange risk, for example where they have substantial foreign currency denominated loans to local firms, the risk to bank solvency from devaluation is considerable. Especially where the dollarization is accompanied by a faster pass-through of exchange rate changes, as appears to be commonly the case, the government may be induced by fiscal pressures to adopt policies that can result in steep devaluations. But if they neglect the consequences of such actions on the solvency of the banking system, they may find that the inflation tax fails to yield any net revenue, after account is taken of the implicit knock-on liabilities to the state from bank failure. Although some transition economies have managed to reverse or slow dollarization by establishing credible currencies and a stable macro environment, dollarization is not going to wither away. Proscribing it is unlikely to be the most effective policy response,
22
and could be counterproductive. Short of this, many other policy tools influence the degree of dollarization. These include the design of various taxes and tax-like measures including reserve requirements. Lender of last resort and other safety net features, to the extent that they offer equal cover to dollar-denominated and local currency deposits, are often seen as providing an implicit subsidy to the expansion of dollarization (Broda and Levy-Yeyati, 2000). Relevant policy will importantly also include the level of inflation tax, whether one-off ("surprise") or steady-state. There are obviously implications for optimal monetary, exchange rate and financial sector policy. Most authors assert that high dollarization implies the desirability of currency stability because of the risks of exchange rate volatility in the presence of dollarization (cf. Berg and Borensztein, 2000)27, though this begs the question as to whether a currency peg regime actually delivers the hoped-for stability, or whether it transforms a probability distribution with heavy weight on small monthly exchange rate changes to one with a low but non-negligible weight on high monthly exchange rates. Otherwise dollarization reinforces the need for offsetting structural policies. The key needs are to (i) help ensure that the various participants internalize social risk and (ii) help strengthen the infrastructure supporting the importation of loanable funds from abroad. Internalizing social risk is an attempt to move the system closer to incentive compatibility. This could include stricter rules, taxes or risk-weights limiting indirect exposure to foreign exchange risk. Mechanisms for importing funds from abroad could include the use of structured finance or securitized loans sold to foreign lenders. The practicality of all such policies would need to be reviewed, but such a review is beyond the scope of the current paper.
27 Another question addressed by Berg and Borensztein is whether the link between money and prices is stronger if one includes foreign currency deposits: their conclusion is yes.

23
Box 1 Currency substitution and transactions dollarization Even where there are no FX deposits, dollars may circulate freely and be used in transactions. An early literature on this phenomenon of "currency substitution" focused on the question of agents holding non-deposit cash in multiple currency denominations. It examined the impact of increased currency substitution on macroeconomic volatility, and specifically the way in which a shrinking domestic-currency money base (resulting from currency substitution) risked increasing the amplitude of the response of equilibrium exchange rates and inflation to nominal shocks (such as a change in the rate of monetary expansion) (Girton and Roper, 1981; Kareken and Wallace, 1981). As noted by Berg and Borensztein (2000), McKinnon (1996) justifies his recommendation for an international monetary standard and a world monetary authority largely on this volatility of exchange rates under currency substitution. The major technical differences between currency substitution and dollarization are the facts that (i) currency notes and coin are not interest-bearing, with the result that an increased expected rate of depreciation cannot simply be compensated by increased interest payments, and (ii) as liabilities of market institutions, bank deposits affect bank profitability and the credit market. Dollarization of transactions has also been widely observed, though difficult to measure in a systematic way. It can include the posting of the prices of goods and services in FX, even if payment is made in local currency, as well as the actual use of dollars in transactions. Dollarization of transactions is often associated with rapid price pass-through.

24
References: Balino, Tomás J.T., Adam Bennett, Eduardo Borenzstein et al. 1999. Monetary Policy in Dollarized Economies. IMF Occasional Paper 171. Berg, Andrew and Eduardo Borensztein. 2000. "The Choice of Exchange Rate Regime and Monetary Target in Highly Dollarized Economies." Journal of Applied Economics, 3(2): 285-324 Broda, Christian and Eduardo Levy-Yeyati. 2002. "Dollarization and the Lender of Last Resort." in Eduardo Levy-Yeyati and Federico Sturzenegger, ed., Dollarization (Cambridge, Mass: MIT Press). forthcoming Calvo, Guillermo A. 2000a. "Capital Markets and the Exchange Rate: With Special Reference to the Dollarization Debate in Latin America" University of Maryland. mimeo. Calvo, Guillermo A. 2000b. "Notes on Price Stickiness: With Special Reference to Liability Dollarization and Credibility." University of Maryland. mimeo. Calvo, Guillermo A. and Carlos A. Vegh. 1996. "From Currency Substitution to Dollarization and Beyond: Analytical and Policy Issues" in Guillermo A. Calvo, ed., Money, Exchange Rates and Output. Cambridge, MA: MIT Press. Catão, Luis and Marco Terrones. 2000. "Determinants of Dollarization: The Banking Side", IMF Working Paper WP/00/146. Cochrane, John H. 1999. "New Facts in Finance." NBER Working Paper 7169. Fischer, Stanley. 1999. "On the Need for an International Lender of Last Resort", Journal of Economic Perspectives. 13: 85-104. Giovannini Alberto and Bart Turtelboom. 1994. "Currency Substitution." in Frederick van der Ploeg, ed., The Handbook of International Macroeconomics. Oxford: Basil Blackwell. Girton Lance and Don Roper. 1981. "Theory and Implications of Currency Substitution." Journal of Money, Credit and Banking. 13:12-30. Goldfajn, Ilan and Roberto Rigobon. 2000. "Hard Currency and Financial Development" PUC-Rio Discussion Paper 483. Goldfajn, Ilan and Sergio R.C. Werlang. 2000. "The Pass-through from Depreciation to Inflation: A Panel Study." PUC-Rio Discussion Paper 423
González Anaya, José Antonio. 2000. "Exchange Rate Pass-through and Partial Dollarization: Is there a Link?" Stanford University, mimeo.
25
Guidotti, Pablo E. and Carlos A. Rodríguez. 1992. �Dollarization in Latin America. Gresham�s Law in Reverse?,� IMF Staff Papers, 39(3): 518-544.
Hanson, James A. 2001. "Small Countries Bank Offshore." mimeo. Hausmann, Ricardo, 2000. "The Pros and Cons of Dollarization." Conference presentation, Federal Reserve Bank of Dallas, March.
Hausmann, Ricardo, Ugo Panizza and Ernesto Stein. 2000. "Why Do Countries Float the Way They Float?" Inter-American Development Bank, Working Paper 418.
Ize, Alain and Eduardo Levy-Yeyati. 1998. "Dollarization of Financial Intermediation: Causes and Policy Implications", IMF Working Paper WP/98/28. Revised version forthcoming in Journal of International Economics Kareken John and Neil Wallace. 1981. "The Indeterminacy of Equilibrium Interest Rates." Quarterly Journal of Economics 96:207-22. McKinnon, Ronald. 1996. The Rules of the Game: International Money and Exchange Rates. Cambridge, MA: MIT Press. Mishkin, Frederic S. and Miguel A. Savastano. 2001. " Monetary Policy Strategies for Latin America". World Bank Policy Research Working Paper 2685. Powell, Andrew and Federico Sturzenegger. 2000. "Dollarization: The Link between Devaluation and Default Risk." Presented at a Conference at the Federal Reserve Bank of Dallas, March) Schmitt-Grohé, Stephanie and Martín Uribe. 2001. "Stabilization Policy and the Costs of Dollarization." Journal of Money, Credit and Banking. 33(2). Uribe, Martin. 1997. "Hysteresis in a Simple Model of Currency Substitution." Journal of Monetary Economics 40:185-202.

Annex Table A1: Foreign Currency Deposits as a % of M2 1990 1991 1992 1993 1994 1995 1996 1997 1998 1999 2000 Albania 2.1 1.3 23.8 20.4 18.8 18.7 21.9 18.3 16.8 18.2 19.9 Angola 7.3 29.4 42.9 53.0 66.9 67.6 Argentina 33.7 34.9 35.4 40.7 43.8 45.1 45.7 47.3 49.0 52.5 Armenia 40.5 20.4 21.0 33.5 39.5 38.2 Azerbaijan 26.3 22.1 24.6 28.9 32.9 Belarus 40.6 54.3 30.7 27.3 Bolivia 66.2 67.1 69.5 71.1 69.2 67.3 80.3 79.9 80.8 82.7 81.3 Bulgaria 12.0 34.0 25.8 20.5 32.5 27.2 50.5 43.6 39.2 39.1 Cambodia 26.3 36.3 51.4 56.3 63.1 62.5 54.2 60.9 68.0 Comoros 0.1 0.3 0.8 Congo, DR 35.8 29.0 Costa Rica 23.5 30.7 28.3 26.5 26.6 34.5 31.7 34.1 37.5 Croatia 53.8 50.3 57.5 59.6 61.7 66.3 64.0 Czech 8.1 7.0 5.3 6.0 11.4 11.3 11.7 11.6 Dominica 3.0 3.9 3.5 2.5 1.5 Ecuador 3.3 3.6 5.3 6.3 8.7 15.7 18.6 25.1 Egypt 46.1 47.9 32.2 27.7 27.5 27.2 23.4 20.6 19.6 20.8 24.7 El Salvador 3.4 2.9 4.2 3.7 4.5 5.0 6.4 7.5 7.8 Estonia 23.0 3.8 9.9 10.9 10.8 16.0 16.1 14.7 13.7 Georgia 80.1 30.8 14.8 20.8 29.1 35.4 Guinea 6.5 6.9 10.0 9.4 9.6 12.6 12.9 12.8 Guinea-Bissau 41.5 34.7 31.6 30.9 31.1 31.2 38.3 Honduras 1.4 3.0 5.3 6.9 12.8 17.0 25.3 23.4 23.9 Hungary 12.2 16.5 14.3 18.7 20.4 26.6 6.7 5.0 4.4 Jamaica 11.9 12.5 18.7 16.9 19.6 16.3 18.6 Lao PDR 42.0 39.4 36.8 41.4 34.4 42.4 40.4 56.7 67.1 Latvia 27.2 27.5 31.1 Lebanon 65.1 59.9 71.3 75.3 Lithuania 44.2 26.9 26.8 24.8 21.3 24.2 30.4 34.0 Macedonia, FYR 14.8 13.2 19.2 21.5 19.2 Malawi 10.6 8.0 10.3 22.0 12.0 17.9 Mexico 11.1 11.8 9.7 11.1 16.5 17.5 18.0 12.7 11.9 Moldova 10.3 11.0 9.9 9.5 22.6 27.5 24.6 Mongolia 7.5 33.0 19.5 20.5 24.2 29.0 23.8 24.7 Mozambique 11.8 16.7 23.2 25.3 41.3 41.4 34.9 34.9 35.2 Netherlands Antilles 15.3 17.0 16.6 16.3 15.9 17.4 15.9 15.4 14.5 15.6 15.3 Nicaragua 27.3 26.2 33.6 46.1 48.2 57.1 59.2 62.9 64.7 Pakistan 2.6 8.9 11.9 13.9 13.6 18.0 22.8 23.8 9.6 Paraguay 35.0 32.5 27.6 32.7 37.6 44.0 Peru 38.6 55.5 57.8 58.9 58.9 57.1 61.5 53.9 54.1 Philippines 17.4 18.0 21.0 22.6 20.9 21.5 37.3 Poland 31.4 24.7 24.8 28.8 36.4 19.3 12.5 9.9 6.9 4.5 Romania 2.9 3.9 15.3 29.0 22.1 21.8 23.4 28.5 32.6 37.6 40.4 Russia 29.5 28.8 20.0 19.4 17.6 30.4 29.5 26.9 Sao Tome & Principe 38.3 29.6 34.9 37.9 39.2 33.5 Saudi Arabia 22.9 21.5 19.2 21.3 20.2 19.2 17.0 16.5 17.9 16.5 15.6 Slovakia 11.2 12.9 11.3 10.2 10.5 14.7 14.5 15.6 Tajikistan 33.7 16.1 13.5 21.4 25.1 Trinidad & Tobago 6.9 16.1 16.5 18.9 17.9 Turkey 23.2 29.7 33.7 37.9 45.8 46.1 44.8 46.4 42.9 44.7 49.4 Uganda 10.1 11.2 11.7 12.8 13.2 13.0 Ukraine 19.4 31.7 22.6 16.6 13.0 20.8 24.5 22.7 Uruguay 80.1 78.5 76.2 73.3 74.1 76.1 Uzbekistan 20.1 5.1 22.5 15.5 8.0 6.9 4.2 Venezuela 0.1 3.4 2.2 2.3 2.2 Viet Nam 25.9 20.9 20.4 19.7 19.3 22.0 25.3 26.6 Yemen 10.8 12.1 19.7 20.7 20.9 Zambia 8.4 17.0 23.1 23.8 36.0
27
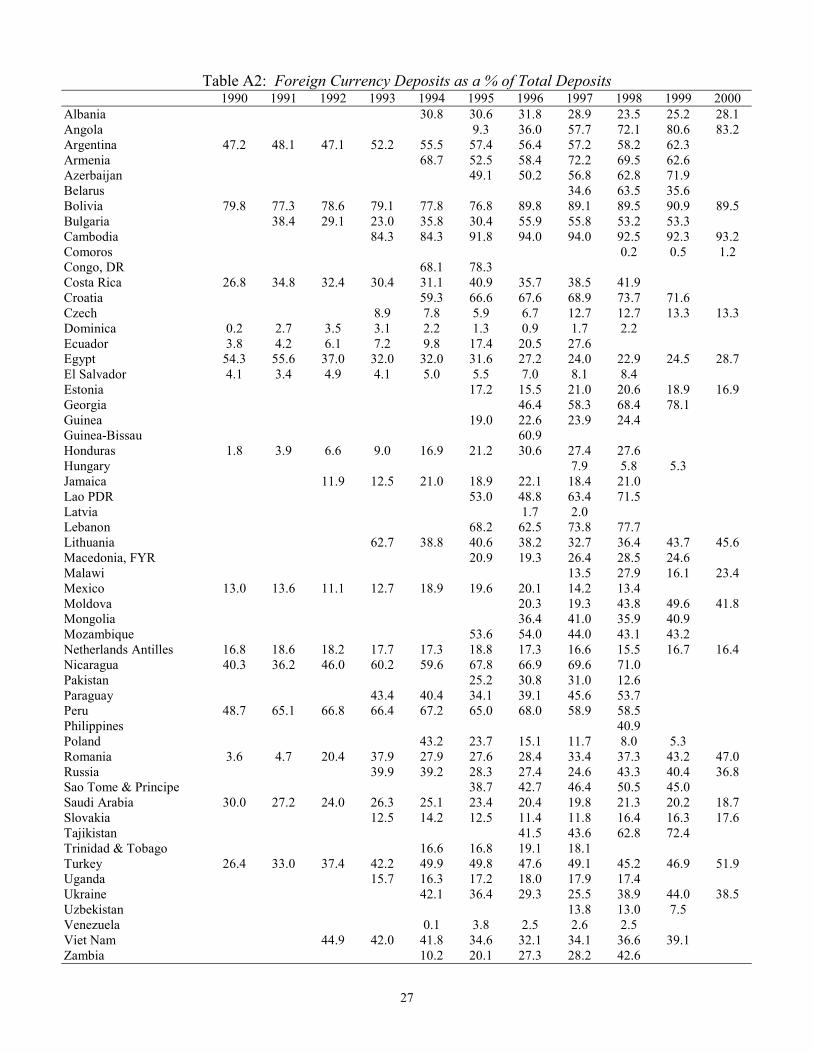
Table A2: Foreign Currency Deposits as a % of Total Deposits 1990 1991 1992 1993 1994 1995 1996 1997 1998 1999 2000 Albania 30.8 30.6 31.8 28.9 23.5 25.2 28.1 Angola 9.3 36.0 57.7 72.1 80.6 83.2 Argentina 47.2 48.1 47.1 52.2 55.5 57.4 56.4 57.2 58.2 62.3 Armenia 68.7 52.5 58.4 72.2 69.5 62.6 Azerbaijan 49.1 50.2 56.8 62.8 71.9 Belarus 34.6 63.5 35.6 Bolivia 79.8 77.3 78.6 79.1 77.8 76.8 89.8 89.1 89.5 90.9 89.5 Bulgaria 38.4 29.1 23.0 35.8 30.4 55.9 55.8 53.2 53.3 Cambodia 84.3 84.3 91.8 94.0 94.0 92.5 92.3 93.2 Comoros 0.2 0.5 1.2 Congo, DR 68.1 78.3 Costa Rica 26.8 34.8 32.4 30.4 31.1 40.9 35.7 38.5 41.9 Croatia 59.3 66.6 67.6 68.9 73.7 71.6 Czech 8.9 7.8 5.9 6.7 12.7 12.7 13.3 13.3 Dominica 0.2 2.7 3.5 3.1 2.2 1.3 0.9 1.7 2.2 Ecuador 3.8 4.2 6.1 7.2 9.8 17.4 20.5 27.6 Egypt 54.3 55.6 37.0 32.0 32.0 31.6 27.2 24.0 22.9 24.5 28.7 El Salvador 4.1 3.4 4.9 4.1 5.0 5.5 7.0 8.1 8.4 Estonia 17.2 15.5 21.0 20.6 18.9 16.9 Georgia 46.4 58.3 68.4 78.1 Guinea 19.0 22.6 23.9 24.4 Guinea-Bissau 60.9 Honduras 1.8 3.9 6.6 9.0 16.9 21.2 30.6 27.4 27.6 Hungary 7.9 5.8 5.3 Jamaica 11.9 12.5 21.0 18.9 22.1 18.4 21.0 Lao PDR 53.0 48.8 63.4 71.5 Latvia 1.7 2.0 Lebanon 68.2 62.5 73.8 77.7 Lithuania 62.7 38.8 40.6 38.2 32.7 36.4 43.7 45.6 Macedonia, FYR 20.9 19.3 26.4 28.5 24.6 Malawi 13.5 27.9 16.1 23.4 Mexico 13.0 13.6 11.1 12.7 18.9 19.6 20.1 14.2 13.4 Moldova 20.3 19.3 43.8 49.6 41.8 Mongolia 36.4 41.0 35.9 40.9 Mozambique 53.6 54.0 44.0 43.1 43.2 Netherlands Antilles 16.8 18.6 18.2 17.7 17.3 18.8 17.3 16.6 15.5 16.7 16.4 Nicaragua 40.3 36.2 46.0 60.2 59.6 67.8 66.9 69.6 71.0 Pakistan 25.2 30.8 31.0 12.6 Paraguay 43.4 40.4 34.1 39.1 45.6 53.7 Peru 48.7 65.1 66.8 66.4 67.2 65.0 68.0 58.9 58.5 Philippines 40.9 Poland 43.2 23.7 15.1 11.7 8.0 5.3 Romania 3.6 4.7 20.4 37.9 27.9 27.6 28.4 33.4 37.3 43.2 47.0 Russia 39.9 39.2 28.3 27.4 24.6 43.3 40.4 36.8 Sao Tome & Principe 38.7 42.7 46.4 50.5 45.0 Saudi Arabia 30.0 27.2 24.0 26.3 25.1 23.4 20.4 19.8 21.3 20.2 18.7 Slovakia 12.5 14.2 12.5 11.4 11.8 16.4 16.3 17.6 Tajikistan 41.5 43.6 62.8 72.4 Trinidad & Tobago 16.6 16.8 19.1 18.1 Turkey 26.4 33.0 37.4 42.2 49.9 49.8 47.6 49.1 45.2 46.9 51.9 Uganda 15.7 16.3 17.2 18.0 17.9 17.4 Ukraine 42.1 36.4 29.3 25.5 38.9 44.0 38.5 Uzbekistan 13.8 13.0 7.5 Venezuela 0.1 3.8 2.5 2.6 2.5 Viet Nam 44.9 42.0 41.8 34.6 32.1 34.1 36.6 39.1 Zambia 10.2 20.1 27.3 28.2 42.6