Embed Size (px)
Citation preview
Bloomberg: VNDS
DAILY MARKET RECAP 04 September, 2019
IN ALLIANCE WITH
Market commentary: The VN-INDEX dipped below the 980-pt level as large caps faced strong selling
Vietnam’s stock market extended losses on Wednesday, with the VN-INDEX and HNX-INDEX declining by 0.2% and 0.5%, respectively. The U.S. stock market plummeted last night with the Dow Jones Industrial Average Index falling 1.1%, after the world’s two largest economies began imposing new tariffs on each other’s goods and weak manufacturing data dented investor sentiment. On Wednesday the VN-INDEX kicked off cautiously and quickly dipped below the reference price level. Later, the index further dropped to its intraday low of 973.4pts (-0.6%), but it made a partial recovery in the late trading session thanks to gains by several blue chips. SAB was Wednesday’s largest laggard and lost VND8,900 (-3.3%), alone wiping 1.6pts off the index. Other Food & Beverage large caps suffered losses, including VNM (-0.2%) and BHN (-0.5%). Some market pillars from Real Estate and Banking sectors also slumped, including VIC (-0.5%), VCB (-0.6%), VPB (-2.5%) and VRE (-0.7%). But several blue chips ended up, helping prevent the VN-INDEX from a deeper fall. Among them, VHM increased 1.6% to become the day’s largest supporter, followed by MSN (+1.4%) and GAS (+0.6%). At the end of the trading session, the VN-INDEX closed at 977.6pts (-0.2%) and the HNX-INDEX also dropped down to 100.9pts (-0.5%).
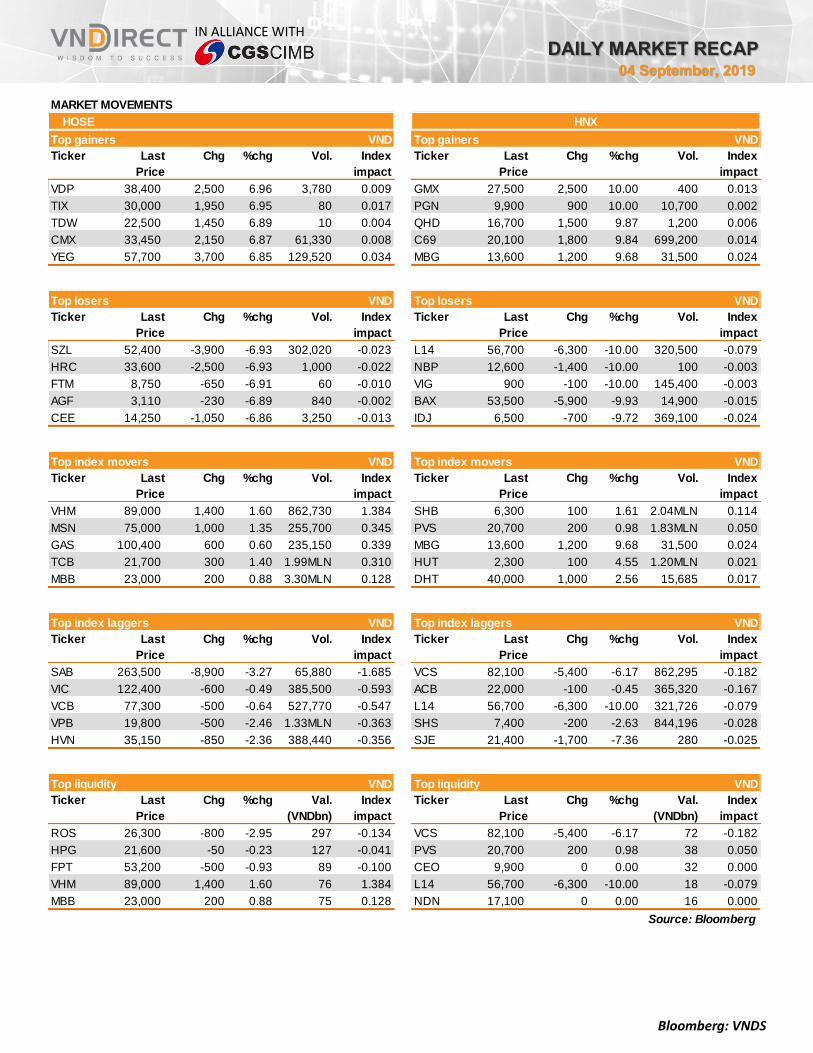
Healthcare (+0.9%), Utilities (+0.5%) and Real Estate (+0.3%) rose while Industrials (-0.9%), IT (-0.9%) and Consumer Staples (-0.8%) dropped. Top index movers included VHM (+1.6%), MSN (+1.4%), GAS (+0.6%), TCB (+1.4%) and MBB (+0.9%). Top index laggards consisted of SAB (-3.3%), VIC (-0.5%), VCB (-0.6%), VPB (-2.5%) and HVN (-2.4%). Top 3 major put-through transactions were VHM with 6.0m shares (VND523.8bn), VPB with 9.3m shares (VND188.9bn) and PVI with 3.7m shares (VND112.8bn).
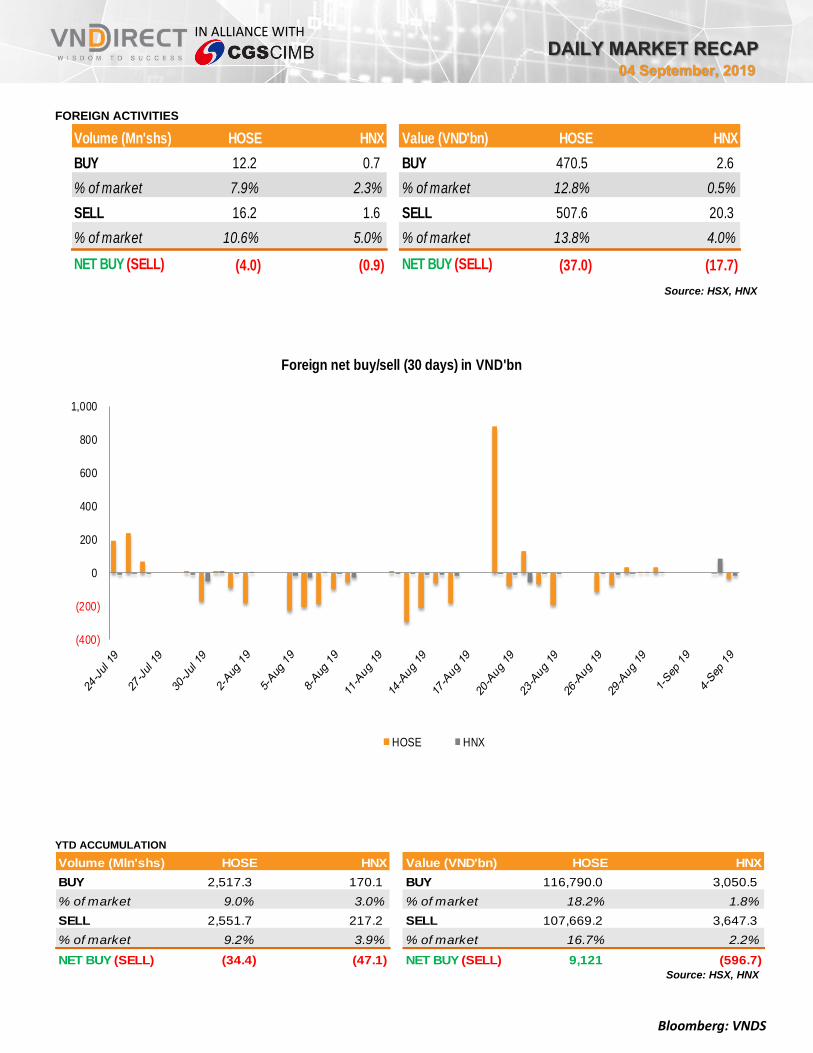
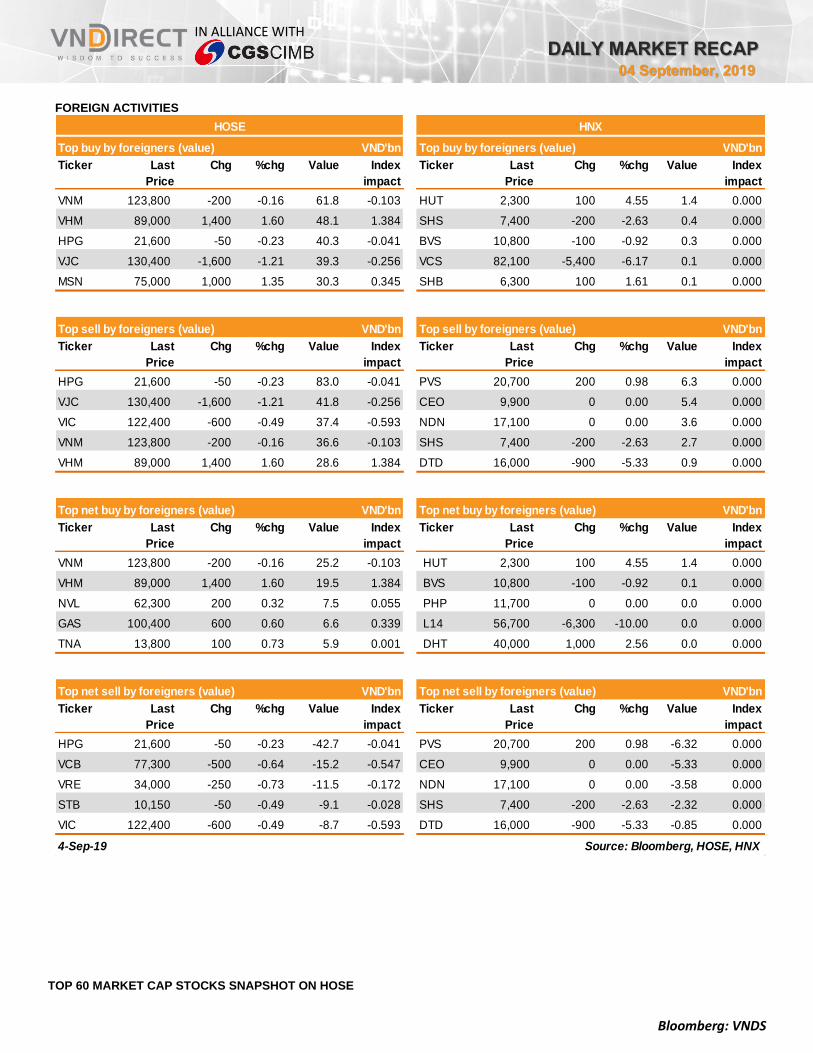
Foreigners net sold on HOSE to the amount of VND37.0bn, and also net sold on HNX to the amount of VND17.7bn. They mainly bought VNM (VN61.8bn), VHM (VND48.1bn) and HPG (VND40.3bn); and mainly sold HPG (VND83.0bn), VJC (VND41.8bn) and VIC (VND37.4bn).
Snapshot HOSE HNX
Close (pts) 977.6 100.9
1 Day change (%) -0.18 -0.45
Volume (mn shs) 157.4 32.7
Value (US$mn) 163.9 22.2
Gainers 124 47
Losers 172 88
Unchanged 83 228
Commodities & Currencies Close %chg
Gold(USD/Oz) 1,540 -0.7
WTI Oil ($/B) 1Mth 54 0.8
Brent Oil ($/B) 1Mth 59 0.5
USDVND 23,198 0.0
EURVND 25,446 -0.2
Source: Bloomberg
973.2
974.8
976.4
978.0
979.6
VN-INDEX
100.3
100.7
101.1
101.5
HNX-INDEX
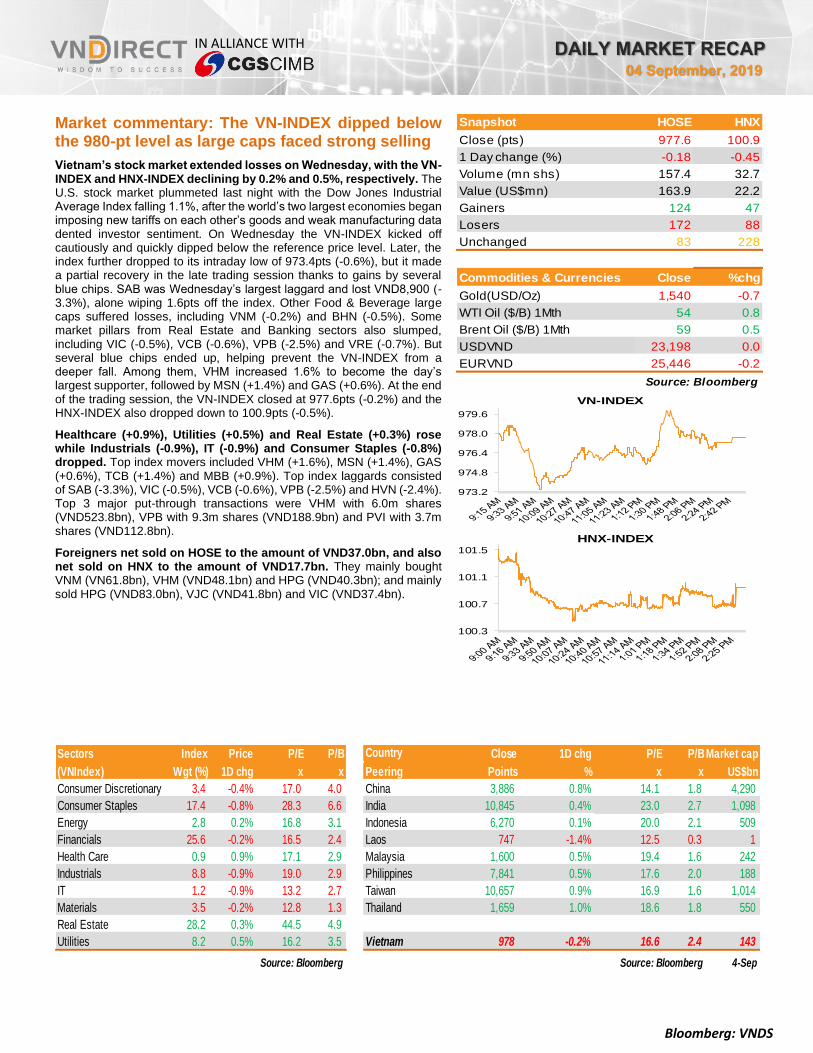
Sectors Index Price P/E P/B Country Close 1D chg P/E P/BMarket cap
(VNIndex) Wgt (%) 1D chg x x Peering Points % x x US$bn
Consumer Discretionary 3.4 -0.4% 17.0 4.0 China 3,886 0.8% 14.1 1.8 4,290
Consumer Staples 17.4 -0.8% 28.3 6.6 India 10,845 0.4% 23.0 2.7 1,098
Energy 2.8 0.2% 16.8 3.1 Indonesia 6,270 0.1% 20.0 2.1 509
Financials 25.6 -0.2% 16.5 2.4 Laos 747 -1.4% 12.5 0.3 1
Health Care 0.9 0.9% 17.1 2.9 Malaysia 1,600 0.5% 19.4 1.6 242
Industrials 8.8 -0.9% 19.0 2.9 Philippines 7,841 0.5% 17.6 2.0 188
IT 1.2 -0.9% 13.2 2.7 Taiwan 10,657 0.9% 16.9 1.6 1,014
Materials 3.5 -0.2% 12.8 1.3 Thailand 1,659 1.0% 18.6 1.8 550
Real Estate 28.2 0.3% 44.5 4.9
Utilities 8.2 0.5% 16.2 3.5 Vietnam 978 -0.2% 16.6 2.4 143
4-SepSource: Bloomberg Source: Bloomberg
Bloomberg: VNDS
DAILY MARKET RECAP 04 September, 2019
IN ALLIANCE WITH
Market News
Oil holds loss after Trump tweet adds to trade war pessimism. Oil held losses after a surprise
contraction in American manufacturing and a warning from President Donald Trump highlighted the
impact and intractability of the U.S.-China trade war. Futures in New York edged higher after closing
2.1% lower on Tuesday. A key U.S. factory gauge fell below 50 for the first time since 2016, adding
to concern the world’s largest economy may be headed for a recession. Trump tweeted that China
will have a much tougher time securing a trade deal if the Asian nation waits until he wins the 2020
U.S. presidential election. (Bloomberg)
Vietnamese central bank’s anti-dollarization on right track. Vietnam’s anti-dollarization policies
have taken effect with the level of dollarization in the economy continuing to decline sharply in recent
years. According to experts, the assessment of the dollarization level of an economy can be based
on the ratio of foreign currency deposits to total deposits; and the ratio of foreign currency credit to
total credit. Meanwhile, according to financial statements of local banks, their ratio of foreign currency
deposits to total deposits continued to drop sharply in 1H19. Total foreign currency deposits of the
three large state-owned commercial banks with a strength of foreign currency trading - Vietcombank,
Vietinbank and BIDV – slid by US$500m in 1H19. Specifically, at Vietcombank, its foreign currency
deposits decreased by VND7.36tr (US$316m) in 1H19 to VND135.932tr (US$5.83bn). While
Vietcombank’s total deposits increased 8.6% to VND870.86tr (US$37.37b), the bank’s ratio of foreign
currency deposits to total deposits fell from 17.9% at the end of 2018 to 15.6% at the end of 1H19.
Similarly, foreign currency deposits at Vietinbank in 1H19 also dropped by VND1.74tr (US$74.85m)
to VND54.211tr (US$2.33b), dragging the ratio of foreign currency deposits to total deposits to 6.4%,
from 6.8% at the end of last year. Foreign currency deposits of BIDV also slid by VND2.493tr
(US$107m) to VND47.847tr (US$2.05bn), prompting the ratio of foreign currency deposits to total
deposits to decline to 4.5%, from 5.1% at the end of 2018. Experts attributed the success in the fight
against the dollarization in the economy to the central bank’s effective policies, including the zero-
percent dollar deposit interest rate and the foreign exchange stability. Currently, instead of holding
the U.S. dollar as previously, local people prefer to hold VND and deposit it at banks as they can get
higher profits due to a large spread between interest rates of VND and dollar deposits and the
VND/USD foreign exchange rate stability. Interest rates of VND deposits are listed at some nearly
9% per year while the rate for dollar deposits is zero percent. VND is also relatively stable, declining
by only some 0.5% points by the end of June and is forecast to be kept stable in the remaining
months of the year. To take more steps to further minimizing dollarization in the economy, the central
bank has also required commercial banks to stop the provision of mid- and long-term foreign currency
loans for offshore payments of imported goods and services from Sep 30 this year. According to
experts, the gradual narrowing of demand for foreign currency loans by the SBV is necessary and
consistent with the government's anti-dollarization roadmap. Ending foreign currency lending will
minimize distortion in the foreign exchange market when a series of free trade agreements are
implemented. Banking expert Phan Minh Ngoc said dollar lending makes dollarization of the
economy more serious. As more local people use the dollar in daily transactions, the effect of the
central bank’s policies would be reduced. When inflation is high, the central bank wants to increase
interest rates to control it. However, due to dollarization, local people will turn to loans in dollars rather
than in VND, which will mean the central bank’s interest rate hike will have little effect. This has been
seen in some countries with hyper-inflation, where the dollar replaces the local currency while the
countries’ central banks are unable to do anything. (Vietnamnet.vn)
Jan-Aug Industrial production rises 9.5% yoy. The country’s index of industrial production (IIP)
saw a year-on-year increase of 9.5% in the first eight months of 2019, a report from the General
Statistics Office (GSO) shows. GSO statisticians said the nation’s IIP ensured a stable growth since
the beginning of this year. According to the report, the processing and manufacturing sector recorded
the largest IIP rise at 10.6%. It was followed by electricity production and distribution with IIP growth
of 10.2% while supply and waste treatment sector and mining rose by 7.4% and 2.5%, respectively.
Sectors posting a high industrial growth rate were coke and refined petroleum products at 41%; metal
production at 40%; metal ore mining at 19%; rubber and plastic production at 15% in addition to
furniture at 12% and weaving at 11%. From January to August, a strong IIP rise was also seen in
some major industrial products such as crude iron and steel (57%); petroleum (43%); television
Bloomberg: VNDS
DAILY MARKET RECAP 04 September, 2019
IN ALLIANCE WITH
(23%); liquefied petroleum gas (14%) and handsets (11%), as per the report. The production of
electronics, computers and optical products increased a modest 4% compared with 17% recorded
during the same period of 2018, apart from the manufacturing of means of transport which saw a
yearly IIP decline of 5%. As of Aug 1, the number of workers in industrial enterprises rose 1.7%
month on month and 1.5% yoy. Jobs in the state sector declined 1.9% while those at domestic private
companies and foreign-invested firms edged up 0.5% and 2.5%, respectively. In the eight-month
period, the southern economic hub of HCM City also witnessed a year-on-year growth of 7.1% in
industrial production, according to the municipal Department of Industry and Trade. However, the IIP
of the city’s four key sectors - food processing, chemical-rubber-plastics, mechanics and electronics
- saw an increase of 5.5%, nearly one percentage point lower than the average rate of the whole
industry sector. Of the four key sectors, the electronics sector saw the highest growth rate of 24%.
The mechanical sector was up 9.4%, while the chemical-rubber-plastics rose by 0.7% and the food
processing sector hiked by 0.4%. Nguyen Phuong Dong, deputy director of the department said the
inventory index of the city’s processing and manufacturing in Aug rose remarkably by 53% yoy. From
now to the year-end, the department planned to organise fairs to help enterprises promote
consumption of their products. Its officials would regularly meet with industry executives to address
their difficulties in a timely manner. (Vietnamnews.vn)
Coverage Universe Update
Vietnam International Commercial JSB (VIB VN-UPCOM) – Initiation report – ADD (+23.2%)
A small-scale retail bank, VIB has grown aggressively in the last two years, driven by both
interest income and fee income.
Rising retail lending exposure bolstered earnings growth. Having identified its strategic focus on
retail banking, Vietnam International Commercial JSB (VIB) has actively expanded its individual loan
book at a CAGR of 47.0% in FY15-18. Accordingly, net interest margin (NIM) improved by 80bp in
the same period. Focusing on mortgages and auto loans, VIB is the top player in auto loans, with
23% market share by end2018. In addition, leveraging on retail lending expansion, the bank was able
to cross-sell fee-based products, resulting in a robust fee income CAGR of 64.2% in FY15-18.
VIB is active in product innovation and technology development. In recent years, VIB has
actively launched products tailored to specific customer groups to attract new clients and increase
usage. Currently, two drivers for fee income growth are payment fees and income from distributing
Prudential’s life insurance products. The bank also focuses on technology development with the
launch of MyVIB app and the renovation of its website interface to increase usability and widen its
reach amid a small physical network. With increasing digitalisation, cost-to-income ratio (CIR)
plunged from 61.5% in FY16 to 41.6% in 1H19.
Mobilisation and asset quality need improvement. VIB has low funding costs as it relies heavily
on interbank funds. But the reliance means a higher sensitivity to interest rate fluctuation and the
system’s liquidity. Regarding asset quality, by end-2Q19 VIB’s non-performing loan (NPL) ratio
(2.4%) was above the sector-wide NPL (1.9%) and its loan-loss-reserves (LLR) of 42.3% was the
lowest among the listed banks.
We project a net profit CAGR of 21.0% in FY19-21F, based on 23.5% loan CAGR thanks to VIB’s
strong capital buffer, a slight NIM hike (+12bp) from retail lending expansion and 22.0% non-interest
income CAGR, driven by payment services, card fees and bancassurance.
We have an ADD rating on VIB with a target price of VND21,200. VIB is trading at 15.1% discount
to the industry average in term of FY19F P/BV although its ROE is among the highest (25.0% in
1H19). Low valuation could be due to its low liquidity, riskier asset quality and smaller network
Bloomberg: VNDS
DAILY MARKET RECAP 04 September, 2019
IN ALLIANCE WITH
compared to other retail banks. Given its strong profit growth outlook, we view that VIB is slightly
undervalued, thus we have an Add rating for VIB.
Read the full report: HERE
Notable Corporate Events
Vietnam Dairy Products Joint Stock Company (VNM VN) – dividend payment: VNM has
announced that Sep 16 and Sep 17 will be the ex-date and the record date, respectively, for paying
the 2019 first cash dividend of VND2,000/share. The payment will be made on Sep 26. (Ndh.vn)
Military Commercial Joint Stock Bank (MBB VN) – dividend payment: Sep 18 and Sep 19 will
be the ex-date and the record date, respectively, for paying the 2018 second stock dividend at a rate
of 8%, the bank said. (Cafef.vn)
<to be continued>
Bloomberg: VNDS
DAILY MARKET RECAP 04 September, 2019
IN ALLIANCE WITH
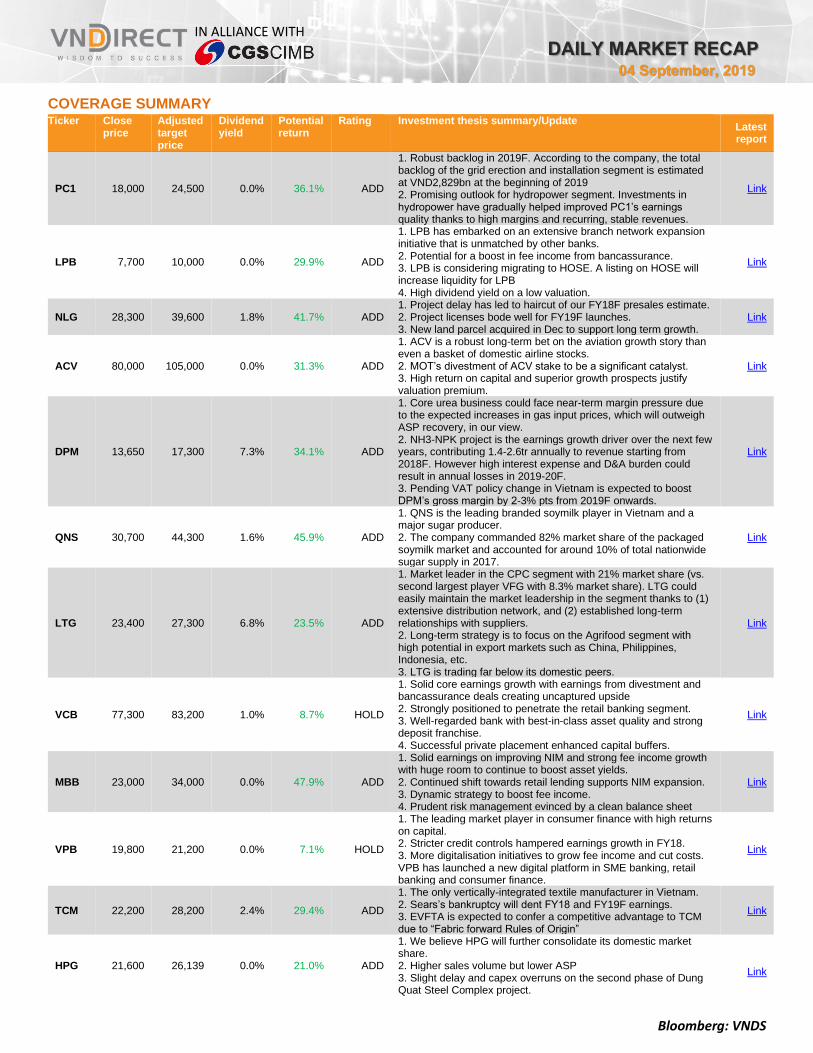
COVERAGE SUMMARY Ticker Close
price Adjusted target price
Dividend yield
Potential return
Rating Investment thesis summary/Update Latest report
PC1 18,000 24,500 0.0% 36.1% ADD
1. Robust backlog in 2019F. According to the company, the total backlog of the grid erection and installation segment is estimated at VND2,829bn at the beginning of 2019 2. Promising outlook for hydropower segment. Investments in hydropower have gradually helped improved PC1’s earnings quality thanks to high margins and recurring, stable revenues.
Link
LPB 7,700 10,000 0.0% 29.9% ADD
1. LPB has embarked on an extensive branch network expansion initiative that is unmatched by other banks. 2. Potential for a boost in fee income from bancassurance. 3. LPB is considering migrating to HOSE. A listing on HOSE will increase liquidity for LPB 4. High dividend yield on a low valuation.
Link
NLG 28,300 39,600 1.8% 41.7% ADD 1. Project delay has led to haircut of our FY18F presales estimate. 2. Project licenses bode well for FY19F launches. 3. New land parcel acquired in Dec to support long term growth.
Link
ACV 80,000 105,000 0.0% 31.3% ADD
1. ACV is a robust long-term bet on the aviation growth story than even a basket of domestic airline stocks. 2. MOT’s divestment of ACV stake to be a significant catalyst. 3. High return on capital and superior growth prospects justify valuation premium.
Link
DPM 13,650 17,300 7.3% 34.1% ADD
1. Core urea business could face near-term margin pressure due to the expected increases in gas input prices, which will outweigh ASP recovery, in our view. 2. NH3-NPK project is the earnings growth driver over the next few years, contributing 1.4-2.6tr annually to revenue starting from 2018F. However high interest expense and D&A burden could result in annual losses in 2019-20F. 3. Pending VAT policy change in Vietnam is expected to boost DPM’s gross margin by 2-3% pts from 2019F onwards.
Link
QNS 30,700 44,300 1.6% 45.9% ADD
1. QNS is the leading branded soymilk player in Vietnam and a major sugar producer. 2. The company commanded 82% market share of the packaged soymilk market and accounted for around 10% of total nationwide sugar supply in 2017.
Link
LTG 23,400 27,300 6.8% 23.5% ADD
1. Market leader in the CPC segment with 21% market share (vs. second largest player VFG with 8.3% market share). LTG could easily maintain the market leadership in the segment thanks to (1) extensive distribution network, and (2) established long-term relationships with suppliers. 2. Long-term strategy is to focus on the Agrifood segment with high potential in export markets such as China, Philippines, Indonesia, etc. 3. LTG is trading far below its domestic peers.
Link
VCB 77,300 83,200 1.0% 8.7% HOLD
1. Solid core earnings growth with earnings from divestment and bancassurance deals creating uncaptured upside 2. Strongly positioned to penetrate the retail banking segment. 3. Well-regarded bank with best-in-class asset quality and strong deposit franchise. 4. Successful private placement enhanced capital buffers.
Link
MBB 23,000 34,000 0.0% 47.9% ADD
1. Solid earnings on improving NIM and strong fee income growth with huge room to continue to boost asset yields. 2. Continued shift towards retail lending supports NIM expansion. 3. Dynamic strategy to boost fee income. 4. Prudent risk management evinced by a clean balance sheet
Link
VPB 19,800 21,200 0.0% 7.1% HOLD
1. The leading market player in consumer finance with high returns on capital. 2. Stricter credit controls hampered earnings growth in FY18. 3. More digitalisation initiatives to grow fee income and cut costs. VPB has launched a new digital platform in SME banking, retail banking and consumer finance.
Link
TCM 22,200 28,200 2.4% 29.4% ADD
1. The only vertically-integrated textile manufacturer in Vietnam. 2. Sears’s bankruptcy will dent FY18 and FY19F earnings. 3. EVFTA is expected to confer a competitive advantage to TCM due to “Fabric forward Rules of Origin”
Link
HPG 21,600 26,139 0.0% 21.0% ADD
1. We believe HPG will further consolidate its domestic market share. 2. Higher sales volume but lower ASP 3. Slight delay and capex overruns on the second phase of Dung Quat Steel Complex project.
Link
Bloomberg: VNDS
DAILY MARKET RECAP 04 September, 2019
IN ALLIANCE WITH
Ticker Close price
Adjusted target price
Dividend yield
Potential return
Rating Investment thesis summary/Update Latest report
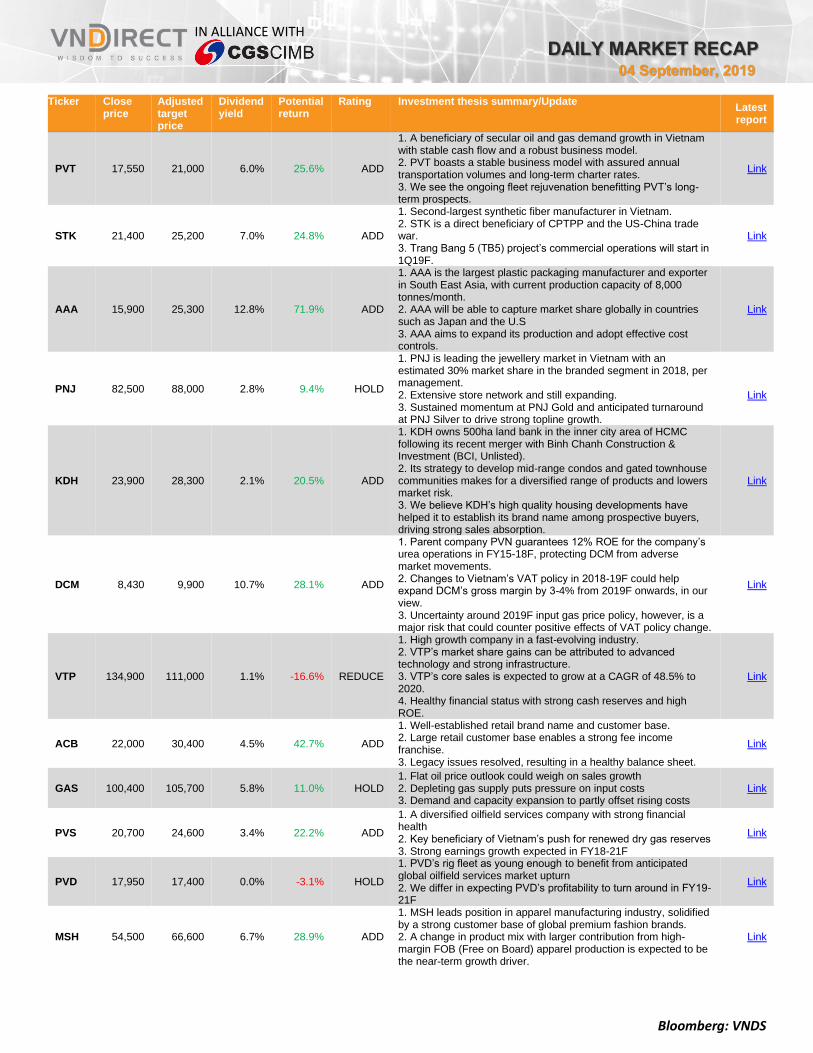
PVT 17,550 21,000 6.0% 25.6% ADD
1. A beneficiary of secular oil and gas demand growth in Vietnam with stable cash flow and a robust business model. 2. PVT boasts a stable business model with assured annual transportation volumes and long-term charter rates. 3. We see the ongoing fleet rejuvenation benefitting PVT’s long-term prospects.
Link
STK 21,400 25,200 7.0% 24.8% ADD
1. Second-largest synthetic fiber manufacturer in Vietnam. 2. STK is a direct beneficiary of CPTPP and the US-China trade war. 3. Trang Bang 5 (TB5) project’s commercial operations will start in 1Q19F.
Link
AAA 15,900 25,300 12.8% 71.9% ADD
1. AAA is the largest plastic packaging manufacturer and exporter in South East Asia, with current production capacity of 8,000 tonnes/month. 2. AAA will be able to capture market share globally in countries such as Japan and the U.S 3. AAA aims to expand its production and adopt effective cost controls.
Link
PNJ 82,500 88,000 2.8% 9.4% HOLD
1. PNJ is leading the jewellery market in Vietnam with an estimated 30% market share in the branded segment in 2018, per management. 2. Extensive store network and still expanding. 3. Sustained momentum at PNJ Gold and anticipated turnaround at PNJ Silver to drive strong topline growth.
Link
KDH 23,900 28,300 2.1% 20.5% ADD
1. KDH owns 500ha land bank in the inner city area of HCMC following its recent merger with Binh Chanh Construction & Investment (BCI, Unlisted). 2. Its strategy to develop mid-range condos and gated townhouse communities makes for a diversified range of products and lowers market risk. 3. We believe KDH’s high quality housing developments have helped it to establish its brand name among prospective buyers, driving strong sales absorption.
Link
DCM 8,430 9,900 10.7% 28.1% ADD
1. Parent company PVN guarantees 12% ROE for the company’s urea operations in FY15-18F, protecting DCM from adverse market movements. 2. Changes to Vietnam’s VAT policy in 2018-19F could help expand DCM’s gross margin by 3-4% from 2019F onwards, in our view. 3. Uncertainty around 2019F input gas price policy, however, is a major risk that could counter positive effects of VAT policy change.
Link
VTP 134,900 111,000 1.1% -16.6% REDUCE
1. High growth company in a fast-evolving industry. 2. VTP’s market share gains can be attributed to advanced technology and strong infrastructure. 3. VTP’s core sales is expected to grow at a CAGR of 48.5% to 2020. 4. Healthy financial status with strong cash reserves and high ROE.
Link
ACB 22,000 30,400 4.5% 42.7% ADD
1. Well-established retail brand name and customer base. 2. Large retail customer base enables a strong fee income franchise. 3. Legacy issues resolved, resulting in a healthy balance sheet.
Link
GAS 100,400 105,700 5.8% 11.0% HOLD 1. Flat oil price outlook could weigh on sales growth 2. Depleting gas supply puts pressure on input costs 3. Demand and capacity expansion to partly offset rising costs
Link
PVS 20,700 24,600 3.4% 22.2% ADD
1. A diversified oilfield services company with strong financial health 2. Key beneficiary of Vietnam’s push for renewed dry gas reserves 3. Strong earnings growth expected in FY18-21F
Link
PVD 17,950 17,400 0.0% -3.1% HOLD
1. PVD’s rig fleet as young enough to benefit from anticipated global oilfield services market upturn 2. We differ in expecting PVD’s profitability to turn around in FY19-21F
Link
MSH 54,500 66,600 6.7% 28.9% ADD
1. MSH leads position in apparel manufacturing industry, solidified by a strong customer base of global premium fashion brands. 2. A change in product mix with larger contribution from high-margin FOB (Free on Board) apparel production is expected to be the near-term growth driver.
Link
Bloomberg: VNDS
DAILY MARKET RECAP 04 September, 2019
IN ALLIANCE WITH
Ticker Close price
Adjusted target price
Dividend yield
Potential return
Rating Investment thesis summary/Update Latest report
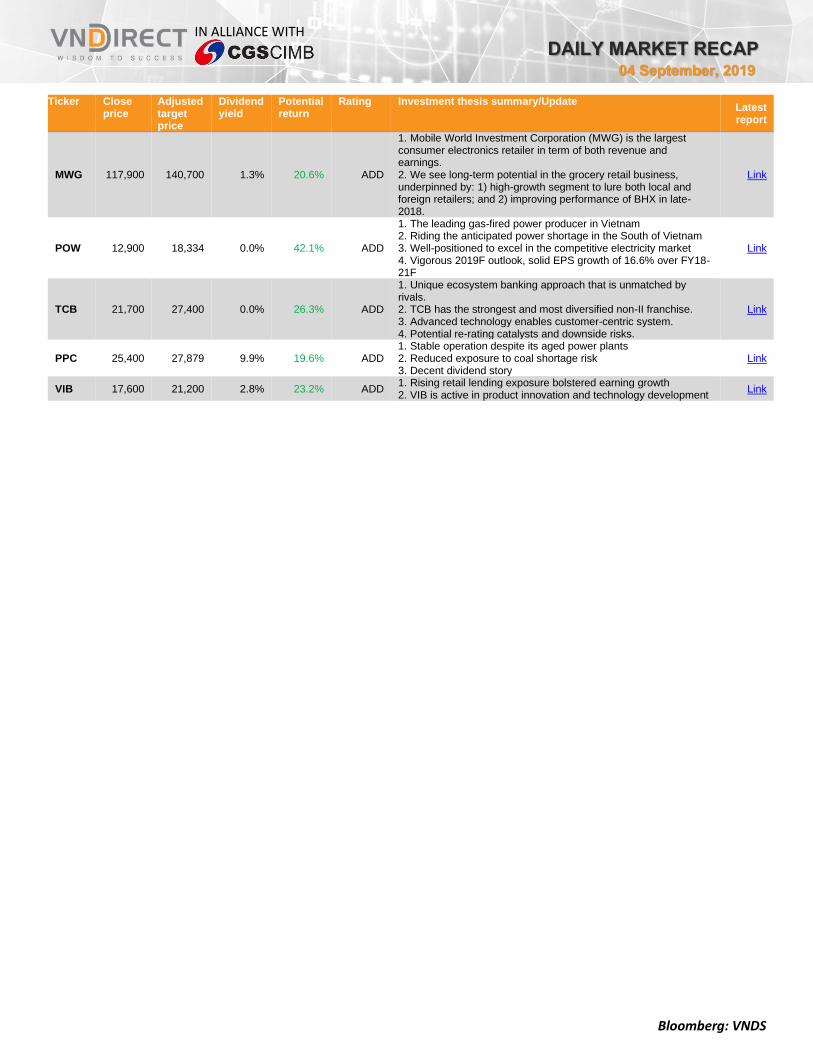
MWG 117,900 140,700 1.3% 20.6% ADD
1. Mobile World Investment Corporation (MWG) is the largest consumer electronics retailer in term of both revenue and earnings. 2. We see long-term potential in the grocery retail business, underpinned by: 1) high-growth segment to lure both local and foreign retailers; and 2) improving performance of BHX in late-2018.
Link
POW 12,900 18,334 0.0% 42.1% ADD
1. The leading gas-fired power producer in Vietnam 2. Riding the anticipated power shortage in the South of Vietnam 3. Well-positioned to excel in the competitive electricity market 4. Vigorous 2019F outlook, solid EPS growth of 16.6% over FY18-21F
Link
TCB 21,700 27,400 0.0% 26.3% ADD
1. Unique ecosystem banking approach that is unmatched by rivals. 2. TCB has the strongest and most diversified non-II franchise. 3. Advanced technology enables customer-centric system. 4. Potential re-rating catalysts and downside risks.
Link
PPC 25,400 27,879 9.9% 19.6% ADD 1. Stable operation despite its aged power plants 2. Reduced exposure to coal shortage risk 3. Decent dividend story
Link
VIB 17,600 21,200 2.8% 23.2% ADD 1. Rising retail lending exposure bolstered earning growth 2. VIB is active in product innovation and technology development
Link
Bloomberg: VNDS
DAILY MARKET RECAP 04 September, 2019
IN ALLIANCE WITH
MARKET MOVEMENTS
HOSE
Top gainers VND Top gainers VND
Ticker Last
Price
Chg %chg Vol. Index
impact
Ticker Last
Price
Chg %chg Vol. Index
impact
VDP 38,400 2,500 6.96 3,780 0.009 GMX 27,500 2,500 10.00 400 0.013
TIX 30,000 1,950 6.95 80 0.017 PGN 9,900 900 10.00 10,700 0.002
TDW 22,500 1,450 6.89 10 0.004 QHD 16,700 1,500 9.87 1,200 0.006
CMX 33,450 2,150 6.87 61,330 0.008 C69 20,100 1,800 9.84 699,200 0.014
YEG 57,700 3,700 6.85 129,520 0.034 MBG 13,600 1,200 9.68 31,500 0.024
Top losers VND Top losers VND
Ticker Last
Price
Chg %chg Vol. Index
impact
Ticker Last
Price
Chg %chg Vol. Index
impact
SZL 52,400 -3,900 -6.93 302,020 -0.023 L14 56,700 -6,300 -10.00 320,500 -0.079
HRC 33,600 -2,500 -6.93 1,000 -0.022 NBP 12,600 -1,400 -10.00 100 -0.003
FTM 8,750 -650 -6.91 60 -0.010 VIG 900 -100 -10.00 145,400 -0.003
AGF 3,110 -230 -6.89 840 -0.002 BAX 53,500 -5,900 -9.93 14,900 -0.015
CEE 14,250 -1,050 -6.86 3,250 -0.013 IDJ 6,500 -700 -9.72 369,100 -0.024
Top index movers VND Top index movers VND
Ticker Last
Price
Chg %chg Vol. Index
impact
Ticker Last
Price
Chg %chg Vol. Index
impact
VHM 89,000 1,400 1.60 862,730 1.384 SHB 6,300 100 1.61 2.04MLN 0.114
MSN 75,000 1,000 1.35 255,700 0.345 PVS 20,700 200 0.98 1.83MLN 0.050
GAS 100,400 600 0.60 235,150 0.339 MBG 13,600 1,200 9.68 31,500 0.024
TCB 21,700 300 1.40 1.99MLN 0.310 HUT 2,300 100 4.55 1.20MLN 0.021
MBB 23,000 200 0.88 3.30MLN 0.128 DHT 40,000 1,000 2.56 15,685 0.017
Top index laggers VND Top index laggers VND
Ticker Last
Price
Chg %chg Vol. Index
impact
Ticker Last
Price
Chg %chg Vol. Index
impact
SAB 263,500 -8,900 -3.27 65,880 -1.685 VCS 82,100 -5,400 -6.17 862,295 -0.182
VIC 122,400 -600 -0.49 385,500 -0.593 ACB 22,000 -100 -0.45 365,320 -0.167
VCB 77,300 -500 -0.64 527,770 -0.547 L14 56,700 -6,300 -10.00 321,726 -0.079
VPB 19,800 -500 -2.46 1.33MLN -0.363 SHS 7,400 -200 -2.63 844,196 -0.028
HVN 35,150 -850 -2.36 388,440 -0.356 SJE 21,400 -1,700 -7.36 280 -0.025
Top liquidity VND Top liquidity VND
Ticker Last
Price
Chg %chg Val.
(VNDbn)
Index
impact
Ticker Last
Price
Chg %chg Val.
(VNDbn)
Index
impact
ROS 26,300 -800 -2.95 297 -0.134 VCS 82,100 -5,400 -6.17 72 -0.182
HPG 21,600 -50 -0.23 127 -0.041 PVS 20,700 200 0.98 38 0.050
FPT 53,200 -500 -0.93 89 -0.100 CEO 9,900 0 0.00 32 0.000
VHM 89,000 1,400 1.60 76 1.384 L14 56,700 -6,300 -10.00 18 -0.079
MBB 23,000 200 0.88 75 0.128 NDN 17,100 0 0.00 16 0.000
HNX
Source: Bloomberg
Bloomberg: VNDS
DAILY MARKET RECAP 04 September, 2019
IN ALLIANCE WITH
FOREIGN ACTIVITIES
Volume (Mn'shs) HOSE HNX Value (VND'bn) HOSE HNX
BUY 12.2 0.7 BUY 470.5 2.6
% of market 7.9% 2.3% % of market 12.8% 0.5%
SELL 16.2 1.6 SELL 507.6 20.3
% of market 10.6% 5.0% % of market 13.8% 4.0%
NET BUY (SELL) (4.0) (0.9) NET BUY (SELL) (37.0) (17.7)
Source: HSX, HNX
(400)
(200)
0
200
400
600
800
1,000
Foreign net buy/sell (30 days) in VND'bn
HOSE HNX
YTD ACCUMULATION
Volume (Mln'shs) HOSE HNX Value (VND'bn) HOSE HNX
BUY 2,517.3 170.1 BUY 116,790.0 3,050.5
% of market 9.0% 3.0% % of market 18.2% 1.8%
SELL 2,551.7 217.2 SELL 107,669.2 3,647.3
% of market 9.2% 3.9% % of market 16.7% 2.2%
NET BUY (SELL) (34.4) (47.1) NET BUY (SELL) 9,121 (596.7) Source: HSX, HNX
Bloomberg: VNDS
DAILY MARKET RECAP 04 September, 2019
IN ALLIANCE WITH
FOREIGN ACTIVITIES
Top buy by foreigners (value) VND'bn Top buy by foreigners (value) VND'bn
Ticker Last
Price
Chg %chg Value Index
impact
Ticker Last
Price
Chg %chg Value Index
impact
VNM 123,800 -200 -0.16 61.8 -0.103 HUT 2,300 100 4.55 1.4 0.000
VHM 89,000 1,400 1.60 48.1 1.384 SHS 7,400 -200 -2.63 0.4 0.000
HPG 21,600 -50 -0.23 40.3 -0.041 BVS 10,800 -100 -0.92 0.3 0.000
VJC 130,400 -1,600 -1.21 39.3 -0.256 VCS 82,100 -5,400 -6.17 0.1 0.000
MSN 75,000 1,000 1.35 30.3 0.345 SHB 6,300 100 1.61 0.1 0.000
Top sell by foreigners (value) VND'bn Top sell by foreigners (value) VND'bn
Ticker Last
Price
Chg %chg Value Index
impact
Ticker Last
Price
Chg %chg Value Index
impact
HPG 21,600 -50 -0.23 83.0 -0.041 PVS 20,700 200 0.98 6.3 0.000
VJC 130,400 -1,600 -1.21 41.8 -0.256 CEO 9,900 0 0.00 5.4 0.000
VIC 122,400 -600 -0.49 37.4 -0.593 NDN 17,100 0 0.00 3.6 0.000
VNM 123,800 -200 -0.16 36.6 -0.103 SHS 7,400 -200 -2.63 2.7 0.000
VHM 89,000 1,400 1.60 28.6 1.384 DTD 16,000 -900 -5.33 0.9 0.000
Top net buy by foreigners (value) VND'bn Top net buy by foreigners (value) VND'bn
Ticker Last
Price
Chg %chg Value Index
impact
Ticker Last
Price
Chg %chg Value Index
impact
VNM 123,800 -200 -0.16 25.2 -0.103 HUT 2,300 100 4.55 1.4 0.000
VHM 89,000 1,400 1.60 19.5 1.384 BVS 10,800 -100 -0.92 0.1 0.000
NVL 62,300 200 0.32 7.5 0.055 PHP 11,700 0 0.00 0.0 0.000
GAS 100,400 600 0.60 6.6 0.339 L14 56,700 -6,300 -10.00 0.0 0.000
TNA 13,800 100 0.73 5.9 0.001 DHT 40,000 1,000 2.56 0.0 0.000
Top net sell by foreigners (value) VND'bn Top net sell by foreigners (value) VND'bn
Ticker Last
Price
Chg %chg Value Index
impact
Ticker Last
Price
Chg %chg Value Index
impact
HPG 21,600 -50 -0.23 -42.7 -0.041 PVS 20,700 200 0.98 -6.32 0.000
VCB 77,300 -500 -0.64 -15.2 -0.547 CEO 9,900 0 0.00 -5.33 0.000
VRE 34,000 -250 -0.73 -11.5 -0.172 NDN 17,100 0 0.00 -3.58 0.000
STB 10,150 -50 -0.49 -9.1 -0.028 SHS 7,400 -200 -2.63 -2.32 0.000
VIC 122,400 -600 -0.49 -8.7 -0.593 DTD 16,000 -900 -5.33 -0.85 0.000
Source: Bloomberg, HOSE, HNX
HOSE HNX
4-Sep-19
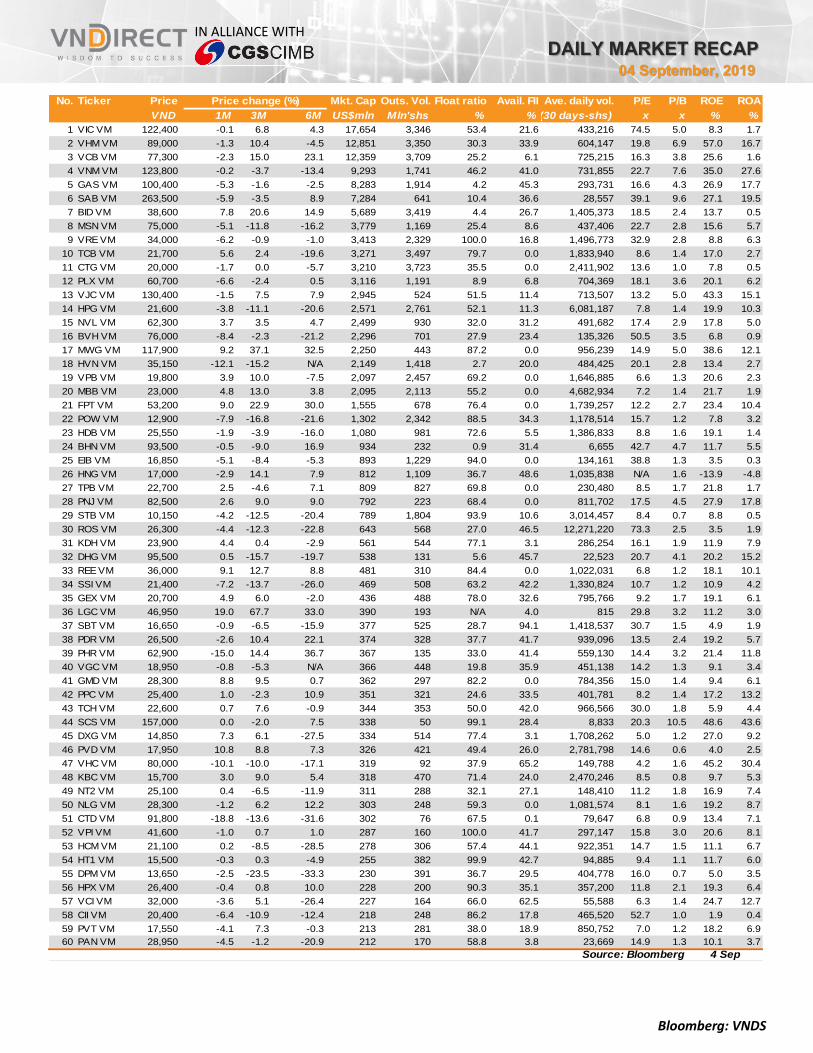
TOP 60 MARKET CAP STOCKS SNAPSHOT ON HOSE
Bloomberg: VNDS
DAILY MARKET RECAP 04 September, 2019
IN ALLIANCE WITH
No. Ticker Price Mkt. Cap Outs. Vol. Float ratio Avail. FII Ave. daily vol. P/E P/B ROE ROA
VND 1M 3M 6M US$mln Mln'shs % % (30 days-shs) x x % %
1 VIC VM 122,400 -0.1 6.8 4.3 17,654 3,346 53.4 21.6 433,216 74.5 5.0 8.3 1.7
2 VHM VM 89,000 -1.3 10.4 -4.5 12,851 3,350 30.3 33.9 604,147 19.8 6.9 57.0 16.7
3 VCB VM 77,300 -2.3 15.0 23.1 12,359 3,709 25.2 6.1 725,215 16.3 3.8 25.6 1.6
4 VNM VM 123,800 -0.2 -3.7 -13.4 9,293 1,741 46.2 41.0 731,855 22.7 7.6 35.0 27.6
5 GAS VM 100,400 -5.3 -1.6 -2.5 8,283 1,914 4.2 45.3 293,731 16.6 4.3 26.9 17.7
6 SAB VM 263,500 -5.9 -3.5 8.9 7,284 641 10.4 36.6 28,557 39.1 9.6 27.1 19.5
7 BID VM 38,600 7.8 20.6 14.9 5,689 3,419 4.4 26.7 1,405,373 18.5 2.4 13.7 0.5
8 MSN VM 75,000 -5.1 -11.8 -16.2 3,779 1,169 25.4 8.6 437,406 22.7 2.8 15.6 5.7
9 VRE VM 34,000 -6.2 -0.9 -1.0 3,413 2,329 100.0 16.8 1,496,773 32.9 2.8 8.8 6.3
10 TCB VM 21,700 5.6 2.4 -19.6 3,271 3,497 79.7 0.0 1,833,940 8.6 1.4 17.0 2.7
11 CTG VM 20,000 -1.7 0.0 -5.7 3,210 3,723 35.5 0.0 2,411,902 13.6 1.0 7.8 0.5
12 PLX VM 60,700 -6.6 -2.4 0.5 3,116 1,191 8.9 6.8 704,369 18.1 3.6 20.1 6.2
13 VJC VM 130,400 -1.5 7.5 7.9 2,945 524 51.5 11.4 713,507 13.2 5.0 43.3 15.1
14 HPG VM 21,600 -3.8 -11.1 -20.6 2,571 2,761 52.1 11.3 6,081,187 7.8 1.4 19.9 10.3
15 NVL VM 62,300 3.7 3.5 4.7 2,499 930 32.0 31.2 491,682 17.4 2.9 17.8 5.0
16 BVH VM 76,000 -8.4 -2.3 -21.2 2,296 701 27.9 23.4 135,326 50.5 3.5 6.8 0.9
17 MWG VM 117,900 9.2 37.1 32.5 2,250 443 87.2 0.0 956,239 14.9 5.0 38.6 12.1
18 HVN VM 35,150 -12.1 -15.2 N/A 2,149 1,418 2.7 20.0 484,425 20.1 2.8 13.4 2.7
19 VPB VM 19,800 3.9 10.0 -7.5 2,097 2,457 69.2 0.0 1,646,885 6.6 1.3 20.6 2.3
20 MBB VM 23,000 4.8 13.0 3.8 2,095 2,113 55.2 0.0 4,682,934 7.2 1.4 21.7 1.9
21 FPT VM 53,200 9.0 22.9 30.0 1,555 678 76.4 0.0 1,739,257 12.2 2.7 23.4 10.4
22 POW VM 12,900 -7.9 -16.8 -21.6 1,302 2,342 88.5 34.3 1,178,514 15.7 1.2 7.8 3.2
23 HDB VM 25,550 -1.9 -3.9 -16.0 1,080 981 72.6 5.5 1,386,833 8.8 1.6 19.1 1.4
24 BHN VM 93,500 -0.5 -9.0 16.9 934 232 0.9 31.4 6,655 42.7 4.7 11.7 5.5
25 EIB VM 16,850 -5.1 -8.4 -5.3 893 1,229 94.0 0.0 134,161 38.8 1.3 3.5 0.3
26 HNG VM 17,000 -2.9 14.1 7.9 812 1,109 36.7 48.6 1,035,838 N/A 1.6 -13.9 -4.8
27 TPB VM 22,700 2.5 -4.6 7.1 809 827 69.8 0.0 230,480 8.5 1.7 21.8 1.7
28 PNJ VM 82,500 2.6 9.0 9.0 792 223 68.4 0.0 811,702 17.5 4.5 27.9 17.8
29 STB VM 10,150 -4.2 -12.5 -20.4 789 1,804 93.9 10.6 3,014,457 8.4 0.7 8.8 0.5
30 ROS VM 26,300 -4.4 -12.3 -22.8 643 568 27.0 46.5 12,271,220 73.3 2.5 3.5 1.9
31 KDH VM 23,900 4.4 0.4 -2.9 561 544 77.1 3.1 286,254 16.1 1.9 11.9 7.9
32 DHG VM 95,500 0.5 -15.7 -19.7 538 131 5.6 45.7 22,523 20.7 4.1 20.2 15.2
33 REE VM 36,000 9.1 12.7 8.8 481 310 84.4 0.0 1,022,031 6.8 1.2 18.1 10.1
34 SSI VM 21,400 -7.2 -13.7 -26.0 469 508 63.2 42.2 1,330,824 10.7 1.2 10.9 4.2
35 GEX VM 20,700 4.9 6.0 -2.0 436 488 78.0 32.6 795,766 9.2 1.7 19.1 6.1
36 LGC VM 46,950 19.0 67.7 33.0 390 193 N/A 4.0 815 29.8 3.2 11.2 3.0
37 SBT VM 16,650 -0.9 -6.5 -15.9 377 525 28.7 94.1 1,418,537 30.7 1.5 4.9 1.9
38 PDR VM 26,500 -2.6 10.4 22.1 374 328 37.7 41.7 939,096 13.5 2.4 19.2 5.7
39 PHR VM 62,900 -15.0 14.4 36.7 367 135 33.0 41.4 559,130 14.4 3.2 21.4 11.8
40 VGC VM 18,950 -0.8 -5.3 N/A 366 448 19.8 35.9 451,138 14.2 1.3 9.1 3.4
41 GMD VM 28,300 8.8 9.5 0.7 362 297 82.2 0.0 784,356 15.0 1.4 9.4 6.1
42 PPC VM 25,400 1.0 -2.3 10.9 351 321 24.6 33.5 401,781 8.2 1.4 17.2 13.2
43 TCH VM 22,600 0.7 7.6 -0.9 344 353 50.0 42.0 966,566 30.0 1.8 5.9 4.4
44 SCS VM 157,000 0.0 -2.0 7.5 338 50 99.1 28.4 8,833 20.3 10.5 48.6 43.6
45 DXG VM 14,850 7.3 6.1 -27.5 334 514 77.4 3.1 1,708,262 5.0 1.2 27.0 9.2
46 PVD VM 17,950 10.8 8.8 7.3 326 421 49.4 26.0 2,781,798 14.6 0.6 4.0 2.5
47 VHC VM 80,000 -10.1 -10.0 -17.1 319 92 37.9 65.2 149,788 4.2 1.6 45.2 30.4
48 KBC VM 15,700 3.0 9.0 5.4 318 470 71.4 24.0 2,470,246 8.5 0.8 9.7 5.3
49 NT2 VM 25,100 0.4 -6.5 -11.9 311 288 32.1 27.1 148,410 11.2 1.8 16.9 7.4
50 NLG VM 28,300 -1.2 6.2 12.2 303 248 59.3 0.0 1,081,574 8.1 1.6 19.2 8.7
51 CTD VM 91,800 -18.8 -13.6 -31.6 302 76 67.5 0.1 79,647 6.8 0.9 13.4 7.1
52 VPI VM 41,600 -1.0 0.7 1.0 287 160 100.0 41.7 297,147 15.8 3.0 20.6 8.1
53 HCM VM 21,100 0.2 -8.5 -28.5 278 306 57.4 44.1 922,351 14.7 1.5 11.1 6.7
54 HT1 VM 15,500 -0.3 0.3 -4.9 255 382 99.9 42.7 94,885 9.4 1.1 11.7 6.0
55 DPM VM 13,650 -2.5 -23.5 -33.3 230 391 36.7 29.5 404,778 16.0 0.7 5.0 3.5
56 HPX VM 26,400 -0.4 0.8 10.0 228 200 90.3 35.1 357,200 11.8 2.1 19.3 6.4
57 VCI VM 32,000 -3.6 5.1 -26.4 227 164 66.0 62.5 55,588 6.3 1.4 24.7 12.7
58 CII VM 20,400 -6.4 -10.9 -12.4 218 248 86.2 17.8 465,520 52.7 1.0 1.9 0.4
59 PVT VM 17,550 -4.1 7.3 -0.3 213 281 38.0 18.9 850,752 7.0 1.2 18.2 6.9
60 PAN VM 28,950 -4.5 -1.2 -20.9 212 170 58.8 3.8 23,669 14.9 1.3 10.1 3.7
Price change (%)
Source: Bloomberg 4 Sep
Bloomberg: VNDS
DAILY MARKET RECAP 04 September, 2019
IN ALLIANCE WITH
This report has been prepared by VNDIRECT or one of its affiliates for distribution in Vietnam and overseas. The information herein is believed by VNDIRECT to be reliable and is based on public sources believed to be reliable. With exception of information about VNDIRECT, VNDIRECT makes no representation about the accuracy of such information.
Options, estimates and projection expressed in this report represent the current views of the author at the date of publication only. They do not necessarily reflect the opinions of VNDIRECT and are subject to change without notice. VNDIRECT has no obligation to update, amend or in any way modify this report or otherwise notify a reader thereof in the event that any of the subject matter or opinion, projection or estimate contained within it changes or becomes inaccurate.
The information herein was obtained from various sources and we do not guarantee its accuracy or completeness. Prices and availability of financial instruments are also subject to change without notice.
This published research may be considered by VNDIRECT when buying or selling proprietary positions or positions held by funds under its management. VNDIRECT may trade for its own account as a result of short-term trading suggestions from analysts and may also engage in securities transactions in a manner inconsistent with this report and opinions expressed therein.
Neither the information nor any opinion expressed in this report constitutes an offer, nor an invitation to make an offer, to buy or sell any securities or any option, futures or other derivative instruments in any jurisdiction. Nor should it be construed as an advertisement for any financial instruments.
Officers of VNDIRECT may have a financial interest in securities mentioned in this report or in related instruments. This research report is prepared for general circulation for general information only. It does no have regard to the specific investment objectives, financial situation or particular needs of any person who may receive or read this report.
Investors should note that the prices of securities fluctuate and may rise and fall. Past performance, if any, is no guide to the future. The financial instruments discussed in this report may not be suitable for all investors. Investors must make their own financial decisions based on their independent financial advisors as they believe necessary and based on their particular financial situation and investment objectives.
This report may not be copied, reproduced, published or redistributed by any person for any purpose without the express permission of VNDIRECT in writing. Please cite sources when quoting.
ADDRESS
Headquarter
1 Nguyen Thuong Hien Str
Hai Ba Trung Dist, Hanoi
T: +84 24 3972 4568
F: +84 24 3972 4600
HCMC Office
The 90th Pasteur Building
90 Pasteur Str, Dist 1, HCMC
T: +84 28 7300 0688
F: +84 28 3914 6924
Da Nang Office
Room 7-8-9, 3rd floor, Buu Dien Building
155 Nguyen Van Linh Str, Da Nang City
T: +84 511 382 1111
Vinh - Nghe An Office
1 Lenin Str
Vinh City, Nghe An Province
T: +84 388 688 466
F:+84 388 688 466
Can Tho Office
3rd floor STS Building, 11B Hoa Binh
Ninh Kieu, Can Tho
T: +84 710 3766 959
F: +84 710 3826 331
Quang Ninh Office
1st & 2nd floor, 29-31, 25/4 Str
Ha Long City, Quang Ninh Province
T: +84 33 3820 818
F: +84 33 3820 333
DISCLAIMER