Embed Size (px)
Citation preview

Regional Price Index
2017
Department ofPrimary Industries andRegional Development

Contents
Department of Primary Industries and Regional Development
Level 2, Gordon Stephenson House140 William StreetPERTH WA 6000
PO Box 1143WEST PERTH 6872
Disclaimer: The information contained in this document is for general information only. While every effort has been made to ensure the accuracy and completeness of the information, information referred to in this publication may include or be based on data provided to the Department of Primary Industries and Regional Development from other sources or organisations. Any person who uses or seeks to rely on this information, including for comparative purposes, should obtain appropriate professional advice relevant to their particular circumstances. Neither the Department nor the State of Western Australia (including their employees, officers and agents) make any representation or warranty as to the accuracy or completeness of the information or take responsibility for any errors or omissions in the information. The Department and the State of Western Australia (including their employees, officers and agents) do not accept any liability for any loss or damage incurred or suffered by any person as a result of the information contained in the document or it being used or relied upon by any person, or it being used or relied on for comparative purposes.
Telephone: (08) 6552 1800Facsimile: (08) 6552 1850Freecall: 1800 049 155 (Country Only)
Email: [email protected]: www.dpird.wa.gov.au
1 Summary
2 Introduction
3 Background
4 Locations
4 Basket of Goods
5 Weights
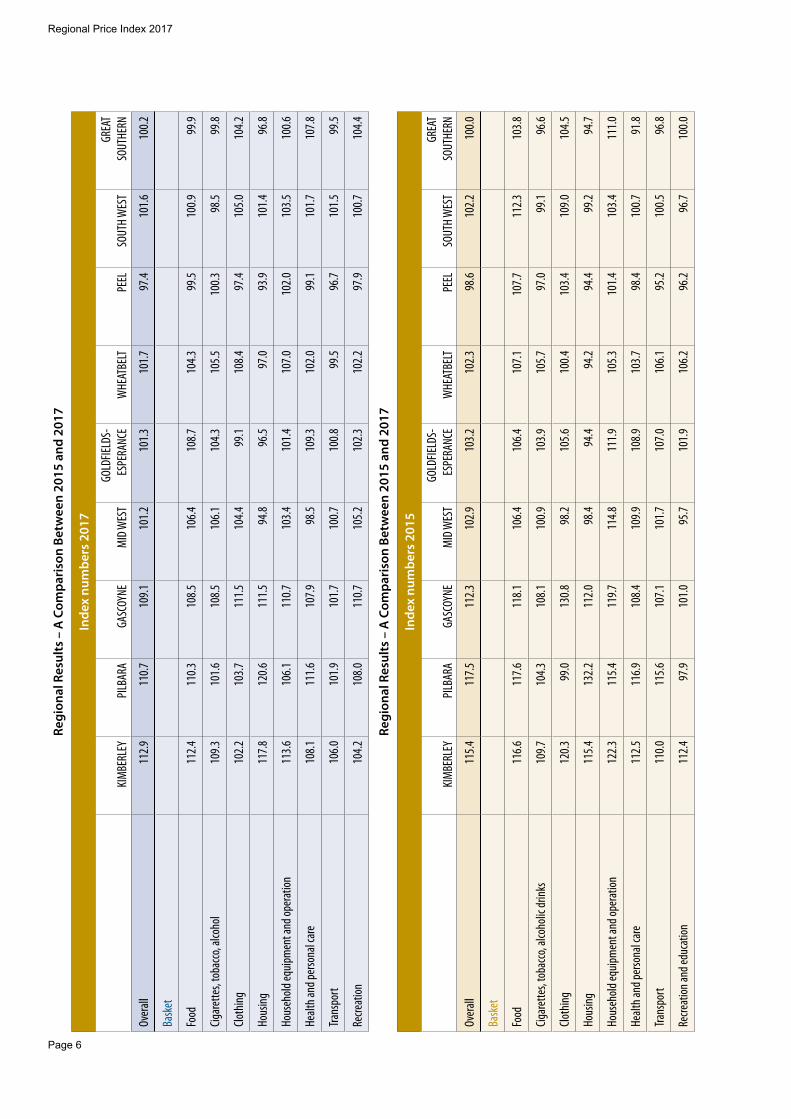
6 Regional Results – A comparison between 2015 and 2017
7 Map 1: Region and Town Price Indices
8 Map 2: Food Commodity Group
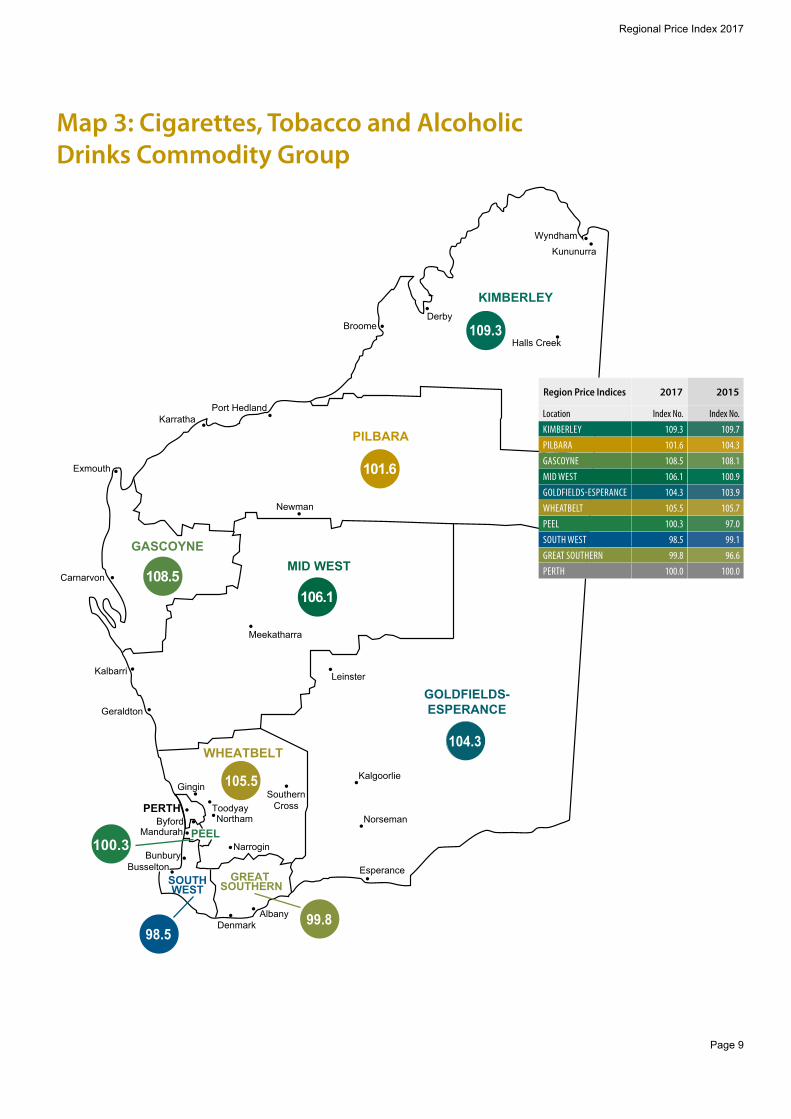
9 Map 3: Cigarettes, Tobacco and Alcoholic Drinks Commodity Group
10 Map 4: Clothing Commodity Group
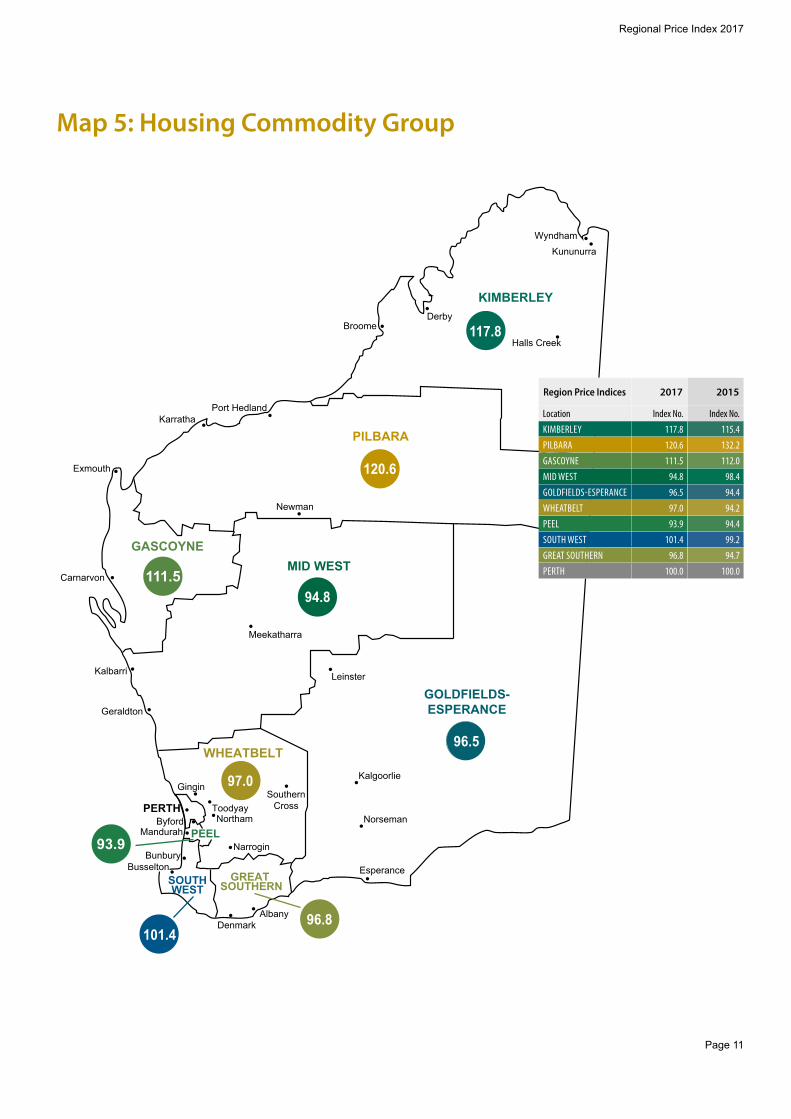
11 Map 5: Housing Commodity Group
12 Map 6: Household Equipment and Operation Commodity Group
13 Map 7: Health and Personal Care Commodity Group
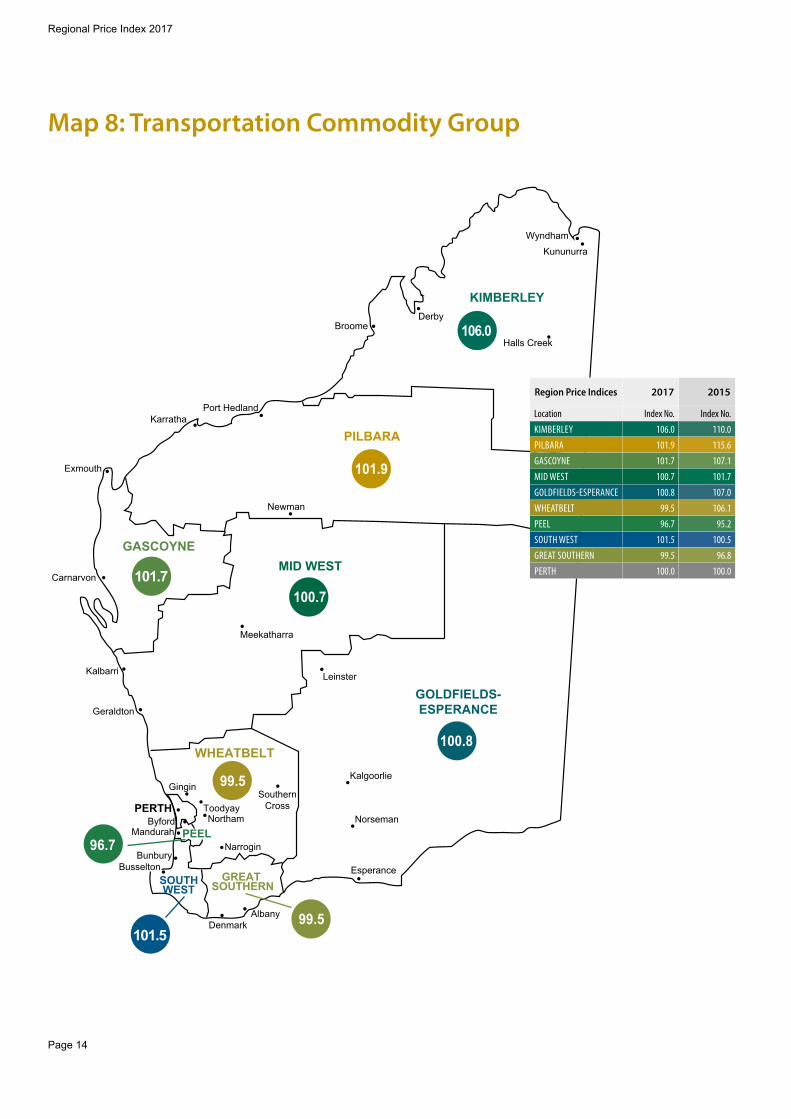
14 Map 8: Transportation Commodity Group
15 Map 9: Recreation Commodity Group
Page 1
Regional Price Index 2017
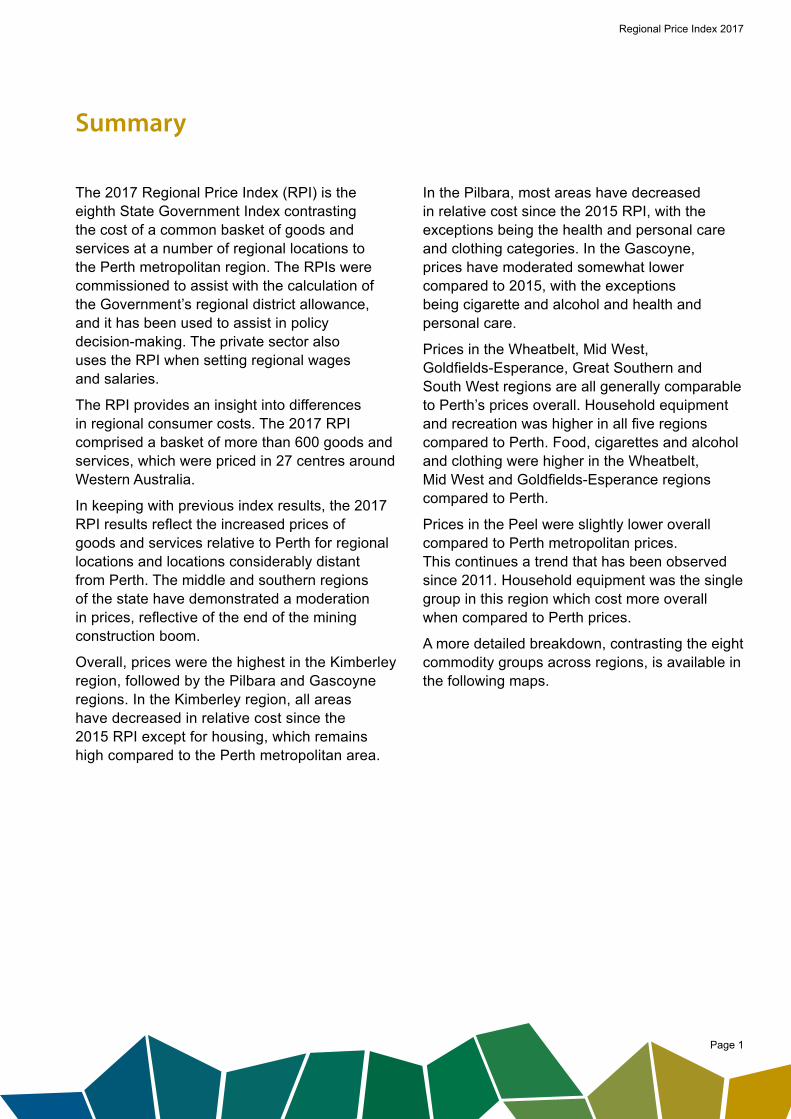
The 2017 Regional Price Index (RPI) is the eighth State Government Index contrasting the cost of a common basket of goods and services at a number of regional locations to the Perth metropolitan region. The RPIs were commissioned to assist with the calculation of the Government’s regional district allowance, and it has been used to assist in policy decision-making. The private sector also uses the RPI when setting regional wages and salaries.
The RPI provides an insight into differences in regional consumer costs. The 2017 RPI comprised a basket of more than 600 goods and services, which were priced in 27 centres around Western Australia.
In keeping with previous index results, the 2017 RPI results reflect the increased prices of goods and services relative to Perth for regional locations and locations considerably distant from Perth. The middle and southern regions of the state have demonstrated a moderation in prices, reflective of the end of the mining construction boom.
Overall, prices were the highest in the Kimberley region, followed by the Pilbara and Gascoyne regions. In the Kimberley region, all areas have decreased in relative cost since the 2015 RPI except for housing, which remains high compared to the Perth metropolitan area.
In the Pilbara, most areas have decreased in relative cost since the 2015 RPI, with the exceptions being the health and personal care and clothing categories. In the Gascoyne, prices have moderated somewhat lower compared to 2015, with the exceptions being cigarette and alcohol and health and personal care.
Prices in the Wheatbelt, Mid West, Goldfields-Esperance, Great Southern and South West regions are all generally comparable to Perth’s prices overall. Household equipment and recreation was higher in all five regions compared to Perth. Food, cigarettes and alcohol and clothing were higher in the Wheatbelt, Mid West and Goldfields-Esperance regions compared to Perth.
Prices in the Peel were slightly lower overall compared to Perth metropolitan prices. This continues a trend that has been observed since 2011. Household equipment was the single group in this region which cost more overall when compared to Perth prices.
A more detailed breakdown, contrasting the eight commodity groups across regions, is available in the following maps.
Summary
Page 2
Regional Price Index 2017
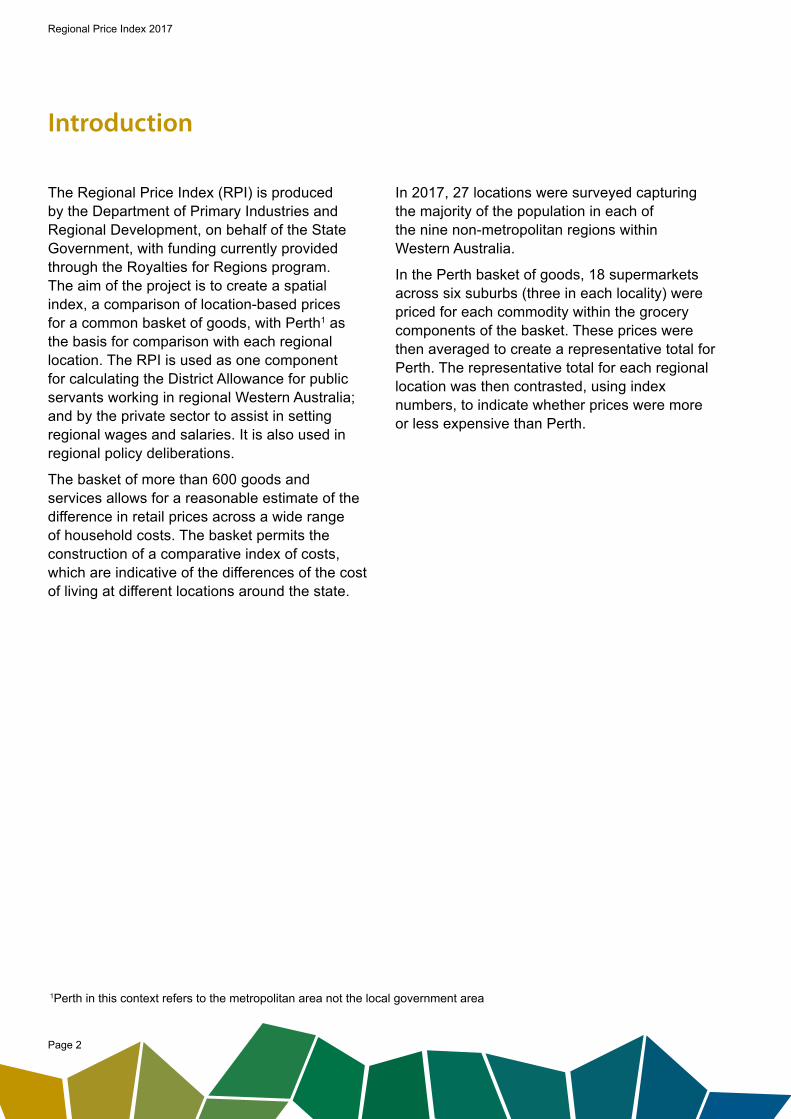
The Regional Price Index (RPI) is produced by the Department of Primary Industries and Regional Development, on behalf of the State Government, with funding currently provided through the Royalties for Regions program. The aim of the project is to create a spatial index, a comparison of location-based prices for a common basket of goods, with Perth1 as the basis for comparison with each regional location. The RPI is used as one component for calculating the District Allowance for public servants working in regional Western Australia; and by the private sector to assist in setting regional wages and salaries. It is also used in regional policy deliberations.
The basket of more than 600 goods and services allows for a reasonable estimate of the difference in retail prices across a wide range of household costs. The basket permits the construction of a comparative index of costs, which are indicative of the differences of the cost of living at different locations around the state.
Introduction
In 2017, 27 locations were surveyed capturing the majority of the population in each of the nine non-metropolitan regions within Western Australia.
In the Perth basket of goods, 18 supermarkets across six suburbs (three in each locality) were priced for each commodity within the grocery components of the basket. These prices were then averaged to create a representative total for Perth. The representative total for each regional location was then contrasted, using index numbers, to indicate whether prices were more or less expensive than Perth.
1Perth in this context refers to the metropolitan area not the local government area

Page 3
Regional Price Index 2017
The State Government produced the first Regional Price Index in 1998, with a common basket of 500 goods and services (approximately), across 21 regional locations capturing the majority of Western Australia’s regional population. The project was followed by a second Price Index in 1999 and a third at the end of 2000, printed in 2002. These projects not only contrasted prices between locations (spatial index), but the movement of prices across years (temporal index). This was possible because there were minimal changes to the commodities and services that comprised the basket of goods being priced over consecutive years.
Due to stakeholder demand, a fourth index was undertaken in 2006, which was released in 2007. The 2007 Regional Price Index used a smaller basket than in previous projects, but was substantial enough to provide a respectable comparison of prices.
Background
A fifth index was commissioned in 2011. The basket size was increased to approximately 500 goods and services (similar to the baskets used from 1998 to 2000). The number of regional locations was increased to 27, incorporating some remote and smaller locations. This was the first index to be formally used in setting the district allowance. It was also the first price collection to use the Community Resource Centre Network (CRCs) to collect prices.
The 2013, 2015 and 2017 indexes were also collated with the assistance of the CRCs.
Prices were collected from 27 regional locations for the 2017 index, and more than 600 goods and services were priced.

Page 4
Regional Price Index 2017
In 2017, regional prices were collected from the following regional locations:
Gascoyne:Carnarvon and Exmouth.
Goldfields-Esperance:Esperance, Kalgoorlie and Norseman.
Great Southern:Albany and Denmark.
Kimberley:Broome, Derby, Halls Creek, Wyndham and Kununurra.
Mid West:Geraldton, Kalbarri and Meekatharra.
Peel:Byford and Mandurah.
Pilbara:Karratha, Newman and Port Hedland.
South West: Bunbury and Busselton.
Wheatbelt:Gingin, Narrogin, Northam, Southern Cross and Toodyay.
Perth was represented by average prices collected in the localities of Armadale, Booragoon, Cannington, Innaloo, Joondalup and Midland. Where possible, prices were collected from three retail outlets for each of the eight categories of commodities. For example, 18 supermarkets were priced in Perth, three in each locality. It is not always possible to find three retail/service outlets of the same type in regional locations, so prices were collected from as many outlets as possible to a maximum of three of one type.
Locations
The basket of goods consisted of items which are then divided into eight broad categories. The eight categories are derived from the Australian Bureau of Statistics Consumer Price Index and include:
Food:Dairy, cereals, meat and seafood, fruit and vegetables, drinks, snacks and confectionery, other foods and meals out and takeaway foods.
Alcohol and Tobacco:Tobacco, beer, wine and spirits.
Clothing:Male and female clothing (adult and children).
Housing:Rates and charges, rents, cost of utilities, credit charges and insurance.
Household Equipment and Operation:Kitchen and household utensils, household supplies, household appliances, bedroom furniture and accessories, household services and communication services.
Health:Hospital, dental, optical and pharmaceutical services.
Transportation:Motor vehicles, fuel, parts and charges.
Recreation:Newspapers and magazines, audio, visual and computing equipment, sporting goods and services, and toys, and pets.
It is important to note that in contrast to previous years’ RPIs, this category omits pricing for the cost of education, and so this group is not able to be directly compared to previous years’ results.
Basket of Goods

Page 5
Regional Price Index 2017
Basket of Goods
The RPI is a weighted index. Not all of the items in the basket of goods are consumed at the same rate. For example, milk may be purchased on a daily or weekly rate depending on the size of the family, where as a car may be purchased every three to five, or ten years depending on circumstances. Some goods may not be essential (e.g. biscuits) and others play an important part of our daily existence (e.g. electricity). Weighting is a technique used to give priority to those items considered of greater importance.
The weights used in this project are based on those used for the Consumer Price Index (CPI) for Perth, produced by the Australian Bureau of Statistics (ABS). The value of the weight, for each category/commodity in the CPI basket is set using a household expenditure survey, also conducted by the ABS for the CPI.
As a result, the consumption patterns are based on the average consumption patterns for Perth. This is an essential limitation as it is important to use the same weights and the same basket of goods if the resulting indices are to be comparable. The guiding principle of this project is “to compare the cost of a common basket of goods at different locations around Western Australia”.
Weights were also used to compile the regional index numbers. Regional index numbers are the aggregate of location numbers for a region. A price index should reflect the purchasing patterns of the majority of a population, ensuring the greatest coverage and capturing the most indicative prices from where market forces operate most effectively. As a result, population centres were weighted reflecting their share of the region’s population. This allowed prices in larger population centres to be given prominence, reflecting their greater representative share of the population and hence purchasing power.
Weights
Page 6
Regional Price Index 2017
Regi
onal
Res
ults
– A
Com
par
ison
Bet
wee
n 2
015
and
201
7
Ind
ex n
umb
ers
2017
KIM
BERL
EYPI
LBAR
AGA
SCOY
NEM
ID W
EST
GOLD
FIELD
S-ES
PERA
NCE
WHE
ATBE
LTPE
ELSO
UTH
WES
T GR
EAT
SOUT
HERN
Over
all11
2.9
110.
710
9.1
101.
210
1.3
101.
797
.410
1.6
100.
2
Bask
et
Food
112.
411
0.3
108.
510
6.4
108.
710
4.3
99.5
100.
999
.9
Cigar
ette
s, to
bacc
o, alc
ohol
109.
310
1.6
108.
510
6.1
104.
310
5.5
100.
398
.599
.8
Clot
hing
102.
210
3.7
111.
510
4.4
99.1
108.
497
.410
5.0
104.
2
Hous
ing
117.
812
0.6
111.
594
.896
.597
.093
.910
1.4
96.8
Hous
ehol
d equ
ipm
ent a
nd op
erat
ion
113.
610
6.1
110.
710
3.4
101.
410
7.0
102.
010
3.5
100.
6
Healt
h an
d per
sona
l car
e10
8.1
111.
610
7.9
98.5
109.
310
2.0
99.1
101.
710
7.8
Trans
port
106.
010
1.9
101.
710
0.7
100.
899
.596
.710
1.5
99.5
Recre
atio
n10
4.2
108.
011
0.7
105.
210
2.3
102.
297
.910
0.7
104.
4
Regi
onal
Res
ults
– A
Com
par
ison
Bet
wee
n 2
015
and
201
7
Ind
ex n
umb
ers
2015
KIM
BERL
EYPI
LBAR
AGA
SCOY
NEM
ID W
EST
GOLD
FIELD
S-ES
PERA
NCE
WHE
ATBE
LTPE
ELSO
UTH
WES
T GR
EAT
SOUT
HERN
Over
all11
5.4
117.
511
2.3
102.
910
3.2
102.
398
.610
2.2
100.
0
Bask
et
Food
116.
611
7.6
118.
110
6.4
106.
410
7.1
107.
711
2.3
103.
8
Cigar
ette
s, to
bacc
o, alc
ohol
ic dr
inks
109.
710
4.3
108.
110
0.9
103.
910
5.7
97.0
99.1
96.6
Clot
hing
120.
399
.013
0.8
98.2
105.
610
0.4
103.
410
9.0
104.
5
Hous
ing
115.
413
2.2
112.
098
.494
.494
.294
.499
.294
.7
Hous
ehol
d equ
ipm
ent a
nd op
erat
ion
122.
311
5.4
119.
711
4.8
111.
910
5.3
101.
410
3.4
111.
0
Healt
h an
d per
sona
l car
e11
2.5
116.
910
8.4
109.
910
8.9
103.
798
.410
0.7
91.8
Trans
port
110.
011
5.6
107.
110
1.7
107.
010
6.1
95.2
100.
596
.8
Recre
atio
n an
d edu
catio
n11
2.4
97.9
101.
095
.710
1.9
106.
296
.296
.710
0.0

Page 7
Regional Price Index 2017
Map 1: Region and Town Price Indices
MID WEST
Karratha
Exmouth
Meekatharra
Carnarvon
Kalgoorlie
Geraldton
SouthernCross
Northam
Narrogin
PERTH
Mandurah
BunburyBusselton
Albany Denmark
Esperance
Port Hedland
BroomeDerby
Kununurra
GOLDFIELDS-ESPERANCE
KIMBERLEY
PILBARA
WHEATBELT
GREAT SOUTHERNSOUTH
WEST
PEEL
GASCOYNE
Toodyay
Gingin
KalbarriLeinster
Halls Creek
Wyndham
Newman
Norseman Byford
112.9
110.7
101.2
101.3
100.2101.6
97.4
101.7
109.1
Region and Town Price Indices 2017 2015
Location Index No. Index No.
KIMBERLEY 112.9 115.4
Broome 109.1 114.0
Derby 118.4 117.7
Halls Creek 116.8 121.3
Wyndham-Kununurra 113.7 113.4
PILBARA 110.7 117.5
Karratha 110.4 118.0
Newman 107.5 116.8
Port Hedland 113.5 117.2
GASCOYNE 109.1 112.3
Carnarvon 105.2 108.7
Exmouth 117.0 120.7
MID WEST 101.2 102.9
Geraldton 100.3 102.2
Kalbarri 104.8 108.6
Meekatharra 120.1 112.1
GOLDFIELDS-ESPERANCE 101.3 103.2
Esperance 101.8 108.3
Kalgoorlie 100.8 100.6
Norseman 109.2 109.4
WHEATBELT 101.7 102.3
Gingin 105.4 104.8
Narrogin 100.8 99.4
Northam 98.7 100.3
Southern Cross 106.3 107.6
Toodyay 104.5 106.1
PEEL 97.4 98.6
Byford 98.2 101.2
Mandurah 97.2 98.0
SOUTH WEST 101.6 102.2
Bunbury 102.2 102.7
Busselton 100.1 100.8
GREAT SOUTHERN 100.2 100.0
Albany 99.9 100.0
Denmark 101.6 99.8
PERTH 100.0 100.0

Page 8
Regional Price Index 2017
Map 2: Food Commodity Group
MID WEST
Karratha
Exmouth
Meekatharra
Carnarvon
Kalgoorlie
Geraldton
SouthernCross
Northam
Narrogin
PERTH
Mandurah
BunburyBusselton
Albany Denmark
Esperance
Port Hedland
BroomeDerby
Kununurra
GOLDFIELDS-ESPERANCE
KIMBERLEY
PILBARA
WHEATBELT
GREAT SOUTHERNSOUTH
WEST
PEEL
GASCOYNE
Toodyay
Gingin
KalbarriLeinster
Halls Creek
Wyndham
Newman
Norseman Byford
112.4
110.3
106.4
108.7
99.9100.9
104.3
108.5
99.5
Region Price Indices 2017 2015
Location Index No. Index No.
KIMBERLEY 112.4 116.6
PILBARA 110.3 117.6
GASCOYNE 108.5 118.1
MID WEST 106.4 106.4
GOLDFIELDS-ESPERANCE 108.7 106.4
WHEATBELT 104.3 107.1
PEEL 99.5 107.7
SOUTH WEST 100.9 112.3
GREAT SOUTHERN 99.9 103.8
PERTH 100 100
Page 9
Regional Price Index 2017
Map 3: Cigarettes, Tobacco and Alcoholic Drinks Commodity Group
MID WEST
Karratha
Exmouth
Meekatharra
Carnarvon
Kalgoorlie
Geraldton
SouthernCross
Northam
Narrogin
PERTH
Mandurah
BunburyBusselton
Albany Denmark
Esperance
Port Hedland
BroomeDerby
Kununurra
GOLDFIELDS-ESPERANCE
KIMBERLEY
PILBARA
WHEATBELT
GREAT SOUTHERNSOUTH
WEST
PEEL
GASCOYNE
Toodyay
Gingin
KalbarriLeinster
Halls Creek
Wyndham
Newman
Norseman Byford
109.3
101.6
106.1
104.3
99.898.5
105.5
108.5
100.3
Region Price Indices 2017 2015
Location Index No. Index No.
KIMBERLEY 109.3 109.7
PILBARA 101.6 104.3
GASCOYNE 108.5 108.1
MID WEST 106.1 100.9
GOLDFIELDS-ESPERANCE 104.3 103.9
WHEATBELT 105.5 105.7
PEEL 100.3 97.0
SOUTH WEST 98.5 99.1
GREAT SOUTHERN 99.8 96.6
PERTH 100.0 100.0

Page 10
Regional Price Index 2017
Map 4: Clothing Commodity Group
MID WEST
Karratha
Exmouth
Meekatharra
Carnarvon
Kalgoorlie
Geraldton
SouthernCross
Northam
Narrogin
PERTH
Mandurah
BunburyBusselton
Albany Denmark
Esperance
Port Hedland
BroomeDerby
Kununurra
GOLDFIELDS-ESPERANCE
KIMBERLEY
PILBARA
WHEATBELT
GREAT SOUTHERNSOUTH
WEST
PEEL
GASCOYNE
Toodyay
Gingin
KalbarriLeinster
Halls Creek
Wyndham
Newman
Norseman Byford
102.2
103.7
104.4
99.1
104.2105.0
108.4
111.5
97.4
Region Price Indices 2017 2015
Location Index No. Index No.
KIMBERLEY 102.2 120.3
PILBARA 103.7 99.0
GASCOYNE 111.5 130.8
MID WEST 104.4 98.2
GOLDFIELDS-ESPERANCE 99.1 105.6
WHEATBELT 108.4 100.4
PEEL 97.4 103.4
SOUTH WEST 105.0 109.0
GREAT SOUTHERN 104.2 104.5
PERTH 100.0 100.0
Page 11
Regional Price Index 2017
Map 5: Housing Commodity Group
MID WEST
Karratha
Exmouth
Meekatharra
Carnarvon
Kalgoorlie
Geraldton
SouthernCross
Northam
Narrogin
PERTH
Mandurah
BunburyBusselton
Albany Denmark
Esperance
Port Hedland
BroomeDerby
Kununurra
GOLDFIELDS-ESPERANCE
KIMBERLEY
PILBARA
WHEATBELT
GREAT SOUTHERNSOUTH
WEST
PEEL
GASCOYNE
Toodyay
Gingin
KalbarriLeinster
Halls Creek
Wyndham
Newman
Norseman Byford
117.8
120.6
94.8
96.5
96.8101.4
97.0
111.5
93.9
Region Price Indices 2017 2015
Location Index No. Index No.
KIMBERLEY 117.8 115.4
PILBARA 120.6 132.2
GASCOYNE 111.5 112.0
MID WEST 94.8 98.4
GOLDFIELDS-ESPERANCE 96.5 94.4
WHEATBELT 97.0 94.2
PEEL 93.9 94.4
SOUTH WEST 101.4 99.2
GREAT SOUTHERN 96.8 94.7
PERTH 100.0 100.0

Page 12
Regional Price Index 2017
Map 6: Household Equipment and Operation Commodity Group
MID WEST
Karratha
Exmouth
Meekatharra
Carnarvon
Kalgoorlie
Geraldton
SouthernCross
Northam
Narrogin
PERTH
Mandurah
BunburyBusselton
Albany Denmark
Esperance
Port Hedland
BroomeDerby
Kununurra
GOLDFIELDS-ESPERANCE
KIMBERLEY
PILBARA
WHEATBELT
GREAT SOUTHERNSOUTH
WEST
PEEL
GASCOYNE
Toodyay
Gingin
KalbarriLeinster
Halls Creek
Wyndham
Newman
Norseman Byford
113.6
106.1
103.4
101.4
100.6 103.5
107.0
110.7
102.0
Region Price Indices 2017 2015
Location Index No. Index No.
KIMBERLEY 113.6 122.3
PILBARA 106.1 115.4
GASCOYNE 110.7 119.7
MID WEST 103.4 114.8
GOLDFIELDS-ESPERANCE 101.4 111.9
WHEATBELT 107.0 105.3
PEEL 102.0 101.4
SOUTH WEST 103.5 103.4
GREAT SOUTHERN 100.6 111.0
PERTH 100.0 100.0

Page 13
Regional Price Index 2017
Map 7: Health and Personal Care Commodity Group
MID WEST
Karratha
Exmouth
Meekatharra
Carnarvon
Kalgoorlie
Geraldton
SouthernCross
Northam
Narrogin
PERTH
Mandurah
BunburyBusselton
Albany Denmark
Esperance
Port Hedland
BroomeDerby
Kununurra
GOLDFIELDS-ESPERANCE
KIMBERLEY
PILBARA
WHEATBELT
GREAT SOUTHERNSOUTH
WEST
PEEL
GASCOYNE
Toodyay
Gingin
KalbarriLeinster
Halls Creek
Wyndham
Newman
Norseman Byford
108.1
111.6
98.5
109.3
107.8101.7
102.0
107.9
99.1
Region Price Indices 2017 2015
Location Index No. Index No.
KIMBERLEY 108.1 112.5
PILBARA 111.6 116.9
GASCOYNE 107.9 108.4
MID WEST 98.5 109.9
GOLDFIELDS-ESPERANCE 109.3 108.9
WHEATBELT 102.0 103.7
PEEL 99.1 98.4
SOUTH WEST 101.7 100.7
GREAT SOUTHERN 107.8 91.8
PERTH 100.0 100.0
Page 14
Regional Price Index 2017
Map 8: Transportation Commodity Group
MID WEST
Karratha
Exmouth
Meekatharra
Carnarvon
Kalgoorlie
Geraldton
SouthernCross
Northam
Narrogin
PERTH
Mandurah
BunburyBusselton
Albany Denmark
Esperance
Port Hedland
BroomeDerby
Kununurra
GOLDFIELDS-ESPERANCE
KIMBERLEY
PILBARA
WHEATBELT
GREAT SOUTHERNSOUTH
WEST
PEEL
GASCOYNE
Toodyay
Gingin
KalbarriLeinster
Halls Creek
Wyndham
Newman
Norseman Byford
106.0
101.9
100.7
100.8
99.5 101.5
99.5
101.7
96.7
Region Price Indices 2017 2015
Location Index No. Index No.
KIMBERLEY 106.0 110.0
PILBARA 101.9 115.6
GASCOYNE 101.7 107.1
MID WEST 100.7 101.7
GOLDFIELDS-ESPERANCE 100.8 107.0
WHEATBELT 99.5 106.1
PEEL 96.7 95.2
SOUTH WEST 101.5 100.5
GREAT SOUTHERN 99.5 96.8
PERTH 100.0 100.0

Page 15
Regional Price Index 2017
Map 9: Recreation Commodity Group2
MID WEST
Karratha
Exmouth
Meekatharra
Carnarvon
Kalgoorlie
Geraldton
SouthernCross
Northam
Narrogin
PERTH
Mandurah
BunburyBusselton
Albany Denmark
Esperance
Port Hedland
BroomeDerby
Kununurra
GOLDFIELDS-ESPERANCE
KIMBERLEY
PILBARA
WHEATBELT
GREAT SOUTHERNSOUTH
WEST
PEEL
GASCOYNE
Toodyay
Gingin
KalbarriLeinster
Halls Creek
Wyndham
Newman
Norseman Byford
104.2
108.0
105.2
102.3
104.4100.7
102.2
110.7
97.9
Region Price Indices 2017 2015
Location Index No. Index No.
KIMBERLEY 104.2 112.4
PILBARA 108.0 97.9
GASCOYNE 110.7 101.0
MID WEST 105.2 95.7
GOLDFIELDS-ESPERANCE 102.3 101.9
WHEATBELT 102.2 106.2
PEEL 97.9 96.2
SOUTH WEST 100.7 96.7
GREAT SOUTHERN 104.4 100.0
PERTH 100.0 100.0
2 It is important to note that in contrast to previous years' RPIs, this category omits pricing for the costs of education and childcare, and so this group is not able to be directly compared to previous years' results.
The Department of Primary Industries and Regional Development acknowledges the contribution of the Western Australian Community Resource Network in preparation of the 2017 Regional Price Index.
Department ofPrimary Industries andRegional Development