Embed Size (px)
Citation preview
December 2014
Mid-year report 2014-15 For the period 1 April to 30 September 2014
2
Contents
Introduction .................................................................................................. 3
Department of Health Leadership Team ........................................................ 3
Executive Summary – Performance against Objectives .................................... 6
FINANCIAL AND MANAGEMENT INFORMATION DATA ANNEX ............ 13
A: Financial Performance ............................................................................. 14
B: Progress on major projects included in the Government’s Major Projects Portfolio ..................................................................................................... 19
C: People Department and Executive Agencies: workforce profile.................. 24
D: Input and Impact Indicators ..................................................................... 27

3
Introduction 1. The Department of Health is a Government Department led by Ministers and staffed by civil
servants. The Department helps people stay in good health and live independent lives. We lead the health and care system to ensure people experience a service that protects, and promotes health and provides safe, effective and compassionate care.
2. As steward of the health and care system, it is our job to ensure that the system as a whole delivers the best possible outcomes for the people of England. We work with our partner organisations to develop policies that ensure that services continue to meet the expectations of patients, carers, users and the public on fairness, efficiency and quality.
3. The Department and our Arm’s Length Bodies are accountable to Parliament for what we do. The Department sets the strategy and direction for the system as a whole and is responsible for creating and updating the policy and legislative frameworks in which this operates. The Department is also responsible for sponsoring individual national bodies by supporting them and holding them to account for carrying out their responsibilities, for which they may be accountable through the Department or directly to Parliament.
Department of Health Leadership Team
Una O’Brien – Permanent Secretary
Responsibilities Overall leadership of the Department of Health, which is responsible for the nation’s health and wellbeing. Setting priorities, driving improvements and providing funding and accountability to reflect what people value most. As the Department’s Principal Accounting Officer, is answerable to Parliament for ensuring DH runs efficiently and spends its money appropriately.
Professor Sally Davies - Chief Medical Officer and Chief Scientific Advisor
Key directorate objectives: INDEPENDENT Advisor to Secretary of State and the UK Government on all medical matters, and is also the Chief Scientific Advisor to the Department. SUPPORT the Government to ensure decisions on health and social care are based on the most up to date and reliable research evidence. ENABLE research in the NHS to support economic growth.

4
Richard Douglas - Director General Finance & NHS
Felicity Harvey - Director General Public Health
Jon Rouse - Director General Social Care, Local Government and Care Partnerships
Key directorate objectives: SET the strategy, policy and outcomes for dementia, older people, people with disabilities, mental health, children and families, health inequalities, offender health, military health and social exclusion. OVERSEE social care finance and investment, equality and lead across government on carers. BUILD effective partnerships with local government, voluntary and community sectors to improve health and care outcomes.
Charlie Massey - Director General Strategy and External Relations
Key directorate objectives: LEAD the development of NHS policy to support improved outcomes and financial sustainability. ENSURE delivery of NHS performance standards through sponsorship of NHS England, Monitor and the Trust Development Authority. ALLOCATE and oversee the management of resources voted by Parliament. IMPROVE the financial and commercial capability of the DH.
Key directorate objectives: STRATEGY, policy and outcomes for public health, sponsoring Public Health England and working with NHS England and ALBs to improve and protect the population’s health. LEAD on international business, representing the Government overseas on health issues. PROFESSIONAL leadership and advice on public health and community nursing. LEAD for science and bioethics, including embryology & genetics
Key directorate objectives: SET policy and strategy to secure safe, effective and high quality care through better professional and organisational regulation. OVERSEE the framework to improve engagement between DH and the public, improving policy-making and outcomes. LEAD policy on pay, pensions, education and training, working with stakeholders across the system. LEAD the implementation of the Department’s commitments set out in the Government’s response to the Francis Enquiry. PROVIDE DH’s official statistics function.

5
Will Cavendish - Director General Innovation, Growth and Technology (from June 2014)
Tamara Finkelstein – Chief Operating Officer (from September 2014)
Department of Health’s Arm’s Length Bodies 4. Each of the Department’s partner organisations (ALBs) has had a part to play over the last six
months in meeting the Government’s priorities in 2014 – 2015. The term ‘Arm’s Length Body’ is used to include two executive agencies (the Medicines and Healthcare Products Regulatory Agency and Public Health England), seven executive Non-Departmental Public Bodies and six NHS Special Health Authorities.
Figure 1: The Department of Health’s Arm’s Length Bodies
Key directorate objectives: STRENGTHEN the leadership and capacity in the areas of innovation, growth and the use of technology, including digital, across the health and care system. LEAD the DH's relationship with the life sciences industries, through the Office for Life Sciences SECURE the best possible health outcomes for the population from the use of medicines, medical technologies and pharmaceutical, dental and eye care services. PROVIDE sponsorship for the HSCIC, NICE and MHRA, and manage the relationship with Healthcare UK
Key directorate objectives: LEAD the work to build the new Department capabilities – people, systems, processes and estates – to meet system-wide needs and Civil Service Reform. DEVELOP and implement excellent corporate governance, audit, assurance and sponsorship for DH and its ALBs.

6
5. Each ALB has its own business plan, agreed with the Department, which sets out in detail how it
will achieve its objectives. Delivery of each plan will provide assurance to the organisation itself, to the Department and to Parliament and the public that it is achieving its objectives.
6. Figure 2 below shows how the Department and our Arm’s Length Bodies fit into the overall health and care landscape.
Figure 2 Flow of funding in Health Care Sector in 2014-15
This figure is based on budgeted position and is included as a representation of funding flow and may not reconcile directly with financial outturn.
Executive Summary – Performance against Objectives 7. Last year was an important one for the Department of Health and the wider health and care
system. Among the significant successes were: • the transition to the new health and care system; and • the Department’s and wider health and care system’s response to the inquiries into
serious failings in care following the publication of reports into Winterbourne View and the Mid-Staffordshire NHS Foundation Trust. Both rightly called for changes: greater transparency; more explicit professional and organisational accountability; and a renewed culture of compassionate care.
8. At the heart of everything that the Department does is the drive for high quality and safe care for patients, service users and the public; by the end of April 2014 staff had spent over 1,700 days “connecting” with organisations across the health and care system.

7
9. In the first half of the year 2014 - 2015 the Department has continued work to build on these achievements to deliver, with its partner organisations, an ambitious and challenging set of Ministerial and Departmental priorities.
10. The overwhelming priority for this year has been to maintain a focus on the delivery of policy commitments and performance across the health and care system as a whole. One year on from the publication of Hard Truths: The Journey to Putting Patients First, the Department must strive for continuous improvement in the quality and safety of care. Government priorities must still be delivered and, at the same time, a challenging financial situation must be well managed.
Current Issues
11. The account of our year so far presented in this report explains how we have done this. It explains that we have taken steps to reform the system that sustains services increasingly working through strategic global alliances with our external delivery partners at national and local levels, as well as taking a global leadership role in tackling the issues that will have greatest impact in the future – including achievements in dementia and anti-microbial resistance and how we are taking steps to maintain performance in important key services. We should also acknowledge the collective role with our ALBs in the response to the Ebola epidemic in West Africa.
Winter planning and NHS core performance standards
12. This year, the NHS’s winter preparations started earlier than ever, and the Government supported this by providing £700 million – £300million more than last year – in extra funding.
13. Robust local plans have also been prepared to deal with bad weather or a serious flu or
norovirus outbreak. And we are also reminding people about alternatives to A&E, including walk-in centres, the 111 advice service and out of hours GP services.
14. 20,436,758 doses of the flu vaccine have been distributed in the UK by manufacturers directly to general practice and other providers. This includes the centrally procured vaccines for the children’s flu programme and the strategic flu reserve. Under 65s at risk, pregnant women, the over 65s, and children aged between 2 and 4 years of age are offered the vaccine.
15. Performance against all standards has been challenging in this period.
16. NHS England’s performance report for Q2 2014-15 was presented to its Board on 16th
December and can be found at http://www.england.nhs.uk/wp-content/uploads/2014/12/item6-board-1214.pdf .

8
Other progress on priorities
17. In addition, our commitments are organised under three themes, encompassing ten Ministerial and Departmental priorities.
1.Living and ageing well: Our priorities are preventing disease and poor health, improving care for people over 75, reforming social care, integrating health and care, and improving care for people with dementia.
2. Caring better: Raising standards in health and care, ensuring everyone is treated with compassion and respect. In 2014, our priorities are improving the quality of care and the use of technology, encouraging greater openness and taking significant steps towards parity of esteem between mental and physical health.
3. Preparing for the future: Making the right decisions today so that the health and care system can meet the needs of people in the future. In 2014, our priorities are ensuring the long-term sustainability of the system by maintaining quality, access and financial performance, working more efficiently and investing in research and innovation.
18. Our progress on these is set out below -
1.Living and ageing well
1.Helping people live healthier lives, making this country the best place in the world in which to grow old
• We are making good progress on recruiting 4,200 additional health visitors. There has been a transformation of service making real difference to children and many more will enter the workforce from September 2015.
Working with and through our delivery partners the Department also -
• Launched the consultation to inform a final decision by Ministers on whether to introduce standardised packaging for tobacco following publication of the independent review led by Sir Cyril Chantler;
• Published the third year reports from partners of the Responsibility Deal; • Rolled out childhood flu immunisation for 2-4 year olds, and rolled out pilots in primary and
secondary schools; • Continued to work towards the aim to provide 16,000 new places by April 2015 on the Family
Nurse Partnership Programme – a preventative programme for first time mothers.
2.Transforming care outside hospital, focusing on the role of primary care in providing integrated out of hospital care, and also to look at what can be done to improve urgent and emergency care
Working with and through our delivery partners the Department – • Published through NHS England, a future vision for transforming primary care. In addition,
changes to the 2014-15 GP contract have brought about people aged 75 and over having a named accountable GP with overall responsibility for their care from July 2014;

9
• Pilot sites were selected for GP surgeries to explore means of providing greater patient access through longer and weekend opening hours and better use of technologies, and improving patient satisfaction. On 30 September 2014, the Prime Minister announced a second wave of access pilots, as part of a further £100m for 2015-16.
• Introduced, through NHS England, choice of NHS funded care for long term conditions and in diagnostics and post-diagnosis;
• Introduced a right to ask for a personal health budget for everyone who is in receipt of NHS Continuing Healthcare; and
• Developed incentives to improve access to primary care in disadvantaged areas, through NHS England.
3. Implementing social care reform, including integrating health and social care
Working with and through our delivery partners the Department – • Published draft regulations and guidance to implement the Care Act in 2015-16. The Care Act
received Royal Assent on 14th May. It reforms the law relating to care and support for adults, to support for carers, and makes provision about safeguarding adults from abuse or neglect. It also makes provision about care standards;
• Reformed the funding of the care and support system; • Put the statutory framework in place to give the CQC the powers to oversee the financial
sustainability of care providers to ensure continuity of care; • Agreed Better Care Fund Plans, allocated funds locally through NHS England and commenced
evaluations; • Worked with Think Local, Act Personal, ADASS and other social care stakeholders to develop
statutory guidance to support provisions in the Care Act that mandate personal budgets as part of the care and support plan. These were open for consultation over the Summer 2014 and final versions have recently been published.
4.Improving treatment and care of people with dementia to be among the best in Europe through early diagnosis, better research and better support
Working with and through our delivery partners the Department –
• Worked with Public Health England to launch a dementia movement to improve awareness and attitudes, and to encourage sign-up as a ‘dementia friend’. So far 570,000 have been recruited;
• Published the second Annual Progress report on the Prime Ministers’ Challenge on Dementia; • Held the first G8 Legacy event on finance and social impact investment in dementia research in
London; • Established the World Dementia Council and hosted the first meeting; and • Established the NIHR National Director for Dementia Research.

10
2.Caring Better
Working with and through our delivery partners the Department –
5.Raising standards in health and care, ensuring everyone is treated with compassion and respect
• Advocated the ratification of a new resolution on Antimicrobial Resistance at 67th World Health Assembly meeting. Our response to the recent House of Commons Science & Technology Committee is available at http://www.parliament.uk/business/committees/committees-a-z/commons-select/science-and-technology-committee/inquiries/parliament-2010/antimicrobial-resistance-amr/ http://www.parliament.uk/business/committees/committees-a-z/commons-elect/science-and-technology-committee/inquiries/parliament-2010/antimicrobial-resistance-amr/ ;
• Improved training for senior NHS staff and launched the Fast Track Executive Leaders Scheme; • Worked through NHS England to extend the Family and Friends Test across NHS services: we are
on course to roll out across all GP, community and mental health services with the remaining appropriate services by the end of the financial year 2014-15. State of readiness assessments were rolled out in July 2014;
• Worked with NHS England and NHS Improving Quality to launch the Patient Safety Collaboration;
• Introduced a new offence for providers of health and social care that provide misleading information;
• Working with the Care Quality Commission, Monitor and partners, developed and implemented a single failure regime for quality and finance; and
• Amended a loophole in Section 19 of the Health and Social Care Act 2008 that allows some providers to voluntarily close services in order to avoid enforcement action by the Care Quality Commission.
6. Technology Revolution – making a step change in the way technology and information is used to enable more efficient and joined up working across the health and care system, improving quality or care and helping people manage their own healthcare
Working with and through our delivery partners the Department –
• Made good progress towards the commitment to deliver 100,000 whole genomes over five years focussing on cancer, rare and infectious diseases. Genomics England Ltd is now established as a limited company;
• Published the MyNHS website; a single portal for patients to see comparative data across the health and care system;
• Established the National Information Board and sub-groups to develop a strategic decision-making and commissioning forum;
• Rolled out the Growth and Efficiency Fund to NHS Trusts; • Through the Nursing Technology Fund, provided £30m for 85 projects to support nurses,
midwives and health visitors to make better use of digital technology in all care settings, in order to deliver safer, more effective and more efficient care. The second round of funding has been announced and Trusts are currently bidding for funds to be spent by the end of 2014-15;

11
• Ensured access to Intensity Modulated Radiotherapy (IMRT) in the 24% of cancer cases that require radical radiotherapy, delivered by 50 radiotherapy centres nationwide;
• Put in place funding for up to 250 patients to access Proton Beam Therapy; and • Published an innovation scorecard which is a key mechanism for the NHS to have a clear line of
sight on its performance to reduce the variation in the uptake of innovations.
7. Demonstrating real and meaningful progress towards achieving true parity of esteem between mental and physical health by March 2015
Working with and through our delivery partners the Department –
• Commenced the evaluation of 10 trial liaison and diversion schemes for vulnerable people at police stations and courts;
• Extended patient’s legal right to choice of any qualified provider for mental health services; • Held a mental health Crisis Care Concordat Summit which sets out how police, mental health,
social work and ambulance professionals should work together to help people going through a mental health crisis;
• Supported pilots relating to psychological well-being and work to reduce direct costs to the taxpayer caused by ill health;
• Agreed access and waiting time standards for mental health services for inclusion in the 2014-15 Mandate to the NHS; and
• Continued to work towards our overall targets in respect of Improving Access to Psychological Therapies for adults, children and young people.
3.Preparing for the Future
8. Improving productivity, long-term sustainability and ensuring value for money for the tax payer
Working with and through our delivery partners the Department –
• Supported selected pilots in local areas to implement a local payment by results scheme for drugs and alcohol recovery, capture best practice and share learning, working with Home Office, the Ministry of Justice and the Department for Work and Pensions;
• Published payment by results information, subject to commercial confidentiality and guidance from the UK Statistics Authority, working with Home Office and the Ministry of Justice;
• Continued work on improving the efficiency of NHS procurement by publishing the NHS e-Procurement Strategy, Procurement Transparency Guidance and Toolkit to help combat inflation; and
• Established the Centre for Procurement Efficiency and Academy for Procurement Excellence to help delivery £2bn of efficiency savings as well as developing long-term leadership and capability in procurement across the NHS.

12
9. Contribute to economic growth
Working with and through our delivery partners the Department –
• Continues to support the Government’s ambition to sell surplus land with capacity for 100,000 homes by 31 March 2015; at the end of September 2014 the DH family had sold land with capacity for more than 11,250 homes;
• Published the Visitor & Migrant NHS Cost Recovery Programme Implementation Plan 2014–16; • Appointed a new joint Minister with BIS for Life Sciences who has announced new investment
into life sciences alongside a review into how we develop medicines and medical technology. These are set out at https://www.gov.uk/government/news/major-investment-in-life-sciences; and
• Developed a national NIHR Bio Resource to provide a cohort of patients, their relatives and healthy volunteers who wish to participate in experimental medicine.
10. Developing the resilience of DH
Over the course of this year we have undertaken work to develop the organisational capability and resilience of the Department to fulfil our role of steward of the health and care system. To this end, our work has included –
• Publication of our Departmental Improvement Plan which can be found at https://www.google.co.uk/#q=dh+departmental+improvement+plan&spell=1;
• Using data from our staff survey results to assess our capability; • Contributing to Civil Service Reform; • Undertaking work to develop our analytical functions, for example embedding the use of
behavioural and citizen insight; • 100% of our Senior Civil Service staff due to take part in a connecting placement have done
so since the start of the programme, with 120 SCS staff having been engaged in connecting activity across 180 connecting partner organisations since April 2014;and
• focussing on our digital capability, particularly around digital consultations. More can be found at https://digitalhealth.blog.gov.uk/.

13
FINANCIAL AND MANAGEMENT INFORMATION DATA ANNEX
19. This Annex sets out some basic data about the Department’s performance as a Department of State. It shows that the Department is, in addition to delivering the significant policies set out in the main report, performing well in its basic stewardship function of ensuring its own corporate management is as sound as we expect the wider system to be. It is divided into four sections: A. Financial performance – the Department is on track to maintain financial balance for the
health and care system; B. Information on the progress of projects in the Government's Major Projects Portfolio
(GMPP); C. People – the Department and our two Executive Agencies are containing costs and
maintaining good levels of morale; and D. Input and impact indicators – showing good progress on a range of measures (taken from
our Business Plan 2010-15), most notably in the metrics taken from the NHS, adult social care and public health outcomes frameworks.

14
A: Financial Performance
Overall Commentary – Financial Performance 20. Despite considerable cost pressure in the NHS, arising mainly through increasing demand for
services, the department expects to spend within the control limits set by Parliament and HM Treasury.
Sector Overview NHS Commissioning 21. The NHS commissioning sector continues to come under financial and operating pressure as
demand for services increase. There are particular increases in costs of treatments funded by the Cancer Drugs Fund and through Specialised Commissioning. Despite this NHS England remains on track to be within their budgetary limits.
NHS Providers 22. The NHS Provider sector remains the key risk/volatility. There are particular cost increases from
higher demand, rising staff costs resulting from the increased focus on quality and safety following the Francis Report and a reduction in non-recurrent/unplanned financial support as part of the new, more transparent system.
23. On top of an additional £700 million funding provided by the Department to the NHS for Winter pressures and Access, a further £260 million has been set aside to deploy as direct support to NHS trusts. This will reduce the headline NHS trust sector net deficit but the underlying organisational deficits remain. NHS Foundation Trusts are not eligible for this additional income, but many of those in deficit are receiving cash support from the Department.
24. Where support is given to providers they are required to agree to terms and conditions, including but not limited to the implementation of specific proven strategies aimed at reducing costs and/or releasing cash. For example, these could include:
• Constraints on senior pay; • Adopting a shared services solution; • An agreed procurement strategy; • An energy conservation programme; and/or • Surplus land disposal. 25. A detailed breakdown of our financial performance is provided by way of the following tables -

15
Total DH Group Expenditure 2014-15
Financial Performance 2014-15
Segments Annual Plan 2014-15
Flexed Annual Plan 2014-15 (i)
Actual Apr to Sept
2014-15
Actual Apr to Sept 2013-14 (iii)
NHS England 97,292 98,292 48,428 46,788NHS Providers (ii) 0 457 630 368Health Education England 4,929 4,928 2,347 2,368DH 3,041 2,292 1,381 994Local Authorities 2,838 2,838 1,365 1,373Public Health England 796 843 292 425Other ALBs 754 740 349 132Total Departmental Expenditure Limit (DEL) 109,650 110,390 54,793 52,449 - of which Voted 91,604 92,344 45,815 43,527 - of which Non-Voted 18,046 18,046 8,978 8,909
Notes
Revenue Departmental Expenditure Limit (£m)
(i) At Q2, total RDEL assumes the approval of the supplementaty estimate, where an additional £250m revenue is granted and a further £490m is transfered to revenue from capital spend. (ii) Whilst around 60% of NHS Providers remain in financial balance or better, the NHS Provider sector as a whole is forecasting a material net deficit. Action is being taken to address the underlying financial performance issues in the sector.
(iii) Prior year comparison of spend at organisational level are shown for the first time.
Financial Performance 2014-15
Segments Annual Plan 2014-15
Flexed Annual Plan 2014-15 (iv)
Actual Apr to Sept
2014-15
Actual Apr to Sept
2013-14
NHS England 320 270 135 96NHS Providers 3,338 3,363 1,262 1,257Health Education England 3 3 0 0DH 692 422 131 217Local Authorities 132 132 132 129Public Health England 103 61 11 9Other ALBs (v) 66 -87 -82 29Total Departmental Expenditure Limit (DEL) 4,654 4,164 1,589 1,736 - of which Voted 4,654 4,164 1,589 1,736 - of which Non-Voted 0 0 0 0
Notes
Capital Departmental Expenditure Limit (£m)
(iv) At Q2, total RDEL assumes the approval of the Supplementaty Estimate, where an additional £250m revenue is granted and a further £490m is transfered to revenue from capital spend. (v) Other ALBs figure includes £150m capital credit for recall of loan from outside the DH group to Business Services Authority

16
Annual Plan2014-15
Flexed Annual Plan 2014-15 (i)
Actual Apr to Sept
2014-15
Actual Apr to Sept
2013-14Total Annually Managed Expenditure (AME) - Voted 6,006 6,201 2,304 2,052Total Annually Managed Expenditure (AME) 6,006 6,201 2,304 2,052
Annual Plan2014-15
Flexed Annual Plan
2014-15
Actual Apr to Sept
2014-15
Actual Apr to Sept
2013-14Total Annually Managed Expenditure (AME) - Voted 10 15 1 0Total Annually Managed Expenditure (AME) 10 15 1 0
Notes(i) At Q2, the DH Group AME position reflects some uncertainty because the discount rate applied to provisions may be revised by HMT. In this case the affect of the estimate will be adjusted through the supplementary estimate.
Revenue Annually Managed Expenditure Limit (£m)
Capital Annually Managed Expenditure Limit (£m)
Total DH Group 2014-15 Administration Costs
Financial Performance 2014-15
Segments Annual Plan 2014-15
Flexed Annual Plan
Actual Apr to Sept
2014-15
Actual Apr to Sept
2013-14
Total Departmental Expenditure Limit (DEL) 109,650 110,390 54,793 52,436
of which Administration costs:NHS England 2,142 1,926 947 943NHS ProvidersHealth Education England 83 83 36 52DH Programme & Administration 341 445 122 137Local Authorities 236 223 32 120Public Health England 162 158 74 75Other ALBs 518 485 211 200Sub Total 3,482 3,320 1,422 1,527
Additional Admin above SR10 figure (i) 648 810 0 0
- of which Voted 4,130 4,130 1,422 1,527
Notes:
Revenue Departmental Expenditure Limit (£m)
(i) The DH Group Administration Limit for years 2010-11 to 2014-15 was set in the 2010 Spending Review (SR10) and has been reset for 2015-16 in SR13.
Like other government departments, the DH remains on course to deliver a one-third real reduction in the administration costs across SR10 against a lower trajectory subsequently agreed with HMT post SR10.

17
Total DH Group 2014-15 Net Cash Requirement
Financial Performance 2014-15Annual
Plan 2014-15
Actual Apr to Sept
2014 (i)
Actual Apr to Sept
2013
Actual Apr to Sept
2012Net Cash Requirements 95,699
Plus NICS receipts 18,046
Net Cash available 113,745 53,677 51,619 51,448
% of Net Cash available 100% 47% 47% 48%
Notes:(i) YTD cash usage in 2014-15 is lower as a % of total NCR than previous year. However, DH expectations are for one-off non-recurrent cash only transactions in the second part of 2014-15, for which NCR cover has already been approved.
18
-15,000
-10,000
-5,000
0
5,000
10,000
15,000
20,000
25,000
30,000
35,000
40,000
45,000
50,000
10/11 11/12 12/13 13/14
£m
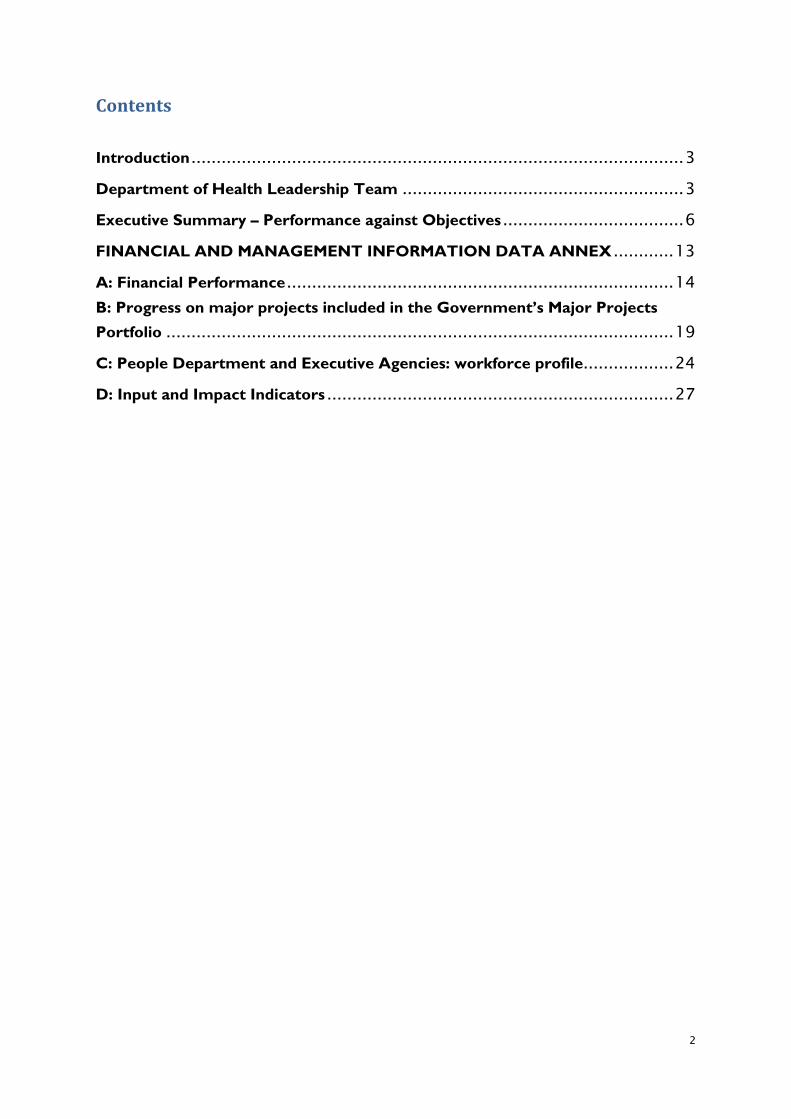
RDEL by expenditure type (in 14/15 prices) -
1. Admin Costs 2. Pay3. Agency spend 4. HCHS drugs5. Primary care/FHS 6. Primary care prescribing
Notes:
i. Trend analysis covers all years to date within the current Spending Review (SR10)
ii. All figures are presented at 2014-15 prices (real-terms)
iii. 2013-14 figures represent outturn per DH Annual Accounts
iv. Prior year figures represent Final Outturn as per DH Resource Accounts. 2014-15 figures are planned expenditure as per the 2014-15 Supplementary estimate
19
B: Progress on major projects included in the Government’s Major Projects Portfolio
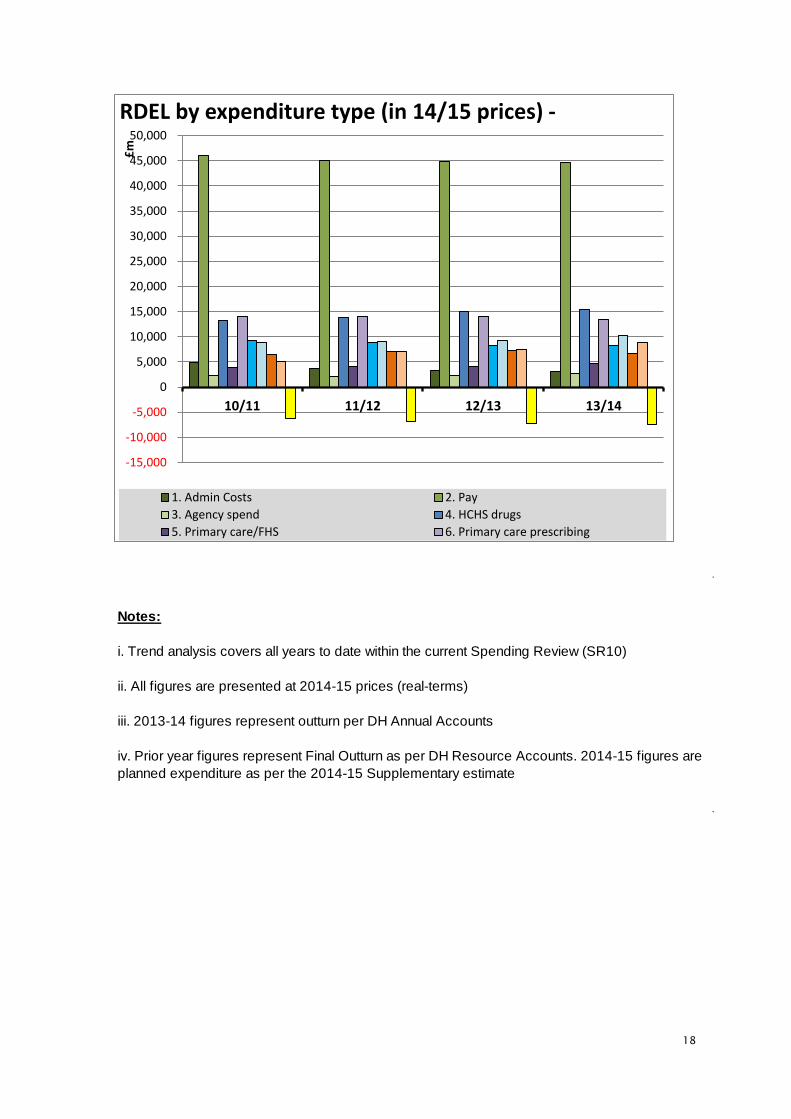
26. The table below provides the most recent information and progress on our major projects included in the Government's Major Projects Portfolio (GMPP) published in May 2013. This includes a Delivery Confidence Assessment rating, financial information (whole life cost, annual budget and forecast spend), project schedule and project narrative.
27. We continue to work on our major projects and deliver our commitment arising from the Major
Projects Authority that every Senior Responsible Officer and Programme Director in the Department participates in the Major Projects Leadership Academy programme of training.
Major Projects- top 5 (based on estimated cost).
Delivery Confidence (RAG)
Original completion date
Revised completion date
Original Budget (£m)
Estimated Cost (£m)
Public Health England Science Hub
Amber/Red 30/03/2021 30/03/2021 £6,237.56 £6,237.56
NME Programme for IT (CSC LSP Delivery Programme)
Amber 31/07/2016 31/07/2016 £5,636.19 £5,636.19
Health & Care Modernisation Transition Programme
Amber/Red 01/04/2013 01/04/2013 £1,485.20 £1,485.20
National Proton Beam Therapy Service Development Programme
Amber/Red 01/12/2018 01/13/2018 £1,312.94 £1,312.94
Public Service Network For Health (PSNH)
Red 10/10/2014 10/10/2014 £748.16 £748.16
Programme Description and Narrative Public Health England Science Hub The programme previously called Chrysalis evolved under the HPA from a new build on the Porton site to co-location of Porton elements (research, health protection services, and corporate services), Colindale and NIBSC on a single site in the vacated GSK Science Park at Harlow. HPA’s Chrysalis Programme focused on the urgent re-provision of the ageing, high security, high containment specialist microbiology laboratories at Porton Down that are a key part of the nation’s defence against novel and dangerous microbiological pathogens such as pandemic flu, Ebola, anthrax and many others. The programme transferred to Public Health England (PHE) on 31st March 2013. An independent due diligence review carried out for PHE supported the continued investigation of Harlow and allowed PHE to adopt Harlow as the preferred option for the OBC. The vision under PHE is currently being developed and will build upon and strengthen the strategic case for an integrated public health service. This will look at the creation of a new integrated centre operating as the “apex of a pyramid” of the PHE national network for local public health services and facilities, supporting the entirety of the new public health system;

20
- The best model for delivery of specialist national public health functions, looking at the benefits of colocation and virtual networks;
- The benefits for public health that can be realised by the creation of a new integrated centre across all three domains of public health – including the benefits to the model for improving the public’s health and reducing inequalities; •-The national leadership and international global health impact that results from an integrated centre; - The contribution to the national Plan for Growth through its work on innovative public health solutions and specialist translational research by creating opportunities for “wealth creation” and links to the life sciences strategy; - Working with industry and academia; - Working with the developing National Laboratories Strategy; - Future proofing the proposals so that the vision is flexible and can respond to the new requirements and economic environment in the future. RAG Commentary The programme has been liaising with MPA and cross-government reviewers on the programme. This has included sharing Programme Board minutes and risk/issue registers to provide assurance around the management of the programme. A Project Assessment Review (PAR) is planned for the next quarter to provide further assurance. This will be targeted on the specific objective of creation of a new vision for the programme under PHE and the ability to deliver a new Outline Business Case in the summer of 2014 and obtain a decision by the end of September 2014.
CSC LSP Delivery Programme CSC LSP Delivery Programme is the programme responsible for the implementation of digital health care records service in the North, Midlands and East of England. This programme is being delivered by CSC (Computer Sciences Corporation) as the Local Service Provider (LSP). The CSC contract consists of a number of Strategic Products aimed at different healthcare professionals working across multiple care settings. Where these Strategic Products were not sufficiently developed to provide all of the required functionality and benefits associated with them at the time required for deployment, a number of Interim Products were made available to NHS organisations for implementation. The Products will replace outdated legacy systems and manual processes for the capture of clinical information, enabling a number of benefits to providers, including; reducing the reliance on paper based process, improving safety of care and increasing operational efficiency and effectiveness. These Strategic and Interim Products will remain for the duration of the contract: * Strategic Products: • Lorenzo • TPP SystmOne • Medusa Emergency Care System (ECS) * Interim Products: • iPatient Manager (iPM) • iClinical Manager (iCM) • Evolution Maternity • HSW Child Health • Liquidlogic Single Assessment Process (SAP) • Surgical Interventions (ORMIS Theatres and IMS Instrument Tracking) The majority of this contract lasts until 7 July 2016. RAG Commentary A Programme Assurance Review occurred in February 2014 (joint between CSC and BT LSP Programmes). Its recommendations were focused on accelerating exit from the contracts, and gaining clarity on the strategy and relative system responsibilities after the LSP contracts expire. Action planning and activity is occurring, with an assurance of action plan expected summer 2014.
Health & Care Modernisation Transition Programme The objectives of the Transition Programme are to:
21
• Modernise the Health and Care System such that it will deliver Secretary of State’s vision as set out in the NHS and Public Health White papers. • Deliver the structural changes to the system on time and within the programme budget. • Ensure the transition of activities from the old system to the new system occurs smoothly, including the closure of entities and transfer of appropriate accountabilities. • Ensure the future system runs within the cost envelopes set out within CSR. • Ensure the health and care system maintains operational and clinical performance and emergency preparedness throughout the transition. RAG Commentary The Transition Programme closed when it delivered the health and care reforms on 1 April 2013. Since this time there has been a Major Projects Review Group review which looked at the reforms post implementation. This review made a number of recommendations concerning the governance and management of future benefits delivery within the Health and Care System. The assurance of benefits delivery is now contained within the work of the Assurance Division within the Department of Health reporting to the Executive Board at regular intervals.
National Proton Beam Therapy (PBT) Service Development Programme To develop a full PBT service in England that delivers the following aims and objectives:- 1) ensure that all patients, for whom evidence supports PBT as the most clinically effective treatment, receive treatment within a clinically appropriate service specification and to nationally agreed standards. 2) to ensure that services provided enable the continued development of the technologies involved and that workforce and training issues are appropriately addressed. 3) to deliver improved outcomes by ensuring that patients have access to high quality modern radiotherapy techniques comparable to those used in other European countries, to improve patients' experience by minimising any long term side effects of treatment. In particular to :- a) develop a PBT service that meets the objectives as stated in the SOC December 2011 b) oversee the facilities projects to ensure that the two sites develop a service that meets Commissioner's specifications to time and budget c) monitor the facilities projects financial governance arrangements to ensure that it delivers value for money d) manage the transition from an overseas service to a service in England e) identify and manage the impact of the PBT service on other clinical services f) develop a national clinical network g) ensure that a research strategy is in place that informs the future development of the service h) manage the impact of workforce across radiotherapy services. RAG Commentary Following the MPA Delivery Confidence Assessment rating of Amber/Red, a detailed Management Action Plan was developed in consultation with the key Programme stakeholders which identified specific actions to be taken to address the findings from the MPA Review. Due to the complexity and unique nature of the Programme, targeted actions were implemented leading to: 1. Changes in the leadership and governance arrangements for the Programme to enhance the overall robustness by supporting the delivery and effective management of the current phase which largely involves procurement of the equipment, assurance and securing the necessary Government approvals. 2. A revamp of the Programme environment providing clarity to where accountability and responsibilities lies at the various tiers of the National Programme, for example, o DH is providing leadership and responsible for: i. Capital Funding ii. Programme management and delivery iii. Approvals and assurance using mandatory Cabinet Office and HM Treasury processes. o NHS England is providing leadership and responsible for: i. Commissioning ii. Clinical Services and Referrals

22
iii. Mobilisation of PBT Services iv. Clinical Policy development v. Benefits Management and Realisation vi. Engagement with key stakeholders including the Devolved Nations and professional organisations vii. Research and Development. 3. Improvements in the resource levels including confirmation of the core Programme team and use of subject matter experts in specific areas such as the role of a national clinical lead for PBT, workforce strategy and development, and communications. 4. Structured and coordinated stakeholder engagement – in particular, the establishment of a National PBT Special Interest Group (SIG) with the active participation of the relevant Clinical Reference Groups (CRGs); Health Education England (HEE); professional organisations such as The Royal College of Radiologists (RCR), The Society and College of Radiographers (SCoR), Institute for Physics and Engineering in Medicine (IPEM). In addition, the Programme also has access to the expertise of specialists in the related fields relevant to developing a national PBT service in England. Early work has commenced to develop a national plan for the clinical management of patients who have been clinically assessed to benefit from PBT treatment. Part of this work involves the review and expansion of the clinical indications list via the new NHS England processes through the development of clinical policies by engaging with the relevant CRGs as a longer term strategy for the viability of a National PBT service. The culmination of these actions has put the Programme on a much improved pedestal in terms of governance, resources, communications, stakeholder engagement and the plans towards the delivery of sustainable benefits.
Public Service Network for Health (PSNH) The project will deliver a Wide Area Network (WAN) to support the needs of health and care in delivering business critical services and systems. Currently, N3 gives pervasive access to health to a range of national applications and N3 services such as VOIP and Video Conferencing and is fundamental to NHS service delivery. The deployment of a future WAN on the expiration of N3 (currently March 31st 2014) is essential for ensuring health and care is able to deliver services and quality care to patients. Furthermore, the information sharing needs across the public sector are growing exponentially. This investment will deploy a compliant Public Services Network for Health which will not only ensure interworking within health and care but also between the wider public sector. This will also enable access to the legacy N3 infrastructure during transition which will ensure health and care can transition from N3 to PSNH without loss of service, it is envisaged transition will last up to 3 years. The specific objectives are: • To underpin the Information Strategy by permitting the flow of electronic information between health and social care organisations. • To comply with government policies for the use of shared services. • To recognise and support health and care providers’ choice in their ICT by enabling devolved infrastructure procurement. • To facilitate a private network that meets information security standards. • To enable flexible communications infrastructure. • To provide continuity of Service RAG Commentary PSNH was rated RED Delivery Confidence at MPA Gateway 2 Review. While progress has been made against the recommendations, Delivery Confidence remained RED due to the dependency upon the N3 programme to achieve extension. N3 Delivery Confidence was RED as the extension business case has failed to gain approval. Any approval to spend from 1st April for N3 became contingent upon moving into the termination period provided for in the contract and agreeing a revised commercial position with BT.

23
In addition, a clear agreement on future strategic intent was needed before the approval for N3 could be granted. To ensure PSNH can deliver successfully, continuity of service for the current N3 was necessary, to enable the requisite time for procurement and implementation. Therefore, due to N3 having a Delivery Confidence of RED for the current service and the delivery of the revised business case, PSNH Delivery Confidence was also stated as RED. N3 has subsequently moved into transition and funding has been approved. Agreement on the future strategic intent for health and care networking has also been agreed with the Cabinet Office as part of the approval; the PSNH programme is now working to achieve the commitments made by the end of June 2014. Delivery Confidence rating remains RED as any future approvals for PSNH are contingent on ensuring the commitments within the strategic intent are evaluated and progressed by the end of June 2014

24
C: People Department and Executive Agencies: workforce profile
Source: data.gov.uk Commentary 28. This data is derived from Workforce Management Information reports, which are published
monthly. Figures are reported on a full-time equivalent basis.
29. The significant increase in workforce size since 2012, (both payroll staff and contingent labour) for Executive Agencies is explained by:-
• the creation of a new Agency, Public Health England on 1st April 2013, which was formed by a merger of the Health Protection Agency and the transfer of functions and staff from other organisations as part of the reform of the Health and Care System.
• the transfer of the National institute for Biological Standards and Control into the Medicines and Healthcare products Regulatory Authority.
30. The contingent labour numbers and costs have reduced since 2013. The continued use of contingent labour enables the organisations to retain flexibility to flex their organisation structures and design and to fill some specialist roles where external expertise is required. Average costs and a comparison of our grade levels are provided below.
Department and Agencies Workforce Size
Figures at 30-9-2012
Figures at 30-9-2013
Figures at 30-9-2014
Payroll Staff (full-time equivalent)
Core Department 2,260 1,854 1,894
Executive Agencies 898 6,020 6,465
Total 3,158 7,874 8,358
Average Payroll Staff Costs £54,985 £58,999 £54,977 Contingent Labour (full-time equivalent)
Core Department 371 339 206
Executive Agencies 50 313 195
Total 421 652 402
Average Contingent Labour Staff Costs £79,338 £100,803 £86,771

25
Staff survey data
31. Recent data shows improvement with the engagement index rising from 53% in 2012 to 58% in 2014 and there were positive responses across many domains, including leadership and managing change, and understanding how we fit into the wider health and care system. This is very encouraging given we are a time of real change. The staff survey results are always used to target further improvements at corporate level, and teams across the Department have used the results to inform local action plans. The positive trajectory is encouraging but we recognise there is more to do to achieve the ambition to be in the top quartile of civil service Departments.
£58,999
£79,338
£54,985
£100,803
£54,977
£86,771
£-
£20,000
£40,000
£60,000
£80,000
£100,000
£120,000
Average Payroll Staff Costs Average Contingent Labour Costs
Average Costs, DH and Agencies
Sep-12
Sep-13
Sep-14
6
17
34 32
10
14 14
36
26
10 13 14
36
28
8
0
5
10
15
20
25
30
35
40
AO/AA EO SEO/HEO Grade 6/7 SCS
Perc
ent
Comparison of grade levels, DH and Agencies (%)
Sep-12 Sep-13 Sep-14

26
Department only; People Survey Metrics Most recent comparable points 2012
Most recent comparable points 2013
Most recent comparable points 2014
Engagement Index (%) 53% 57% 58%
Theme Scores (%)
Leadership and Managing Change 32% 39% 40%
My Work 73% 75% 77%
My Manager 67% 69% 71% Organisational Objectives and Purpose 66% 76% 77%

27
D: Input and Impact Indicators
32. The Department of Health leads the health and care system in delivering improved outcomes. Focusing on outcomes, rather than on top down targets, supports innovation, increases the safety and effectiveness of services, and improves patient and user experience. The right information, focused on what matters to people, supports commissioners and providers of care to drive up standards. It supports them to identify local priorities for care and support, and allows them to measure how quickly improvements are being made towards those priorities.
33. There are three outcomes frameworks, one each for the NHS, public health and adult social care. The
frameworks set common goals for the health and care system as well as providing an overview of how the system is performing.
34. They enable the Secretary of State to hold the system to account and set out nation areas for improvement and how that improvement will be measured. These national priorities exist alongside local priorities. Together the outcomes frameworks mean that common challenges are highlighted at the local level across the health and care system. They inform local priorities and joint action while reflecting the different ways that services are held accountable. Data from the three outcomes frameworks is published online for the public to hold their local services to account. This is part of the Government and Department’s wider drive to increase the transparency and accountability of public services.
35. A selection of these indicators across the three Frameworks are published quarterly. The Q2 2014-15
publication has been provided below showing also how the data is measured.

28
Impact Indicators Current (Sept 2014) Previous (June 2014) Indicator format (details in separate annex)
Potential years of l ife lost from causes considered amenable to healthcare (males)
2556 (2012 calendar year)
2711 (2011 calendar year) ↓
The trend continued to improve in 2012. The data has been adjusted for the new European Standard Population, which has resulted in an increase in the standardised rate. The trend remains downwards.
Potential years of l ife lost from causes considered amenable to healthcare (females)
2063 (2012 calendar year) 2122 (2011 calendar year) ↓
The trend continued to improve in 2012. The data has been adjusted for the new European Standard Population, which has resulted in an increase in the standardised rate. The trend remains downwards.
Life expectancy at 75 (males) 11.3 (2012 calendar year)
11.3 (2011 calendar year) ↔ Life expectancy for men did not increase in 2012, for the first time since 1999
Number of years
Life expectancy at 75 (females)13.0 (2012 calendar year) 13.2 (2011 calendar year) ↓
Life expectancy for women dropped in 2012, for the first time since 2003 Number of years
Infant mortality 4.0 (2012) 4.2 (2011) ↓ The rate continues to fall . Per 1,000 l ive births
Life expectancy/differences: at birth (males) (years) 9.2 (2010-12) 9.4 (2009-11) ↓
Time periods 2009-11 and 2010-12 overlap, so assessment of change between these periods should be treated with caution. However, the difference in l ife expectancy for males across deprivation deciles, as measured by the Slope Index of Inequality, showed little change between 2009-11 and 2010-12. Over a longer period (since 2002-04), there has been l ittle change in inequality in l ife expectancy by area deprivation.
Life expectancy/differences: at birth (females) (years) 6.8 (2010-12) 6.9 (2009-11) ↓
Time periods 2009-11 and 2010-12 overlap, so assessment of change between these periods should be treated with caution. However, the difference in l ife expectancy for females across deprivation deciles, as measured by the Slope Index of Inequality, showed little change between 2009-11 and 2010-12. Over a longer period (since 2002-04), there has been l ittle change in inequality in l ife expectancy by area deprivation.
Healthy l ife expectancy/differences: at birth (males) (years)
19.4 (2010-12) 19.3 (2009-11) ↑
Time periods 2009-11 and 2010-12 overlap, so assessment of change between these periods should be treated with caution. However, the difference in healthy l ife expectancy for males across deprivation deciles, as measured by the Slope Index of Inequality, showed little change between 2009-11 and 2010-12. (Earlier data is not available).
Healthy l ife expectancy/differences: at birth (females) (years)
19.8 (2010-12) 20.1 (2009-11) ↓
Time periods 2009-11 and 2010-12 overlap, so assessment of change between these periods should be treated with caution. However, the difference in healthy l ife expectancy for females across deprivation deciles, as measured by the Slope Index of Inequality, showed little change between 2009-11 and 2010-12. (Earlier data is not available).
Low birth weight of term live births (%)
2.94 (2011) 2.85 (2010) ↑
There is a very sl ight increase in the percentage of low birth weight of term live births in 2011 compared to previous year.
%
Low birth weight of all l ive births where the most advantaged of either parent’s occupation is classified as managerial, professional or intermediate(%).
6.03 (2012)* 6.4 (2011)* ↓
ONS no longer publishes birthweight by father’s socio-economic classification (NS-SEC). In 2012, ONS have used the most advantaged NS-SEC of either parents which creates a household level classification rather than the previous father’s classification. As a result of these changes, the data from 2012 are not comparable to figures before 2011. * based on data for England and Wales as the England only data is not currently available.
%
Low birth weight of all l ive births where the most advantaged of either parent’s occupation is classified as routine and manual occupations, never worked or long-term unemployed (%).
7.14 (2012)* 6.8 (2011)* ↑
ONS no longer publishes birthweight by father’s socio-economic classification (NS-SEC). In 2012, ONS have used the most advantaged NS-SEC of either parents which creates a household level classification rather than the previous father’s classification. As a result of these changes, the data from 2012 are not comparable to figures before 2011. * based on data for England and Wales as the England only data is not currently available.
%
Mortality rate from causes considered preventable
139.2 (2012) 143.3 (2011) ↓
In England preventable mortality rates decreased by 24% from 2003 to 2012 (from 183.8 per 100,000 in 2003 to 139.2 per 100,000 in 2012)
European age-standardised rate per 100,000 population
Brief commentary on data trend
Differences in l ife expectancy at birth by deprivation decile across England, as measured by the Slope Index of Inequality
Differences in healthy l ife expectancy at birth by deprivation decile across England, as measured by the Slope Index of Inequality
Department of Health Business Plan 2013-15 impact and input indicators - Sept 2014
European age-standardised rate per 100,000 population
Better Health and Well-being for all

29
Impact Indicators Current (Sept 2014) Previous (June 2014)Indicator format (details in separate annex)
Health related quality of life for people with long term conditions
0.74 (2013-14) 0.74 (2012-13) ↔
Unchanged over 3 years.Average self reported score measuring health status, with 1 representing perfect health
Emergency admissions (avoidable)
312.7 (Q4 2012-13) 314.7 (Q3 2012-13) ↓
This indicator was recalculated using rebased population figures (ie updated after the latest Census), which affected all the figures, and were published on February 2014. Increasing trend in the rate for the period 2003/04 to 2012/13 for all persons, males and females – average increase of 4% per year for all persons. This is the opposite of what can be seen for emergency admissions due to ambulatory care sensitive long-term conditions, which showed a decreasing trend over the same time period.
Rate per 100,000 population
Emergency readmissions within 30 days of leaving hospital
11.78 (2011-12) 11.78 (2010-11) ↔
Steady increase of emergency readmissions within 30 days for persons, males and females from 2002/03 to 2010/11 which levels out in 2011/12. The readmission within 30 days percentage for persons increased from 9.5% in 2002/03 to 11.78% in 2011/12.
Percentage of emergency admissions
Patient experience: primary care (GP services)
85.7(Jul 2013 - Mar 2014)) 86.74 (Jul 2012-Mar 2013) ↓
Latest data shows a small but unfavorable reduction of 1% on the previous period in the number of people rating their experience as Good or Very good. Due to the changes to the questionnaire design and survey frequency, as well as the change to the weighting methodology, no results from 2011-12 onwards can be compared to previous years, even where questions remain the same.
Patient experience: primary care (GP out of hours services)
66.2 (Jul 2013 - Mar 2014) 70.21 (Jul 2012-Mar 2013) ↓
Latest data shows an unfavorable reduction of 6% on the previous period in the number of people rating their experience as Good or Very good. Due to the changes to the questionnaire design and survey frequency, as well as the change to the weighting methodology, no results from 2011-12 onwards can be compared to previous years, even where questions remain the same.
Patient experience: primary care (NHS dental services)
84.2 (Jul 2013 - Mar 2014) 83.98 (Jul 2012-Mar 2013) ↑
Latest data shows a small but favorable increase of 0.2% on the previous period in the number of people rating their experience as Good or Very good. Due to the changes to the questionnaire design and survey frequency, as well as the change to the weighting methodology, no results from 2011-12 onwards can be compared to previous years, even where questions remain the same.
Patient experience: hospital care
76.9 (2013/14) 76.5 (2012/13) ↑
Latest data shows an improvement of 0.5% on the previous period in the average score of hospital care. There is no clear trend in the data over time but the latest value of 76.9 is the highest for nine years. A score of 80 would suggest that patients, on average, found the service “very good”. Survey - score out of
100
Quality of life for adults receiving social care
19.0 (2013-14 Prov) 18.8 (2012-13) ↑
Data series shows slight improvement over each of the last 4 years from 18.7 in 2010-11 to 19.0 in 2013-14 Survey - score out of 24
Satisfaction with adult social care services
64.9 (2013-14 Prov) 64.1 (2012-13) ↑
Data series shows continued improvement over each of the last 4 years from 62.1% in 2010-11 to 64.9% in 2013-14 Survey - percentage
very or extremely satisfied with services received
Safety incidents reported by NHS/healthcare provider that lead to severe harm or death
4.4 (Jul - Sept 13) 4.8 (Jan-Mar 13) ↓
Latest data shows a 9% decrease on the same period from the previous year. The general upward trend observed since 2009 has been seen as positive – reflecting increased will ingness to recognise and address safety problems. The decrease observed in the latest data is counter to that trend but interpretation is somewhat difficult to make due to the known under-reporting of incidents involving severe harm or death. The decrease may either represent a reduction in the rate of actual or reported incidents.
Safety incidents reported by NHS/healthcare provider
738 (Oct - Dec 13) 715 (Apr-Jun 13) ↑
Latest data shows 10% increase on same period in the previous year. This change is in l ine with the steady, upward trend seen over recent years. Higher number of incidents is l ikely due to increased reporting because levels of reporting are believed to be less than levels of occurrence. For the time being, therefore, increases in the indicator are being seen as positive – reflecting increased will ingness to recognise and address safety problems.
Better Care for all
Department of Health Business Plan 2013-15 impact and input indicators - Sept 2014
Brief commentary on data trend
Survey - percentage rating their experience as Good or Very good
Per 100,000 population

30
Impact Indicators Current (Sept 2014) Previous (June 2014) Indicator format (details in separate annex)
Input Indicators
Unit cost of treatment for patients staying in hospital for treatment they have chosen (£)
1317 (2012-13) 1303 (2011-12) ↑
Steady but stable increase since 2008/09. Average increase of 1.9% per year since 2008/09.
Unit cost of treatment for patients staying in hospital for emergency treatment (£)
1610 (2012-13) 1570 (2011-12) ↑
Stable increase since 2008/09, increasing on average by 2.3% per year.
Unit cost of patients visiting hospital for treatment (£)
111 (2012-13) 108 (2011-12) ↑
Small year on year increase. Unit cost was £100 in 2009-10.Cost per A&E or Outpatient attendance including Outpatient procedure and Cancer Multi-Disciplinary Team patient treatment plan
Unit cost of patients being treated for mental health problems (£)
25 (2012-13) 28 (2011-12) ↓Mental health care clusters were introduced in 2011-12 and replaced pre-existing collection methodology. Therefore unit costs are not directly comparable to prior years.
Cost per attendance, occupied bed day, contact, Cluster days and initial assessment
Unit cost of a prescription item dispensed in the community
8.37 (2013) 8.52 (2012) ↓
The downward trend since 2004 continues. This has seen the average cost of an NHS prescription item fall by almost 29% as the NHS continues to get better value from the £12m+ spent on NHS medicines and appliances each year.
Average net ingredient cost per NHS prescription item dispensed in the community
Breakdown of adult social care spend (£ bil l ion)
17.2 (2013-14 prov) 17.2 (2012-13) ↔
Almost unchanged (an increase of 0.4%) in cash terms from 2012-13, but this represents a 1.3% decrease in real terms. Relative to the period five years earlier (2008-09), when the figure was £16.1 bil l ion, expenditure increased by 7.2% in cash terms (a decrease of 3.3% in real terms).
Gross adult social care expenditure (incl. Supporting People)
Unit cost of receiving community care (£) 52 (2012-13) 51 (2011-12) ↑
Cost is stable and has fluctuated around £50 since 2008/09
Cost per attendance, contact, visit and vaccination
Unit costs: older people residential and nursing care (£)
537 (2013-14 prov) 522 (2012-13) ↑
An increase of 3% in cash terms from 2012-13, which represents a 1.2% increase in real terms. Relative to the period five years earlier (2008-9), when the figure was £497, the unit cost increased by 8.3% per cent in cash terms (a decrease of 2.3% in real terms).
Average gross weekly cost
Unit costs: older people home help (£)
17 (2013-14 prov) 17 (2012-13) ↔
An increase of 3.3% in cash terms from 2012-13, which represents a 1.6% increase in real terms. Relative to the period five years earlier (2008-9), when the figure was £15.17, the unit cost increased by 14.1% in cash terms (an increase of 2.9% in real terms).
Average gross hourly cost
Unit costs: older people day care (£) 116 (2013-14 prov) 103 (2012-13) ↑
An increase of 12.7% in cash terms from 2012-13, which represents an 10.8% increase in real terms. Relative to the period five years earlier (2008-09), when the figure was £75.81, the unit cost increased by 52.7% per cent in cash terms (equivalent to a 37.8% increase in real terms). `
Department of Health Business Plan 2013-15 impact and input indicators - Sept 2014
Brief commentary on data trend
Better Value for all
Cost per Finished Consultant Episode

31