Embed Size (px)
Citation preview

Background on the presentation: I presented this at a mid-year
sales meeting. Other than a few screen shots of ESPN to set
the stage and photos from the web, I created all of the graphics
and matched the look and feel of their set/programming. I took
out the numbers and graphs we used to protect the innocent.
I wish I could give you the audio to capture how entertaining the
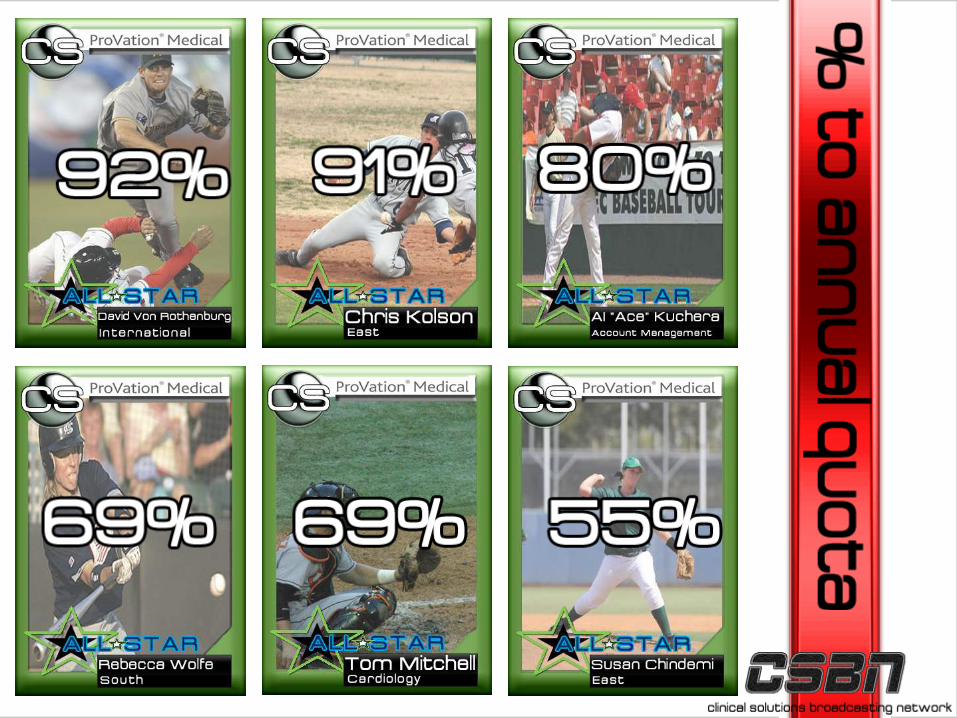
team found it. Baseball cards were a big hit with the
team…especially because of resemblances.
At the conclusion of this presentation a seasoned sales rep that
joined our team came up to me and gave me one of the highest
compliments of my career. Humbled by it actually.“I have been in medical sales for over 20 years, working for (big companies X & Y—
I’m being nice) and this is the best presentation I have ever seen.”
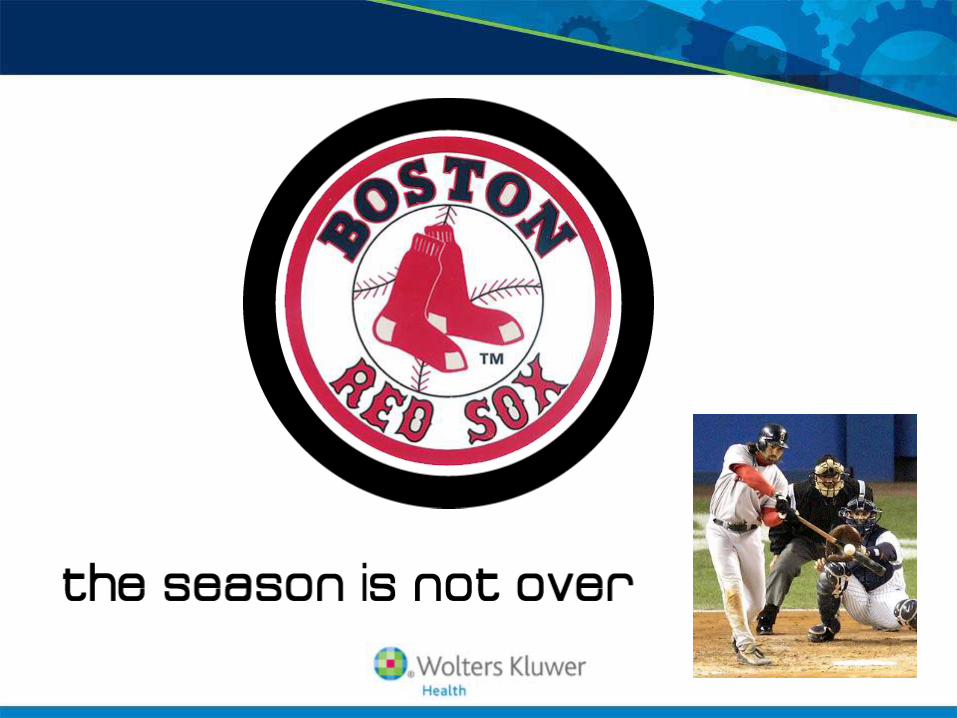
ENJOY!!!

2010 Half Time Report
Brian Stout
Clinical Solutions


Revenue $XXX.XM vs. $XXX.XM (LE1)
YOY Growth 15.9% H1
EBITA $XX.XM with a margin of XX.X% vs. XX.X% (LE1) +19.4% YOY
Growth
Orders $XX.XM vs. $XX.XM +8.7% to H1 Order Plan


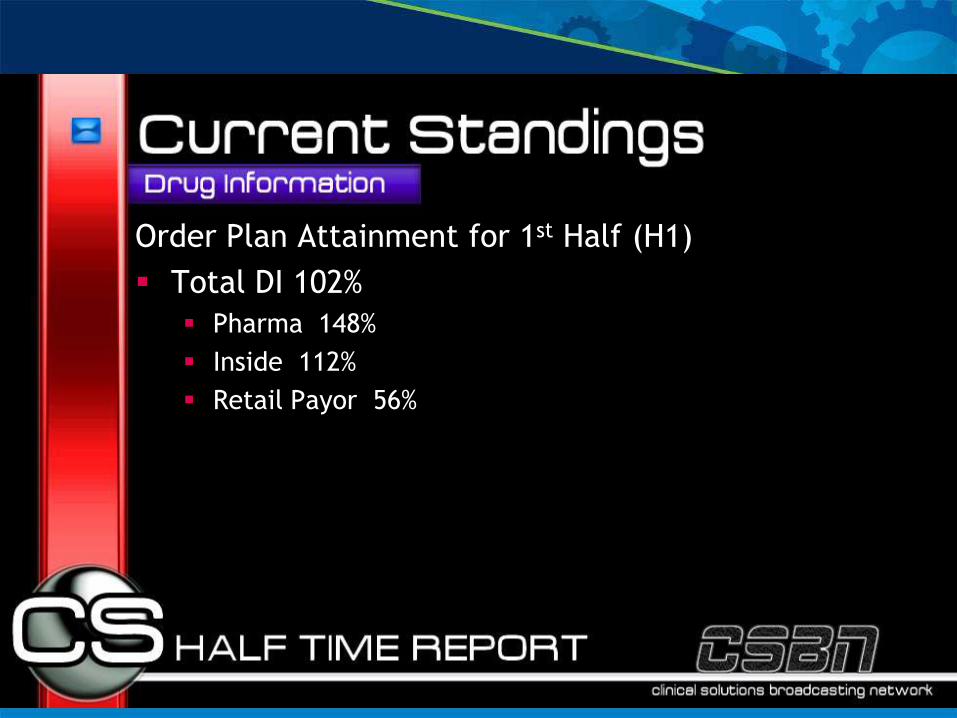
Order Plan Attainment for 1st Half (H1)
Total PVM 124%
International 264%
East 156%
West 121%
North 90%
South 57%

Order Plan Attainment for 1st Half (H1)
Total DS 106%
East 108%
EMR 108%
West 105%
Order Plan Attainment for 1st Half (H1)
Total DI 102%
Pharma 148%
Inside 112%
Retail Payor 56%

Orders Plan Attainment 1st Half (H1)
Total UTD 84%
Central $K
Southeast $K
Pacific $K
Northeast $K
W. Canada $K
E. Canada $K
Standalone $K

big deals were here

big deals were here

big deals were here

big deals were here


Future Stars of 2010

$XXX.XM Revenue Remaining
$XX.XM of EBITA Margin Remaining
$XX.XM of New Orders Remaining
Contained slides for each BU

Whiteboard Summary