Embed Size (px)
Citation preview

DEMONSTRATION OF BECHTEL'S CONFINEDZONE DISPERSION PROCESS AT PENNSYLVANIA
ELECTRIC COMPANY'S SEWARD STATIONPROJECT STATUS
Joseph J. Battista Jr. Allen G. RubinProject Manager Project Manager
Pennsylvania Electric Company Bechtel Corporation
Jack Z. ' brains Arthur L. BaldwinProject Engineer Project Manager
Bechtel Corporation DOE's Pittsburgh Energy TechnologyCenter
Abstract
The U.S. Department of Energy and Bechtel Corporation are cooperating in a jointproject to demonstrate Bechtel's Confined Zone Dispersion (CZD) Technology. Thedemonstration is being conducted at Pennsylvania Electric Company's (Penelec's)Seward Station on Boiler Unit #15. This boiler is a 147 MWe pulverized coal-firedunit, which utilizes Pennsylvania bituminous coal (approximately 1.2 to 2.5 percentsulfur). One of the two flue gas ducts leading from the boiler was lengthened andretrofitted with the CZD technology. The new long straight duct replaced theoriginal multi-bend duct to ensure a residence time of about 2 seconds. The goal ofthis demonstration is to prove the technical and economic feasibility of the CZDtechnology on a commercial scale. The process can achieve 50 percent sulfur dioxide(SO2) removal at lower capital and O_v[ costs than other systems.
The CZD process involves injecting a finely atomized slurry of reactive lime intothe flue gas ductwork of a coal-fired utility boiler. The principle of the confinedzone is to form a wet zone of slurry droplets in the middle of the duct confined inan envelope of hot gas between the wet zone and the duct walls. The lime slurryreacts with part of the SO2 in the gas and the reactive products dry to form solidparticles. An electrostatic precipitator (ESP), downstream from the point ofinjection, captures the reactive products along with the fly ash entrained in the fluegas.
- 319 - SecondAnnual Clean Coal TechnologyConference

The test program is being conducted in two parts. The first part, parametric testing,started on July 10, 1991, and was completed on August 17, 1992. During this period,Bechtel's objective was to carry out a factorial test program to optimize theperformance of the CZD process. The test program was designed to developoperating conditions to achieve a highly reliable and low-cost operation. Thesecond part, from August 17, 1992 to August 30, 1993 will complete the project.Based on the results of the parametric test program, Bechtel performed additionaldesign, procurement, installation, and facility construction as necessary to permit a12-month continuous demonstration. The CZD system is fully instrumented andintegrated with the operation of Penelec's Boiler Unit #15. The purpose of theproject is to demonstrate the performance of the CZD process for SO2 removalwithout significantly affecting either boiler operations or plant particulateemissions. Penelec is operating the system during the continuous demonstration asa normal part of the operation of Boiler Unit #15. Bechtel is supervising thedemonstration and carrying out various performance tests, data acquisition, andchemical analyses.
Results of the demonstration indicate that the CZD process can achieve costs of$300/ton of SO2 removed. Based on a 500 MWe plant retrofitted with CZD for a 50percent SO2 removal rate, the total capital cost is estimated at less than $30/kWe.The cost includes lime unloading, lime handling, and fully automated operation.The variable operating cost for this retrofit is estimated at less than 3.0 mills/kWh.
Introduction
The CZD process involves flue gas post-treatment. It is located between the boileroutlet and the particulate collector, an ESP in most of cases.
The features that distinguish the Bechtel CZD process from other similar injectionprocesses are the following:
• Injection of an alkaline slurry directly into the duct. Other processes useinjection into a conventional spray-dryer vessel or injection of dry solidsinto the duct ahead of a fabric filter.
• Use of an ultrafine calcium/magnesium hydroxide, Type S pressure-hydrated dolomitic lime. This commercial available product is made fromplentiful, naturally occurring dolomite.
•- Low residence time, made possible by the highly effective surface area of theType S lime.
• Localized dispersion of the reagent. Slurry droplets contact only part of thegas, while the droplets are drying, to remove up to 50 percent of the SO2.The process uses dual fluid rather than rotary atomizers.
Second Annual Clean Coal TechnologyConference - 32,0-

• _tproved ESP performance via gas conditioning from the increased watervapor content and lower temperatures. As a result, supplementalconditioning with SO2 is not necessary for satisfactory removal of particulatematter.
The waste product is composed of magnesium and calcium sulfites and sulfate, withexcess lime and fly ash. The waste fly ash mixture usually has pozzolanic properties.The mixture is self-stabilizing because of the excess lime and tends to retain heavymetals in insoluble forms within the fly ash.
CZD-FIue Gas Desulfurization(FGD) Demonstration as Part of DOE's Clean CoalTt_:hnology Demonstration Program
The U.S. Department of Energy and Bechtel Corporation have agreed to acooperative effort to demonstrate the Bechtel-developed CZD technology atPennsylvania Electric Company's Seward Station. DOE provided half, or $5.2million, of the project's total $10.4 million cost. Others contributing to the projectare Pennsylvania Electric Company ($3 million), Bechtel ($3.3 million), thePennsylvania Energy Development Authority ($750,000), New York State Electricand Gas Corporation ($100,000), and Rockwell Lime Company ($23,000).Pennsylvania Electric Company is providing the project's demonstration test site,Seward Station.
The costs of this demonstration have exceeded the $10.4 million budget, and BechtelCorporation has contributed an additional $1.2 million.
Current CZD activities at Seward Station are directed toward demonstrating the bestpossible atomization and dispersion of the SO2 absorbing slurry in flue gas and theperformance of the existing precipitator to handle the increased dust load withoutadverse effects on the stack gas opacity.
The CZD project at Seward Station includes replacement of the original flue gas duct(35-foot-long segments connected with 45° elbows and corresponding turning vanes)with one new 110-foot-long straight duct ahead of the ESP.
The test program consists of two distinct periods:
• In the first period, daily factorial runs were conducted to test differentatomizers, limes, and slurry concentrations. First period results were used toset and optimize the second period operations.
• In the second period, the performance of a continuously running CZDsystem is being demonstrated under actual power plant operatingconditions. The CZD demonstration is integrated into one half of the fluegas capacity of the commercial unit (147 MW) operating continuously threeshifts a day, seven days a week.

Purpose of the Test Program
The primary objectivesof the projectare to:
• Achieve an SO2removal rate of 50 percent
• Realize SO2removal costsbelow $300/ton
• Eliminate negative effects on normal boiler operations without increasingparticulate emissions and opacity
The CZD process has been automated and integrated with only one of the twoexisting modules of air preheater, flue gas duct, ESP, and induced draft fan associatedwith Unit No. 15. All auxiliary subsystems, such as lime slurrying, degritting, andlime slurry handling, have also been automated.
The demonstration project is permitting optimization of the system for applicationat different locations by determining the:
• Degree of atomization (slurry/compressed air ratio) versus length of ductrequired for evaporation of atomized slurry
• Maximum volume of slurry that can be injected per square foot of duct crosssection and the confined zone dimensions of the duct cross section that willprevent deposits on duct surfaces
• Effect of flue gas inlet temperature on the evaporation characteristics, SO2removal, and alkali utilization
Other objectives of the demonstration project include:
• Performing comparison tests of hydrated calcitic lime and freshly slakedcalcitic lime
• Testing methods for improving ESP performance during lime injection by:
- Monitoring ESP operating and opacity variations during all injectiontests
- Performing particulate emission measurements on several extendedruIls
• Testing different slurry atomizers to determine the most ener_-efficient anderosion-resistant
• Testing the effect of burning higher sulfur coal on the percentage ofSO2/NOx removal
Description of the CZD Process
The spray of lime slurry is injected close to the center of the flue gas duct parallel tothe flow of gas. As a cone of spray moves downstream and expands, the gas withinthe cone cools and its SO2 is rapidly absorbed by the liquid droplets.
I I II II
SecondAnnual Clean Coal TechnologyConference - 32,2,-

Spray droplets on the outside of the cone mix with the hot gas and dry very rapidly.With the proper choice of slurry concentration and injection rate, drying will becomplete before the droplets contact the walls of the duct. The process does require asuffident length of straight duct downstream from the sprays, estimated at 100 feet,and the gas flow must be reasonably uniform where the spray is injected. Judidoususe of the turning vanes, typically installed to minimize pressure drops, makes thegas flow in the bends more uniform.
By carefully positioning lime slurry atomizers, it is possible to obtain a wet zone inthe middle of the duct with an envelope of hot gas between the wet zone and theduct walls. This is the principle of the confined zone.
Gas velocity in large ducts is generally about 60 fps at full load, and the flow is highlyturbulent. Thus, spray droplets in the expanding cone are transported outward byeddy diffusion. However, since the outward cone's diffusing droplets continuouslycontact hot gas at about 300°F, they rapidly achieve surface dryness. Exposed to thehighly localized full concentration of SO2, the lime reacts extremely rapidly.
At a certain point downstream, the free moisture in the spray will evaporatecompletely, and the remaining dry solids can contact surfaces of the duct or theturning vanes without adhering and causing deposits to accumulate.
For removal of 50 percent of the SO2 from flue gas with a slurry of pressurizedhydrated dolomitic lime (PHDL), slurry concentration is a major variable. Enoughslurry must be added to achieve the desired results. The demonstration programprovides an opportunity to explore and optimize the control of this variable.
The chemical mechanism required for the absorption of SO2 from the flue gas issimple and very well known. In the presence of water, SO2 from the flue gas isabsorbed as sulfurous acid:
SO2 + H20 ") H2SO3
In the presence of water, pressure-hydrated dolomitic lime reacts instantaneouslywith H2SO3, producing calcium and magnesium sulfites and sulfates:
Ca(OH)2 . Mg(OI-I)2 + 2H2SO3 -') CaSO3 + MgSO3 + 4H20
CaSO3 + 1/202 --; CaSO4
MgSO3 + 1/202 --) MgSO4
Past CZD Experience
Over the last few years, considerable testing of the CZD technology was performed asproof-of-concept on pilot and commercial units. The encouraging results led to the
llIIIlll I II
- 323 - Second Annual Clean Coal TechnologyConference

new phase of demonstrating the process in a commercial unit. References 2, 3, 4,anc 5 describe the test programs and the test results of the earlier work.
Overall System Description
Figure 1 shows a simplified, overall flow diagram of the Seward CZD system and ofthe Boiler Unit No. 15 flue gas system. The two systems are closely linked. Theboiler has twin air and flue gas systems, designated "A" and "B." The CZD systemremoves SO2 from the B flue gas stream.
The overall CZD system includes the following process operations and supportingfunctions:
• Lime slurry preparation
• Lime slurry feed
• Lime slurry injection
• FGD duct (flue gas desulfurization section)
• Atomizing air compression
Figure 1 Seward Station Overall Process Flow Diagram
Second Annual Clean Coal TechnologyConference - 32,,4-
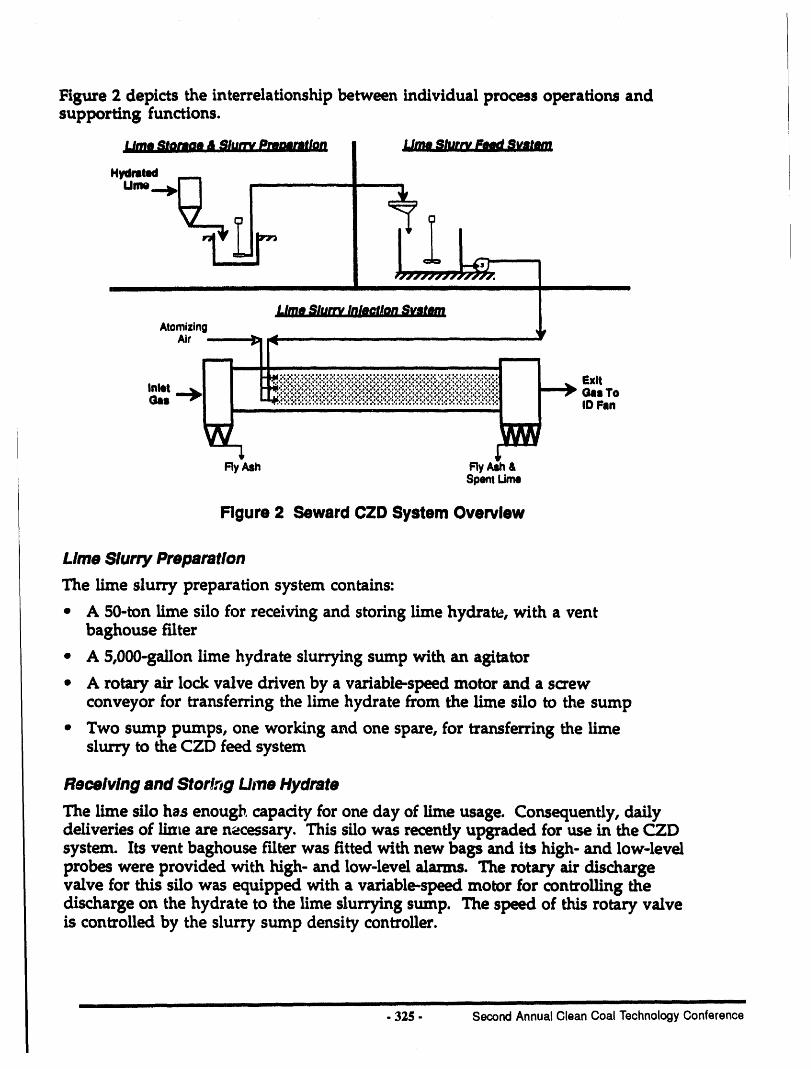
Figure 2 depicts the interrelationship between individual process operations andsupporting functions.
Lime Stormas & Slurry PreMrstlon Lime Slurry Fam:fSvJIMm
HydratedUme
Lime Slurry Inloetlon System
AtomizingAir
FlyAsh FlyAsh&Spentlime
Figure 2 Seward CZD System Overview
Lime Slurry Preparation
The lime slurry preparation system contains:
• A 50-ton lime silo for receiving and storing lime hydrate, with a ventbaghouse filter
• A 5,000-gallon lime hydrate slurrying sump with an agitator
• A rotary air lock valve driven by a variable-speed motor and a screwconveyor for transferring the lime hydrate from the lime silo to the sump
• Two sump pumps, one working and one spare, for transferring the limeslurry to the CZD feed system
Receiving and Stortng Lime Hydrate
The lime silo has enoughcapacity for oneday of lime usage. Consequently,dallydeliveries of Irateare n_cessary. This silo was recentlyupgraded for usein the CZDsystenl. Its vent baghouse filter was fitted with new bags and its high- and low-levelprobeswere provided with high- and low-level alarms. The rotary air dischargevalve for this silo was equipped with a variable-speed motor for controlling thedischarge on the hydrate to the lime slurrying sump. The speed of this rotary valveis controlled by the slurry sump density controller.
I I I III I IIIII
.325 - SecondAnnual Clean Coal TechnologyConference

Slurrying of Lime Hydrate In the Lime Sump
The lime slurrying system was desigTted for fully automatic operation governed bythe level controller in the lime feed tank. One of the two sump pumps operatecontinuously, pumping the lime slurry to the C.ZDlime feed system. The slurrylevel in the tank governs the transfer of lime slurry from the sump to the lime feedtank. The tank level controller tends to maintain a constant level in this tank by theoperation of a lime flow control valve in the lime transfer line from the sump tothe vibrating screen. As the transfer of the lime slurry varies, the lime slurry levelin the lime sump also varies.
The lime sump is equipped with a level controller designed to maintain a constantlevel of slurry in the sump by controlling the sump's water inflow.
The lime sump pump bypass is equipped with a lime slurry density controllerwhich maintains a constant concentration of lime slurry in the sump by controllingthe discharge rate of lime hydrate from the silo (speed of rotation of the air lockdischarge valve).
Figure 3 shows the lime storage and slurry preparation required for continuousoperation.
"_ Water
Tou.y/,
/" 1 Feed stem
J ,,/' Water
cr.:k) ., , , , , ,,
Figure 3 Lime Storage and Slurry Preparation- Continuous Operation
i ii
Second Annual Clean Coal TechnologyConference - 326 -

Lime Slur/Feed
The lime slurry feed system consists of:
• One vibrating screen for the removal of oversized materials from the limeslurry
• Two grits slurry tanks, one working and one spare, both equipped withagitators and level indicators
• Two lime slurry feed tanks, one working and one spare, both equipped withagitators, level controllers, and temperature indicators
• Two lime slurry feed pumps, one working and one spare
The system is designed for intermittent parametric testing as well as continuousplant operation; hence it has double tankage.
The vibrating screen is designed to degrit the lime slurry and is used for theremoval of foreign matter from this slurry (sand, trash, etc.). Foreign material dropsfrom the vibrating screen into the collecting gutter from which it is sluiced withwater into the grits tank.
The filtered lime slurry is discharged from the vibrating screen into the lime slurryfeed tank. The slurry level in the tank is controlled by the tank level controller,which throttles the flow of lime slurry from the lime slurry sump pump to thevibrating screen. The lime slurry feed pump is used to pump the lime from the feedtank to the lime slurry injection header. Figure 4 shows the lime slurry feed system- continuous operation.
Recite.FromIn_ao s_em
FromSlum/ ;---_--- To Slurry
Preparat_lon __ , _ .!njectlon.flystm1.._
i
Figure4 LimeSlurryFeedSystem-Continuous Operation
III llll IIII II IIIIIII I
- 327 - SecondAnnualCleanCoalTechnologyConference

Lima Slurry Injection
The lime slurry injection system consists of:
• The lime slurry and water piping
• The flow controls on the top of the desulfurization duct (other than the limeslurry distribution header and atomizer feeders)
• The water booster pump and associated water piping at ground level
Lime slurry is supplied to the injection lime header from the lime feed system viathe loop main, which consists of the feed supply and the excess feed return headers.Operation of the atomizers requires relatively high, constant, lime slurry injectionpressure. This pressure is maintained at a constant level at the inlet to the injectionheader by the back pressure controller in the lime slurry return header. The flow ofthe lime slurry to the atomizers' distribution header is controlled by a flowcontroller which is reset by the Section C temperature controller. In the duct,Section C is in the turning vanes area.
The lime slurry injection header is connected to the lime slurry feed loop via a four-way valve. This valve connects the lime injection header to the water supplypiping from the water booster pump. The use of the four-way valve permits thelime injection header to be flushed with water whenever the lime injection isinterrupted. The water supply header is furnished with a water flow controller thatcan be reset by the Section C temperature controller. Both the lime and water flowcontroller valves are connected to the low-pressure switch on the atomizing airsupply header so that the operating flow control valve(s) will close in case of lowatomizing air pressure. The arrangement protects the flue gas handling systemfrom being flooded with unatomized lime slurry or water.
The power plant domestic water distribution system provides water for flushing theatomizers and their lime slurry supply piping and for injection into the flue gasstream. Because the operating pressure of this system is inadequate for theoperation of atomizers, the CZD injection system is equipped with a water boosterpump to maintain an adequate water supply pressure.
Figure 5 shows the lime slurry injection, continuous operation.
Flue Gas Desulfurization Section
Seward Boiler Unit No. 15 is a balanced draft boiler provided with two F.D. fans, twoLjungstrom air heaters, two twin-chamber ESPs, and two I.D. fans. The two ESPs arejoined by twin flue gas ducts that form twin flue gas treating trains, referred to as Aand B trains.
Ul II Ill I I I I III I
SecondAnnualClean Coal TechnologyConference - 32,8-

Water
Retire. To .... _,
Feed System __.FromSlurry,Feed System
AtomizingAir Low
Exit GasTo I0 Fan
Inlet _ 2nd _'_Gu ssp "
0 O | ,
r--Fly Ash Fly Ash &
SpentLime
Rgum 5 Urne Slurry Injection- Continuous Operation
The desulhtrization duct has a 110-foot-long straight run for injection of theatomized lime slurry. This duct length is necessary for the boiler unit for theabsorption of SO2from flue gas and for dryin 8 out the absorption products. Theatomizing nozzles are located at the duct inlet.
The operating instrumentation includes a low-pressure switch which will stop limeor water from being injected if the air pressure is too low to ensure adequateatomization. This instnm_entation is essential for the protection of the flue gassystem from the formation of wet deposits, plugsing, and flooding.
A ready/standby switching system allows the lime slurry feed to the atomizers to bediverted back to the feed tanks, while water is supplied to flush the atomizingnozzles and lime supply header. The ready/standby system can be used totemporarily suspend lime injection without shutting down the C.ZD system and canbe activated from the plant control room.
Atomizing Air Compression System
This system contains two screw-type air compressors (which can be operated singlyor in parallel) and an air receiver. Each of the two compressors can supply up to2,250 schn of air at 120 psig and is driven by a 500 bhp motor. Each compressor isequipped with air intercoolers and after-coolers using 100 gpm of cooling water. The
__ I III I
- 329 - Second Annual Clean Coal Technology Conference

compressors are of the oilless type and provide oil-free compressed air. Theoperation of the CZD system requires continuous operation of at least one of the twocompressors.
Instrumentation and Control (l&C) System
Instrumentation and control (I&C) is broken down according to the plant locationsat which CZD equipment and systems are found. These five operationalareas/systems are:
• Lime slurry preparation system
• Lime slurry feed system
• Lime injection system
• Duct flue gas monitoring and controls
• Atomizing air compression system
Startup, operation, and monitoring of the equipment and systems within theseareas are accomplished by a combination of actions performed locally or in thecontrol room (remote operation). In general, initial startup of all pumps, mixers,,and systems must occur locally. In this way the operator can visually verify thecondition of the equipment in the area and determine whether it is safe to put theequipment or system into operation. Once a system or equipment is in operation,monitoring the condition of equipment and changing the system setpoints can bedone remotely in the control room, or locally through panel-mounted switches andcontrollers.
The ready/standby system is also part of the CZD I&C and operates through theBailey Distributed Control System (DCS). The ready/standby switch gives theoperator a means of controlling whether or not lime slurry is injected into the ductwithout unnecessarily upsetting CZD controls, and safeguards the operation of theBuell ESP. Low atomizing air pressure also activates the standby mode of operation.
Remote monitoring and control of the CZD process from the control room areprovided by the existing combustion management control system (MCS) and aresupplemented by the process control view station (PCV). Additional plant andprocess operating information is available from Leeds & Northrup (L&N) recorderslocated in the ESP control room and in the duct B instrumentation room.
Parametric Test Results
The parametric tests included duct injecting atomized lime slurry made of dryhydrated calcitic lime, fresh slaked calcitic lime, and pressure-hydrated dolomiticlime. All three reagents removed SO2 from the flue gas, requiring differentconcentrations in the lime slurry for the same percentage of SO2 removal. The mostefficient and easiest to operate is the pressure-hydrated dolomitic lime. The lime
IHI I I I HHII IIIHI IIHI I II
SecondAnnual Clean Coal TechnologyConference - 330 -
slurry duct injection does not adversely impact the stack opacity. On the contrary, itsubstantially reduces stack opacity during the lime injection.
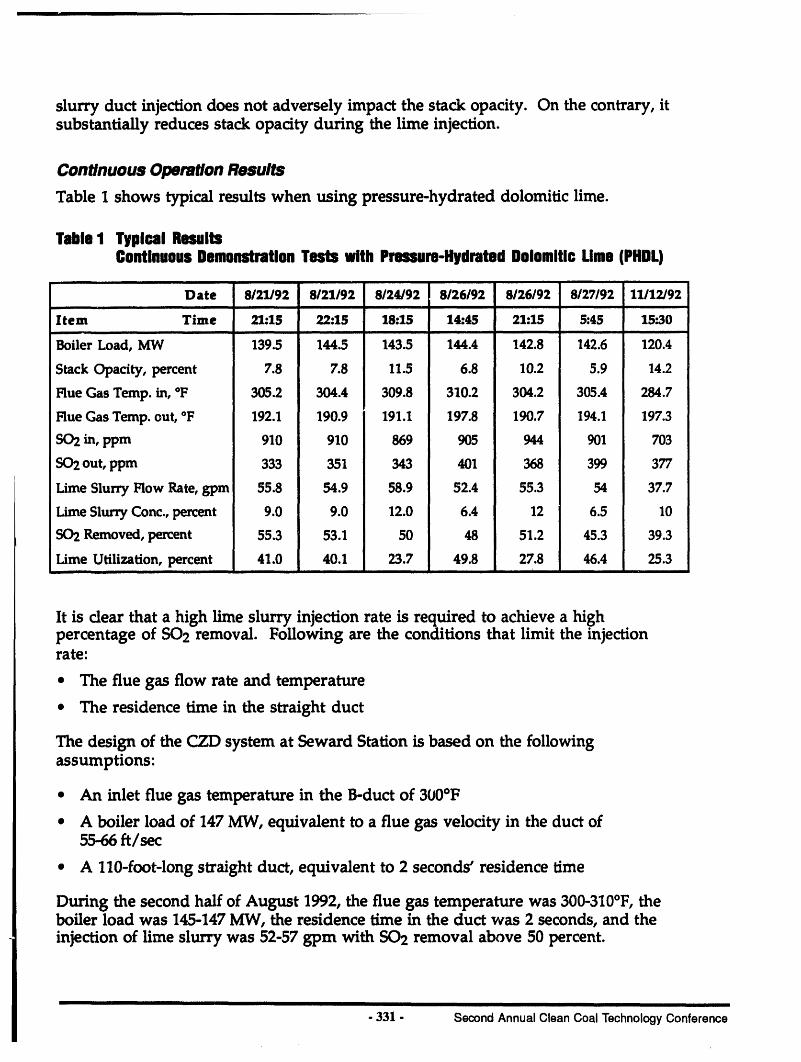
Continuous Operation Results
Table1 showstypicalresultswhen usingpressure-hydrateddolomiticlime.
TableI Typical ResultsContinuousDemonstrationTests with Pressure-HydratedDolomltlc Lime (PHDL)
Date 8121/92 8121/92 8/24/92 8/26/92 8/26/92 8/27/92 11/12/92i ii, i
Item Time 21:15 22:15 18:15 14.'45 21:15 5:45 15".30ii ii
Boiler Load, MW 139.5 144.5 143.5 144.4 142.8 142.6 120.4
Stack Opacity, percent 7.8 7.8 11.5 6.8 10.2 5.9 14.2
Flue Gas Temp. in, °F 305.2 304.4 309.8 310.2 304.2 305.4 284.7
Flue Gas Temp. out, °F 192.1 190.9 191.1 197.8 190.7 194.1 197.3
SO2 in, pprn 910 910 869 905 944 901 703
SO2 out, ppm 333 351 343 401 368 399 377
Lime Slurry Flow Rate, gpm 55.8 54.9 58.9 52.4 55.3 54 37.7
Lime Slurry Conc., percent 9.0 9.0 12.0 6.4 12 6.5 10
SO2 Removed, percent 55.3 53.1 50 48 51.2 45.3 39.3
Lime Utilization, percent 41.0 40.1 23.7 49.8 27.8 46.4 25.3
ItisclearthatahighlimeslurryinjectionrateisrequiredtoachieveahighpercentageofSO2 removal.Followingaretheconditionsthatlimittheinjectionrate:
• The fluegasflowrateand temperature
• The residencetimeinthestraightduct
The designoftheCZD systematSewardStationisbasedon thefollowingassumptions:
• An inletfluegastemperatureintheB-ductof300°F
• A boilerloadof147MW, equivalenttoafluegasvelocityintheductof55-66ft/sec
• A 110-foot-longstraightduct,equivalentto2 seconds'residencetime
DuringthesecondhalfofAugust1992,thefluegastemperaturewas 300-310°F,theboilerloadwas 145-147MW, theresidencetimeintheductwas 2 seconds,and theinjectionoflimeslurrywas 52-57gpm WithSO2 removalabove50percent.
-331- SecondAnnualCleanCoalTechnologyConference

Figure 6 shows the CZD duct temperature versus the lime slurry injection rate andpercentage of SO2 removal during the period August through November 1992. Inorder to include the duct inlet temperature in this graph, it has been divided by 5- i.e., 300°F is represented by 60°F. The graph shows that during the months ofOctober and November, the inlet flue gas temperature continued to descend fromabove 300°F to 260-280°F due to air leakage in the boiler air heater. This lowtemperature limited the lime slurry injection rate to 30-40 gpm and resulted in a15-30 percent variation in the percentage of SO2 removal.
The percentage of SO2 removal is dependent on the lime slurry injection rate andthat the percentage of lime slurry concentration above a Specific level does not affectthepercentageof ,502 removal.
Figure7 showsSO2 removalversusthelimeslurry:injectionrate,expressedingpmandbasedon dailyaveragesduringtheperiodAugust17toSeptember16,1992.Thisgraphshowsthatfor,_low limeslurryinjectionrate--forexample,36gpm --thepercentofSO2 removM was onlyabout20percent.By increasingtheinjectionrateto50gpm, SO2 removalincreasedto38percent.At a 54gpm injectionrate,theSO2removalrateincreasedto45 percent.By extrapolation,witha60gpm injectionrate,thepercentageofSO2 removedwillreach55percent.As mentionedabove,thepercentageofSO2 removedrepresentsdailyaveragesand notpeakvalues.
"'" Lime GPM ....-...l-- SO2 -- _ -_ ]Row, RernovaJ,% B Duct Ternp I F
J70 350
E
60 300• _. r_ >>>>> IL
a
60 .. 250
E. . ._;, _: •
40 _
A_ . °.. .
20
_<<< %10
Figure 6 Temperature vs Lime Flow and SO2 RemovalAugust 17 to November 16, 1992
SecondAnnual Clean Coal TechnologyConference - 332 -

6O
55 .......
I ,,/50 ....... /• /
45 " 'mJ
40 .....
30 ' /
0 jcn 25 • r
2O ............. Ar/
15 /-_._'_ _ , ,
10 _
' I0
0 10 20 30 40 50 60
Ume Slurry Injection Rate, GPM
i
Figure 7 Removal vs Injection Rate, Based on August 17 toSeptember 16, 1992 Dally Rates
Chemical Analyses of Fly Ash and CZD Reacted Products
Samples of solids containing fly ash, CZD reacted products, and unreacted lime werecollected and analyzed. The samples were collected during the CZD continuousoperation with pressure-hydrated dolomitic lime. The analyses were made byscanning electron micrographs (SEM) and energy-dispersive X-ray analyses (EDAX)for elements in fly ash and CZD reacted products. The analyses were performed atPennsylvania State University, Department of Material Science and Engineering,Fuel Science Program.
Figure 8 is an SEM and Figure 9 is an EDAX of a sample of fly ash with CZD reactionproducts. The fly ash particles On the SEM appear as gray spheres 1-20 microns indiameter. The reaction products (calcium sulfite, calcium sulfate, and magnesiumsulfate) appear as separate white crystals from submicron size to about 2 microns indiameter. The very fine crystals of CZD reaction products agglomerated on thelarger fly ash spheres, creating larger particles that are more easily removed by theESP from the flue gas.
The EDAX analyses show the main elements and their concentration. Position 5,shown in Figure 9, shows calcium, magnesium, sulfur and oxygen as principalelements of the reaction products. Other positions show silica, aluminum, iron,and titanium as main elements (the fly ash constituents), and calcium, magnesium,and sulfur (reaction-product constituents) at lower concentrations.
i i iiiiii
- - 333 - Second Annual Clean Coal Technology Conference

Figure8 Scanning Electron Micrograph of Samples of Fly Ash,CZD Reaction Products, and Unreacted Lime
=--._ .h , _ _ : , ,. , , ,
9-D_:c-1992 18:12:4B
',,'mr+.- L3S4 coun't.,, 13[_p- I F L,.=Lr.+',._md',, I_t3 =:,",c=m
C_
o dmst Ill
11t,KI:I _ Ce
SC F_ M rtlUt /I J/ ++• _., F'm
i __ i>+ la i ,1. is la i 7 18 194- m.a,+m m<,.r-,_+,,mm.+ma k_.v to. tom-I,
Integr,_l B - 7,,.1412
Figure 9 Energy-DispersiveX-ray Analysis of Position 5 in Figure 8
Second Annual Clean Coal Technology Conference - 334 -

Percentage of Lime Utilization and the Factors that Could Affect It
The percentage of lime utilization in the CZD system significantly affects the totalcost per ton of SO2 removed. For this reason, we have examined methods that canimprove the percentage of lime utilization. An analysis of the continuousoperational data compiled to date indicates that the percentage of lime utilization isdirectly dependent on two factors:
• The percentage of SO 2 removal
• The lime slurry concentration
For operating conditions at Seward Station, data show that a 40-50 percent SO2
removal and a 6-8 percent lime or dolomitic lime slurry concentration will assure a40-50 percent lime utilization rate. That is, 2 to 2.5 moles of CaO or CaO.MgO arerequired for every mole of SO2 removed; or assuming 92 percent lime purity, 1.9-2.4tons of lime are required for every ton of SO2 removed.
Technology Applicability and Limitations
Commercial Application
CZD technology is particularly well suited for retrofitting existing boilers, regardlessof type, age, and size, type of coal burned, or the percentage of sulfur in the coal.Compared to currently available flue gas desulfurization systerrv_;,CZD technologycan be more easily and economically integrated into existing power plants.
The inherent advantages of the CZD process relative to currently availablecommercial technologies are:
• Substantially lower capital cost and total cost per ton of SO2 removed
• Ease of retrofit because CZD eliminates the need for chimney alterations,boiler reinforcements, and modifications to boiler draft controls
• No increase in flue gas pressure drop; therefore, no extra fans are needed
• Minimal space requirements in the stack area
• No dewatering or liquid waste treatment required
• No flue gas reheating requirement
• No congestion close to the boiler or stack
• Easily disposable reaction products that are dry, free flowing, and areremoved with the fly ash
• Reduced labor and maintenance requirements
• Applicable to wide range of: geographic locations, load profiles, andparticulate collectors (either ESP or baghouse)
- 335 - SecondAnnualClean Coal TechnologyConference

• Raw materials(dolomiticrockiswelldistributedinmany areasoftheUnitedStates)
A disadvantageoftheCZD processisthelimitationinSO2 removaltoabout50percent.
The CZD processrequiresthatdryingandSC)2absorptiontakeplacewithin2seconds.A longstraightfluegasductofabout100feetisrequiredtoensurearesidence time of 2 seconds. If this length of flue gas duct is not available and thereare space limitations for a new horizontal long duct, then a vertical duct of therequired length can be built to enable utilization of the CZD technology.
Reference 6 describes flue gas desuifurization by the CZD process on a comparativebasis with the economies of other clean coal technologies.
Commercial Demonstration
The CZD project is designed to demonstrate:
• Reliable operation of the CZD process when integrated with a power station
• Absence of any detrimental effect on normal boiler operations
• Capability to operate with high- and low-sulfur coal
Bechtel intends to cornmercialize the CZD process when the present demonstrationis successfully concluded. During the CZD demonstration, papers giving technicaland economic data, results, and conclusions, will be presented at variousconferences. These papers will be made available for publication in appropriatejournals of technical societies, the electric generating industry, and in otherpublications. Representatives of utilities will be invited to visit the demonstrationsite and learn how SO2 can be removed cost-effectively using the CZD process.
Conclusions
• Parametrictestswithkeyvariableswereclearlydeterminedand usedasabasisforthecontinuousoperationsystem
• The fullyautomatedand integratedsystemwiththepower plantoperationprovedthattheCZD processrespondsverywelltoautomatedcontroloperations
• CZD systemavailabilityisverygood.Forexample,duringtheperiodOctober17toNovember 16,1992,theautomatedsystemswere on line100%oftime- 744hours
Second AnnualClean Coal Technology Conference - 336 -

• During normal CZD operations, no deposits of fly ash and reaction productstook place in the flue gas duct. On a few occasions, deposits accumulated inthe duct and had to be manually removed. The failures that caused thesedeposits were identified as follows:
- A power failure on the air compressor supplying the compressed air tothe lime slurry atomizers
- Breakage of the ceramic tips, causing coarse sprays
- Leakage of the lime slurry atomizers around their flanges and spray tips,causing the formation of deposits on the atomizer tips
These problems were corrected, and we expect that they will not be repeated.A new control system will monitor the operation of each atomizer and willstop operations if one of them is not operating correctly.
• At Seward Station, stack opacity is not detrimentally affected by the CZDsystem
• Results of the demonstration indicate that the CZD process can achieve costsof $300/ton of SO2 removed when operating a 500 MW unit burning 4%sulfur coal. Based on a 500 MWe plant retrofitted with CZD for a 50 percentrate of SO2 removal, the total capital cost is estimated at less than $30/KWe
II
- 33'7- Second Annual CleanCoal TechnologyConference

References
1. Abrams, J.Z., Sherwin, R.M. "Method for Reduction of SO2 Emission for FossilFired Boiler by Confined Zone Dispersion." U.S. Patent 4,623,523, November 18,1986.
2. Abrams, J.Z., Blake, J.H., Pennline, H.W. "The Bechtel CZD Process for Hue GasDesulfurization." ASME, 86-JPGC-EC-14, October 20, 1986.
3. Abrams, J.Z., Blake, J.H., Pennline, H.W. "The Confined Zone DispersionProcess for Flue Gas Desulfurization - Proof of Concept Tests." Industrial GasCleaning Institute Forum, September 1987.
4. Abrams, J.Z., Zaczek, S.J. "The Confined Zone Dispersion Demonstration in aCommercial Unit for Flue Gas Desulfurization, Test Results and Plans for 1991."National Lime Association Seminar, january 9-10, 1991.
5. Abrams, J.Z., Rubin, A.G., Higgins, S.T., Baldwin, A.L. "Demonstration for FlueGas Desulfurization at Seward Station of Pennsylvania Electric Company(Penelec)." American Power Conference, Chicago, Illinois, April 30, 1991.
6. Abrams, J.Z., Zaczek, S.J.Gilbert, B.IL,Newman, J.T. "Desulfurization andDe-NOx of Flue Gas by the Confined Zone Dispersion (CZD) Process.Comparative Economics of Clean Coal Technologies." Pasha Publications Inc.,and AER Enterprises, March 26-27, 1990.
7. Abrams, J.Z., Rubin, A.G., Higgins, S.T., Baldwin, A.L. "Demonstration ofBechtel's Cmfined Zone Dispersion Process at Pennsylvania Electric Company'sSeward S .ation." American Sodety of Mechanical Engineers (ASME), SanDiego, California, October 8, 1991.
8. Abrams, J.Z., Rubin, A.G., Baldwin, A.L. "Update and Results of Bechtel'sConfined Zone Dispersion (CZD) Process Demonstration at PennsylvaniaElectric Company's Seward StaticJn." U.S. Department of Energy First AnnualClean Coal Technology Conference, Cleveland, Ohio, September 22, 1992.
Second Annual Clean Coal Technology Conference - 338 -

PROJECT UPDATE: ADVANCED FGD DESIGN FOR NORTHERN INDIANAPUBLIC SERVICE COMPANY'S BAILLY GENERATING STATION
JohnHendersonand
Don C. VymazalPure Air
7540 WindsorDriveAllentown,PA 18195
B. A. WrobelNorthernIndianaPublicService Company(NIPSCO)
246 BaitlyStationRoadChesterton,IN 46304-9754
ThomasSarkusU.S. Departmentof Energy
HnsburghEnergyTechnologyCenterP. O. Box 10940
Pittsburgh,PA 15236-0940
Presentedat the SecondAnnualClean CoalTechnologyConferenceco-sponsoredbyU.S. Departmentof Energyand SouthernStatesEnergyBoard,September7 - 9, 1993;Atlanta,Georgia
Abstract
In 1988, theU.S. Departmentof Energy selectedPureAir to demonstratea state-of-the-m sulfurdioxide scrubber,underDOE's CleanCoal Technologydemonstrationprogram.The scrubberis locatedat the NorthernIndianaPublic ServiceCompany's (NIPSCO's)Bailly GeneratingStation,approximately40 miles southeastof the city of Chicago,minois in the U.S.A. It boasts a numberof advancedtechnical features,includingasingle absorbervessel which is sized nominally at 600 MWe - the largestin the UnitedStates,andthe largest in the world to operatewith high-sulfurcoal. Otherprojectfeanm_sare:
• high-velocity co-currentscrubberdesign, whichcontributesto reducedspacerequirements;
• direct injectionof dry,pulverizedlimestoneinto the scrubber;,• productionof a high quality gypsum by-product,instead of disposablescrubber
sludge;• wastewatertreatmentand evaporationsystem, and;
- 339 - SecondAnnualClean Coal TechnologyConference

• the first-of-a-kindagreement(Own-and-Operate)to design, engineer,construct,fabricate,own, operate,maintainandfinance a powerplantscrubber,by a non-utility.
Theseandotherfeaturesallow the scrubberto have improvedenvironmentalperformance,reducedspacerequirements,betterenergyefficiency, and lowercosts thanconventionalfirst (or second)generationscrubbers.With specific regardtoenvironmentalmanagement,this projectseeksto demonstratethat airpollutioncontrolneednot havedeleterioussolid waste and/orwastewaterconsequences.
Constructionof the scrubberis complete;operationsbeganin June 1992,aheadofscheduleand within budget. The CleanCoal demonstrationprojectcalls for threeyearsof operations. Afterthe three-yeardemonstrationperiod,PureAirwill continueto Own-and-Operatethe scrubberfor the next 17 years.
Thispaperreviews the advancedwet flue gas desulfurization(FGD) design features,andthe environmentaland business featuresof the project. This paperalso includesoperations data,projectcosts and schedule.
Background
PureAir began developmentefforts in early 1988 for anOwn-and-OperateAdvancedFGD facility servingNIPSCO. With the cooperationof NIPSCO, the projectwassubmittedto the UnitedStatesDepartmentof Energy for considerationundertheInnovativeClean Coal Technology Program(SolicitationH).
PureAir's "AdvancedFlueGas Desulfurization(AFGD)DemonstrationProject"was oneof 16 projects selected underDOE'ssecond CleanCoal solicitation. FoLlowingselectionin September1988, DOEentered into negotiationswith PureAir, and a CooperativeAgreementwas awardedon 20 December1990.
In September1989, a flue gas processingagreementwas signed with NIPSCO,whereby an AFGDfacility would be constructedat its Bailly GeneratingStationlocated in Porter,Indiana,forty miles east of Chicagoon the southernshoreofLakeMichigan. The projecthas since progressedthroughdesign andconstruction,andinto operation. Indiana law requiredthat NIPSCOobtainfromthe IndianaUtility RegulatoryCommission(IURC)a "Certificateof PublicConvenienceand Necessity". This law was originallywrittento createincentivesfor utilities to install cleancoal technology. The Certificateprocesswas initiatedon 1SAugust 1989 and a certificatewas grantedon 11 April 1990. In doingso,the IURCconcurredthat by installing the AFGDfacility at BaiUy,NIPSCOwasusing the mostcost-effective solutionfor SO2 reduction.
I II
Second Annual Clean Coal TechnologyConference - 340 -

Bailly Station consists of two coal-fired boilers -- Unit #7, rated at 183 MW netcapacity, went into operation in 1962; and Unit #8, rated at 345 MW net capacity,started in 1968. Both units bum bituminous coal, typically ranging from 2 to 4percent sulfur.
First, a brief description of the plant and the installed FGD system (i.e., absorberdesign, limestone feed system, gypsum dewatering and wastewater treatmentsystem) are outlined. Next, a summary of the results of the performance testingcompleted on the AFGD system is presented. Also included is the DOEdemonslzation test matrix and results of the f'hrStDOE test conducted in
September 1992, along with relevant operations information.
Plant Description
A simplified process flow diagram for the Bailly Advanced FGD plant is illustrated inFigure 1.
This facility includes a single absorber designed to process the maximum quantity of fluegas generated from both NIPSCO's Units #7 and 8. The absorber is equipped with a co-currentopen grid tower with two levels of slurry distribution, an integrated reaction tankand a two-stage vertical mist eliminator in the horizontal duct. The absorber is designedto accomplish several process steps, including gas quenching, absorption of SO2,reaction with limestone andoxidation of suifite to gypsum in a single vessel. The co-current absorber is designed at higher than conventional counter-current flue gas flowrates which makes the co-c__-re_.rttvessel very compact. The flue gas from both boilers(approximately 2,200,000 scfm) through the existing I.D. fans is combined in a commonduct feeding a single absorber tower where it contacts the recircuiation slurry.Quenching and humidification of the gas and absorption of the SO2 occursimultaneously. The zone where the flue gas initially contacts the recircuiation slurry iscalled the "wet-dry" interface and is washed intermittently with fresh water to prevent theformation and growth of deposits.
Recirculating slurry is split between the two levels of distribution provided. The slurryand flue gas pass co-currently over the open grid packing located in the absorber tower.The grid packing, made of polypropylene, provides a large surface areafor gas-to-liquidcontact to enhance the SO2 removal efficiency. The SO2 of the flue gas is absorbed intothe slurry, and the amount of gas phase SO2 reaction is reduced as the gas flows throughthe tower. Partial oxidation of the absorbed SO2 occurs in the tower. Oxidation of the
SO2 is completed in the reaction tank. After flowing downward through the absorbertower, the scrubbed flue gas makes a 90° turn and passes over the liquid in the reactiontank where gas-liquid disengagement occurs. The gas exits the absorber by passingthrough a highly efficient, two-stage mist eliminator located vertically in the horizontaloutlet duct, where the cleaned flue gas exits through a newly built stack. The reactiontank is located beneath the absorber tower, so the recirculating slurry with absorbed SO2
I I I IIII I I IIII I II1'1 III I IIIII II
-341- SecondAnnualCleanCoa_ echnologyConference

falls directly into the tank. The reaction tank is designed to hold an adequate liquidvolume to ensure efficient usage of limestone and to provide adequateresidence time forcomplete oxidation of calcium sulfite to calcium sulfate.
Three air rotary spargers (ARSs) are provided to maximize the efficiency of theoxidation of calcium sulfite. The patented ARS is an innovative and unique designwhich combines the process functions of agitation and oxidization. By simultaneousrotation of the ARS and the introduction of air through the sparging nozzles, very finebubbles are produced.
In addition _othe three ARSs, a small section of the absorber reaction tank is also fittedwith two rows of fixed air spargers (FAS). Incursion of the FAS helps ensure completeoxidation at maximum levels of coal sulfur.
To neutralize the absorber slurry, dry pulverized limestone is pneumatically conveyed tothe absorber reaction tank. The SO2 content in the flue gas at the stack is monitored andcontrolled by regulating the quantityof limestone injection into the reaction tank.
During humidification of the flue gas, water is consumed from the reaction tank byevaporation. To ensure that the solids concentration in the reaction tank is maintained at25 percent, slurry is transferredfrom the reaction tank to the gypsum dewateringequipment.
Summary of Project Features
Large, Single-Module Scrubber
The AFGD facility is sized to scrub all of the flue gases from both of the BaiUy Station'stwo coal-fired units. Unit 7 has a nameplate capacity of 194 MWe, and is permi_ at183 MWe. Unit 8 has a nameplate capacity of 422 MWe and is permitted at 345 MWe.Thus, the AFGD facility is currently operating at 528 MWe (or 1,426,000 SCFM); but itis sized to handle BaiUy's nameplate capacity of 616 MWe, if the power plant is re-permitted. This point is important to keep in mind, when performing economicassessments.
With a nominal capacity of 600 MWe, the BaiUy scrubber is the largest single SO2absorber in the United States. Under the Clean Air Amendments of 1970, as amended bythe Clean Air Act Amendments of 1977, newly constructed power plants were requiredto scrub SO2 emissions; otherwise, they would not be allowed to operate. As a result,the conventional U.S. practice during the 1970s and early 1980s was to install severalsmall absorber modules, including one or two spare/backup modules. (For example, four175 MWe modules might be installed at a 600 MWe power plant.)
I _ I
SecondAnnualClean Coal TechnologyConference - 342,-

The AFGD facility at Bailly Station is the first large (i.e.,)300 MWe) single-moduleabsorber in the United States, and the largest in the world to operate with high-sulfurcoal. it has no spare or backup modules, and treats all of the combined flue gases fromUnits 7 and 8 at the Bailly generating station.
High Velocity, Co-Current SO2 Absorber
As the elimination of spare/backup modules serves to reduce the scrubber'scost andrelative size, so does its advanced design. Figure I is a simplified flow diagram of theAFGD system at BaiUy Station. Pure Air utilizes a co-current absorber, in which thelimestone slurry moves in the same direction as the power plant flue gases. This enablesthe Baiily scrubber to operate at a flue gas velocity of approximately 18 to 20feet/second, versus 8 to 10 feet/second for a more conventional counter-current scrubber.As a result of the higher flue gas velocity, the absorber vessel is smaller, withcommensurate cost savings.
Direct Limestone Injection
At the Bailly scrubber, pulverized limestone is injected directly into the SO2 absorber.This direct injection of pulverized limestone eliminates the need for on-site wet grindingsystems, thereby reducing both space requirements and capital costs. Direct limestoneinjection is particularly attractive at power plants with limited space availability. TheBailly scrubber is one of only a few scrubbers in the world to utilize direct limestoneinjection, and the first in the United States. The direct limestone injection system hasoperated without problems to date.
High Quality Gypsum By-Product
Conventional first and second generation scrubbers produced a mixture of calcium sulfite(CaSO3) and calcium sulfate (gypsum, CaSO4). This mixture is commonly called"scrubber sludge". It caused scaling problems in many early scrubbers, and must bestabilized prior to its disposal as a solid waste.
Most of today's scrubbers either inhibit the oxidation of CaSO3 or f_-,rcethe oxidation togypsum, i_ca_se scaling problems are generally not encountered with either pure CaSO3or pure gypsum. Forced oxidation to gypsum has a potential advantage over inhibitedoxidation in that the gypsum by-product can often be utilized commercially, dependingupon market conditions.
For the AFGD project, NIPSCO has entered into a long-term contract with U.S. Gypsum(USG), whereby USG is purchasing all of the by-product gypsum for use as a feedstockat its East Chicago wallboard manufacturing plant. Wallboard-grade gypsumspecifications are shown in Table I, along with the Bailly gypsum characteristicsmeasured during a 100-hour performance test in August 1992. From start-upthrough theend of June 1993, the AFGD project produced 216,344 tons of wallboard-grade gypsum.
I I I III I
- 343 - SecondAnnualClean Coal TechnologyConference

Note that scrubber gypsum can be used in other applications such as cement, and thegypsum purity requirement is generally lower for cement than for wallboard.
Wastewater Treatment and Evaporation Systems
The Bailly generating station is situated on the southern shore of Lake Michigan, and theAFGD facility utilizes process water taken from the lake. Much, though not all, of theprocess water is recycled within the AFGD system. Treated wastewa_" is dischargedinto Lake Michigan. Wastewa_r requirements are shown in Table 2, along withmeasured wastewater characteristics at the Bailly Station.
Chloride content is a critical parameterfor wallboard-grade gypsum. Removal ofchlorides from the gypsum can be accomplished easily by washing the gypsum, but theresultant wastewater can often exceed permit requirements. To avoid this potentialproblem, Pure Air will demonswate a novel Wastewater Evaporation System (WES).Pan of the process water stream is bled off to maintain an acceptable chloride levelwiflfin the absorber vessel, and then injected into the power plant ducrwork where hotflue gases evaporate the water. Upon evaporation of the water, any dissolved salts willcrystallize, so that they can be collected along with fly ash by the power plant'sparticulate control devices. The salts are then easily disposed of with the power plant flyash.
At the Bailly Station, the WES will be demonswated only on Unit 8 (422 MWenameplate; 345 MWe permit capacity). Taken together, gypsum utilization andwastewater evaporation will demonswate that SO2 control need not have deleterious solidwaste and/or wastewater consequences.
PowerChip TMGypsum Demonstration
The AFGD by-product gypsum is in a finely powdered form. However, Pure Air willdemonstrate a process to agglomerate and flake part of the by-product gypsum stream, inan attempt to improve the marketability of scrubber gypsum to end-users who areaccustomed to using natm_ gypsum rock. This PowerChip gypsum can be transportedmore easily and handled with existing equipment at most wallboard and/or cement plants.As an add-on to the AFGD project, Pure Air will attempt m blend fly ash and wasmwa_rtreatment solids into the PowerChip gypsum by-product. Although these impuritieswould make the gypsum unacceptable for wallboard applications, it could still be used incement. Pilot tests have indicated that maximum fly ash loadings of 20% to 30% may beachieved. In combination with wastewater evaporation and the coproduction ofwallboard-gradegypsum, this process may bring coal-fired power generation technologyone step closer to the goal of a zero-discharge power plant. Demonstration of thePowerChip gypsum process is scheduled to begin in mid-1993.
I II I
SecondAnnualClean Coal TechnologyConference - 344 -

Cleanfluegas
DustandS(_,eratlng ash filter Fancyc,one
Reactor
Lime
Recirculatlon SolidI I
• Lime slurrY_ter _ I Sll° IFluegas _,.y_Ol Proportloning
_E "_Compressor p <_ WaterLimeslurrypreparation
Figure 1. Gas Suspension Absorption Process Flow Diagram
The flue gas from the boiler air preheater is fed into the bottom of the circulating fluidized bed
reactor where it is mixed with the suspended solids that have been wetted by the fresh lime
slurry. The suspended solids consist of reaction products, residual lime, and flyash. During the
drying process in the reactor, the moisture in the fresh lime slurry, which coats the outer surface
of the suspended solids, evaporates. Simultaneously, the lime particles in the slurry undergo a
chemical reaction with the acid components of the flue gas, SO2 and HCI, capturing and
neutralizing them.
The partially cleaned flue gas flows from the top of the reactor to the separating cyclone and then
to an ESP (or a fabric filter), which removes the dust and ash particles. The flue gas, which has
now been cleaned, is then released into the atmosphere through the stack.
-361 - SecondAnnualCleanCoalTechnologyConference

The cyclone separates most of the solids from the flue gas stream. Approximately 95% to 99%
of these collected solids are fed back to the reactor via a screw conveyor, while the remaining
solids leave the system as a byproduct material. Some of these solids recirculated to the reactor
are still reactive. This means that the recirculated lime is still available to react and neutralizei
the acid components in the flue gas.
The pebble lime is slaked in a conventional, off-the-shelf system. The resulting fresh slaked lime
slurry is pumped to an interim storage tank and then to the dual-fluid nozzle. The slurry is
diluted with trim water prior to being injected into the reactor.
Automatic Process Adjustment
An effective monitoring and control system automatically ensures that the required level of SO2
removal is attained while keeping lime consumption to a minimum. This GSA control system,
which is shown in Figure 2, incorporates three separate control loops:
1. Based on the flue gas flow rate entering the GSA system, the first loop continuously
controls the flow rate of the recycled solids back to the reactor. The large surface area
for reaction provided by these fluidized solids and the even distribution of the lime slurry
in the reactor, provides for the efficient mixing of the lime with the flue gas. At the same
time, me large volume of dry material prevents the slurry from adhering to the sides of
the reactor.
2. The second control loop ensures that the flue gas is sufficiently cooled to optimize the
absorption and reaction of the acid gases. This control of flue gas temperature is achieved
by the injection of additional water along with the lime slurry. The amount of water
added into the system is governed by the temperature of the flue gas exiting the reactor.
This temperature is normally set a few degrees above flue gas saturation temperature to
insure that the reactor solids will be dry so as to reduce any risk of acid condensation.
SecondAnnualCleanCoalTechnologyConference -362-

3. The third control loop determines the lime slurry addition rate. This is accomplished by
continuously monitoring the SO2 content in the outlet flue gas and comparing it with the
requiredemission level. This control loop enables direct proportioning of lime slurry feed
according to the monitored results and maintains a low level of lime consumption.
I I I
Water Re©uirement
Lime Requirement
Volumetricflow rate
tI
II I II
Flpm 2. Gas Suspension Absorption Control System
COMPARISON OF GSA PROS WITH COMPETING TECIINOLOGY
Simplicity is the key feature of the GSA system. The advantages of the GSA system over
competing technologies are summarized as follows:
I
- 363- SecondAnnualCleanCoalTechnologyConference

Slurry Atomization
The major difference between the GSA and the competing technologies lies in how the reagent
is introduced and used for SO2 absorption A conventional semi-dry scrubber:
• Requires a costly and sensitive high-speed rotary atomizer or a high-pressure
atomizing nozzle for fine atomization,
• Absorbs SO2 in an "umbrella" of finely atomized slurry with a droplet size of
about 50 microns,
• May require multiple nozzle heads or rotary atomizer to ensure fine atomization
and full coverage of the reactor cross section, and
• Uses recycle material in the feed slurry necessitating expensive abrasion-resistant
materials in the atomizer(s)
The GSA process, on the other hand:
• Uses a low-pressure, dual-fluid nozzle,
• Absorbs SO2 on the wetted surface of suspended solids with superior mass and
heat transfer characteristics,
• Uses only one spray nozzle for the purpose of introducing slurry and water to the
reactor, and
• Uses dry injection of recycle material directly into the reactor, thereby avoiding
erosion problems in the nozzle or technical limitation on the amount of solids that
can be recycled
Simple and Direct Method of Lime/Solid Recirculation
The recirculation of used lime is the trend for semi-dry scrubbing systems The recirculation of
solids in the GSA system is accomplished using a feeder box under the cyclone, which introduces
Second Annual Clean Coal Technology Conference - 364 -

the material directly into the reactor. The recirculation feature commonly used in most other
semi-dry processes has an elaborate ash handling system to convey and store the ash. The
method of introducing the recirculated material is usually by mixing it with the fresh lime slurry.
The presence of ash in the lime slurry may cause sediment problem in the slurry lines and
excessive nozzle wear.
Hi J_.hAcid Gas Absorption
The GSA reactor is capable of supporting an extremely high concentration of solids (recirculated
material) inside the reactor, which acts like a fluidized bed. This concentration will normally be
as high as 200-800 grains/scf. These suspended solids provide a large surface area for contact
between the lime slurry (on the surface of the solids) and the acidic components in the flue gas.
This high contact area allows the GSA process to achieve levels of performance that are closer
to that of a wet scrubber, rather than a dry scrubber. Since drying of the solids is also greatly
i enhanced by the characteristic large surface area of the fluidized bed, the temperature inside the
reactor can be reduced below that of the typical semi-dry scrubber. This lower operating
temperature facilitates the acid gas removal in the GSA system and helps it achieve SO2 removal
levels which are comparable to a wet scrubber.
LOWLime Consumption / Minimum Waste Byproduct Residue
The design of the GSA reactor allows for more efficient utilization of the lime slurry because
of the high internal recirculation rate andprecise process control. The higher lime utilization (up
to 80%) lowers the lime consumption, thereby minimizing one of the major operating costs. In
addition, the lower lime consumption reduces the amount of byproduct generated by the system.
Low Maintenance Operation
Unlike the typical semi-dry scrubbers, the GSA system has no moving parts inside the reactor,
thus ensuring relatively continuous, maintenance-free operation. The orifice diameter of the GSA
I I I
- 365- SecondAnnualCleanCoalTechnologyConference

injection nozzle is much larger than that used in a conventional semi-dry process, and there is
little chance for it to plug. Nozzle wear is also minimized. Should the need for replacing the
nozzle arise, it can be replaced in a few minutes. The cyclone also has no moving parts. Both
the reactor and the cyclone are fabricated from unlined carbon steel.
The GSA process also has few pieces of equipment. Most of the equipment is in the lime slurry
preparation area, which typically is an off-the-shelf item, and the technology is well known.
No Internal Buildup
By virtue of the fluidized bed inside the reactor, the inside surface of the reactor is continuously
"brushed"by the suspended solids and is kept free of any buildup. Internal wall buildup can be
a problem with the conventional semi-dry scrubber. There is also no wet/dry interface on any
part of the equipment and this avoids any serious corrosion problem.
Modest Svace Reauirements
Due to the high concentration of suspended solids in the reactor, more than adequate reaction
occurs in a relatively short period of time. A high flue gas velocity of 20 to 22 feet per second
as compared to 4 to 6 feet per second for a semi-dry scrubber and the shorter residence time of
2.5 seconds as compared to 10 to 12 seconds for a semi-dry scrubber, allow for a smaller
diameter reactor which leads to a considerable reduction in space requirements.
Short Construction Period
The compact design of the GSA unit requires less manpower and time to be erected as compared
to the typical semi-dry scrubbers. Despite the relatively complicated tie-ins and extremely
constrained work space, the retrofit GSA demonstration unit at the TVA's NCER was erected in
three and a half months.
J
I I I II III
SecondAnnualCleanCoalTechnologyConference -366-

Heavy Metals Removal
Recent test results from waste incineration plants in Denmark indicate that the GSA process is
not only effective in removing acidic components from the flue gas but is also capable of
removing heavy metals, such as mercury, cadmium, and lead. This heavy metal removal
capability of the GSA process at the NCER will be evaluated later in the test program.
PRO,IEcr STATUS AND KEY MH.M.,STONES
The project schedule and tasks involved in the design, construction, and operation and testing
phases are as follows:
Phase I - Engineering and Design Start - End1.1 Project and Contract Management 11/01/90-12/31/911.2 Process Design 11/01/90-12/31/911.3 Environmental Analysis 11/01/90-12/31/911.4 Engineering Design 11/01/90-12/31/91
Phase H - Procurement and Construction
2.1 Project and Contract Management 01/01/92-09/30/922.2 Procurement and Furnish Material 01/01/92-04/30/92
2.3 Construction and Commissioning 05/01/92-09/30/92
Phase HI - Operating and Testing3.1 Project Management 10/01/92-02/28/943.2 Start-up and Training 10/01/92-10/14/923.3 Testing and Reporting 10/15/92-02/28/94
The progress of this project has been on or ahead of schedule. The parametric optimizing tests
are scheduled for completion in August 1993. Following the air toxics testing, which is
scheduled to be conducted in September, there will be a one month around-the-clock
demonstration run.
- 367 - SecondAnnualClean Coal TechnologyConference

TEST PLAN
A test plan was prepared to depict in detail the procedures, locations, and analytical methods to
be used in the tests. The following objectives are expected to be achieved by testing the GSA
system:
• Optimization of the operating variables.• Determination of stoichiometric ratios for various SO2 removal efficiencies.• Evaluation of erosion and corrosion at various locations in the system.• Demonstration of 90% or greater SO2 removal efficiency when the boiler is fired
with high-sulfur coal.• Determination of the air toxics removal performance.• Evaluation of the PJBH performance in conjunction with the GSA process.
Optimization Tests
The optimization of the SO2 removal efficiency in the GSA system will be accomplished through
the completion of a statistically-designed factorial test plan. For each test series, the GSA system
is set to operate at a certain combination of operating parameters. The results of these test series
are analyzed statistically to determine the impact of the operating parameters, thus arriving at the
optimum operating point for the GSA process at the various operating conditions expected in
future applications. Operating parameters that may be varied in different test series for process
optimization purposes are the following:
• Inlet flue gas flow rate• Inlet S02 concentration (dependent on availability of different coal)• Inlet flue gas temperature• Inlet dust loading• Solids recirculation rate• Stoichiometric ratio
• Approach-to-saturation temperature• Coal chloride level
_ I I II II I II
SecondAnnualCleanCoalTechnologyConference - 368-

Preliminary tests were conducted prior to the factorial testing to determine the ranges that these
parameters could be varied. The results from the preliminary testing were used as the basis for
the design of the factorial test program.
Datq Co!lection
The following data will be sampled and recorded during the tests by either the computerized data
qampling and recording system (via field mounted instruments) or manual field determinations:
• Inlet flue gas flow into the system• SO2 and HCI loading at the syb-teminlet, SO2 loading at the ESP inlet and outlet• Flue gas temperatureat the system inlet, the reactor outlet, and the ESP outlet• Particulate loading at the ESP inlet and outlet• Fresh lime slurry flow rate and composition (for lime stoichiometry calculation)• Water flow rate
• Wet-bulb temperature at the reactor inlet (for approach-to-saturation temperaturecalculation)
• Coal analysis (proximate and ultimate)'• Lime analysis• Byproduct rate and composition• Water analysis• Power consumption
Preliminm*y Testing
Immediately after the dedication of the AirPol GSA demonstration plant in late October 1992,
a series of preliminary tests was begun. The purpose of these tests was to investigate the
operating limits of the GSA system as installed at the NCER. The results from several of the
preliminary tests completed at the NCER in November and December were very interesting.
During one of these tests, the approac_-m-saturation temperature in the reactor was gradually
decreased and the overall system (reactor/cyclone and ESP) SO2 removal efficiency was
monitored over this four-day test. The overall system SO2 removal efficiency increased from
about 65% to more than 99% at the closest approach-to-saturation temperature (5°F). The other
conditions, which remained constant, were 320°F inlet flue gas temperature, 1.40 moles
I I illll
- 369 - SecondAnnualClean Coal TechnologyConference

Ca(OH)2/moleinlet SO: for the lime stoichiometry,and essentially no chloride in the system.
The $O: removal resultsfrom this test areshown in Figure 3.
Figure3. PreliminaryAirPol GS/_ Test Results ..........
The datafrom this test show thatthe SO: removal efficiency increaseddramaticallyas the flue
gastemperaturein the reactormoreclosely approachedthe saturationtemperatureof the flue gas,
with the incrementalincreasesin the SO: removal becoming more and more significant as the
approach-to-saturationtemperaturedeclined. The ability of the GSA system to operateat this
close approach-to-saturationtemperaturewithout any indication of plugging problems was
surprising. Later analysis showed that the moisturelevel in the solids remainedbelow 1%.
I II II II lUll I Illl ill IIi
Second Annual Clean Coal Technology Conference - 370 -

A second extended test was run during December. This test was run at the same conditions as
the previous test, except that in this test, calcium chloride was added to the system to simulate
the combustion of a high-chloride (about 0.3%) coal. Previous work by TVA at the NCER had
demonstrated that spiking these semi-dry, lime-based FGD processes with a calcium chloride
solution adequately simulated a high chloride coal application. Again, the approach-to-saturation
temperature was gradually decreased over a four-day period with all other conditions held
constant and the overall system SO=removal efficiency was monitored. The preliminary results
from this second test are also shown in Figure 3 above.
The overall system SO2 removal efficiency increased from about 70% at the high approach-to-
saturation condition to essentially 100% at the closer approach-to-saturation temperature (23°F).
No attempt was made to operate the system at the close approach-to-saturation temperatures used
in the first test because the SO2 removal efficiency was approaching 100%. In addition, there
were initially some concerns about the secondary effect of calcium chloride addition. Calcium
chloride is an ionic salt that tends to depress the vapor pressure of water in the system and thus,
slows the evaporation of water from the slurry. Calcium chloride is also a hygroscopic material,
which means it has the ability to absorb moisture from the humid flue gas. The increased
moisture in the "dry" solids allows more reaction with SO2, but also increases the potential for
plugging in the system. The easiest method for mitigating this potential for plugging is to
increase the approach-to-saturation temperature in the reactor. However, the moisture levels in
the solids during this test remained below 1%, even at the closest approach-to-saturation
temperature.
Another interesting finding from the preliminary testing is that the GSA process is capable of
supporting a very high level of recirculation material in the reactor. This high solid concentration
inside the reactor is the reason for the superior drying characteristics of the GSA system. Based
on the results from these initial tests, the recycle rate back to the reactor was doubled prior to
starting the factorial testing.
I III
- 371 - SecondAnnualClean Coal TechnologyConference

FactorialTestina
The primary focus of the recent GSA testin8 was the completion of the statistically-designed
factorial test program. The purpose of this factorial testing was to determine the effect of the
process variables on the SO2 removal efficiency in the reactor/cyclone and the ESP.
Based on the successful preliminary testing, the major process design variables were determined.
levels for each of these variables were defined, and an overall test plan was prepared. The major
variables were approach-to-saturation temperature, lime stoichiometry, flyash loading, coal
chloride level, flue gas flow rate, and recycle screw speed. Two levels were determined for
nearly all of the variables and these variables and levels are shown in the table below. The one
exception was the approach-to-saturation temperature where three levels were defined, but the
third level was only run for those tests at the lower coal chloride level.
ill I i ii i ill i i I i ,!,,,,| ,,,, i lliH I I Jl
Major Variables and Levels for Factorial Testing Table-- i I I Iiiiiiiii ill i i i Iii ] ._
I
Variable " LevelI i i I i l ll. i i J I
Approach-to-saturation temperature °F 8°, 18, and 28i I ilili i iL ii ii iI i ilil
Ca/S moles Ca(OH)2/mole inlet SO2 1.00 and 1.30iii i i I iiiii ii im m iii i i
Flyash loading sr/acf 0.5 and 2.0I I I I I II Illl I I II
Coal chloride level % 0.02 and 0.12
Flue gas flow rate kscfm 14 and 20i i i ii ii i i imil[ I llgll
Recycle screw speed rpm 30 and 45i i I lmll i Imlll IIIIII I I IlII
• 8OFlevel run only at the low-chloride levelI ._ . il • I , , ill i ,,,H,
['able 1. Major Variables and Levels for Factorial Testing
I
SecondAnnualClean Coal TechnologyConference - 372,.
• .... •

Although the preliminary chloride spiking tests had not been run at an approach-to-saturation
temperaturebelow 23°F, the decision was made to complete these chloride-spiking factorial tests
at ms 18'F approach-to-satur_on temperature. There was some risk in this decision because the
water evaporation rate is decreased at the higher chloride levels. However, based on previous
test work at the NCEI_ the expectation was that at the lower Chloride levels in this test plan,
equivalent to a coal chloride level at 0.12%, the GSA system could operate at the 18°F approach.
to-saturation temperature condi_on.
RESULTS OF FACTORIAL TESTING
SO2 Rgmoval EffiCjancy
The overall system SO2 removal efficiency results from these factorial tests are currently being
analyzed, but several general relationships have become apparent. First, as was expected based
on the previous testing at the NCER, significant positive effects on the SO2 removal efficiency
in the system came from increasing the lime stoichiometry and other factors such as increasing
the coal chloride level or decreasing the approach-to-saturation temperature. Increasing the
recycle rate resulted in higher SO2 removal, but the benefit appeared to reach an optimum level,
above which furtherincreases in the recycle rate did not seem to have a significant effect on SOz
removal. Increasing the flue gas flow rate had a negative effect on the SO2 removal in the
system.
The overall system SO2removal efficiency during these tests ranged from slightly more than 60%
to noarly 95%, depending on the specific test conditions. The higher SO2 removal efficiency
levels were achieved at the closer approach-to-saturation temperatures (8 and 18_F),higher lime
stoichiometry level (1.30 moles Ca(OH)z/mole inlet SO2), and the higher coal chloride level
(0.12%). The lower SO2 removal efficiency levels were achieved at the higher approach-to-
saturation temperature (28°F), the lower lime stoichiometry level (1.0O mole Ca(OI-I2/moleinlet
SOz), and the lower coal chloride level (0.02-0.04%). Most of the SO2 removal in the GSA
system occurs in the reactor/cyclone, with only about 2 to 5 percentage points of the overall
- 373 - SecondAnnual Clean Coal TechnologyConference

system removal occurring in the ESP. There is substantially less SO2 removal in the ESP than
in the previous testing at the NCER, but the overall system SO2 removal efficiencies appear to
be higher with the GSA process for most test conditions.
As one would expect, the lime stoichiometry level, which was tested at 1.00 and 1.30 moles
Ca(OI-I)2/moleinlet SO=,seems to have the most significant effect on the SO2 removal efficiency
in the GSA system.
The approach-to-saturation temperature, which was evaluated at three levels of 8, 18, and 28°F
for the low coal chloride conditions and the two levels of 18 and 28°F for the higher coal
chloride condition, appears to be the second most important variable in the GSA system in terms
of the overall system SO2 removal efficiency.
The third most important variable seems to be the chloride level in the system. Two coal
chloride levels were tested, the baseline coal chloride level of 0.02 to 0.04% and the equivalent
of a 0.12% coal chloride level. The higher chloride level was achieved by spiking the feed slurry
with a calcium chloride solution.
One of the most surprising results of this factorial testing was the ability of the GSA system to
operate at an 8°F approach-to saturation temperature at the low-ch!oride condition without any
indication of plugging. This is even more impressive given the very low flue gas residence time
in the reactor/cyclone. The second interesting result of this testing was the ability of the GSA
system to operate at the 18W approach-to-saturation temperature at the higher chloride level. In
the preliminary testing at a much hisher coal chloride level (0.3%), the lowest approach°to-
saturation temperature tested was 23_F. No operating problems were encountered in the tests
completed at the 0.12% coal chloride level and 18W approach-to-saturation temperature
conditions. In fact, the average moisture level in the solids remained below 1.0% in all of these
factorial tests, even at the hisher coal chloride level.
Ill I I IIll I __
SecondAnnualCleanCoalTechnologyConference - 374-

ESPPerf0rmanc,
The ESP installed at the NCER is a relatively modem, 4-field unit with 10 in. plate spacing,
similar in design to several full-scale ESPs installed on the TVA Power System. This unit has
23-ft.-high plates with 8 parallel gas passages. The specific collection area (SCA) of this unit
is about 440 ft2/kacfm under the cooled, humidified flue gas conditions downstream of the
reactor/cyclone. (For the untreated flue gas at 300°F, i.e., in a fly-ash-only application, the SCA
of this ESP is about 360 _/kacfm.)
The particulate removal performance of this ESP was determined for each of the factorial tests,
even though this was not the primary focus of the testing. The most important result of this
particulate testing was that the emission rate from the ESP was substantially below the New
Source Performance Standards (NSPS) for particulate (0.03 lb/MBtu) at all of the test conditions
evaluated. The typical emission rate was 0.010 lb/MBtu. The particulate removal efficiency in
the ESP for nearly all of the tests was above 99.9% and the outlet grain loadings were below
0.005 gr/acf.
However, during the testing there were disturbing indications of low powe _ the first field
of the ESP, particularly in those tests involving chloride spiking. In soi,_ • these chloride-
spiking tests completed at the high flue gas flow rate (20,000 scfm), the power level in the first
field was only about 5% of the normal level, effectively meaning that the first field had
"collapsed." Even with these low power levels in the first field of the ESP, the particulate
removal efficiencies were still 99.9+% and the emission rate was in the range of 0.010 lb/MBtu.
The cause of these low power levels in the first field of the ESP is being investigated. These low
power levels could be the result of a number of factors, including plate-wire alignment problems
as observed in a recent internal inspection.
One surprising result of this ESP testing was that there was no significant improvement in the
ESP performance with increasing SCA. For some of these tests, the SCA in the ESP approached
IIII I I Illl I
- 375 - SecondAnnualClean Coal TechnologyConference

800 ft2/kacfm and the flue gas velocity in the ESP dropped below 2.0 ft/sec and yet the emission
rate remained in the same range as in the other tests, i.e., 0.010 lb/MBtu.
pulse $¢t Baghouse Performgnce
Although not part of the original GSA project, TVA and EPRI had coftmded the installation of
a 1-MWe PJBH pilot plant at the NCER to be operated in conjunction with the existing GSA
demonstration. Later, AirPol and DOE joined in the operation and testing of this PJBH pilot
plant program. The PJBH pilot plant, which was started up in late January, can pull a slipstream
of flue gas from either the ESP inlet or outlet, as shown in Figure I. In the first series of
factorial tests, the PJBH pilot plant pulled flue gas from the ESP inlet and thus, treated flue gas
with the full particulate loading (3 to 5 gr/acf) from the GSA reactor/cyclone. The inlet flue gas
flow rate was about 5,000 acfm, which corresponds to an air-to-cloth ratio (A/C) of 4.0 acfm/ft 2
in the PJBH. During the second series of factorial tests, the PJBH pilot plant pulled flue gas
from the ESP outlet. The same inlet flue gas flow rate was treated (5,000 acfm), but two-thirds
of the bags were removed prior to this testing and thus, the A/C for these tests was 12 acfm/ft 2.
The cleaning of the bags in the PJBH was pressure-drop-initiated during this testing with the
cleaning cycle beginning whenever the tubesheet pressure drop reached 6 in. of water. The
cleaning continued until the tubesheet pressure drop had declined to about 4-1/2 inches of water.
The bags were cleaned by a low-pressure, high-volume, ambient air stream delivered by a
rotating manifold.
SQ2 Removal Efficiency
The SO2 removal efficiency in the reactor/cyclone/PJBH system was typically about 3-5
percentage points higher than that achieved in the reactor/cyclone/ESP system at the same test
conditions. This higher SO2 removal efficiency in the PYBH system was not unexpected given
the in,fimate contact between the SO2-1adenflue gas and the solids collected on the outside of the
bags as the flue gas passed through the filter cake and the bags before being discharged to the
___ _ I iiii II
Second Annual Clean Coal Technology Conference - 376 -
I

stack. However, it should be noted that most of the SO2 removal occurred in the reactor/cyclone
and the PJBH SO2 removal efficiency, based on the inlet SO2 to the reactor, contributed less than
8 percentage points to the overall system SO2 removal efficiency during this testing.
p_,_iculate Remov_
The particulate removal efficiency in the PJBH was 99.9+% for all of the tests completed with
the full dust loading from the GSA reactor/cyclone. The emission rate for all of these tests was
well below the New Source Performance Standardsfor particulates andwas typically in the range
of 0.010 lb/MBtu.
Demonstration Run.
Based on the findings during the factorial testing, the GSA system will be operated at optimum
settings for a four-week consecutive period of around-the-clock operation to demonstrate the
reliability of the system operation as well as its SO2 removal capability. During the
demonstration r-_n,all controls will be switched to automatic mode with set points determined
from the optimizing tests.
COMMERCIALIZATIONe
One of the objectives of this demonstration project is for AirPol to establish its capability in
designing, fabricating, and constructing the GSA system so that the demonstrated technology can
be effectively commercialized for the benefit of the U.S. electric utility and industrial markets.
The progress of this demonstration project matches very well with the development of the utility
FGD market. The GSA technology is now ready to be commercialized for the industry in order
to meet the Phase H Clean Air Act Amendments compliance requirements.
During the course of designing the demonstration unit, an effort was made by AirPol to
standardize the process design, equipment sizing, and detailed design so that the installation of
IIIIlUl
- 377 - SecondAnnualClean Coal TechnologyConference

a commercial unit can be accomplished within a relatively short time frame. An effort was also
made during the design phase to achieve simplicity in the equipment design, which later proved
to contribute to reduced material and construction costs. Another major effort being made at
AirPol now is to scale up the GSA design to accommodate a utility plant up to 200 MWe with
a single GSA reactor. Having gained the confidence that the GSA system is capable of achieving
the required levels of performance, the current effort being made at AirPol is to develop standard
design of scale-up units. Meanwhile, field operating experience and findings continue to help
perfect the design process.
DISCUSSION
As of September 1993, the design, fabrication, installation, and performance optimization of the
GSA system for the Clean Coal Technology demonstration project will have been completed.
AirPol will have successfully demonstrated the technical pe_ .rmance of the GSA FGD process.
It is expected that the results of the air toxics test will confirm that GSA is also capable of
removing heavy metals such as mercury, cadmium, and lead. As this demonstration program is
coming close to its completion, it can be concluded now that the GSA process is a viable solution
to the SO2 removal problem of coal-fired boiler plants, and AirPol is ready to offer the
technology for commercial application.
DISCLAIMER
Reference in this report to any specific commercial product, process, or service is to facilitatei
understanding and does not necessarily imply its endorsement or favoring by either DOE or TVA.
i ii ii
SecondAnnualCleanCoalTechnologyConference - 378-

I.,IFAC SORBRNT INJECTION FOR
FLUE GAS DI__TION
Juhani ViialaTuomo Poidd
TampeUaPower Corp.2300 WindyRidge Parkway
Atlanta, Georgia 30067
James HervolICF Kaiser Engineers, Inc.
Four Gateway CenterPittsburgh,Pennsylvania 15222
IrvingHuffmanRichmond Power & Light
2000 U.S. 27 SouthRichmond, Indiana 47375
Abstract
This paper discussel;the demonstration of LIFAC sorbent injection technologyatRichmond Power and Light's (RP&L) Whitewater Valley Unit No. 2 under the auspicesof the U.S. Department of Energy's (DOE) Clean Coal program. LIFAC is a sorbent
injection technology capable of removing 75 to 85 percent of a powerplant's SO2emissions using limestone at calcium to sulfur molar ratios of between 2 and 2.5 to 1.The site of the demonstration is a coal-fired electric utility powerplant located inRichmond, Indiana, which is between Indianapolis, Indiana and Dayton, Ohio. Theproject is being conducted by LIFAC North America, a joint venture parmership ofTampella Power Corporation and ICF Kaiser Engineers, in cooperation with DOE,RP&L, and several other organizations including the Electric Power Research Institute(EPRI), the State of Indiana, and Black Beauty Coal Company.
!
I
- 379 - SecondAnnualClean Coal TechnologyConference

Introduction
The Clean Coal Technology Program(CCT) has been recognizedin theNational EnergyStrategy as a majorinitiativewherebycoal will be able to reachits full potential as a sourceof energy for the nationand the internationalmarketplace. Attainmentof this goal dependsupon the developmentof highly efficient, environmenta_y sound, competitivecoal utilizationtechnologies responsiveto diverseenergy marketsand variedconsumerneeds. The CCTProgram is an effortjointly funded by governmentand industrywherebythe mostpromisingof the advancedcoal-b_ technologiesarebeing moved into the marketplacethroughdemonstration. The CCT Programis being implementedthrougha total of five competitivesolicitations. This paper discusses the LIFAC sorbent injectiontechnologywhich wasselected in the thirdroundof CCT soh'citations.
LIFAC North America, a joint venturepartnershipof ICF KaiserEngineers, Inc. andTampena Power Corporationof Finland, will demonstratethe LIFAC flue gas desulfurizationtechnology developed by TampeUa. This technology provides sulfurdioxide emission controlfor powerplants, esp_ally existing facilities with tight space limitations. Sulfurdioxideemissions are expected to be reducedby up to 85_ by using limestoneas a sorbent. Thelimestone is injected into the upperregions of a furnace, where calciningto lime and partialabsorption of SO2occur. Subsequently,the combustiongas is passedthrougha uniquepieceof equipment knownas the activation reactor. This is a verticalelongationof the ductworkbetween the airpreheaterand ESP where the combustiongas is humidifiedand SO2absorption is completed. The LIFAC technology will be demonstratedat Whitewater ValleyUnit No. 2, a 60-MWe coal-firedpowerplantowned and operated by RichmondPower andLight (RP&L) and locatedin Richmond,Indianr. The Whitewaterplantconsumes high-sulfurcoals with sulfur contents rangingfrom 2.0 - 2.9 percent.
The project, co-funded by LIFAC North Americaand DOE, is being conductedwith theparticipationof RichmondPower and Light, the State of Indiana, the ElectricPowerResearch Institute, and the Black BeautyCoal Company. The projecthas a total cost of 21.4million dollars and a durationof 48 months from the preliminarydesignphase throughthetesting program.
The sponsors of thisprojectbelieve that Ln=AC has the potential to be a new and importantSO2 control option for U.S. utilitiessubject to the Clean Air Act's acid rainregulations. Tobe considered as a commerciallyfeasible option in this particular emissions control market,LIFAC must demonstratea high SO2removal rate while remainingcompetitivewith otheroptions on a cost per ton of SO2removed basis. To this end, the sponsorsof this projecthave designed the demonstrationwith the following goals in mind:
• Sustained High SO2RemovalRate - Incorporatedinto the test planare several periods oflong term te_tingwhich are intended to demonstrateLIFAC's SO2removal and reliabilitycharacteristicsundernormaloperating conditions.
• Cost - LIFAC must competewith both low capital cost, low SO2removalrate optionssuch as sorbent injectionand high capital cost, high SO2removal rateoptions such as wet
Second Annual Clean Coal TechnologyConference - 380 -

scrubbing. This projectwill demonstrateLIFAC's competitivenesson a cost per ton ofSO_removedbasis with these currentlyavailablealternatives.
• RetrofitAdaptability- The host site chosen requireda retrofitwith tight constructionconditionsthatwill prove LIFAC's ability to be installedwhere other technologiesmightnot be possible. Constructionwas also to demonstrateLIFAC's ability to be builtandbroughton-line with zero plant down time other than scheduledoutages.
• System Compatibility- A major concernof utilities is the degree of compatibility of $Chremoval systems with their existing operations. This demonstrationwill show LIFAC'sminimal impact on the host site's boiler and associated subsystems.
LIFAC Process History and Description
In 1983, Finland enactedacid rain legislation which appliedlimits on SC_emissionssufficient to requirethat flue gas desulfurizationsystems havethe capability to remove about80 percentof the sulfurdioxide in the flue gas. This level could be met by conventionalwetlimestone scrubbersbut not by then available sorbentinjection technology. Tampella,therefore, began developing an alternative sorbentinjection system whichresulted in theLIFAC process.
InitiaUy, developmentfirst involved laboratory and pilot planttests, then full-scale tests ofsorbent injection of limestone. Using high-ash, low-sulfur coal and a Ca/S molar ratio ofthree to one, TampeUawas unable to achieve a 50 percentSO2removal rate at it's 160megawatt Inkeroinenfacility. Substitution of lime for limestonewas rejected due to its highC,OSL
Subsequent researchand development by Tampella led to theaddition of a humidificationsection after the furnacewhich became known as the LIFACprocess. The sorbentinjectionprocess was installed full scale on a 220 megawattboiler locatedat Kristiinankaupunki,Finland and a side-su'camrepresenting2.5 megawattswas used to test a smallhumidificationreactor. SO2removal rates of up to 84 percentwere achieved at this plant.Additional tests at the Neste KuLloocombustionlaboratory were conductedat 8 megawattsand also achieved 84 percentremoval rates.
In 1986, the first large fuU scale test was performed at lmatran Voima's Inkoo powerplantusing a 70 megawatt side-stream from a 250 megawatt boiler. A 76 percent SChremovalrate with 1.5% sulfur coal was reached. A second LIFAC activation reactor was constructedto handle an additional 125 megawatt side-stream. This newer reactoris achieving removalrates of 75 to 80 percent while using Ca/S molar ratios of between 2 and 2.5 to 1. Also, in1988 the first tests with high-sulfur U.S. coals were run at the Neste KuUoo Laboratory. APittsburgh No. 8 Seam coal containing 3 percent sulfur was tested and an SO2 removal rateof 77 percent was achieved at a Ca/S molar ratio of 2 to 1.
__
iii i ii I iiii iiilUll illll
- 381 - Second Annual Clean Coal Technology Conference

LIFAC Process Description
The LIFAC system combines conventionallimestone injection into the upperfurnaceregionwith a post-furnacehumidificationreactorlocated between the airpreheaterand the ESP.The process producesa dry, stable waste product that is removed from both the bottomofthe humidificationreactor and the ESP.
Finely pulverizedlimestone is pneumaticallyconveyed and injectedinto the upperregionofthe boiler where temperaturesare approximately 1800 to 2200 degreesFahrenheit. At thesetemperaturesthe limestone (CaCO3)calcines to form lime (CaO) whichreadily reactswiththe SO2 to form calcium sulfate (CaSO4). All of the sul6.trtrioxide(SO,_)reactswith theCaO to form CaSO4.
Approximately25 percentof the sulfurdioxide removal occurs in the boiler with theremaining75 percentand the unreactedlime passing throughthe airpreheaterto thehumidificationreactor. There the flue gu is sprayed with w-alto"thatallows the unreactedlime to hydrateto Ca(OI-I_which more readily reacts with the sulfur dioxide and formsCaSO3. A combinationof the properwater droplet size and residence time allows foreffective hydrationof the lime and complete water evaporationto createa dry reactorbottomproduct.
After exiting the humidificationreactor, the flue gas is reheated beforeentering the ESP. Thehumidification andlower gas temperatureenhance the efficiency of the ESP. Seventy-fivepercent of the LIFAC-producedspent sorbentand fly ash is collectedby the ESP with theother 25 percent collected by the humidificationreactor. Both the reactorand ESP ash maybe recycled to a pointaheadof the reactorto improvesorbent utilizationand to improvetheSO2.removal efficiency of the system to the rangeof 75 to 85 percent. A schematicof theLIFAC process is shown in Figure 1 along with the typical samplinglocations used duringthe demonstration.
Process Advantages
LIFAC is similarto other currentsorbent injection technologiesbut has unique advantageswith its use of a patentedvertical humidificationreactor. And while IHFAC's sulfurdioxideremoval efficiency is not as high as traditionalwet flue gas desulfurizationsystems, its costand simplicity of design, constructionand operation offer other advantagesover thesealternative systems. In particularthe advantages of the LIFAC system are:
• High SO_removal rates - Currentlyavailable sorbent injection systems have beenunablew sustain high SO2removal rates with any consistency. LIFAC has proven in the pastand intends to demonstrateduringthis project the ability to achieve and sustainhigh SO2removal rates of 75 to 85 percentover long operating periods.
• By-products - Wet lime and limestone scrubbingsystems createa wet byproductash thatmust be furthertreatedbefore disposal. LIFAC produces a dry solid waste ash
i
1 -I
Second Annual Clean Coal Technology Conference - 382 -

containing calcium sulfide, calcium sulfateand fly ash. This waste is easily disposed ofunderU.S. regulatoryrequirements,may be recycled to increase LIFAC's efficiency andmay have commercialapplicationsin the cement industry.
• Compatibilityand Adaptability- LIFAC has minimal impacton the host's site andsystems, primarilythe boiler, ESP and113fan. In addition,LIFAC requireslittle spaceand few utilities and therefore is easily installedeven in small or crampedpowerplantsites.
Construction and Systems Integration
Constructionof the LIFAC system has occurredin two phases over a period of one and ahalf years. The first phase of constructionwas completedduringa routineplantoutage inMarch, 1991. The period was utilized to install tie-ins to the host site's existing systems.
Ductwork and threedamperswere installed between the air preheaterand ESP to allow fluegas flow to the LIFAC activationreactor. Tie-ins were also made to the powerplant'shigh-pressure steam, condensate and fiver-water supplies. The high-pressuresteamis requiredtoreheat the flue gas exiting the LIFAC reactorand the water is needed for flue gashumidificationinside the reactor. Injectionports were also installed in the boiler walls about10 feet above the nose elevation.
The second phase of constructionbegan in the Fall of 1991 with the drivingof reactorpilingand the installationof undergroundconduitruns. Work continued throughto the Summerof1992 with no need for plant downtime other than normallyscheduledoutages. Duringthistime the limestone storage areawas completedand the injection system was installed on UnitH2. The activationreactor was constructedand then tested with both cold air duringascheduledUnit At2outage and hot flue gas duringa low electricity demandperiod. Otherpowerplant tie-ins such as the steam and condensate system were also tested duringlowdemand periods in the evening or on weekends.
All of the constructionwork associated with the LIFAC system was performedin closeproximity to the exterior of the powerplantor in crampedareas inside the plant. Theductwork tie-ins and new steelwork requiredinside the plant are located in small, difficult toaccess work areas. The reactor structureis approximatelyten feet from the powerplantwiththe outside ductworkand piping crossing overtop of offices and the plantmaintenancearea.All of these new structuresand equipmentwere constructedwith no interference to dailyplant operations.
Schedule
The currentschedule for the LIFAC demonstrationprogramextends over a four year periodfrom the beginning of preliminarydesign in August 1990 through the testingprogramto becompleted in early August 1994 (see Figure 2). The LIFAC system was originally scheduled
__il III II IIII
- _
- ' - - 383 - SecondAnnual Clean Coal TechnologyConference

to come on-line in June of 1992 but due to delays in receivingconstructionpermitsand someminor startupproblems, this date was moved to March 1993. Althoughtesting is scheduledto continue throughthe Summerof 1994, preliminarytest resultsare now available.
Currentlythedemonstrationprojectison trackwiththerevisedscheduleshowninFigure2.AllconstructionworkwascompletedatthebeginningofAugust1992.Equipmentcheck-outwasperformedinJulyandAugustandthefirstlimestonedeliverywasreceivedinearlySeptember. Initial tests with limestone injection into the boiler along with post-furnacehumidificationwere conducted in October to December 1992. Having overcome all thenormal operationalproblems thataccompany retrofit installations, the project team waspreparedto conductthe test plan beginning in early 1993.
Test Plan
The test plan for the LIFAC demonstrationis composed of five distinctphases, each with itsown objective. The first of these phases, which has alreadybeen completed,consistedof theinitial baseline testing portion of the project. Measurementswere takento characterizetheoperation of the host's boiler and associated subsystems prior to the use of the LIFACsystem. The results will be used for comparisonpurposes with the LIFAC system inoperation and with data collected at the end of the project to determineany changes in thehost'ssystems.
The second,orparametric,phaseoftestingiscurrentlyunderwayandwillbeperformedtodeterminethebestcombinationofLIFAC processvariablesforSO2removal.Thevariablesbeingstudiedincludethelimestoneinjectionnozzles'angleandlocation,theCa/Smolarratio,theneedforsupplementalinjectionairattheboiler,thewaterdropletsizeandinjectionnozzlearrangementinthereactor,theashrecyclingratioandtheapproachtosaturationtemperatureofthefluegasexitingtheactivationreactor.Thebestcombinationofthesevariableswillbechosenattheconclusionofthisphaseandusedfortheremainderofthetestprogram.
Optimization tests will be conducted to examine the effects of differentcoal and limestonefeeds on the SO2capture rate. Coals with sulfur contents as high as 3.3 percentwill betested to determine L]_AC's compatibilitywith high sulfur U.S. coals. Limestones withdifferent compositions will also be tested to determine the LIFAC system's adaptability tolocal sorbent sources.
Long termtestingwillalsobe performed to demonstrateLIFAC'sperformanceundercommercialconditions.TheLIFAC systemwill beinoperation24hoursperdayforseveralwee_ using the power_i_-_t'sbaseline coal, high calcium limestone and the optimumcombination of process v_iables. In addition to process performancemeasurements,duringthisphasetheoperationandmaintenancerequirementsofthesystemwillbeexamined.Longterm(twotothreeweeks)testswillalsobeconductedwithtwoothercoals;onelowersulfurcoal(1.5%)andonehighersulfurcontentcoal(3.3%).
__,,_ I
imnnl iml I
Second Annual Clean Coal Technology Conference - 384 -

The final phase of testing is composed of the post-LIFACtests. The _ne tests will berepeatedto gather informationon the conditionof the boiler and its associatedsubsystems.Comparisonswill be made to the original baseline datato identifyany changeseithercausedby the LIFAC system or ind_dcnt of its operation.
PreUnflnaryResults
Once startupand checkout were complete and the operationalproblemsovercome, the projectteam initiatedparametrictesting. During the early testswith limestoneadditionandhumidification,increases in opacity levels preventedthe system frombeing _ted asintended. Test work conductedby EPRI and SouthernRe.um_h Instituteidentifiedthe causeas lower ash resistivity resulting from reduced operatingtemperaturesin the ESP. Theactivation reactoris designed to humidify the flue gas and drop the gas temperaturetoslightly above saturationtemperaturein order to maximizeSO_c_pture. The flue gas is thenreheatedto above 175° Fahxcnheitas it exits the activationreactor. Due to the relativelysmall size of the ESP (only 200 SCA) and because of lower ash resistivities, it wasdeterminedthe ESP needed to be operatedat about 200°Fahrenheitto avoid anyproblemswith increasedopacity. Having determinedthis, the operatingprcr,edureswere revised toinsure an ESP operatingtemperatureabove 200_Fahrenheit.
Parametrictesting was initiatedat 60 MW to assess the broadimpactsof limestone injection,flue gas humidification,and sorbentrecycle. Figure 3 shows averagereductionsachievedthroughoutthe LIFAC process. About 22 percent SO2reductionis achieved in the boiler.This is increased to about 52 percent with humidification,and furtherraised to 75 percentwith the use of sorbentrecycle from the ESP ash hoppers. These tests were conductedwitha fine grindlimestone (80% minus 325 mesh) with a Ca contentabove 90 percent. A Ca/Smolar ratio of 2.0 was held near constantand a 4 to 5° Fahrenheitapproachto saturationwasmaintainedin the activationreactor.
Figure 4 shows the impactsof varying the Ca/S molar ratio. The majorityof the tests havebeen conductedat 2.0, but the trendsare as expected. The higher the Ca/S ratio, the higherthe SO2reduction. Results show, however, that SC_reductionsof 75 to 85 percentarepossible when spent sorbent is recycled and a 3 to 5° Fahrenheitapproachto saturationtemperature is maintained.
Figure 5 shows the impact of recycling spent sorbentundervarious boiler loads. The CaISmolarratiowas maintainedat about 2.0 and the level of humidificationis high (4 to 5°Fahrenheitabove saturation). Generally, there is an 18 to 25 percentagepoint increaseinSO2reductionas a result of sorbentrecycle. With recycle, total SO2reductionsrangedfrom75 to 85 percent dependingon boiler load.
Although only preliminarytesting has been completed, the results areencouraging.Additional work will be conductedto optimize these process parametersin hopes ofmaintaininga minimumof 80 percent SO2reductionat all boiler loads.
-- I ii __ -- Ill I I I
- 38.$- Second Annual Clean Coal Technology Conference

At this point it has also been shownat RP&L and other LtFAC installationsthat the systemcan be installedand operatedwithout affecting normalpowerplantolm_ons. It will also beshown thatthe system can economicallyreduce SOzemiuions when comlmed with otherflue gas desulfufizaflontechnologies.
References
1. Ball, M.E. and Enwald, T., "LIFACDemonstrationat Poplar ltiva", GLOBE-_Productand TechnologyDemonstrationSeminars,March1992.
2. DOECo=tactNo.DE-FC22-90PC90548,"UFACDemonstrationat FIi_mond PowerandUght WhitaWaterValleyUnit_ March1992.
3. Rose,J., Hervol,J., Viia]a,I., Kosldaea,]., Patel,]. andHuffaam,I., "UFACFlueGasDesulfur/zation',March1992.
IIII llIl llIll _ I I__
SecondAnnualClean Coal TechnologyConference .386 -

<_ Ur__ coil, vorlfl_ithm
<_ P,._,veri_dcoal ,_ ESPash
'_ Umeitone <_ Ashknfluemmi--M.TO._,
V
co_ _'-" " : '_:
l-_:z._i_::.:.:_'!_._:::ii.'/li,_:: I_ _ _
Figure 1. UFAC RP&LDEMONSTRATION- SOUDS SAMPLINGLOCATIO_

-:..-...............................................................OOeO OOOO000000OOgOO OOOeO00000OOO000000000
Months
Start Dale:August S, 1990 2 4 6 8 10 12 14 16 18 20 22 24 26 28 30 32 34 38 38 40 42 44 46 48
Phuem mm'-- mmin ni mmmmiPreliminary Design mm aim mm mmFinal Design =. -== m .., I • m • i mEnvlromnental m-= m m m [] =
Mon,odng
Phase llA _ m m
Purchasing •m II Im II| ,I I ml i 11 1Mobilization m• m -.
Phase liB U m mInstol_tion • • l [] I i [] I i • I [] []
Environmental • I i • i i I I a i i I m
Monitoring
Phase illStadup & Shakedown ii m m • i m • iBaseline Tests i iParmtdc Toots i -= -= iOptimization Tests m -.Lon_Tsrm Tests m m-.Po_JFAC Teals mEnv_onmental mm ml Hi mE n,, r--i Iial lamB •ml am ibm m•
Mon,odng
Figure 2. LIFAC DEMONSTRATION -- CURRENT PROJECT SCHEDULE

iinJillllIIlllll
Mll_ IINI_oI!11_m_m_


Average S02 reduction [%]IO0
Boilerload = 60 MWCa/S = 2.0
delta T = 4-5 °F
eo ......................................................... 75 ..........._,'. : _ _,._
0 ................................................
52
J
' 40 ........................
|
22o_ 20
C
o 0_ Injection Inj & Activation Inj, Act & Recycling00
0
=_ Figure3. PARAMETRICEFFECTSo0
(D
::3CJ(I)

!,
?L
:3¢==_ TotalS02 reduction [%]O
Qo
Q
_ - n D= 80 " .OO "
i" - '@
_ 60 ................ "m • •
o •
o •
J
_ 40 " '_... ° . .... . .o° . . ° . ...... o.. ° . . o ° . . . . . .,. ° ° . ° . . o . ° o . .... ° . . . ° o o o_..... ° . o ° ° o
| • •
o •
0 _ ...... o . . . . ...... . . ° o ..... ° . . ° o . o .*° ° o o . . .....s
Bo!!er!osd: 43-60 MW z
deltaT = 3-5 °FRecycling= ON
0 ,,.,.,,,.l .............. _il*'i ......0 0.5 I 1.5 2 2.5 3
Ca/S molar ratio [mol/mol]
Figure4. S02 REDUCTIONvs. CaJSMOLARRATIO

Total SO2 reduction [%]loo
60 ° " "
. " : " 0 b
40 ................................................................. . .- Ca/S= 2.0- 2.1 ....|
fir = 4-5°F ....(n 20 ................ -."..... " ..... _ ........... "...... ;.....
__ o Recycling ...... . . . .
_ 0 No recycling . ..... .c:
--- 40 42 44 46 48 50 52 54 56 58 60 62 64o9)
oo Boilerload [MW]
o
Figure 5. SO2 REDUCTION vs. BOILERLOADC)O2:3(D®
oG)

III _ IIIII I I III IIIII I IIII _
SecondAnnualClean Coal TechnologyConference - 392,.

CHIYODA THOROUGHBRED 121
INNOVATIVE CLEAN COAL TECHNOLOGY
DEMONSTRATION PROJECT INITIAL TESTING RESULTS
David P. Burford
Southern Company Services800 Shades Creek PkwyBirmingham, AL 35209
Ira G. Pearl
Radian Corporation1979 Lakeside Parkway Suite 800
Tucker, GA 30084
Harry J. RitzProject Manager
U.S. DOE PETCP.O. Box 10940
Pittsburgh, PA 15236
luly 29, 1993
ABSTRACT
The Chiyoda CT-121 Project at Georgia Power's Plant Yates Unit #1 is a Round H, $36
million, Innovative Clean Coal Technology project co-funded by the Department of Energy,
the Electric Power Research Institute and The Southern Company. The CT-121 scrubbing
process features a single SO2 absorption module, called the let Bubbling Reactor (IBR),
made entirely of fiberglass reinforced plastics (FRP) where several chemical reactions
(absorptionlneuualization/oxidation/crystal growth) take place concurrently. The 100 MWe
flue gas scrubber uses ground limestone to remove up to 95 % of the SOz in the flue gas from
a pulverized coal-fired boiler, producing a high quality gypsum by-product. Gypsum wiU be
Presented _t the Second Annual Clean Coal Technology Conference, Sept 7-9,Atlanta, Georgia
m i i ii i !
- 393 - Second Annual Clean Coal Technology Conference

deposited in a gypsum "stack", a disposal technique commonly used in the phosphate
fertilizerindustry. Operational testing, continuing through early 1995, will include sustained
high performance testing, simultaneous particulateremoval in the YBR,alternate limestone
and alternate higher sulfur coal. Initial results from parametrictesting have demonstrated the
excellent S02 removal and particulateremoval performance of this unique flue gas
desulfurizationtechnology.
INTRODUCTION
As partof the Innovative Clean Coal Technology (ICCT) program, the Department of
Energy (DOE), the Southern electric system, and the Electric Power Research Institute
(EPRI) are sponsoring a 100 MWe demonstration of the Chiyoda Thoroughbred (CT-121)
process. The $36 million project is located at Georgia Power Company's Plant Yates Unit 1,
near Newnan, Georgia.
This demonstrationproject began with the retrofit construction of a CT-121 wet-limestone
scrubberto a 100 MWe pulverized coal-fired boiler. The CT-121 process involves the use
of a unique process vessel called the 1et Bubbling Reactor (YBR)in place of the traditional
spray tower/reaction tank arrangementof most conventional FGD processes. Start-up
occurred in October, 1992 and the first phase of the demonstrationbegan in Ianuary, 1993.
The demonstrationproject is scheduled to continue through early 1995.
The demonstrationis divided into two majorperiods with the first utilizing the pre-existing
electrostatic precipitator (ESP), operating at full capacity. The secondperiod, scheduled to
begin in early 1994, will involve the field-by-fielddeenergizationof the ESP and repetition
of the tests executed in the first period. The second periodwill be used to evaluate the
process' ability to remove uncontrolled particulatefrom a coal-fired boiler and the effect of
high fly-ash concentrations in the slurryon scrubber performance. The two periods are
furtherdivided into parametric testing and long-term load-foUowingtesting. It is the results
of the low-fly-ash parametric testing which are addressed in this paper (Performance,
operability, and reliability evaluation are the focus of this demonstration, with performance
characterizationthe specific focus of the parametric testing).
I II
Second Annual Clean Coal TechnologyConference - 394 -

Thus far, the performance of the CT-121 process has been excellent, with SO2removal
greater than 90% easily achievable and 98% SO2 removal achieved under some operating
conditions. Additionally, 90% of the particulam matter in the flue gas following the ESP
was removed by the JBR. Long-term testing, currently in-progress, should help establish
CT-121 as a highly reliable FGD process at a U.S. electric utility plant.
HISTORICAL OVERVIEW
The YamsChiyoda project was one of four successful proposals from The Southern
Company in Round II of the DOE's Clean Coal solicitation in 1988. Design and engineering
began in 1989 at SCS and the Cooperative Agreement was executed in April of 1990.
Construction began with ground breaking in August of 1990 and was completed in October
of 1992 foUowinga significant delay in obtaining permits from the State of Georgia's
EnvironmentalProtection Division. Operations began in late October of 1992 and continue
today.
The interest in the Chiyoda process stems from The Southern Company's previous
experiencewith five different FGD systems at Gulf Power's Plant Scholz in the late 1970's.
The CT-121 process was selected because of its reliability and potential to offer significant
cost reductions over other FGD processes. Lessons learned at Scholz and from other
Chiyoda CT-121 FGD systems have been incorporated and expanded into the aggressive
evaluationprogram now underway at Plant Yams.
FACILITY DESCRIFI"ION
Theequipmentcomprisingthedemonstrationfacilitycanbedividedintofivemajorsystems:
boiler/ESP;CT-121scrubber/wetchimney;limestonepreparationcircuit;byproductgypsum
stackingarea;andprocesscontrolsystem.
Plant Yams' Unit 1, with a rated capacity of 100 MWe, is the source of flue gas for the CT-
121 process. All of the flue gas from this unit is treated by the CT-121 wet FGD process
with no provision for flue gas bypass (The CT-121 process must remain in service whenever
I I II I I m H I
- 395 - SecondAnnualClean Coal TechnologyConference

the boiler is operating). During the low fly-ash phase of parametric testing, the existing ESP
for Unit I is being used for particulatecontrol. The design efficiency for this ESP is 98 %.
A simplified process flow diagram for the CT-121 process is presented,in Figure 1. The
CT-121 employs a unique absorber design, called a Jet Bubbling Reactor 0"BR), to combine
conventional SChabsorption, sulfim oxidation, and gypsum crystaUization in one reaction
vessel. This significantly reduces the potential,for gypsum scaling, a problem that frequently
occurs in natural-oxidation FGD sysmms. Since much of the crystal attrition and secondary
nucleation associated with the large centrifugal pumps in conventional FGD systems is also
eliminated in the CT-121 design, large, easily dewatered gypsum crystals are produced.
I ",,i _
i win)
I?---- I r"-" u''up w''",
- - I I '_Lql_ t]_" Mist I] i ....... gusflcn , , _ _ ,_w . $ls¢lt
_..a. _ __ }---*<O)_ • • __. { v s.m.nsto, I
'"'"'7"_" I I I "..="
Ox|dlllcm
Air Blower I
I°-..,. !,--, I
I GypsumI tJmemone Sumpe !I sl""_ I L I *
T Gyplum Surge PondPOflOWater •
HguR 1. Simplified CT-121 Process How Diagram
In the Yates application, the flue gas enters the inlet gas cooling section after the I.D. fan.
Here the flue gas is cooled and saturatedwith a mixture of pond water and TBRslurry.
From the gas cooling section, the flue gas enters the J'BR, the central feature of the CT-121
process. The gas enters the JBR through an enclosed plenum chamber formed by an upper
iiilul ilill
Second Annual Clean Coal TechnologyConference - 396 -

deck plate and a lower deck plate. Sparger tube openings in the lower deck plate force inlet
flue gas beneath the slurry contained in the jet bubbling (froth) zone of the JBR vessel.
After bubbling through the slurry, the gas flows upward through gas risers which pass
through both the lower and upper deck plates. Entrained droplets in the gas disengage in a
second plenum above the upper deck plate, and the cleaned gas passes to the mist eliminator.
After leaving the mist eliminator, the clean gas exits the system through a wet FRP chimney.
Since the gas enters the chimney saturated with water, any heat loss in the chimney wiU
result in gas cooling and condensation. Condensate in the chimney is collected by a system
of aeordynamicallydesigned internal "gutters" and is returned to the JBR.
A closed-circuitwet ball mill limestone preparation system is used to grindthe limestone to a
small enough particle size so that the amount of unreacted limestone needed in the JBR can
be kept to a minimum. The baseline particle size criterion is 90% less than 200 mesh.
Slurry from the gypsum slurry transfer tank is diluted andpumpedto a lined gypsum stacking
area for dewatering and storage. The stacking technique involves filling a diked area with
slurryfor gravity sedimentation. The filled area is then partially excavated to increase the
height of the containment dikes. The process of sedimentation, excavation, and perimeter
dike formationcontinues on a regularbasis during the active life of the stack. Process water
is decanted, stored in a surge pond and returned to the process.
During normal operation of the FGD system, the amount of SO2 removed from the flue gas
is controlled by varying the JBR pressure drop (AP). The AP is adjusted by varying the JBR
liquid level. Higher liquid levels result in increased SO2removal. The pH can also be
varied to affect removal with higher pH's resulting in increased removal. Boiler unit load
and flue gas S02 concentration also affect removal efficiency.
TECItNOLOGICAL ADVANTAGES
The CT-121 process, as constructed at Plant Yates, offers several technological and
economic advantages over both conventional spray tower scrubbers as well as previously
III ii I I I iii I iii i I II
- 397. Second Annual Clean Coal TechnologyConference

constructedCT-121systems.The innovationswhichprovidetheseadvantage.sincludethe
useoffiberglassreinforcedplastics,theuniqueJBR absorber,a novelwetFRP chimney
design,andtheuseofa gypsumstackforbyproductdewateringandstorage.
Fiberglass Reinforced Plastic
Many of the vessels comprising the Yates CT-121 installationare made of fiberglass
reinforced plastics (FRP) to withstand the corrosivenessof the FGD process streams. Two
of the vessels (the JBR and the limestone slurry storage tank) were constructed on-site in
1990 since their large size precludedroadwayshipment. In a temporary facility, the
contractorbuilt the two vessels by layering materials on a slow moving "mandrel",
alternatingand mixing resin applications, fiberglassmat, fiberglass weave, fiberglass strand
and chopped fiberglass in a carefully designed sequence over several week's time. FRP
internals and wall penetrations (nozzles, man-ways, sample ports, etc.) were then installed by
handwith additionalFRP components to complete these homogeneous plastic vessels. Other
FRP components that were small enough for shipment(two tanks, inlet duct section, chimney
sections, etc.) were assembled and joined on-site at about the same time. Baselinedata on
the FRP vessels' acoustic emissions and a finite element analysis were taken for comparison
to their future condition.
A distinct advantage of the FRP constructionwas that it eliminated the need for a flue gas
prescrubberto remove chlorides, because the corrosion resistance properties of fiberglassare
superior to those of alloys. This representeda large capital cost savings to the project.
The inherently high reliability of the CT-121 process eliminatedthe need for a spare
absorber. This results in significantly reduced capital costs compared to spraytower systems
which typically are built with 'spare' absorbers. Additionally, the JBR offers the distinct
advantageof providing simultaneous SO2 removal and particulatecontrol. The/BR's high
particulateremoval efficiency may allow eliminationof the ESP in new plant designs or
make it a good choice for a retrofit to a plantwith a marginally performing ESP.
i
S'eco'ndAnnualClean Coal' TechnologyConference - 398-

Wet Chimney
The lower than normal mist loading inherent in the J'BR design, combined with the unique
design of the wet chimney, eliminated the need for flue gas reheat, another cost saving
feature. Fluid dynamic modeling was performed to assist in the wet duct and chimney
design. The resulting FRP wet chimney has a specially designed system of "gutters" which
collect the liquid as it becomes un-entrained or disengaged from the flue gas and returns it to
the/BR. This design effectively eliminates rain-out from the chimney.
Gwsum Stack
The FGD byproduct gypsum solids are disposed of by stacking. Stacking combines the
advantages of ponding and landfills. Ponding has low operating costs and low capital
equipment requirements, while landfills require less space and have less environmental
impact. During the low fly ash parametric test period, handling, stackability, and
trafficability of the gypsum stack were carefully monitored.
TEST OBJECTIVES
The parametric testing portion of the low fly ash test period has recently been completed.
The major objectives of the parametric test program were to:
* Correlate the effects of pH and AP, and evaluate the effects of boiler load on systemperformance;
• Correlate the effect of limestone grind on system performance;• Monitor solids properties and gypsum stack operation;• Evaluate particulate removal efficiency; and• Demonstrate reliable operation of the CT-121 FGD system.
The test schedule was a full factorial matrix of the three primary test parameters (AP, pH,
and load) which affect SOx removal efficiency. A full factorial matrix was designed to
eliminate the need for a complex statistical analysis to evaluate the collected data. In
addition to the full factorial matrix, the test plan also includes selected tests to evaluate
limestone grind.
I III I
- 399 - Second Annual Clean Coal TechnologyConference

SCHEDULE/_TONES
After proj_t selection in 1988 andexecution of the CooperativeAgreementin 1990,
constructionof the Yates CT-121 took approximately26 months. Operationsbegan in
Octoberof 1992 with system shakedown,and parametrictesting was conducted from January
throughMarch of 1993.
In March, long-term testing began (with the ESP fully energized)and will continue through
the endof 1993. In early 1994, high-particulateoperations(ESP deenergized) will begin and
continuethroughearly 1995. The high fly ash test phase will also contain both parametric
and long-term testing periods. Extended monitoringof the groundwaterand the gypsum
stackingarea will carry through 1996.
RESULTS
The parametrictest periodproceeded well, beginning on January 17, 1993 and ending on
March 31, 993. In general the process respondedquickly and smoothly to load and process
parameterchanges, usuallystabilizingwithin one hour of the change. The process'
availability and reliabilitywere both 98 % due to a low equipment failure rate.
502 removal efficiency in the J'BRis a function of JBR Ap, pH, load, and inlet S02. The
parametrictest results indicatethat SO2removal increaseswith increasingpH andYBRdeck
Ap, and that removal decreaseswith increasing load and inlet SOz concentration. Figure 2
illustrates the increase in $Ozremoval with increasing JBR Ap as well as with pH. SO_
removal however, does not increase with pH above a pH of 4.5 at the conditions tested. The
figure shows that performancein excess of' 90% SO_removal is easily achievable for the CT-
121 process without the use of additives. Additionally, limestone utilizationwas consistendy
greaterthan 97% in the selected pH operatingrange (4.0 - 5.0) and exceeds that historically
achieved in spray tower scrubbers. Oxidation, one of the keys to the excellent performance
of this scrubber, was consistently 100%.
AlthoughslurrypH anddeckAp aretheprimaryoperationalparametersforcontrollingSO2
removalefficiency,inletSO2concentrationandboilerload(fluegasflowrate)haveaneffect
II iiiIra.
Second Annual Clean Coal TechnologyConference - 400 -

on scrubber performance. Figure 3 shows that SO_ removal decreases with increasing boiler
toad at constant pH and _,P. Because of decreased dynamic head (i.e., decreased pressure
drop in the duct, plenum, etc.) at lower loads (due to lower gas flows), the IBR slurry level
must increase to maintain a constant JBR Ap at lower loads. Therefore, higher loads, which
require a lower IBR level, result in decreased removal.
The SO2 removal efficiency was seen to decrease with increasing inlet $O2 at pH of 4.5.
This trend is readily apparent in the regression analysis, but can also be seen in Figure 4
which compares tests at similar conditions with the exception of differing inlet SO2
concentrations.
p_.,'ticulate Testing Re_glts
IBR particulate removal (ESP on) was evaluated in lanuary, 1993, concurrent with
parametric testing. The results indicate that the CT-121 process is an excellent particulate
control device with removal efficiencies of 90% measured for those particles not collected by
the existing ESP. Additionally, 99.9% of the particles greater than I0/_ and 90% of those in
the I -I0/z range were collected. Based on this performance, it is anticipated that the high
fly-ash operating period will also demonstrate excellent particulate removal characteristics as
well.
l_esults Regression and Empirical Model
The parametric test series developed data on system performance over the entire range of
expected operating conditions. These data were then used to construct an empirical model
of system performance. Besides being a simple and efficient way of presenting the results of
this test program, such a model is useful for choosing the most efficient operating conditions
for a desired level of performance. It may also be possible to use this model to estimate
emissions in situations where the CEM system has failed.
Linear models were investigated since linear is much simpler than non-linear regression
analysis. The goal of this effort was to have a regression model in which all of the terms
I II II
- 401 - SecondAnnualClean Coal TechnologyConference
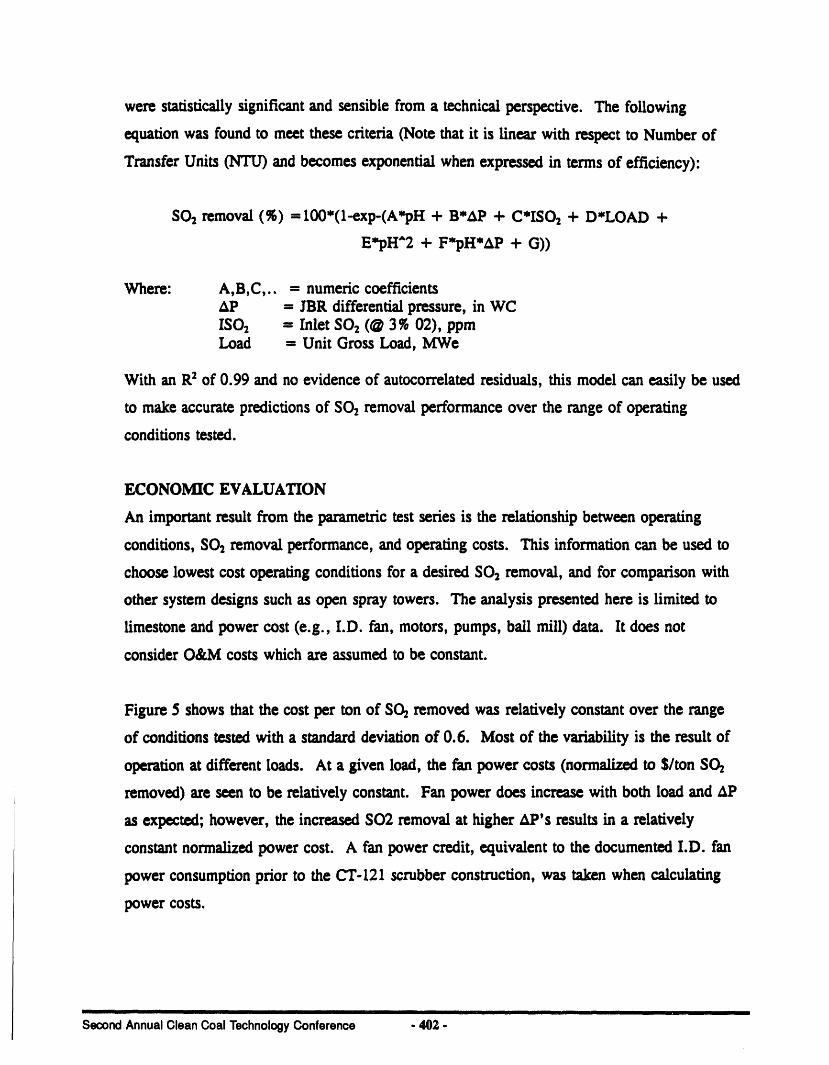
were statisticallysignificantand sensible from a technicalperspective. The following
equationwas foundto meet these criteria(Note that it is linear with respect to Numberof
TransferUnits (NTU) and becomes exponentialwhen expressed in terms of efficiency):
SO2removal (%) =100*(l-exp-(A'pH + B*AP + C*ISO2 + D'LOAD +
E'pH"2 + F'pH*AP + G))
Where: A,B,C,.. ffi numericcoefficientsAp = JBR differentialpressure, in WCISO2 = Inlet SO2 (@ 3% 02), ppmLoad = Unit Gross Load, MWe
With an R_ of 0.99 and no evidence of autocorrelatedresiduals, this model can easily be used
to make accuratepredictionsof SO2removal performance over the range of operating
conditions tested.
ECONOMIC EVALUATION
An importantresult from the parametrictest series is the relationshipbetween operating
conditions, SO2removal performance, and operating costs. This informationcan be used to
choose lowest cost operatingconditionsfor a desired SO2 removal, and for comparisonwith
other system designs such as open spray towers. The analysis presented here is limited to
limestone and power cost (e.g., I.D. fan, motors, pumps, ball mill) data. It does not
consider O&Mcosts which are assumed to be constant.
Figure 5 shows that the cost per ton of SChremovedwas relatively constant over the range
of conditions tested with a standarddeviation of 0.6. Most of the variability is the result of
operation at different loads. At a given load, the fan power costs (normalized m S/ton SO_
removed) are seen to be relatively constant. Fan power does increase with both load and AP
as expected; however, the increased SO2 removal at higher aP's results in a relatively
constant normalized power cost. A fan power credit, equivalent to the documented I.D. fan
power consumption prior to the CT-121 scrubberconstruction, was taken when calculating
power costs.
I I I
SecondAnnualClean Coal TechnologyConference - 402,-

CONCLUSION
The Chiyoda CT-121 scrubber has exhibited excellent performance throughout the
demonstration project, including the parametric test period. It easily exceeds 90% SO2
removal, while maintaining consistently low variable operating costs and power consumption
less than 1.5 % unit Maximum Rated Capacity (MRC). Limestone utilization in excess of
97% is achievable at any pH within the established operating range of 4.0 to 5.0. The
scrubber's ease of operation allows even the most inexperienced operator to quickly become
familiar with system operations. Follow-on testing in a long-term load-following mode
should firmly establish the viability of this unit as both an SO2 reduction process, as well as a
particulate control device. Initial indications are that the process' load following capabilities
are excellent.
ACKNOWLEDGES
The authors wish to thank all those involved in the success of the Chiyoda CT-121 project at
Plant Yates. Spe,':ifically, we are grateful for the tireless efforts and continued support of
Messrs. Rob Moser and/eft Stallings of EPRI, Mr. Hiroshi Yanagioka of Chiyoda-Japan,
Messrs. Mike I_,owles, Ross Kist, Steve Lee, Bill Mashburn, and Flip Kee (retired) of
Georgia Power Company, Messrs. Randall Rush, Pete Honeycutt, Zach Looney, Lamar
Larrimore, Kamyar Vahkshoorzadeh, and Steve Kimble of Southern Company Services, Inc.,
Messrs. Buddy Hargrove, J'ack Burke, and Greg Stevens of Radian Corporation, and
certainly the men and women of Georgia Power Company's Plant Yates who, on a daily
basis, meet and overcome unfamiliar obstacles in support of scrubber operations.
- 403 - SecondAnnualClean Coal TechnologyConference

1O0 .... , ......., . , , , '
IF
..._'''S°''*_" .-'-..- .................. "" " _t
_._ 90• e"
0
ILl 'I_ 8O
C'4./ .,.
(/') v. '_ ,'" _ pH 5.0• "" --_-- pH 4.5
•--_-- pH 4.070 II
oll values for 100 MWeInlet S02 normalized to 2200 ppm
, I , i , I , I ,,, I
6 8 10 12 14 16 8
JaR DECK AP (in. W.C.)
Figure 2. S02 Removal vs JBR Deck AP
1O0 -- • , , , ' I
.................. V
.o.°. ..........
,..°..°'"...°° . •
• . . °o..°-'°" •
'_O_.,,,j 90 I """ .o°..'""" °''°'°'" " __
,¢_ .°"
..°
0 ,.'" ," •
ILl 80 • ,." /rY/,s _'
©(,/3 ---e-- 1O0 MW
v ...v--. 75 MW......v..... 50 MW
70 •
all volues for pH = 4.0Inlet $02 normalized to 2200 ppm
, I , I , I , I , I
6 8 10 12 14 16 8
JBR DECK AP (in.W.C.)
Figure 3. Effect of Load on S02 Removal
II I III I
SecondAnnualCleanCoalTechnologyConference .404 -

100 ,,
I I li' I
9o
_J
0
LtJ 80
Cxl .0 • ,.'"(./3 ,. Inlet S02 concentration
o'
,.'" "-•---- 2170 ppm7o ,. "'-_"" 24.30 ppm
oil values fat pH ,- 4..5 and Load =, 100 MW
, T , I , , l , I , I ,6 8 10 12 14 16 8
JBR DECK &P (in. W.C.)
Figure 4. Effect of Inlet S02 on S02 Removal
4,_ -- ,
i " I ' t " ' I I " ' I • I ' 1 ' I ' i ' i •
_3qJ>0ErY
cN ,_
_ .
c Io
m.,., 35mo _
• 1ooMw [_ 75 uw
Zo T 50 uw t
•__ all valuesfor pH -- 4..5 IS02 - 2200 ppm0 Variable costs consistof limestonecosts ana auxiliary powercosts_> 30 " t , I , I , I , I , , I , I , I , I , , .... [
6 7 8 9 10 11 12 13 14. 15 16 17 18
JBR Deck &P (in WC)
Figure 5. Variable Cost Deviation
III II
- 405 - Second Annual Clean Coal Technology Conference

IIIII II IIIII IIII I I II II II
Second Annual Clean Coal Technology Conference - 406 -

Session 4Industrial Applications
" IIIII IIH
Co-Chairs:James U. Watts,
Pittsburgh Energy Technology Center/U.S. Department of Energy
Douglas Archer,Office of Clean Coal Technology/
U.S. Department of Energy

"901,"eoueJejuoo,_8OlOUqOe.L leOOueei3lenuuvpuooesIIIIII
IIIIIII