Embed Size (px)
Citation preview
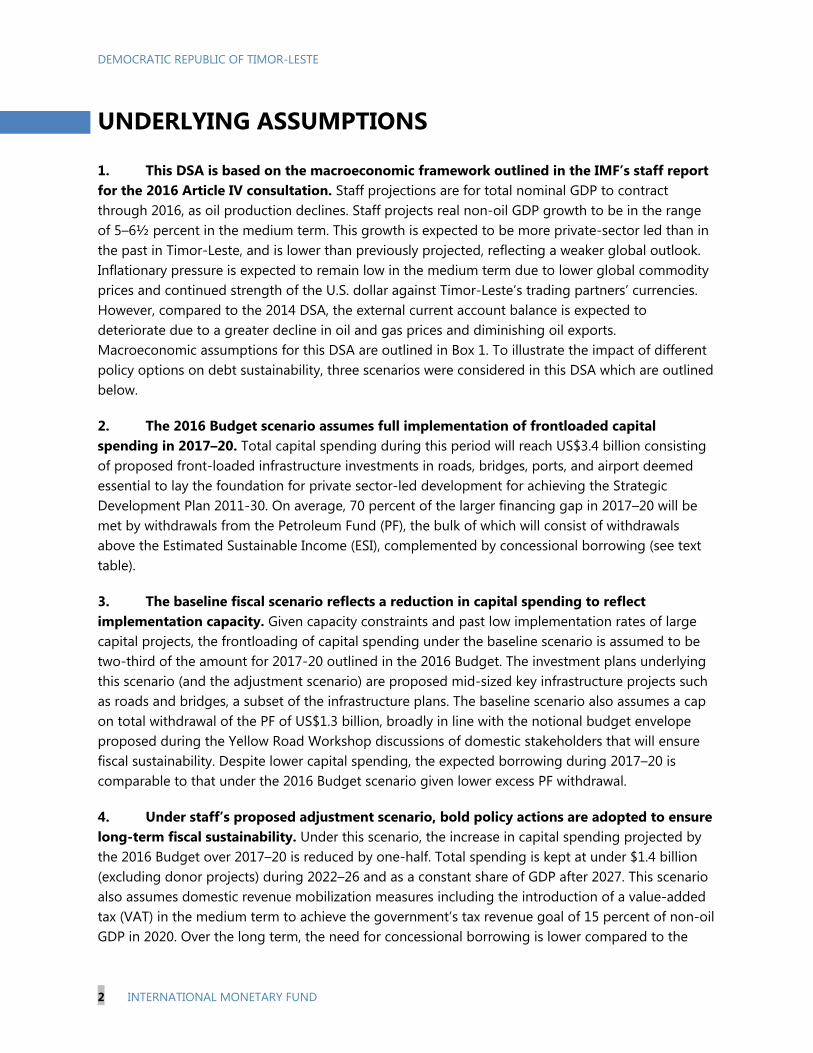
DEMOCRATIC REPUBLIC OF TIMOR-LESTE STAFF REPORT FOR THE 2016 ARTICLE IV CONSULTATION—DEBT SUSTAINABILITY ANALYSIS
The Debt Sustainability Analysis (DSA) indicates that Timor-Leste is at moderate risk of debt distress.2 This represents a downgrade from a low risk of debt distress at the time of the 2014 DSA. The deterioration in the debt rating reflects a shift in the authorities’ financing strategy, namely to increase the use of concessional borrowing to finance frontloaded infrastructure spending in order to reduce financing by the drawdown of the assets of the Petroleum Fund (PF). At end-2015, net public assets (oil-related savings accumulated in the PF and currently negligible debt stock) stood at over $16 billion. The DSA suggests that current fiscal spending plans are unsustainable as the PF will be depleted in the long term given the current rate of withdrawals under existing expenditure plans. Achieving fiscal sustainability requires scaling back large front-loaded public investment plans in line with implementation capacity, rationalizing recurrent spending, and strengthening non-oil revenues. Bold fiscal consolidation measures are needed to safeguard long-term fiscal and debt sustainability. High fiscal spending and inadequate mobilization of domestic revenues are the main sources of risk. Feasibility studies to ensure that public investment is efficient and yields adequate returns would help to ensure fiscal sustainability.
1 This DSA has been prepared by the IMF staff with input from World Bank Group staff, using the debt sustainability framework for low-income countries approved by the Boards of both institutions. 2 The DSA presented in this document is based on the standard low-income countries (LIC) DSA framework. See “Debt Sustainability in Low-Income Countries: Proposal for an Operational Framework and Policy implications” (http://www.imf.org/external/np/pdr/sustain/2004/020304.htm) and “Debt Sustainability in Low-Income Countries: Further Considerations on an Operational Framework, Policy Implications” (http://www.imf.org/external/np/pdr/sustain/2004/091004.htm).
Approved By Hoe Ee Khor and Andrea Richter Hume (IMF) and Satu Kahkonen (IDA)
Prepared by Staff of the International Monetary Fund and the International Development Association1
April 7, 2016
DEMOCRATIC REPUBLIC OF TIMOR-LESTE
2 INTERNATIONAL MONETARY FUND
UNDERLYING ASSUMPTIONS
1. This DSA is based on the macroeconomic framework outlined in the IMF’s staff report for the 2016 Article IV consultation. Staff projections are for total nominal GDP to contract through 2016, as oil production declines. Staff projects real non-oil GDP growth to be in the range of 5–6½ percent in the medium term. This growth is expected to be more private-sector led than in the past in Timor-Leste, and is lower than previously projected, reflecting a weaker global outlook. Inflationary pressure is expected to remain low in the medium term due to lower global commodity prices and continued strength of the U.S. dollar against Timor-Leste’s trading partners’ currencies. However, compared to the 2014 DSA, the external current account balance is expected to deteriorate due to a greater decline in oil and gas prices and diminishing oil exports. Macroeconomic assumptions for this DSA are outlined in Box 1. To illustrate the impact of different policy options on debt sustainability, three scenarios were considered in this DSA which are outlined below.
2. The 2016 Budget scenario assumes full implementation of frontloaded capital spending in 2017–20. Total capital spending during this period will reach US$3.4 billion consisting of proposed front-loaded infrastructure investments in roads, bridges, ports, and airport deemed essential to lay the foundation for private sector-led development for achieving the Strategic Development Plan 2011-30. On average, 70 percent of the larger financing gap in 2017–20 will be met by withdrawals from the Petroleum Fund (PF), the bulk of which will consist of withdrawals above the Estimated Sustainable Income (ESI), complemented by concessional borrowing (see text table).
3. The baseline fiscal scenario reflects a reduction in capital spending to reflect implementation capacity. Given capacity constraints and past low implementation rates of large capital projects, the frontloading of capital spending under the baseline scenario is assumed to be two-third of the amount for 2017-20 outlined in the 2016 Budget. The investment plans underlying this scenario (and the adjustment scenario) are proposed mid-sized key infrastructure projects such as roads and bridges, a subset of the infrastructure plans. The baseline scenario also assumes a cap on total withdrawal of the PF of US$1.3 billion, broadly in line with the notional budget envelope proposed during the Yellow Road Workshop discussions of domestic stakeholders that will ensure fiscal sustainability. Despite lower capital spending, the expected borrowing during 2017–20 is comparable to that under the 2016 Budget scenario given lower excess PF withdrawal.
4. Under staff’s proposed adjustment scenario, bold policy actions are adopted to ensure long-term fiscal sustainability. Under this scenario, the increase in capital spending projected by the 2016 Budget over 2017–20 is reduced by one-half. Total spending is kept at under $1.4 billion (excluding donor projects) during 2022–26 and as a constant share of GDP after 2027. This scenario also assumes domestic revenue mobilization measures including the introduction of a value-added tax (VAT) in the medium term to achieve the government’s tax revenue goal of 15 percent of non-oil GDP in 2020. Over the long term, the need for concessional borrowing is lower compared to the
DEMOCRATIC REPUBLIC OF TIMOR-LESTE
INTERNATIONAL MONETARY FUND 3
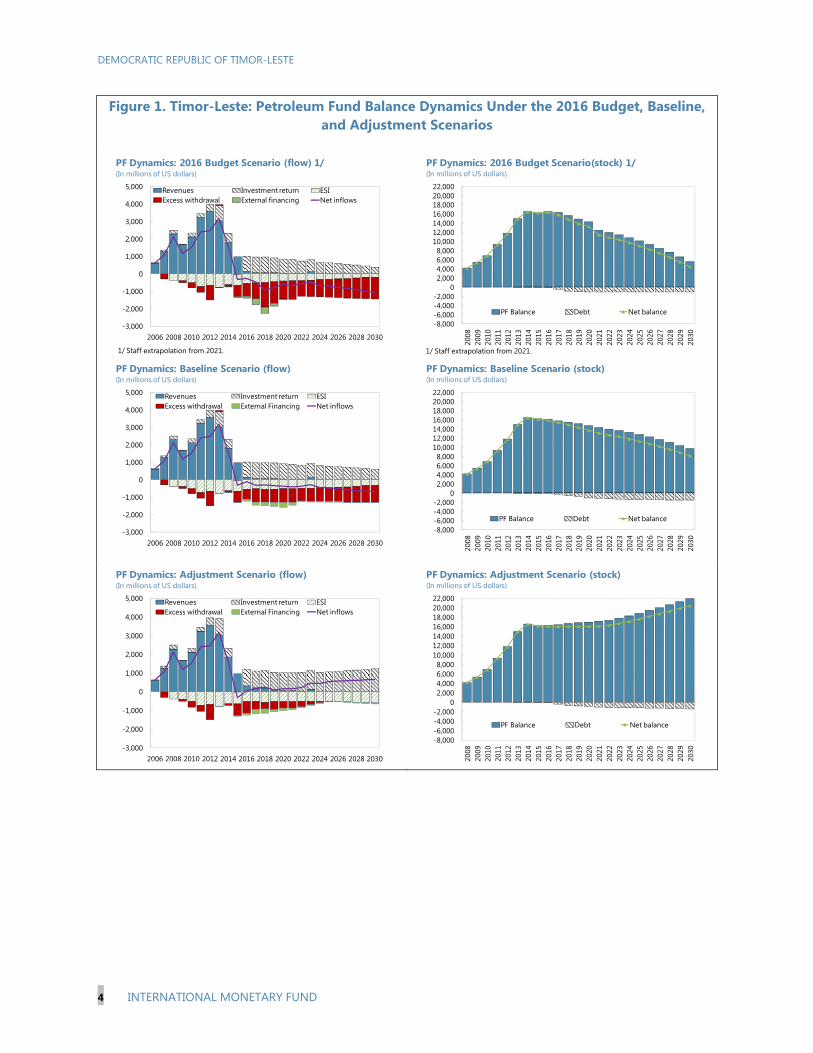
baseline and budget scenarios on account of stronger revenue mobilization. Reliance on excess PF withdrawals is lower, and ceases beyond 2025. Figure 1 and the text table show the profile of the PF balance and fiscal funding gaps under the three scenarios.
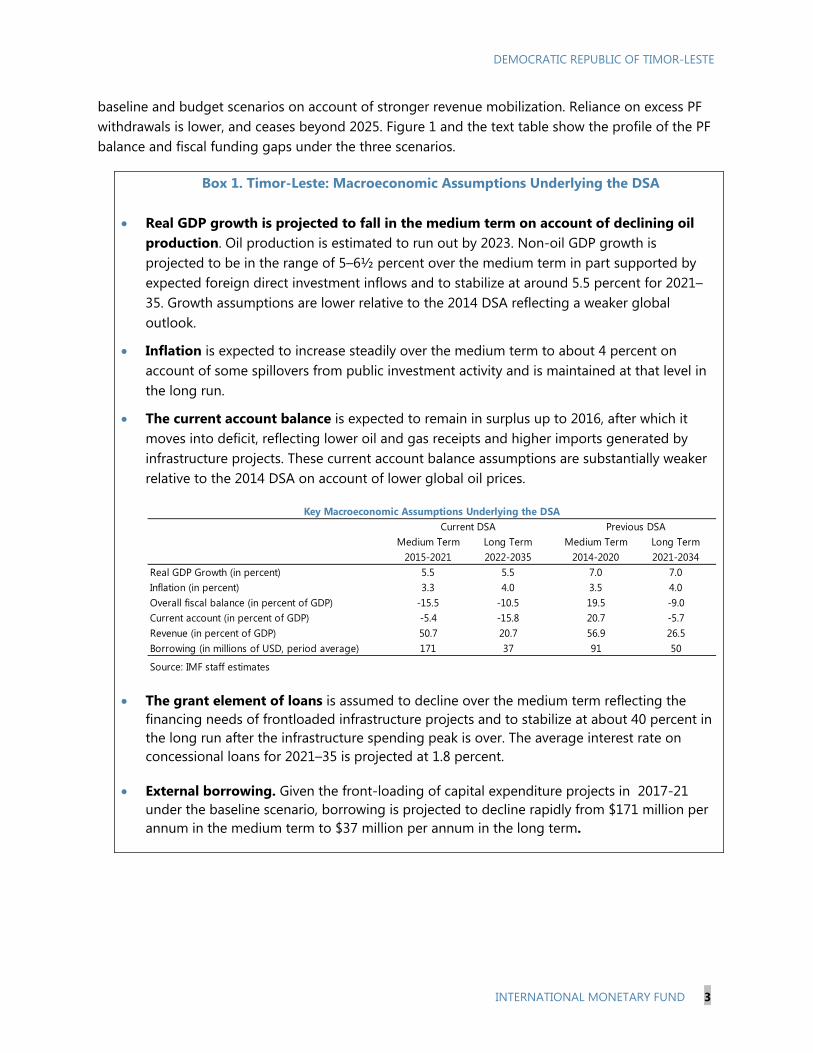
Box 1. Timor-Leste: Macroeconomic Assumptions Underlying the DSA
Real GDP growth is projected to fall in the medium term on account of declining oil production. Oil production is estimated to run out by 2023. Non-oil GDP growth is projected to be in the range of 5–6½ percent over the medium term in part supported by expected foreign direct investment inflows and to stabilize at around 5.5 percent for 2021–35. Growth assumptions are lower relative to the 2014 DSA reflecting a weaker global outlook.
Inflation is expected to increase steadily over the medium term to about 4 percent on account of some spillovers from public investment activity and is maintained at that level in the long run.
The current account balance is expected to remain in surplus up to 2016, after which it moves into deficit, reflecting lower oil and gas receipts and higher imports generated by infrastructure projects. These current account balance assumptions are substantially weaker relative to the 2014 DSA on account of lower global oil prices.
The grant element of loans is assumed to decline over the medium term reflecting the financing needs of frontloaded infrastructure projects and to stabilize at about 40 percent in the long run after the infrastructure spending peak is over. The average interest rate on concessional loans for 2021–35 is projected at 1.8 percent.
External borrowing. Given the front-loading of capital expenditure projects in 2017-21 under the baseline scenario, borrowing is projected to decline rapidly from $171 million per annum in the medium term to $37 million per annum in the long term.
Medium Term Long Term Medium Term Long Term2015-2021 2022-2035 2014-2020 2021-2034
Real GDP Growth (in percent) 5.5 5.5 7.0 7.0Inflation (in percent) 3.3 4.0 3.5 4.0Overall fiscal balance (in percent of GDP) -15.5 -10.5 19.5 -9.0Current account (in percent of GDP) -5.4 -15.8 20.7 -5.7Revenue (in percent of GDP) 50.7 20.7 56.9 26.5Borrowing (in millions of USD, period average) 171 37 91 50
Source: IMF staff estimates
Current DSA Previous DSAKey Macroeconomic Assumptions Underlying the DSA
DEMOCRATIC REPUBLIC OF TIMOR-LESTE
4 INTERNATIONAL MONETARY FUND
Figure 1. Timor-Leste: Petroleum Fund Balance Dynamics Under the 2016 Budget, Baseline, and Adjustment Scenarios
-3,000
-2,000
-1,000
0
1,000
2,000
3,000
4,000
5,000
2006 2008 2010 2012 2014 2016 2018 2020 2022 2024 2026 2028 2030
Revenues Investment return ESIExcess withdrawal External financing Net inflows
PF Dynamics: 2016 Budget Scenario (flow) 1/(In millions of US dollars)
1/ Staff extrapolation from 2021.
-8,000-6,000-4,000-2,000
02,0004,0006,0008,000
10,00012,00014,00016,00018,00020,00022,000
2008
2009
2010
2011
2012
2013
2014
2015
2016
2017
2018
2019
2020
2021
2022
2023
2024
2025
2026
2027
2028
2029
2030
PF Balance Debt Net balance
PF Dynamics: 2016 Budget Scenario(stock) 1/(In millions of US dollars)
1/ Staff extrapolation from 2021.
-3,000
-2,000
-1,000
0
1,000
2,000
3,000
4,000
5,000
2006 2008 2010 2012 2014 2016 2018 2020 2022 2024 2026 2028 2030
Revenues Investment return ESIExcess withdrawal External Financing Net inflows
PF Dynamics: Baseline Scenario (flow)(In millions of US dollars)
Source: IMF staff calculations
-8,000-6,000-4,000-2,000
02,0004,0006,0008,000
10,00012,00014,00016,00018,00020,00022,000
2008
2009
2010
2011
2012
2013
2014
2015
2016
2017
2018
2019
2020
2021
2022
2023
2024
2025
2026
2027
2028
2029
2030
PF Balance Debt Net balance
PF Dynamics: Baseline Scenario (stock)(In millions of US dollars)
-3,000
-2,000
-1,000
0
1,000
2,000
3,000
4,000
5,000
2006 2008 2010 2012 2014 2016 2018 2020 2022 2024 2026 2028 2030
Revenues Investment return ESIExcess withdrawal External Financing Net inflows
PF Dynamics: Adjustment Scenario (flow)(In millions of US dollars)
Source: IMF staff calculations
-8,000-6,000-4,000-2,000
02,0004,0006,0008,000
10,00012,00014,00016,00018,00020,00022,000
2008
2009
2010
2011
2012
2013
2014
2015
2016
2017
2018
2019
2020
2021
2022
2023
2024
2025
2026
2027
2028
2029
2030
PF Balance Debt Net balance
PF Dynamics: Adjustment Scenario (stock)(In millions of US dollars)
DEMOCRATIC REPUBLIC OF TIMOR-LESTE
INTERNATIONAL MONETARY FUND 5
5. The DSA is based on the following:
Timor-Leste has a weak Country Policy and Institutional Assessment (CPIA) performance rating, corresponding to the lowest set of indicative debt thresholds.
The DSA framework uses a 5 percent discount rate.
Concessional debt is defined as debt that exceeds a minimum grant element of 35 percent. Semi-concessional debt has a positive grant element that does not meet the minimum grant element.
The DSA adopts a broad concept of exports which includes exports of goods and services, as well as primary oil-related incomes.
Total public sector revenue is defined as non-oil domestic revenue plus the estimated sustainable income (ESI) from the PF. The funding gap is met by PF withdrawals in excess of the ESI and external borrowing.
All debt is undertaken by the central government. No off-balance sheet debt is accumulated, including by state-owned enterprises such as the national oil company, the Timor GAP.
Debt financing contracted by the central government relating to the funding of infrastructure projects should be on a concessional basis.
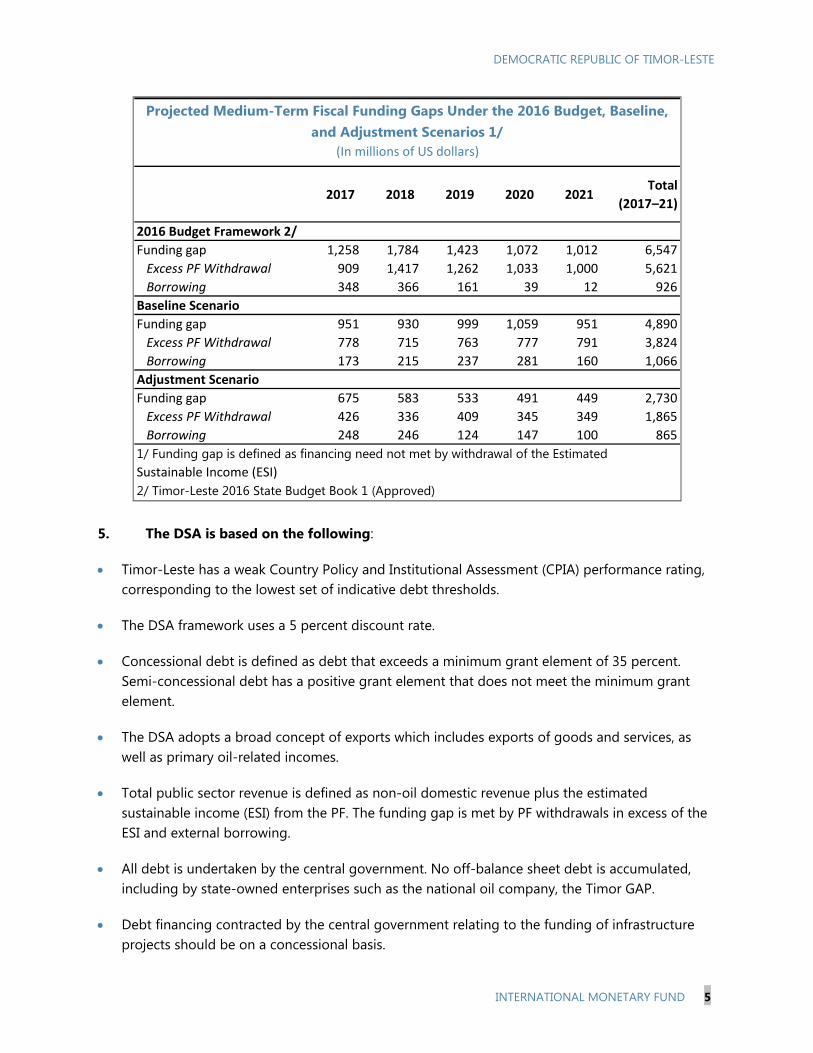
2017 2018 2019 2020 2021Total
(2017–21)
2016 Budget Framework 2/
Funding gap 1,258 1,784 1,423 1,072 1,012 6,547
Excess PF Withdrawal 909 1,417 1,262 1,033 1,000 5,621
Borrowing 348 366 161 39 12 926
Baseline Scenario
Funding gap 951 930 999 1,059 951 4,890
Excess PF Withdrawal 778 715 763 777 791 3,824
Borrowing 173 215 237 281 160 1,066
Adjustment Scenario
Funding gap 675 583 533 491 449 2,730
Excess PF Withdrawal 426 336 409 345 349 1,865
Borrowing 248 246 124 147 100 865
1/ Funding gap is defined as financing need not met by withdrawal of the EstimatedSustainable Income (ESI)
2/ Timor-Leste 2016 State Budget Book 1 (Approved)
Projected Medium-Term Fiscal Funding Gaps Under the 2016 Budget, Baseline, and Adjustment Scenarios 1/
(In millions of US dollars)
DEMOCRATIC REPUBLIC OF TIMOR-LESTE
6 INTERNATIONAL MONETARY FUND
0
5,000
10,000
15,000
20,000
25,000
2008 2010 2012 2014 2016 2018 2020 2022 2024 2026 2028 2030
Baseline
2016 Budget
Adjustment
Net Public Sector Assets(In millions of US dollars)
Since the public sector only borrows externally with no domestic liabilities issued and the Timorese private sector does not incur any medium- or long-term external liabilities, the public DSA and external DSA are combined.
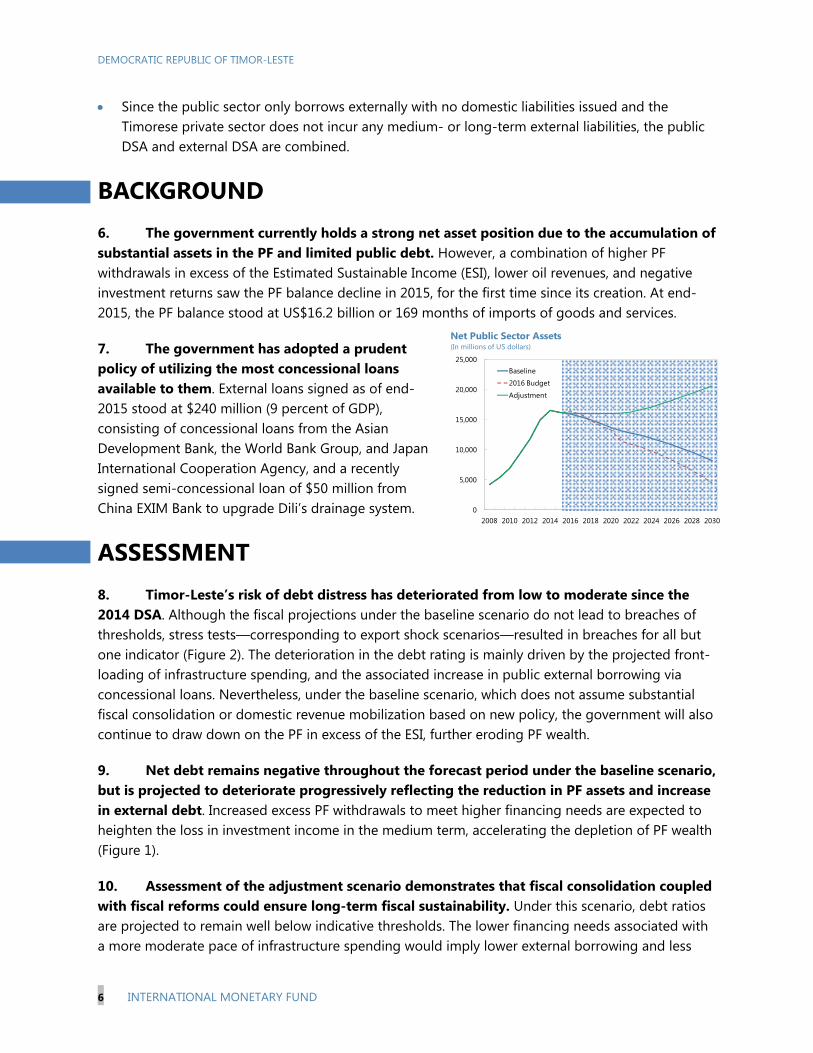
BACKGROUND 6. The government currently holds a strong net asset position due to the accumulation of substantial assets in the PF and limited public debt. However, a combination of higher PF withdrawals in excess of the Estimated Sustainable Income (ESI), lower oil revenues, and negative investment returns saw the PF balance decline in 2015, for the first time since its creation. At end-2015, the PF balance stood at US$16.2 billion or 169 months of imports of goods and services.
7. The government has adopted a prudent policy of utilizing the most concessional loans available to them. External loans signed as of end-2015 stood at $240 million (9 percent of GDP), consisting of concessional loans from the Asian Development Bank, the World Bank Group, and Japan International Cooperation Agency, and a recently signed semi-concessional loan of $50 million from China EXIM Bank to upgrade Dili’s drainage system.
ASSESSMENT 8. Timor-Leste’s risk of debt distress has deteriorated from low to moderate since the 2014 DSA. Although the fiscal projections under the baseline scenario do not lead to breaches of thresholds, stress tests—corresponding to export shock scenarios—resulted in breaches for all but one indicator (Figure 2). The deterioration in the debt rating is mainly driven by the projected front-loading of infrastructure spending, and the associated increase in public external borrowing via concessional loans. Nevertheless, under the baseline scenario, which does not assume substantial fiscal consolidation or domestic revenue mobilization based on new policy, the government will also continue to draw down on the PF in excess of the ESI, further eroding PF wealth.
9. Net debt remains negative throughout the forecast period under the baseline scenario, but is projected to deteriorate progressively reflecting the reduction in PF assets and increase in external debt. Increased excess PF withdrawals to meet higher financing needs are expected to heighten the loss in investment income in the medium term, accelerating the depletion of PF wealth (Figure 1).
10. Assessment of the adjustment scenario demonstrates that fiscal consolidation coupled with fiscal reforms could ensure long-term fiscal sustainability. Under this scenario, debt ratios are projected to remain well below indicative thresholds. The lower financing needs associated with a more moderate pace of infrastructure spending would imply lower external borrowing and less
DEMOCRATIC REPUBLIC OF TIMOR-LESTE
INTERNATIONAL MONETARY FUND 7
reliance on excess PF withdrawals. With fiscal reforms—including the introduction of a value-added tax aimed at boosting domestic revenues to 15 percent of non-oil GDP—excess PF withdrawals could be gradually reduced to zero in the long term. This would allow PF assets to grow, ensuring the PF’s long-term sustainability. In addition, adopting policies to boost growth potential (through infrastructure and human capital investment) and enhance competitiveness (in wages and business conditions), would help to reduce the risks of weaker growth and help enhance fiscal and debt sustainability.
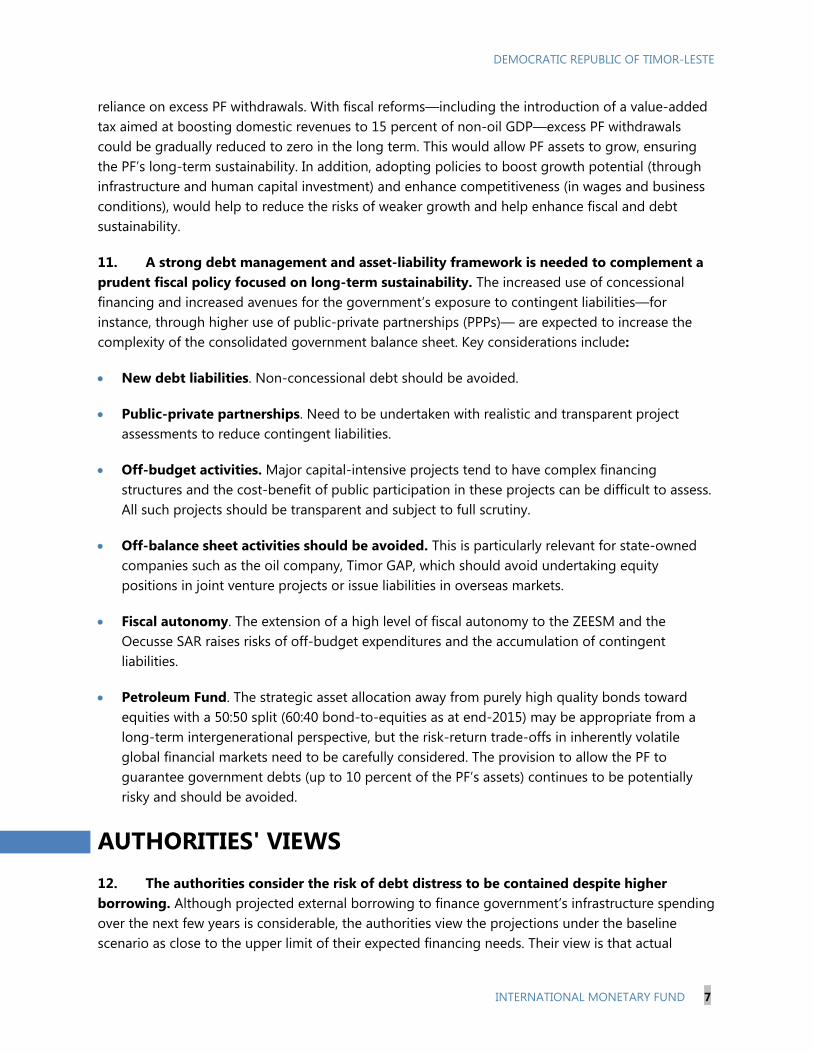
11. A strong debt management and asset-liability framework is needed to complement a prudent fiscal policy focused on long-term sustainability. The increased use of concessional financing and increased avenues for the government’s exposure to contingent liabilities—for instance, through higher use of public-private partnerships (PPPs)— are expected to increase the complexity of the consolidated government balance sheet. Key considerations include:
New debt liabilities. Non-concessional debt should be avoided.
Public-private partnerships. Need to be undertaken with realistic and transparent project assessments to reduce contingent liabilities.
Off-budget activities. Major capital-intensive projects tend to have complex financing structures and the cost-benefit of public participation in these projects can be difficult to assess. All such projects should be transparent and subject to full scrutiny.
Off-balance sheet activities should be avoided. This is particularly relevant for state-owned companies such as the oil company, Timor GAP, which should avoid undertaking equity positions in joint venture projects or issue liabilities in overseas markets.
Fiscal autonomy. The extension of a high level of fiscal autonomy to the ZEESM and the Oecusse SAR raises risks of off-budget expenditures and the accumulation of contingent liabilities.
Petroleum Fund. The strategic asset allocation away from purely high quality bonds toward equities with a 50:50 split (60:40 bond-to-equities as at end-2015) may be appropriate from a long-term intergenerational perspective, but the risk-return trade-offs in inherently volatile global financial markets need to be carefully considered. The provision to allow the PF to guarantee government debts (up to 10 percent of the PF’s assets) continues to be potentially risky and should be avoided.
AUTHORITIES' VIEWS 12. The authorities consider the risk of debt distress to be contained despite higher borrowing. Although projected external borrowing to finance government’s infrastructure spending over the next few years is considerable, the authorities view the projections under the baseline scenario as close to the upper limit of their expected financing needs. Their view is that actual
DEMOCRATIC REPUBLIC OF TIMOR-LESTE
8 INTERNATIONAL MONETARY FUND
borrowing will be determined by the pace of project implementation, which may be slower than projected in the baseline scenario of the DSA. The authorities also pointed out that the accumulated savings in the PF provide an ample buffer against debt distress. Moreover, the authorities highlighted the importance of infrastructure development as part of the Strategic Development Plan to transition Timor-Leste to upper middle income status by 2030. The resulting increase in growth potential is expected to contribute towards ensuring debt sustainability.
13. The authorities remain committed to long-term fiscal sustainability. Fiscal reform plans in the pipeline—which include the introduction of the value-added tax—will boost domestic revenue and help to ensure fiscal and debt sustainability. The authorities have also expressed interest in Fund TA to strengthen their capacity in debt management.
CONCLUSION 14. Timor-Leste’s debt is at moderate risk of debt distress driven by higher external borrowing. The plan to increase the utilization of external concessional financing reflects the government’s frontloaded infrastructure spending and strategy to preserve the wealth of the PF. The PF is a source of confidence for the economy and should be preserved as an endowment fund. The PF assets should be preserved in real terms and generate a permanent level of investment income to support government expenditures. While some drawdown of the assets of the PF is justified for infrastructure investment in order to diversify the economy and boost growth potential, the assets also need to be preserved at a level that is sufficient to provide adequate investment income for future generations. Meeting the financing gap through external loans is warranted, especially if the borrowing cost is lower than the opportunity cost of tapping into the PF as measured by the PF’s expected investment return, and guided by the DSA. The discipline of debt sustainability monitoring by creditors may also come with other benefits such as the transfer of knowledge by these multilateral or bilateral institutions.
15. Bold fiscal consolidation measures are needed to safeguard long-term fiscal and debt sustainability. Achieving fiscal sustainability requires scaling back large front-loaded public investment plans in line with implementation capacity, rationalizing recurrent spending, strengthening non-oil revenues, and adhering to a medium-term fiscal consolidation plan. In addition, better prioritization of public investment plans, focusing on high-return infrastructure projects through rigorous investment appraisal is important. Optimizing the composition and quality of spending to help close Timor-Leste’s infrastructure gap is key to long-term fiscal and debt sustainability
DEMOCRATIC REPUBLIC OF TIMOR-LESTE
INTERNATIONAL MONETARY FUND 9
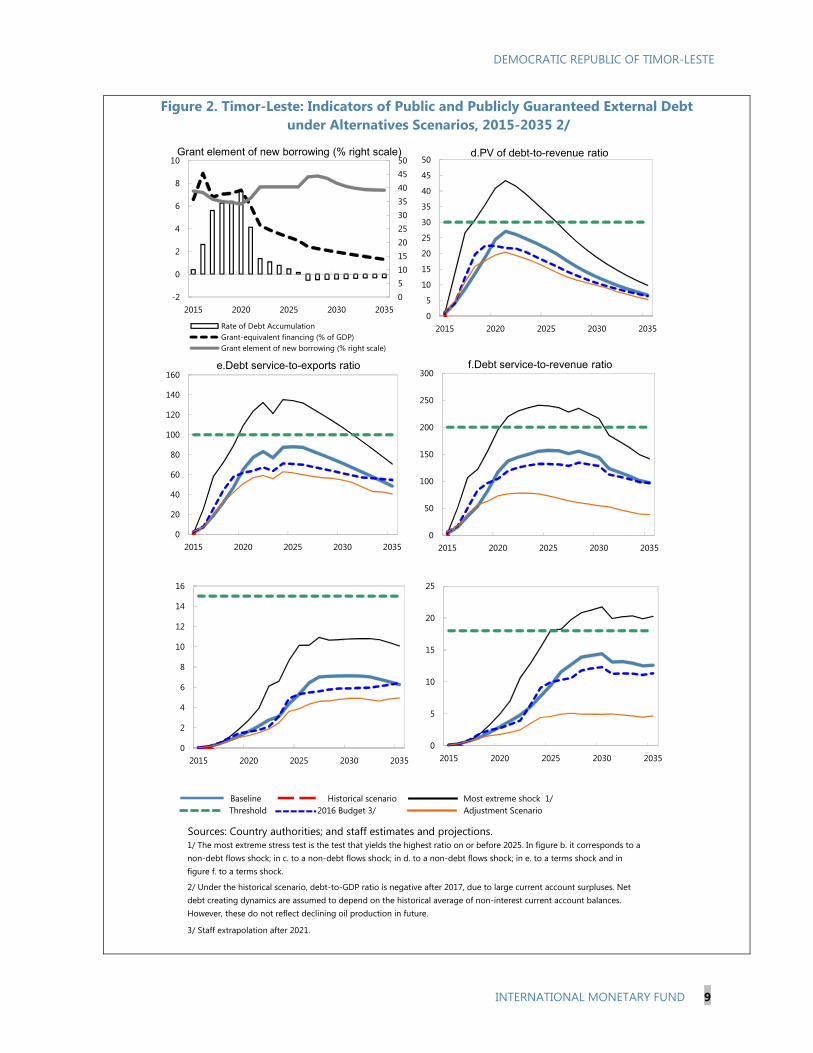
Figure 2. Timor-Leste: Indicators of Public and Publicly Guaranteed External Debt under Alternatives Scenarios, 2015-2035 2/
Sources: Country authorities; and staff estimates and projections.
3/ Staff extrapolation after 2021.
1/ The most extreme stress test is the test that yields the highest ratio on or before 2025. In figure b. it corresponds to a non-debt flows shock; in c. to a non-debt flows shock; in d. to a non-debt flows shock; in e. to a terms shock and in figure f. to a terms shock.
Baseline Historical scenario Most extreme shock 1/ Threshold 2016 Budget 3/
2/ Under the historical scenario, debt-to-GDP ratio is negative after 2017, due to large current account surpluses. Net debt creating dynamics are assumed to depend on the historical average of non-interest current account balances. However, these do not reflect declining oil production in future.
Adjustment Scenario
0
5
10
15
20
25
2015 2020 2025 2030 2035
05101520253035404550
-2
0
2
4
6
8
10
2015 2020 2025 2030 2035
Rate of Debt AccumulationGrant-equivalent financing (% of GDP)Grant element of new borrowing (% right scale)
Grant element of new borrowing (% right scale)
0
20
40
60
80
100
120
140
160
2015 2020 2025 2030 2035
e.Debt service-to-exports ratio
0
5
10
15
20
25
30
35
40
45
50
2015 2020 2025 2030 2035
d.PV of debt-to-revenue ratio
0
50
100
150
200
250
300
2015 2020 2025 2030 2035
f.Debt service-to-revenue ratio
0
2
4
6
8
10
12
14
16
2015 2020 2025 2030 2035
DEMOCRATIC REPUBLIC OF TIMOR-LESTE
10 INTERNATIONAL MONETARY FUND
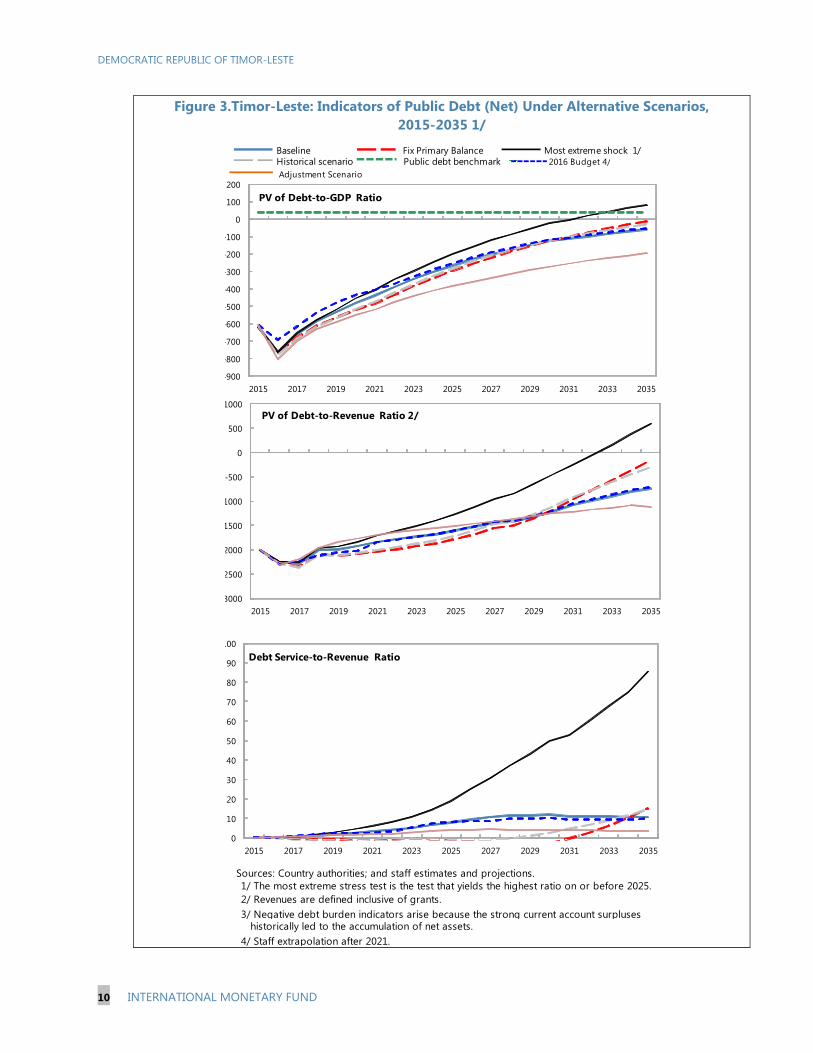
Figure 3.Timor-Leste: Indicators of Public Debt (Net) Under Alternative Scenarios, 2015-2035 1/
Sources: Country authorities; and staff estimates and projections.1/ The most extreme stress test is the test that yields the highest ratio on or before 2025. 2/ Revenues are defined inclusive of grants.3/ Negative debt burden indicators arise because the strong current account surpluses historically led to the accumulation of net assets.4/ Staff extrapolation after 2021.
Adjustment Scenario
BaselinePublic debt benchmark
Most extreme shock 1/Historical scenario
Fix Primary Balance2016 Budget 4/
3000
2500
2000
1500
1000
-500
0
500
1000
2015 2017 2019 2021 2023 2025 2027 2029 2031 2033 2035
PV of Debt-to-Revenue Ratio 2/
-900
-800
-700
-600
-500
-400
-300
-200
-100
0
100
200
2015 2017 2019 2021 2023 2025 2027 2029 2031 2033 2035
PV of Debt-to-GDP Ratio
0
10
20
30
40
50
60
70
80
90
100
2015 2017 2019 2021 2023 2025 2027 2029 2031 2033 2035
Debt Service-to-Revenue Ratio
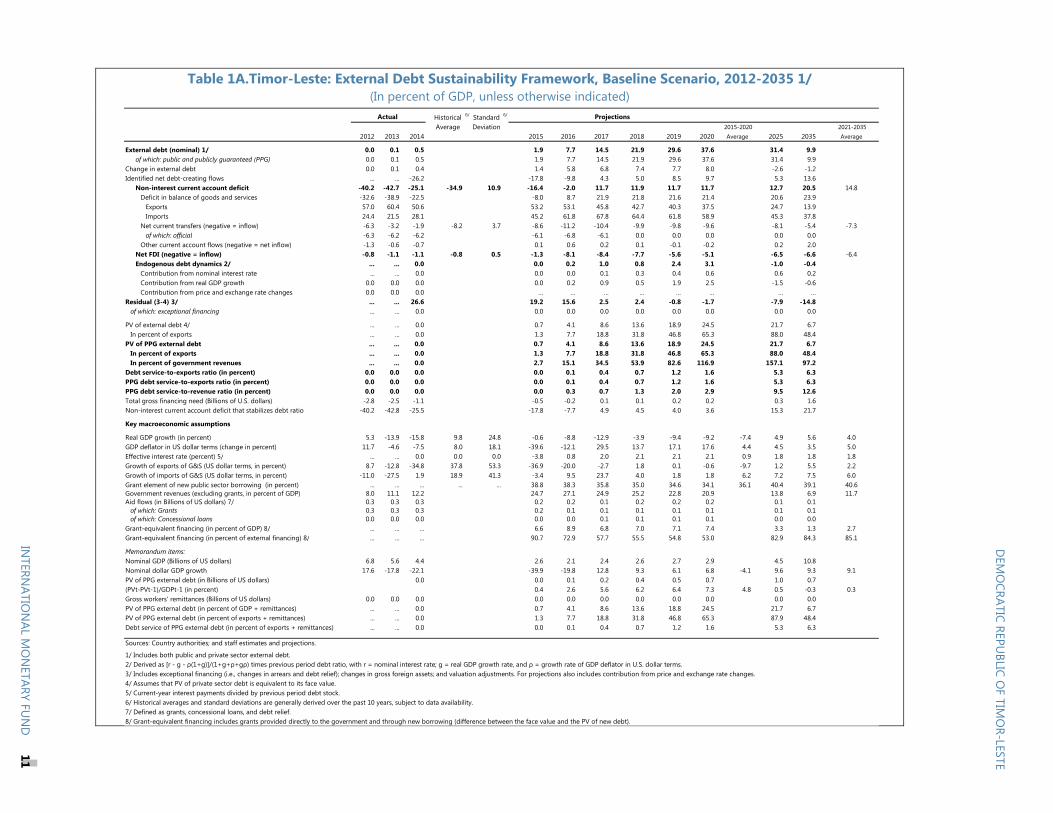
Table 1A.Timor-Leste: External Debt Sustainability Framework, Baseline Scenario, 2012-2035 1/ (In percent of GDP, unless otherwise indicated)
Historical 6/ Standard 6/
Average Deviation 2015-2020 2021-20352012 2013 2014 2015 2016 2017 2018 2019 2020 Average 2025 2035 Average
External debt (nominal) 1/ 0.0 0.1 0.5 1.9 7.7 14.5 21.9 29.6 37.6 31.4 9.9of which: public and publicly guaranteed (PPG) 0.0 0.1 0.5 1.9 7.7 14.5 21.9 29.6 37.6 31.4 9.9
Change in external debt 0.0 0.1 0.4 1.4 5.8 6.8 7.4 7.7 8.0 -2.6 -1.2Identified net debt-creating flows ... ... -26.2 -17.8 -9.8 4.3 5.0 8.5 9.7 5.3 13.6
Non-interest current account deficit -40.2 -42.7 -25.1 -34.9 10.9 -16.4 -2.0 11.7 11.9 11.7 11.7 12.7 20.5 14.8Deficit in balance of goods and services -32.6 -38.9 -22.5 -8.0 8.7 21.9 21.8 21.6 21.4 20.6 23.9
Exports 57.0 60.4 50.6 53.2 53.1 45.8 42.7 40.3 37.5 24.7 13.9Imports 24.4 21.5 28.1 45.2 61.8 67.8 64.4 61.8 58.9 45.3 37.8
Net current transfers (negative = inflow) -6.3 -3.2 -1.9 -8.2 3.7 -8.6 -11.2 -10.4 -9.9 -9.8 -9.6 -8.1 -5.4 -7.3of which: official -6.3 -6.2 -6.2 -6.1 -6.8 -6.1 0.0 0.0 0.0 0.0 0.0
Other current account flows (negative = net inflow) -1.3 -0.6 -0.7 0.1 0.6 0.2 0.1 -0.1 -0.2 0.2 2.0Net FDI (negative = inflow) -0.8 -1.1 -1.1 -0.8 0.5 -1.3 -8.1 -8.4 -7.7 -5.6 -5.1 -6.5 -6.6 -6.4Endogenous debt dynamics 2/ ... ... 0.0 0.0 0.2 1.0 0.8 2.4 3.1 -1.0 -0.4
Contribution from nominal interest rate ... ... 0.0 0.0 0.0 0.1 0.3 0.4 0.6 0.6 0.2Contribution from real GDP growth 0.0 0.0 0.0 0.0 0.2 0.9 0.5 1.9 2.5 -1.5 -0.6Contribution from price and exchange rate changes 0.0 0.0 0.0 … … … … … … … …
Residual (3-4) 3/ ... ... 26.6 19.2 15.6 2.5 2.4 -0.8 -1.7 -7.9 -14.8of which: exceptional financing ... ... 0.0 0.0 0.0 0.0 0.0 0.0 0.0 0.0 0.0
PV of external debt 4/ ... ... 0.0 0.7 4.1 8.6 13.6 18.9 24.5 21.7 6.7In percent of exports ... ... 0.0 1.3 7.7 18.8 31.8 46.8 65.3 88.0 48.4
PV of PPG external debt ... ... 0.0 0.7 4.1 8.6 13.6 18.9 24.5 21.7 6.7In percent of exports ... ... 0.0 1.3 7.7 18.8 31.8 46.8 65.3 88.0 48.4In percent of government revenues ... ... 0.0 2.7 15.1 34.5 53.9 82.6 116.9 157.1 97.2
Debt service-to-exports ratio (in percent) 0.0 0.0 0.0 0.0 0.1 0.4 0.7 1.2 1.6 5.3 6.3PPG debt service-to-exports ratio (in percent) 0.0 0.0 0.0 0.0 0.1 0.4 0.7 1.2 1.6 5.3 6.3PPG debt service-to-revenue ratio (in percent) 0.0 0.0 0.0 0.0 0.3 0.7 1.3 2.0 2.9 9.5 12.6Total gross financing need (Billions of U.S. dollars) -2.8 -2.5 -1.1 -0.5 -0.2 0.1 0.1 0.2 0.2 0.3 1.6Non-interest current account deficit that stabilizes debt ratio -40.2 -42.8 -25.5 -17.8 -7.7 4.9 4.5 4.0 3.6 15.3 21.7
Key macroeconomic assumptions
Real GDP growth (in percent) 5.3 -13.9 -15.8 9.8 24.8 -0.6 -8.8 -12.9 -3.9 -9.4 -9.2 -7.4 4.9 5.6 4.0GDP deflator in US dollar terms (change in percent) 11.7 -4.6 -7.5 8.0 18.1 -39.6 -12.1 29.5 13.7 17.1 17.6 4.4 4.5 3.5 5.0Effective interest rate (percent) 5/ ... ... 0.0 0.0 0.0 -3.8 0.8 2.0 2.1 2.1 2.1 0.9 1.8 1.8 1.8Growth of exports of G&S (US dollar terms, in percent) 8.7 -12.8 -34.8 37.8 53.3 -36.9 -20.0 -2.7 1.8 0.1 -0.6 -9.7 1.2 5.5 2.2Growth of imports of G&S (US dollar terms, in percent) -11.0 -27.5 1.9 18.9 41.3 -3.4 9.5 23.7 4.0 1.8 1.8 6.2 7.2 7.5 6.0Grant element of new public sector borrowing (in percent) ... ... ... ... ... 38.8 38.3 35.8 35.0 34.6 34.1 36.1 40.4 39.1 40.6Government revenues (excluding grants, in percent of GDP) 8.0 11.1 12.2 24.7 27.1 24.9 25.2 22.8 20.9 13.8 6.9 11.7Aid flows (in Billions of US dollars) 7/ 0.3 0.3 0.3 0.2 0.2 0.1 0.2 0.2 0.2 0.1 0.1
of which: Grants 0.3 0.3 0.3 0.2 0.1 0.1 0.1 0.1 0.1 0.1 0.1of which: Concessional loans 0.0 0.0 0.0 0.0 0.0 0.1 0.1 0.1 0.1 0.0 0.0
Grant-equivalent financing (in percent of GDP) 8/ ... ... ... 6.6 8.9 6.8 7.0 7.1 7.4 3.3 1.3 2.7Grant-equivalent financing (in percent of external financing) 8/ ... ... ... 90.7 72.9 57.7 55.5 54.8 53.0 82.9 84.3 85.1
Memorandum items:Nominal GDP (Billions of US dollars) 6.8 5.6 4.4 2.6 2.1 2.4 2.6 2.7 2.9 4.5 10.8Nominal dollar GDP growth 17.6 -17.8 -22.1 -39.9 -19.8 12.8 9.3 6.1 6.8 -4.1 9.6 9.3 9.1PV of PPG external debt (in Billions of US dollars) 0.0 0.0 0.1 0.2 0.4 0.5 0.7 1.0 0.7(PVt-PVt-1)/GDPt-1 (in percent) 0.4 2.6 5.6 6.2 6.4 7.3 4.8 0.5 -0.3 0.3Gross workers' remittances (Billions of US dollars) 0.0 0.0 0.0 0.0 0.0 0.0 0.0 0.0 0.0 0.0 0.0PV of PPG external debt (in percent of GDP + remittances) ... ... 0.0 0.7 4.1 8.6 13.6 18.8 24.5 21.7 6.7PV of PPG external debt (in percent of exports + remittances) ... ... 0.0 1.3 7.7 18.8 31.8 46.8 65.3 87.9 48.4Debt service of PPG external debt (in percent of exports + remittances) ... ... 0.0 0.0 0.1 0.4 0.7 1.2 1.6 5.3 6.3
Sources: Country authorities; and staff estimates and projections.
1/ Includes both public and private sector external debt.2/ Derived as [r - g - ρ(1+g)]/(1+g+ρ+gρ) times previous period debt ratio, with r = nominal interest rate; g = real GDP growth rate, and ρ = growth rate of GDP deflator in U.S. dollar terms. 3/ Includes exceptional financing (i.e., changes in arrears and debt relief); changes in gross foreign assets; and valuation adjustments. For projections also includes contribution from price and exchange rate changes.4/ Assumes that PV of private sector debt is equivalent to its face value.5/ Current-year interest payments divided by previous period debt stock. 6/ Historical averages and standard deviations are generally derived over the past 10 years, subject to data availability. 7/ Defined as grants, concessional loans, and debt relief.8/ Grant-equivalent financing includes grants provided directly to the government and through new borrowing (difference between the face value and the PV of new debt).
Actual Projections
DEM
OCRATIC
REPUBLIC
OF
TIMO
R-LESTE
INTERN
ATION
AL MO
NETARY FU
ND
11
DEMOCRATIC REPUBLIC OF TIMOR-LESTE
12 INTERNATIONAL MONETARY FUND
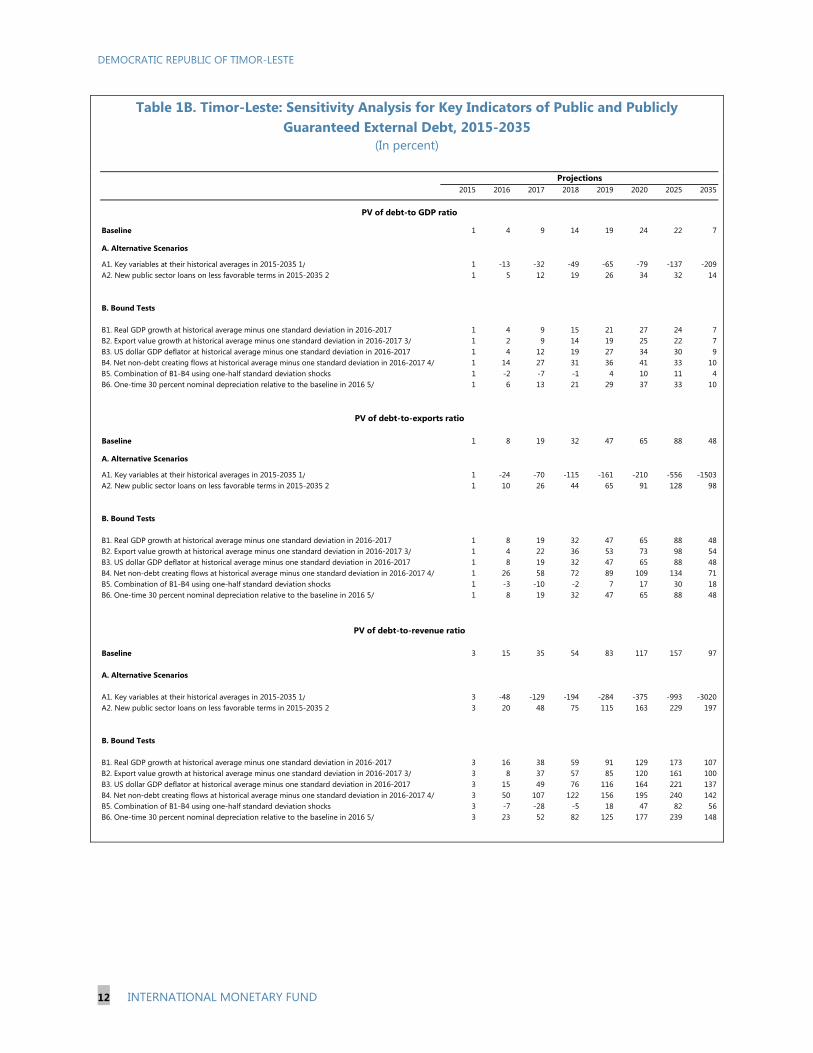
Table 1B. Timor-Leste: Sensitivity Analysis for Key Indicators of Public and Publicly Guaranteed External Debt, 2015-2035
(In percent)
2015 2016 2017 2018 2019 2020 2025 2035
Baseline 1 4 9 14 19 24 22 7
A. Alternative Scenarios
A1. Key variables at their historical averages in 2015-2035 1/ 1 -13 -32 -49 -65 -79 -137 -209A2. New public sector loans on less favorable terms in 2015-2035 2 1 5 12 19 26 34 32 14
B. Bound Tests
B1. Real GDP growth at historical average minus one standard deviation in 2016-2017 1 4 9 15 21 27 24 7B2. Export value growth at historical average minus one standard deviation in 2016-2017 3/ 1 2 9 14 19 25 22 7B3. US dollar GDP deflator at historical average minus one standard deviation in 2016-2017 1 4 12 19 27 34 30 9B4. Net non-debt creating flows at historical average minus one standard deviation in 2016-2017 4/ 1 14 27 31 36 41 33 10B5. Combination of B1-B4 using one-half standard deviation shocks 1 -2 -7 -1 4 10 11 4B6. One-time 30 percent nominal depreciation relative to the baseline in 2016 5/ 1 6 13 21 29 37 33 10
Baseline 1 8 19 32 47 65 88 48
A. Alternative Scenarios
A1. Key variables at their historical averages in 2015-2035 1/ 1 -24 -70 -115 -161 -210 -556 -1503A2. New public sector loans on less favorable terms in 2015-2035 2 1 10 26 44 65 91 128 98
B. Bound Tests
B1. Real GDP growth at historical average minus one standard deviation in 2016-2017 1 8 19 32 47 65 88 48B2. Export value growth at historical average minus one standard deviation in 2016-2017 3/ 1 4 22 36 53 73 98 54B3. US dollar GDP deflator at historical average minus one standard deviation in 2016-2017 1 8 19 32 47 65 88 48B4. Net non-debt creating flows at historical average minus one standard deviation in 2016-2017 4/ 1 26 58 72 89 109 134 71B5. Combination of B1-B4 using one-half standard deviation shocks 1 -3 -10 -2 7 17 30 18B6. One-time 30 percent nominal depreciation relative to the baseline in 2016 5/ 1 8 19 32 47 65 88 48
Baseline 3 15 35 54 83 117 157 97
A. Alternative Scenarios
A1. Key variables at their historical averages in 2015-2035 1/ 3 -48 -129 -194 -284 -375 -993 -3020A2. New public sector loans on less favorable terms in 2015-2035 2 3 20 48 75 115 163 229 197
B. Bound Tests
B1. Real GDP growth at historical average minus one standard deviation in 2016-2017 3 16 38 59 91 129 173 107B2. Export value growth at historical average minus one standard deviation in 2016-2017 3/ 3 8 37 57 85 120 161 100B3. US dollar GDP deflator at historical average minus one standard deviation in 2016-2017 3 15 49 76 116 164 221 137B4. Net non-debt creating flows at historical average minus one standard deviation in 2016-2017 4/ 3 50 107 122 156 195 240 142B5. Combination of B1-B4 using one-half standard deviation shocks 3 -7 -28 -5 18 47 82 56B6. One-time 30 percent nominal depreciation relative to the baseline in 2016 5/ 3 23 52 82 125 177 239 148
PV of debt-to-exports ratio
PV of debt-to-revenue ratio
PV of debt-to GDP ratio
Projections
DEMOCRATIC REPUBLIC OF TIMOR-LESTE
INTERNATIONAL MONETARY FUND 13
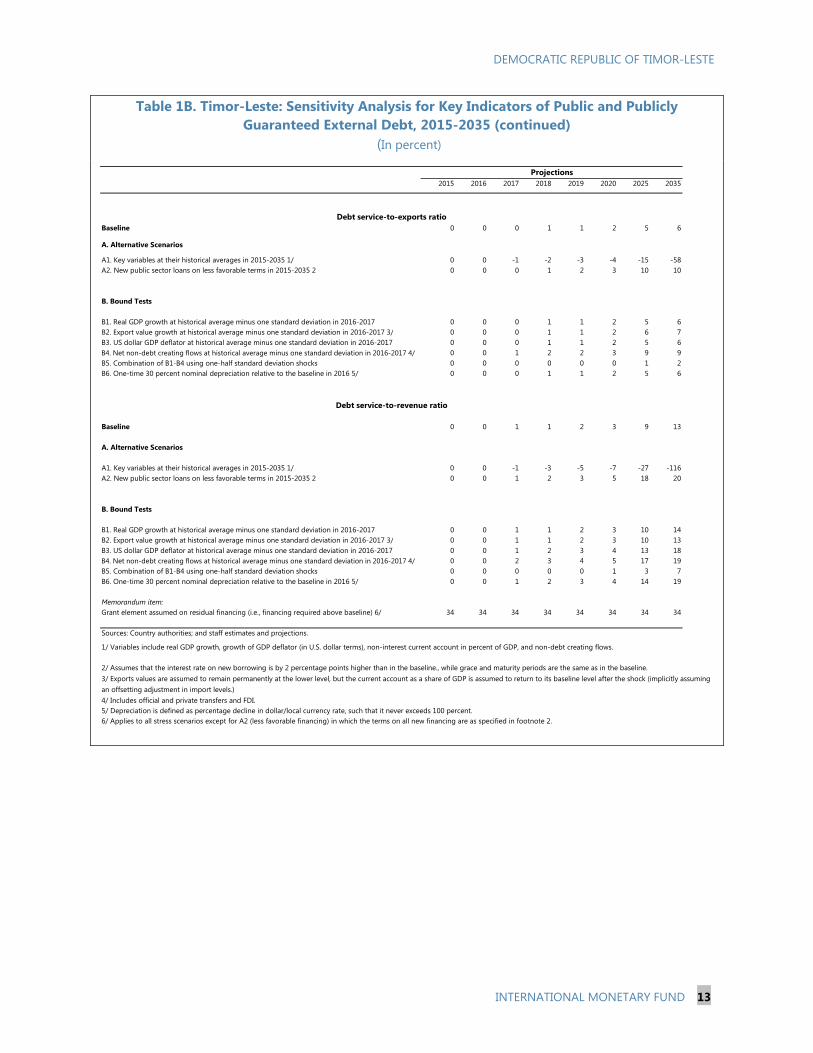
Table 1B. Timor-Leste: Sensitivity Analysis for Key Indicators of Public and Publicly Guaranteed External Debt, 2015-2035 (continued)
(In percent)
2015 2016 2017 2018 2019 2020 2025 2035
Baseline 0 0 0 1 1 2 5 6
A. Alternative Scenarios
A1. Key variables at their historical averages in 2015-2035 1/ 0 0 -1 -2 -3 -4 -15 -58A2. New public sector loans on less favorable terms in 2015-2035 2 0 0 0 1 2 3 10 10
B. Bound Tests
B1. Real GDP growth at historical average minus one standard deviation in 2016-2017 0 0 0 1 1 2 5 6B2. Export value growth at historical average minus one standard deviation in 2016-2017 3/ 0 0 0 1 1 2 6 7B3. US dollar GDP deflator at historical average minus one standard deviation in 2016-2017 0 0 0 1 1 2 5 6B4. Net non-debt creating flows at historical average minus one standard deviation in 2016-2017 4/ 0 0 1 2 2 3 9 9B5. Combination of B1-B4 using one-half standard deviation shocks 0 0 0 0 0 0 1 2B6. One-time 30 percent nominal depreciation relative to the baseline in 2016 5/ 0 0 0 1 1 2 5 6
Baseline 0 0 1 1 2 3 9 13
A. Alternative Scenarios
A1. Key variables at their historical averages in 2015-2035 1/ 0 0 -1 -3 -5 -7 -27 -116A2. New public sector loans on less favorable terms in 2015-2035 2 0 0 1 2 3 5 18 20
B. Bound Tests
B1. Real GDP growth at historical average minus one standard deviation in 2016-2017 0 0 1 1 2 3 10 14B2. Export value growth at historical average minus one standard deviation in 2016-2017 3/ 0 0 1 1 2 3 10 13B3. US dollar GDP deflator at historical average minus one standard deviation in 2016-2017 0 0 1 2 3 4 13 18B4. Net non-debt creating flows at historical average minus one standard deviation in 2016-2017 4/ 0 0 2 3 4 5 17 19B5. Combination of B1-B4 using one-half standard deviation shocks 0 0 0 0 0 1 3 7B6. One-time 30 percent nominal depreciation relative to the baseline in 2016 5/ 0 0 1 2 3 4 14 19
Memorandum item:Grant element assumed on residual financing (i.e., financing required above baseline) 6/ 34 34 34 34 34 34 34 34
Sources: Country authorities; and staff estimates and projections.
1/ Variables include real GDP growth, growth of GDP deflator (in U.S. dollar terms), non-interest current account in percent of GDP, and non-debt creating flows.
4/ Includes official and private transfers and FDI.5/ Depreciation is defined as percentage decline in dollar/local currency rate, such that it never exceeds 100 percent.6/ Applies to all stress scenarios except for A2 (less favorable financing) in which the terms on all new financing are as specified in footnote 2.
3/ Exports values are assumed to remain permanently at the lower level, but the current account as a share of GDP is assumed to return to its baseline level after the shock (implicitly assuming an offsetting adjustment in import levels.)
2/ Assumes that the interest rate on new borrowing is by 2 percentage points higher than in the baseline., while grace and maturity periods are the same as in the baseline.
Projections
Debt service-to-revenue ratio
Debt service-to-exports ratio
DEMOCRATIC REPUBLIC OF TIMOR-LESTE
14 INTERNATIONAL MONETARY FUND
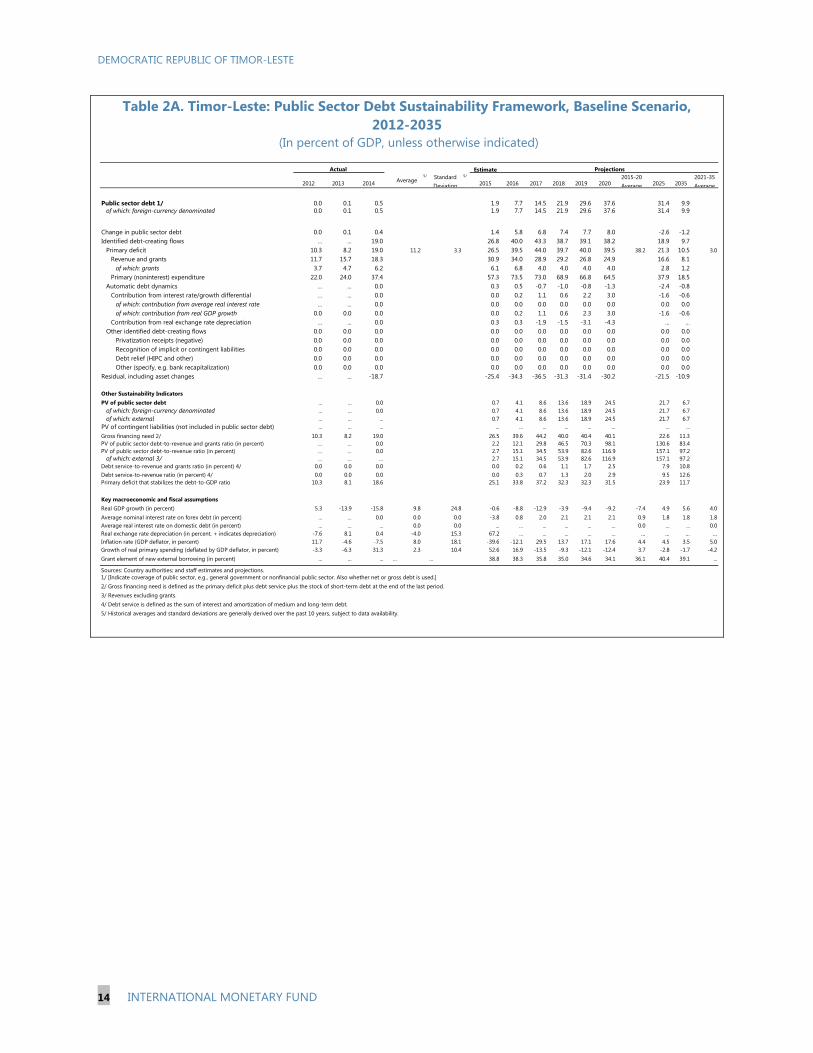
Table 2A. Timor-Leste: Public Sector Debt Sustainability Framework, Baseline Scenario, 2012-2035
(In percent of GDP, unless otherwise indicated)
Estimate
2012 2013 2014 Average5/ Standard
Deviation
5/
2015 2016 2017 2018 2019 20202015-20 Average 2025 2035
2021-35 Average
Public sector debt 1/ 0.0 0.1 0.5 1.9 7.7 14.5 21.9 29.6 37.6 31.4 9.9of which: foreign-currency denominated 0.0 0.1 0.5 1.9 7.7 14.5 21.9 29.6 37.6 31.4 9.9
Change in public sector debt 0.0 0.1 0.4 1.4 5.8 6.8 7.4 7.7 8.0 -2.6 -1.2Identified debt-creating flows ... ... 19.0 26.8 40.0 43.3 38.7 39.1 38.2 18.9 9.7
Primary deficit 10.3 8.2 19.0 11.2 3.3 26.5 39.5 44.0 39.7 40.0 39.5 38.2 21.3 10.5 3.0Revenue and grants 11.7 15.7 18.3 30.9 34.0 28.9 29.2 26.8 24.9 16.6 8.1
of which: grants 3.7 4.7 6.2 6.1 6.8 4.0 4.0 4.0 4.0 2.8 1.2Primary (noninterest) expenditure 22.0 24.0 37.4 57.3 73.5 73.0 68.9 66.8 64.5 37.9 18.5
Automatic debt dynamics ... ... 0.0 0.3 0.5 -0.7 -1.0 -0.8 -1.3 -2.4 -0.8Contribution from interest rate/growth differential ... ... 0.0 0.0 0.2 1.1 0.6 2.2 3.0 -1.6 -0.6
of which: contribution from average real interest rate ... ... 0.0 0.0 0.0 0.0 0.0 0.0 0.0 0.0 0.0of which: contribution from real GDP growth 0.0 0.0 0.0 0.0 0.2 1.1 0.6 2.3 3.0 -1.6 -0.6
Contribution from real exchange rate depreciation ... ... 0.0 0.3 0.3 -1.9 -1.5 -3.1 -4.3 ... ...Other identified debt-creating flows 0.0 0.0 0.0 0.0 0.0 0.0 0.0 0.0 0.0 0.0 0.0
Privatization receipts (negative) 0.0 0.0 0.0 0.0 0.0 0.0 0.0 0.0 0.0 0.0 0.0Recognition of implicit or contingent liabilities 0.0 0.0 0.0 0.0 0.0 0.0 0.0 0.0 0.0 0.0 0.0Debt relief (HIPC and other) 0.0 0.0 0.0 0.0 0.0 0.0 0.0 0.0 0.0 0.0 0.0Other (specify, e.g. bank recapitalization) 0.0 0.0 0.0 0.0 0.0 0.0 0.0 0.0 0.0 0.0 0.0
Residual, including asset changes ... ... -18.7 -25.4 -34.3 -36.5 -31.3 -31.4 -30.2 -21.5 -10.9
Other Sustainability IndicatorsPV of public sector debt ... ... 0.0 0.7 4.1 8.6 13.6 18.9 24.5 21.7 6.7
of which: foreign-currency denominated ... ... 0.0 0.7 4.1 8.6 13.6 18.9 24.5 21.7 6.7of which: external ... ... ... 0.7 4.1 8.6 13.6 18.9 24.5 21.7 6.7
PV of contingent liabilities (not included in public sector debt) ... ... ... ... ... ... ... ... ... ... ...Gross financing need 2/ 10.3 8.2 19.0 26.5 39.6 44.2 40.0 40.4 40.1 22.6 11.3PV of public sector debt-to-revenue and grants ratio (in percent) … … 0.0 2.2 12.1 29.8 46.5 70.3 98.1 130.6 83.4PV of public sector debt-to-revenue ratio (in percent) … … 0.0 2.7 15.1 34.5 53.9 82.6 116.9 157.1 97.2
of which: external 3/ … … … 2.7 15.1 34.5 53.9 82.6 116.9 157.1 97.2Debt service-to-revenue and grants ratio (in percent) 4/ 0.0 0.0 0.0 0.0 0.2 0.6 1.1 1.7 2.5 7.9 10.8Debt service-to-revenue ratio (in percent) 4/ 0.0 0.0 0.0 0.0 0.3 0.7 1.3 2.0 2.9 9.5 12.6Primary deficit that stabilizes the debt-to-GDP ratio 10.3 8.1 18.6 25.1 33.8 37.2 32.3 32.3 31.5 23.9 11.7
Key macroeconomic and fiscal assumptionsReal GDP growth (in percent) 5.3 -13.9 -15.8 9.8 24.8 -0.6 -8.8 -12.9 -3.9 -9.4 -9.2 -7.4 4.9 5.6 4.0Average nominal interest rate on forex debt (in percent) ... ... 0.0 0.0 0.0 -3.8 0.8 2.0 2.1 2.1 2.1 0.9 1.8 1.8 1.8Average real interest rate on domestic debt (in percent) ... ... ... 0.0 0.0 ... ... ... ... ... ... 0.0 ... ... 0.0Real exchange rate depreciation (in percent, + indicates depreciation) -7.6 8.1 0.4 -4.0 15.3 67.2 ... ... ... ... ... ... ... ... ...Inflation rate (GDP deflator, in percent) 11.7 -4.6 -7.5 8.0 18.1 -39.6 -12.1 29.5 13.7 17.1 17.6 4.4 4.5 3.5 5.0Growth of real primary spending (deflated by GDP deflator, in percent) -3.3 -6.3 31.3 2.3 10.4 52.6 16.9 -13.5 -9.3 -12.1 -12.4 3.7 -2.8 -1.7 -4.2Grant element of new external borrowing (in percent) ... ... ... … … 38.8 38.3 35.8 35.0 34.6 34.1 36.1 40.4 39.1 ...
Sources: Country authorities; and staff estimates and projections.1/ [Indicate coverage of public sector, e.g., general government or nonfinancial public sector. Also whether net or gross debt is used.]2/ Gross financing need is defined as the primary deficit plus debt service plus the stock of short-term debt at the end of the last period. 3/ Revenues excluding grants.4/ Debt service is defined as the sum of interest and amortization of medium and long-term debt.5/ Historical averages and standard deviations are generally derived over the past 10 years, subject to data availability.
Actual Projections
DEMOCRATIC REPUBLIC OF TIMOR-LESTE
INTERNATIONAL MONETARY FUND 15
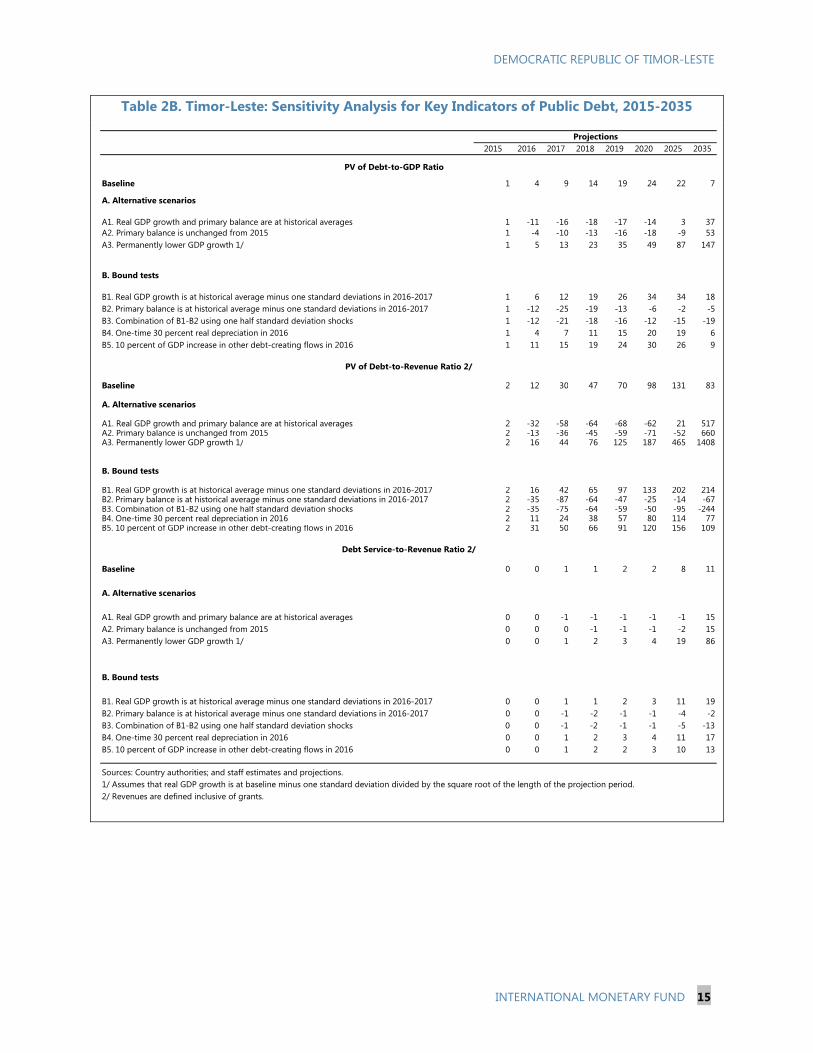
Table 2B. Timor-Leste: Sensitivity Analysis for Key Indicators of Public Debt, 2015-2035
2015 2016 2017 2018 2019 2020 2025 2035
Baseline 1 4 9 14 19 24 22 7
A. Alternative scenarios
A1. Real GDP growth and primary balance are at historical averages 1 -11 -16 -18 -17 -14 3 37A2. Primary balance is unchanged from 2015 1 -4 -10 -13 -16 -18 -9 53A3. Permanently lower GDP growth 1/ 1 5 13 23 35 49 87 147
B. Bound tests
B1. Real GDP growth is at historical average minus one standard deviations in 2016-2017 1 6 12 19 26 34 34 18B2. Primary balance is at historical average minus one standard deviations in 2016-2017 1 -12 -25 -19 -13 -6 -2 -5B3. Combination of B1-B2 using one half standard deviation shocks 1 -12 -21 -18 -16 -12 -15 -19B4. One-time 30 percent real depreciation in 2016 1 4 7 11 15 20 19 6B5. 10 percent of GDP increase in other debt-creating flows in 2016 1 11 15 19 24 30 26 9
Baseline 2 12 30 47 70 98 131 83
A. Alternative scenarios
A1. Real GDP growth and primary balance are at historical averages 2 -32 -58 -64 -68 -62 21 517A2. Primary balance is unchanged from 2015 2 -13 -36 -45 -59 -71 -52 660A3. Permanently lower GDP growth 1/ 2 16 44 76 125 187 465 1408
B. Bound tests
B1. Real GDP growth is at historical average minus one standard deviations in 2016-2017 2 16 42 65 97 133 202 214B2. Primary balance is at historical average minus one standard deviations in 2016-2017 2 -35 -87 -64 -47 -25 -14 -67B3. Combination of B1-B2 using one half standard deviation shocks 2 -35 -75 -64 -59 -50 -95 -244B4. One-time 30 percent real depreciation in 2016 2 11 24 38 57 80 114 77B5. 10 percent of GDP increase in other debt-creating flows in 2016 2 31 50 66 91 120 156 109
Baseline 0 0 1 1 2 2 8 11
A. Alternative scenarios
A1. Real GDP growth and primary balance are at historical averages 0 0 -1 -1 -1 -1 -1 15A2. Primary balance is unchanged from 2015 0 0 0 -1 -1 -1 -2 15A3. Permanently lower GDP growth 1/ 0 0 1 2 3 4 19 86
B. Bound tests
B1. Real GDP growth is at historical average minus one standard deviations in 2016-2017 0 0 1 1 2 3 11 19B2. Primary balance is at historical average minus one standard deviations in 2016-2017 0 0 -1 -2 -1 -1 -4 -2B3. Combination of B1-B2 using one half standard deviation shocks 0 0 -1 -2 -1 -1 -5 -13B4. One-time 30 percent real depreciation in 2016 0 0 1 2 3 4 11 17B5. 10 percent of GDP increase in other debt-creating flows in 2016 0 0 1 2 2 3 10 13
Sources: Country authorities; and staff estimates and projections.1/ Assumes that real GDP growth is at baseline minus one standard deviation divided by the square root of the length of the projection period.2/ Revenues are defined inclusive of grants.
PV of Debt-to-GDP Ratio
Projections
PV of Debt-to-Revenue Ratio 2/
Debt Service-to-Revenue Ratio 2/