Embed Size (px)
Citation preview
Current and future climate of Timor-Leste
Timor Sea
Savu Sea
DILI
Pante Macassar
Suai
Baucau
INDONESIA
> Timor-Leste National Directorate of Meteorology and Geophysics
> Australian Bureau of Meteorology
> Commonwealth Scientific and Industrial Research Organisation (CSIRO)
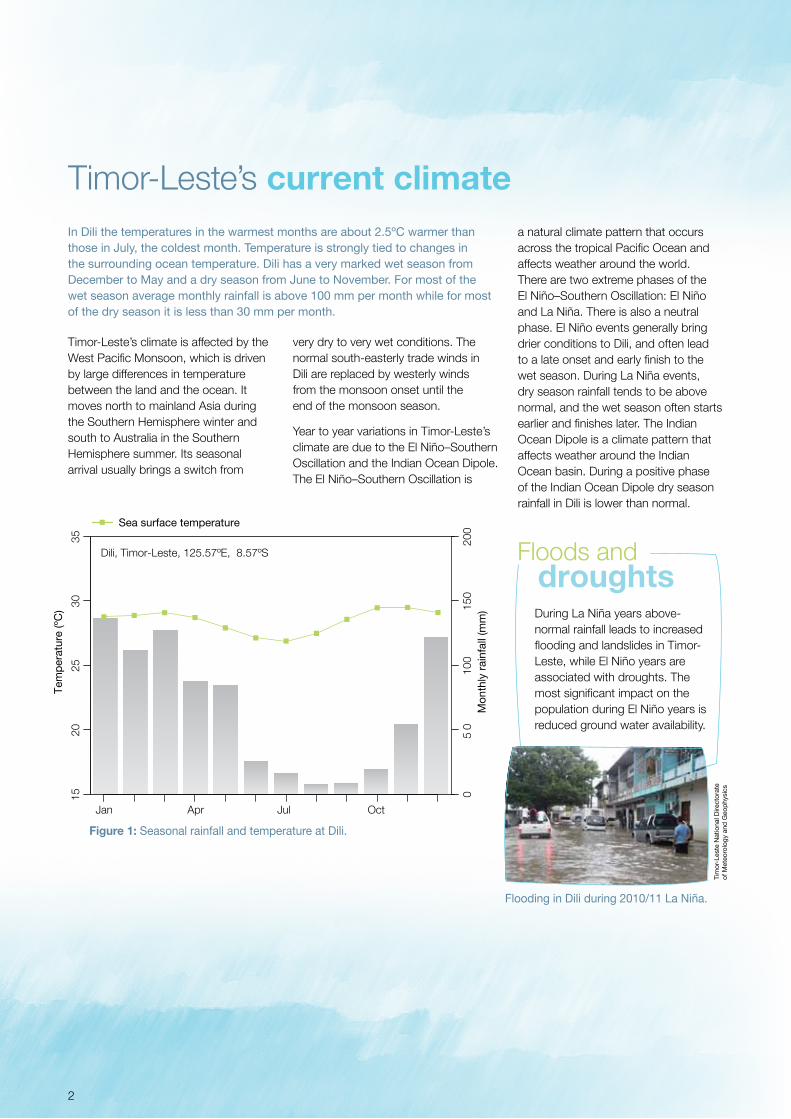
Timor-Leste’s current climateIn Dili the temperatures in the warmest months are about 2.5ºC warmer than those in July, the coldest month. Temperature is strongly tied to changes in the surrounding ocean temperature. Dili has a very marked wet season from December to May and a dry season from June to November. For most of the wet season average monthly rainfall is above 100 mm per month while for most of the dry season it is less than 30 mm per month.
2
Timor-Leste’s climate is affected by the West Pacific Monsoon, which is driven by large differences in temperature between the land and the ocean. It moves north to mainland Asia during the Southern Hemisphere winter and south to Australia in the Southern Hemisphere summer. Its seasonal arrival usually brings a switch from
very dry to very wet conditions. The normal south-easterly trade winds in Dili are replaced by westerly winds from the monsoon onset until the end of the monsoon season.
Year to year variations in Timor-Leste’s climate are due to the El Niño–Southern Oscillation and the Indian Ocean Dipole. The El Niño–Southern Oscillation is
a natural climate pattern that occurs across the tropical Pacific Ocean and affects weather around the world. There are two extreme phases of the El Niño–Southern Oscillation: El Niño and La Niña. There is also a neutral phase. El Niño events generally bring drier conditions to Dili, and often lead to a late onset and early finish to the wet season. During La Niña events, dry season rainfall tends to be above normal, and the wet season often starts earlier and finishes later. The Indian Ocean Dipole is a climate pattern that affects weather around the Indian Ocean basin. During a positive phase of the Indian Ocean Dipole dry season rainfall in Dili is lower than normal.
Figure 1: Seasonal rainfall and temperature at Dili.
During La Niña years above-normal rainfall leads to increased flooding and landslides in Timor-Leste, while El Niño years are associated with droughts. The most significant impact on the population during El Niño years is reduced ground water availability.
droughtsFloods and
Flooding in Dili during 2010/11 La Niña.
Sea surface temperature
Tem
per
atur
e (º
C)
Jan Apr Jul Oct
Mon
thly
rai
nfal
l (m
m)
05
010
015
020
0
1520
2530
35
Dili, Timor-Leste, 125.57ºE, 8.57ºS
Tim
or-L
este
Nat
iona
l Dire
ctor
ate
of M
eteo
rolo
gy a
nd G
eop
hysi
cs
H
H
T r a d e W i n d s
0 500 1,000 1,500 2,000Kilometres
Palau Federated States of Micronesia Marshall Islands
KiribatiNauru
Papua New GuineaSolomon Islands
Vanuatu
Tuvalu
FijiSamoa
Tonga
Niue
Cook Islands
East Timor
30o S
20o S
10o S
0o
10o N
2
0o N
110o E
120o E
130o E
140o E
150o E
160o E
170o E
180o
170o W
160o W
150o W
140o W
I n t e r t r o p i c a l C o n v e r g e n c e Z o n e
S o u t h P a c i f i c C o n v e r g e n c e Z o n e
M o n s o o n
W a r m p o o l
3
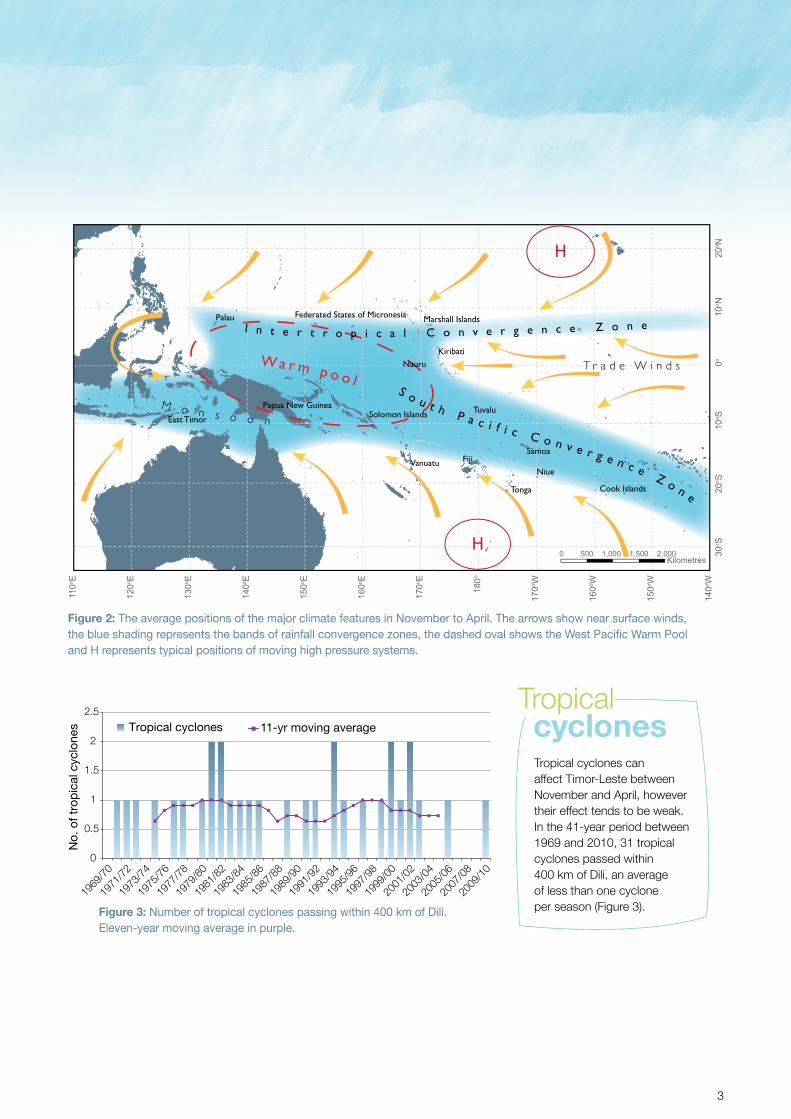
Figure 2: The average positions of the major climate features in November to April. The arrows show near surface winds, the blue shading represents the bands of rainfall convergence zones, the dashed oval shows the West Pacific Warm Pool and H represents typical positions of moving high pressure systems.
Tropical cyclones can affect Timor-Leste between November and April, however their effect tends to be weak. In the 41-year period between 1969 and 2010, 31 tropical cyclones passed within 400 km of Dili, an average of less than one cyclone per season (Figure 3).
cyclonesTropical
Figure 3: Number of tropical cyclones passing within 400 km of Dili. Eleven-year moving average in purple.
No.
of t
rop
ical
cyc
lone
s Tropical cyclones 11-yr moving average
0
0.5
1
1.5
2
2.5
1969
/70
1971
/72
1973
/74
1975
/76
1977
/78
1979
/80
1981
/82
1983
/84
1985
/86
1987
/88
1989
/90
1991
/92
1993
/94
1995
/96
1997
/98
1999
/00
2001
/02
2003
/04
2005
/06
2007
/08
2009
/10
4
Temperatures and rainfall are changingAir temperature data for Dili are only available from 2003 which makes it impossible to establish temperature trends. However, sea surface temperature in the Timor-Leste region has increased by 0.15–0.2°C per decade over the period 1950–2009. It is likely that air temperature has increased by a similar amount over the same period.
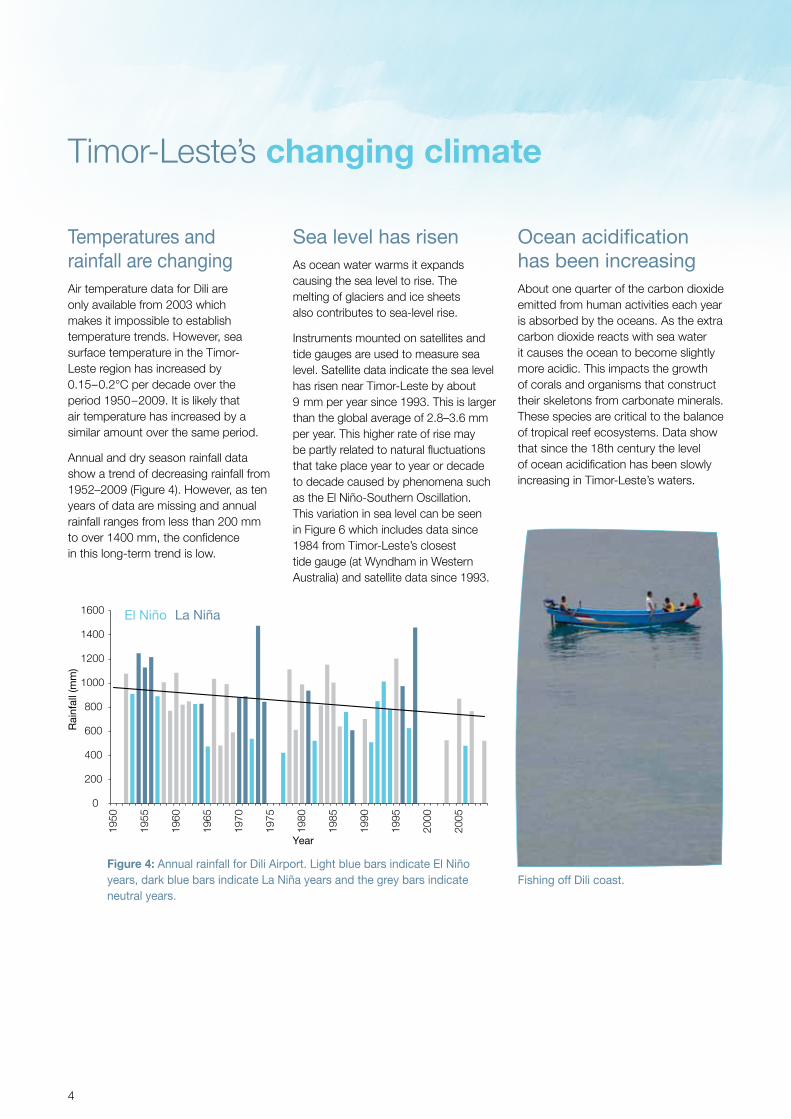
Annual and dry season rainfall data show a trend of decreasing rainfall from 1952–2009 (Figure 4). However, as ten years of data are missing and annual rainfall ranges from less than 200 mm to over 1400 mm, the confidence in this long-term trend is low.
Figure 4: Annual rainfall for Dili Airport. Light blue bars indicate El Niño years, dark blue bars indicate La Niña years and the grey bars indicate neutral years.
Fishing off Dili coast.
Timor-Leste’s changing climate
Sea level has risenAs ocean water warms it expands causing the sea level to rise. The melting of glaciers and ice sheets also contributes to sea-level rise.
Instruments mounted on satellites and tide gauges are used to measure sea level. Satellite data indicate the sea level has risen near Timor-Leste by about 9 mm per year since 1993. This is larger than the global average of 2.8–3.6 mm per year. This higher rate of rise may be partly related to natural fluctuations that take place year to year or decade to decade caused by phenomena such as the El Niño-Southern Oscillation. This variation in sea level can be seen in Figure 6 which includes data since 1984 from Timor-Leste’s closest tide gauge (at Wyndham in Western Australia) and satellite data since 1993.
Ocean acidification has been increasingAbout one quarter of the carbon dioxide emitted from human activities each year is absorbed by the oceans. As the extra carbon dioxide reacts with sea water it causes the ocean to become slightly more acidic. This impacts the growth of corals and organisms that construct their skeletons from carbonate minerals. These species are critical to the balance of tropical reef ecosystems. Data show that since the 18th century the level of ocean acidification has been slowly increasing in Timor-Leste’s waters.
El Niño La Niña
0
200
400
600
800
1000
1200
1400
1600
1950
1955
1960
1965
1970
1975
1980
1985
1990
1995
2000
2005
Rai
nfal
l (m
m)
Year
5
Coastline, Dili district. Flooding, Dili 2011.
Timor-Leste’s future climateClimate impacts almost all aspects of life in Timor-Leste. Understanding the possible future climate of Timor-Leste is important so people and the government can plan for changes.
Global climate models are the best tools for understanding future climate change. Climate models are mathematical representations of the climate system that require very powerful computers. They are based on the laws of physics and include information about the atmosphere, ocean, land and ice.
There are many different global climate models and they all represent the climate slightly differently. Scientists from the Pacific Climate Change Science Program (PCCSP) have evaluated 24 models from around the world and found that 18 best represent the climate of the western tropical Pacific region. These 18 models have been used to develop climate projections for Timor-Leste.
The future climate will be determined by a combination of natural and human factors. As we do not know what the future holds, we need to consider a range of possible future conditions, or scenarios, in climate models. The
Intergovernmental Panel on Climate Change (IPCC) developed a series of plausible scenarios based on a set of assumptions about future population changes, economic development and technological advances. For example, the A1B (or medium) emissions scenario envisages global population peaking mid-century and declining thereafter, very rapid economic growth, and rapid introduction of new and more efficient technologies. Greenhouse gas and aerosol emissions scenarios are used in climate modelling to provide projections that represent a range of possible futures.
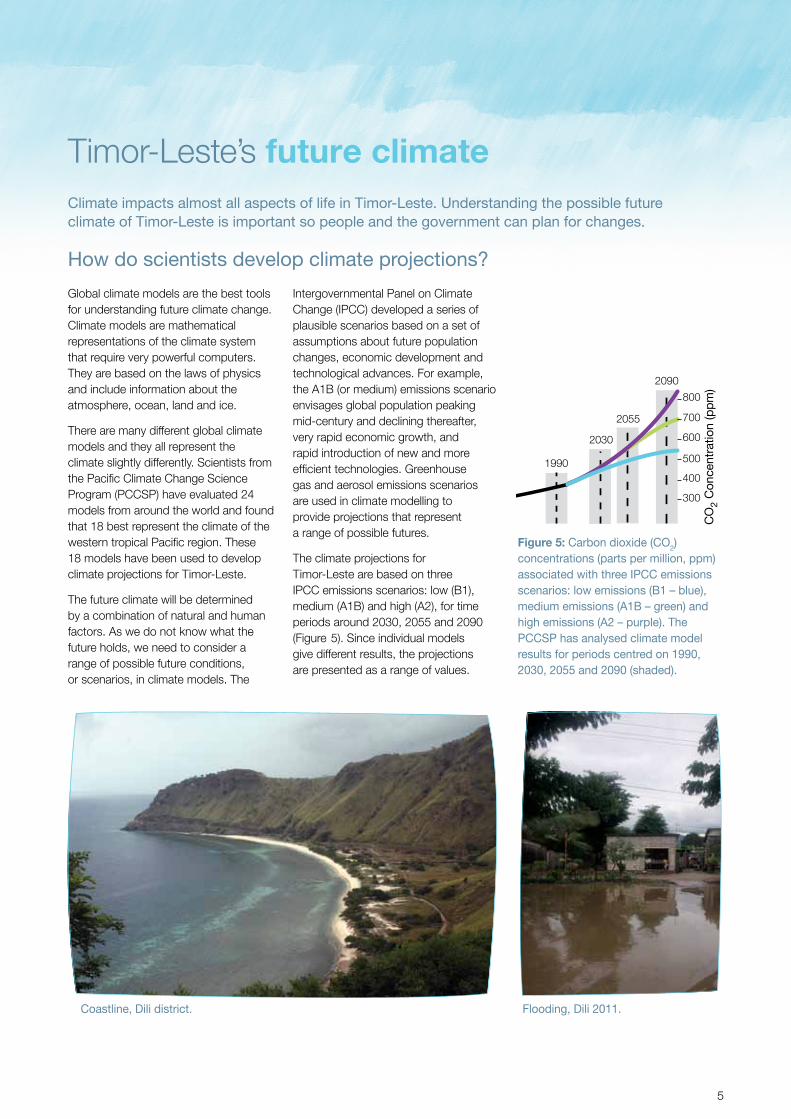
The climate projections for Timor-Leste are based on three IPCC emissions scenarios: low (B1), medium (A1B) and high (A2), for time periods around 2030, 2055 and 2090 (Figure 5). Since individual models give different results, the projections are presented as a range of values.
2030
1990
2055
2090
300
400
500
600
700
800
CO
2 C
once
ntra
tion
(pp
m)
Figure 5: Carbon dioxide (CO2) concentrations (parts per million, ppm) associated with three IPCC emissions scenarios: low emissions (B1 – blue), medium emissions (A1B – green) and high emissions (A2 – purple). The PCCSP has analysed climate model results for periods centred on 1990, 2030, 2055 and 2090 (shaded).
How do scientists develop climate projections?
6
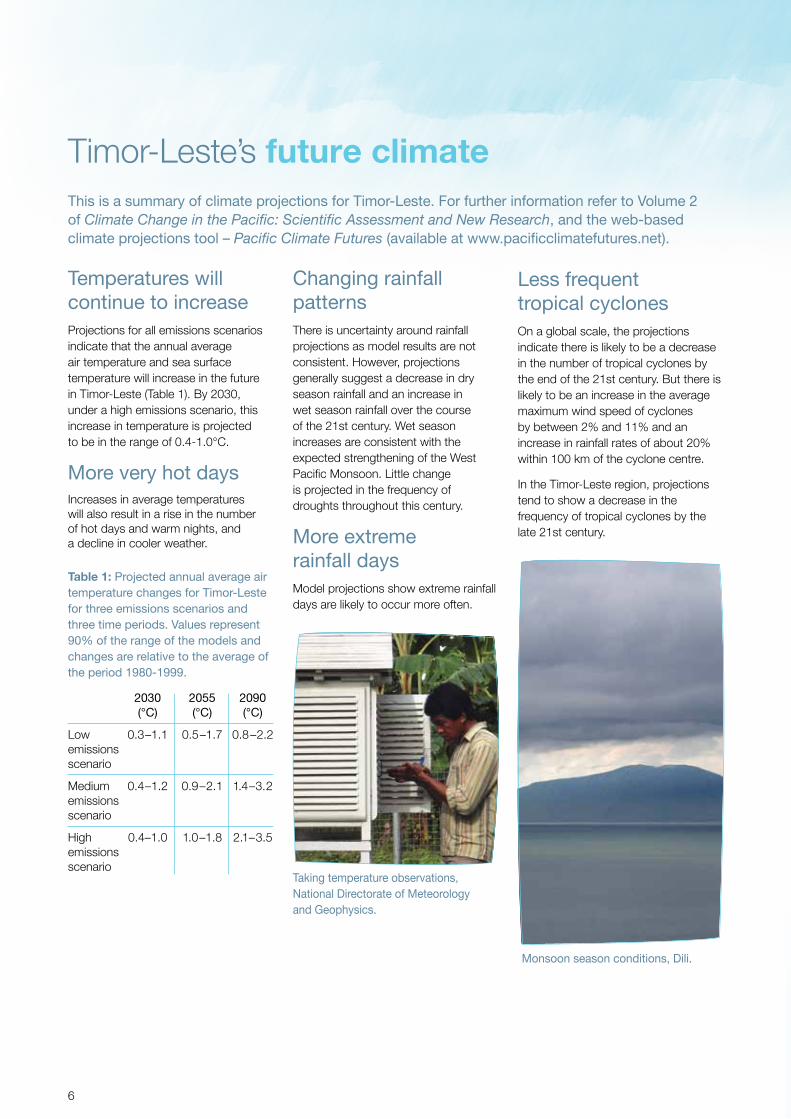
Less frequent tropical cyclones On a global scale, the projections indicate there is likely to be a decrease in the number of tropical cyclones by the end of the 21st century. But there is likely to be an increase in the average maximum wind speed of cyclones by between 2% and 11% and an increase in rainfall rates of about 20% within 100 km of the cyclone centre.
In the Timor-Leste region, projections tend to show a decrease in the frequency of tropical cyclones by the late 21st century.
Temperatures will continue to increase Projections for all emissions scenarios indicate that the annual average air temperature and sea surface temperature will increase in the future in Timor-Leste (Table 1). By 2030, under a high emissions scenario, this increase in temperature is projected to be in the range of 0.4-1.0°C.
More very hot daysIncreases in average temperatures will also result in a rise in the number of hot days and warm nights, and a decline in cooler weather.
Changing rainfall patterns There is uncertainty around rainfall projections as model results are not consistent. However, projections generally suggest a decrease in dry season rainfall and an increase in wet season rainfall over the course of the 21st century. Wet season increases are consistent with the expected strengthening of the West Pacific Monsoon. Little change is projected in the frequency of droughts throughout this century.
More extreme rainfall daysModel projections show extreme rainfall days are likely to occur more often.
Timor-Leste’s future climate
Table 1: Projected annual average air temperature changes for Timor-Leste for three emissions scenarios and three time periods. Values represent 90% of the range of the models and changes are relative to the average of the period 1980-1999.
2030 2055 2090 (°C) (°C) (°C)
Low 0.3–1.1 0.5–1.7 0.8–2.2 emissions scenario
Medium 0.4–1.2 0.9–2.1 1.4–3.2 emissions scenario
High 0.4–1.0 1.0–1.8 2.1–3.5 emissions scenario
This is a summary of climate projections for Timor-Leste. For further information refer to Volume 2 of Climate Change in the Pacific: Scientific Assessment and New Research, and the web-based climate projections tool – Pacific Climate Futures (available at www.pacificclimatefutures.net).
Taking temperature observations, National Directorate of Meteorology and Geophysics.
Monsoon season conditions, Dili.
7
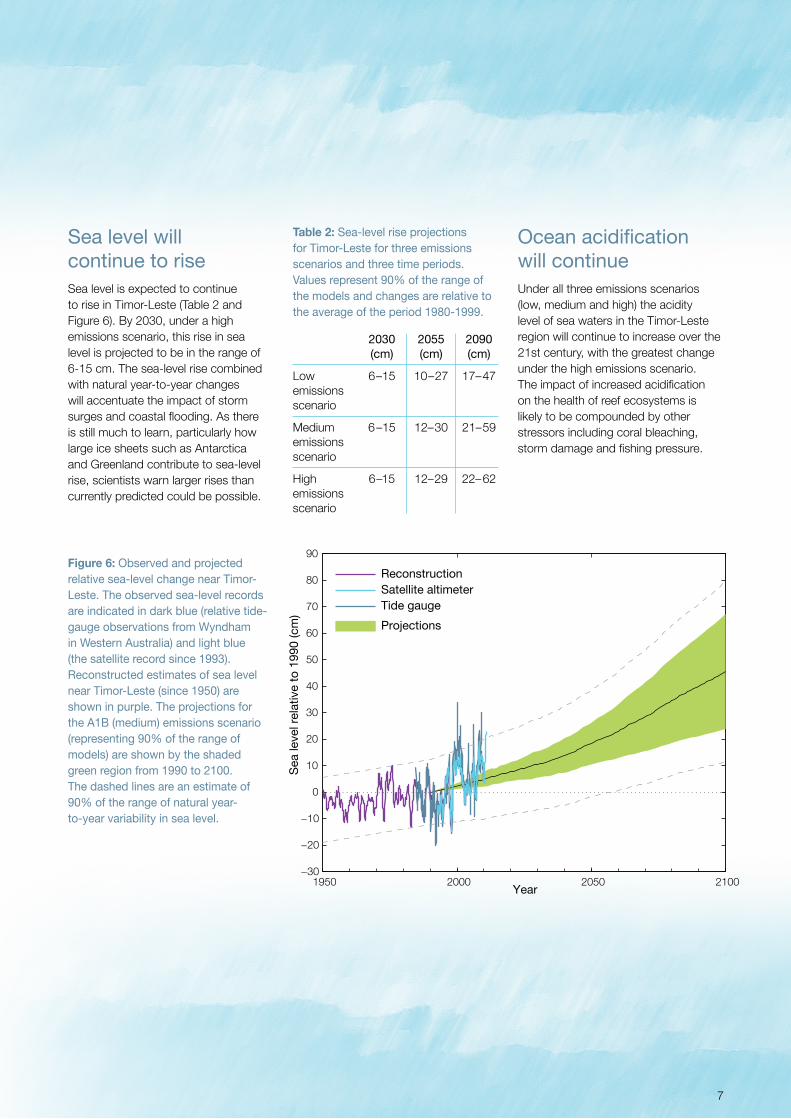
Figure 6: Observed and projected relative sea-level change near Timor-Leste. The observed sea-level records are indicated in dark blue (relative tide-gauge observations from Wyndham in Western Australia) and light blue (the satellite record since 1993). Reconstructed estimates of sea level near Timor-Leste (since 1950) are shown in purple. The projections for the A1B (medium) emissions scenario (representing 90% of the range of models) are shown by the shaded green region from 1990 to 2100. The dashed lines are an estimate of 90% of the range of natural year-to-year variability in sea level.
Sea level will continue to rise Sea level is expected to continue to rise in Timor-Leste (Table 2 and Figure 6). By 2030, under a high emissions scenario, this rise in sea level is projected to be in the range of 6-15 cm. The sea-level rise combined with natural year-to-year changes will accentuate the impact of storm surges and coastal flooding. As there is still much to learn, particularly how large ice sheets such as Antarctica and Greenland contribute to sea-level rise, scientists warn larger rises than currently predicted could be possible.
Ocean acidification will continueUnder all three emissions scenarios (low, medium and high) the acidity level of sea waters in the Timor-Leste region will continue to increase over the 21st century, with the greatest change under the high emissions scenario. The impact of increased acidification on the health of reef ecosystems is likely to be compounded by other stressors including coral bleaching, storm damage and fishing pressure.
Table 2: Sea-level rise projections for Timor-Leste for three emissions scenarios and three time periods. Values represent 90% of the range of the models and changes are relative to the average of the period 1980-1999.
2030 2055 2090 (cm) (cm) (cm)
Low 6–15 10–27 17–47 emissions scenario
Medium 6–15 12–30 21–59 emissions scenario
High 6–15 12–29 22–62 emissions scenario
Reconstruction
Tide gaugeSatellite altimeter
Projections
Sea
leve
l rel
ativ
e to
199
0 (c
m)
1950 2000 2050 2100−30
−20
−10
0
10
20
30
40
50
60
70
80
90
Year
The content of this brochure is the result of a collaborative effort between the Timor-Leste National Directorate of Meteorology and Geophysics and the Pacific Climate Change Science Program – a component of the Australian Government’s International Climate Change Adaptation Initiative. This information and research conducted by the Pacific Climate Change Science Program builds on the findings of the 2007 IPCC Fourth Assessment Report. For more detailed information on the climate of Timor-Leste and the Pacific region see: Climate Change in the Pacific: Scientific Assessment and New Research. Volume 1: Regional Overview. Volume 2: Country Reports. Available from November 2011.
www.pacificclimatechangescience.org
Contact the Timor-Leste National Directorate of Meteorology and Geophysics:
web: www.dnmg.gov.tl email: [email protected] phone: +670 3331092
Timor-Leste’s climateChanges in
> Temperatures have warmed and will continue to warm with more very hot days in the future.
> Rainfall data for Dili Airport show a clear decreasing trend in annual and dry season rainfall since 1952, however, there are data gaps. Rainfall patterns are projected to change over this century with more extreme rainfall days but little change in drought frequency.
> By the end of this century projections suggest decreasing numbers of tropical cyclones.
> Ocean acidification has been increasing in Timor-Leste’s waters. It will continue to increase and threaten coral reef ecosystems.
> Sea level near Timor-Leste has risen and will continue to rise throughout this century.
© Pacific Climate Change Science Program partners 2011.