Embed Size (px)
Citation preview

Demand Planning & Forecasting:
Utilizing IRT Data for Efficient Supply Chain Management
4th Annual CBI IRT 2014 | 20 October 2014

General Housekeeping
Emergency exits
Restrooms
Ask questions!
Please turn your mobile phones to silent

Who We Are
Almac is a global drug
development services provider.
Our mission is to be your partner
of choice, providing an expanding
array of innovative clinical
solutions worldwide.
Almac & Presenters
3420+ employees globally
Clinical
Technologies
Biomarker
Discovery &
Development
API Services
& Chemical
Development
Pharmaceutical
Development
Clinical
Trial Supply
Analytical
Services
Commercial
Services
DELIVERY DEVELOPMENT DISCOVERY

ICE BREAKER

Objectives for the Day
Supply Forecast & IRT Touch Points
Pre-study Set Up
Ongoing Study Forecast & IRT Adjustment
Learn, Share & Have Fun

AGENDA AT-A-GLANCE
8:30 – 10:00 Session 1
10:00 – 10:30 Break
10:30 – 11:45 Session 2
11:45 – 12:00 Closing Remarks
12:00 Lunch
Agenda
SESSION 1 Building a Forecast
Pre-Study and IRT Touch
Points
SESSION 2 Using IRT to Assist in
Managing Your Supply
Forecast
The Capital Markets: Cost per NME
(Total Annual Spend/Annual Approvals)
Cost per NME ($US Billions)
3.8 3.7
5.1
2011 2012 2013
Source: EvaluatePharma; PwC
Trial Expense

Confidential © Almac 2014
Trial Complexity
Typical Phase III Protocol 2002 2012
Total endpoints 7 13
Total procedures 106 167
Total eligibility criteria 31 50
Total countries 11 34
Total sites 124 196
Total patients randomized 729 597
Source: Tufts CSDD

Globalization – Spread of Clinical Studies
Graph illustrates the
number of clinical
trials registered by
country from data
supplied by
clinicaltrials.gov
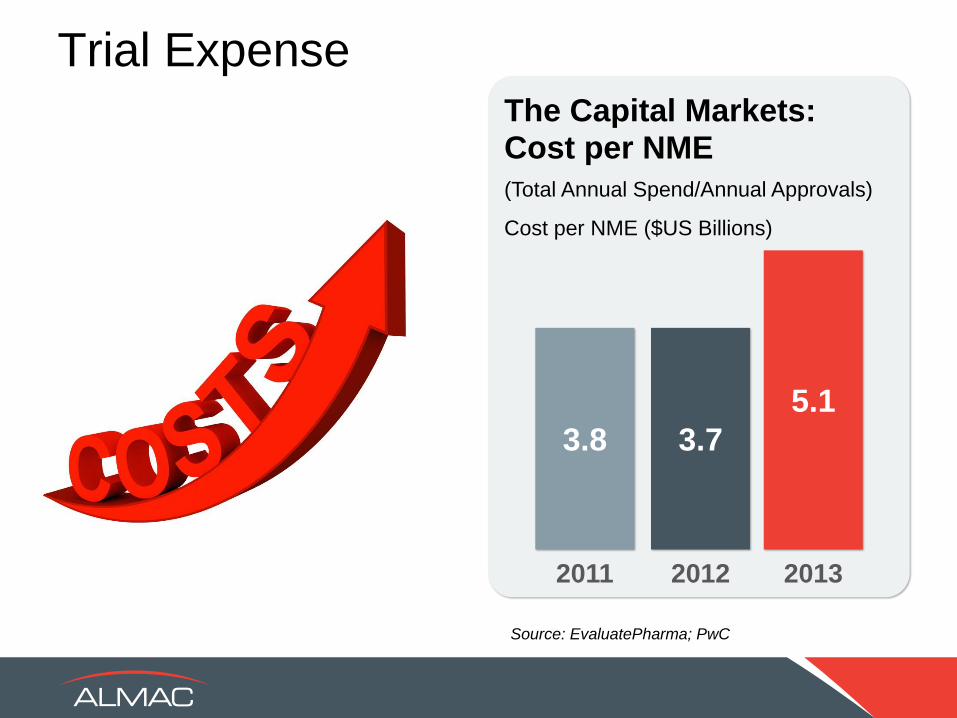
Increase in countries involved, 11 to 34
Decrease in patients, 729 to 597
• Individual trials are now more complex and global…and more expensive
• More sites, less patients
– 48% of sites under-enroll
– 11% of sites never enroll a subject
• Average cost / patient $25,000 (2008) - $47,000 (2011)
Globalization, Sites and Patients

Changing Pipeline Mix
Complex Drug Supply
2013 2007
29% 36%
71% 64%
Biologics Chemical Entities
Growing Presence of Biologics
Up By
7%
Challenges
Manufacturing
Supply Chain
Blinding
Expiry
Storage
Distribution
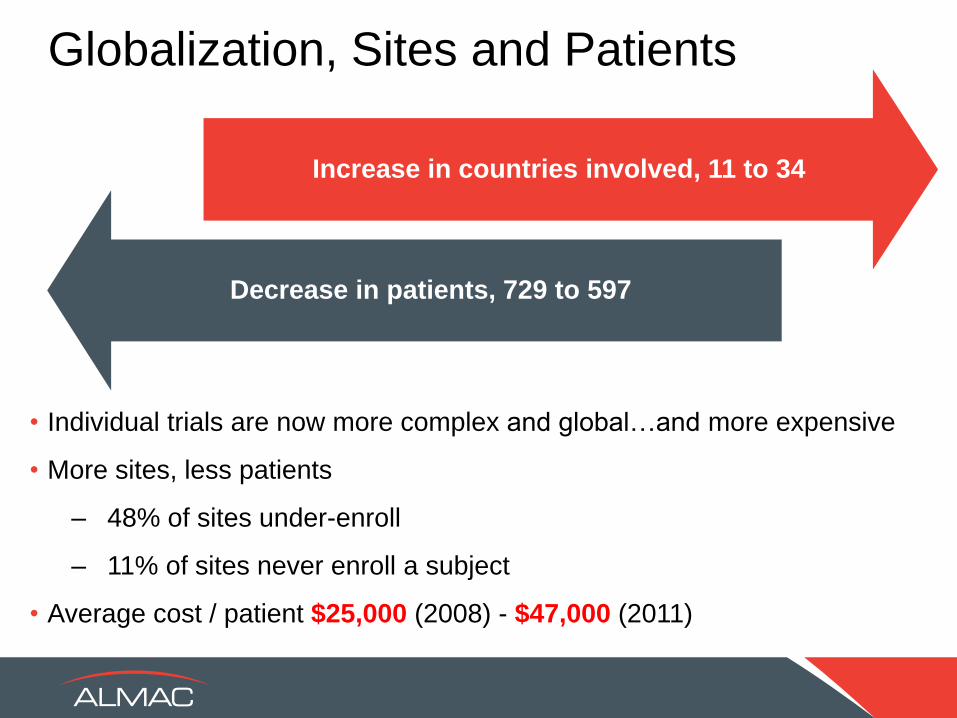
Technology enables real time data to drive timely decisions
Built in flexibility to allow quick response to actual study
conditions
Focused planning for global and complex supply chain
Need to address physical and data needs for global clinical
supply
Informed Decisions
Eff
icie
nt
Tri
al,
Sit
e
& P
ati
en
t M
an
ag
em
en
t
Patients and Sites
Data entered across multiple platforms
Phone Web Web Device
Technology as an Agent of Change
Sponsors

Supply Forecast & IRT Touch Points

Different
Perspectives on IRT

-Study Design
-Visit Windows
-Inclusion/Exclusion
-Randomization
-Enrollment
-Visit Registration
-Medication
Assignment
-Titration
-Electronic Data
Capture
-Un-blinding
-Study Results
-BioStatistics
Clinical Team
Clinical Supplies Group
-Inventory management
-Expiry management
-Enrollment tracking
-Inventory release and
control
-Shipment requests
-Shipment acknowledgement
-Quarantine and release
-Site levels
-Returns accountability
-Temperature control and
Excursion resolution
Track Progress and
Adjust Forecasts

Forecasting
What is a forecast?
• A prediction of clinical events and patient activity creating demand in
the clinical trial supply chain over time
Based on available information at a given point in time:
• If information is not available, make an assumption and document it!
Why generate a forecast?
• To maximize supply chain by minimizing waste without compromising
patient therapy
• To develop a supply strategy and packaging plan
• To reduce the risk of stock-outs
• To reduce cost

CRITICAL FORECAST DRIVERS
Study Design and Enrollment
Product Design / Characteristics
Randomization Parameters –
Patient Population
Visit / Dosing Schedule
Screening Windows
Participating Countries
Country/Site Activation Schedule
Local Depots
Screening/Enrolment Rates
Fixed or Variable Dosing
(Titration; weight based)
Drop-out/Discontinuation Rate
Study Completion Criteria
Therapeutic Setting
Bulk Drugs (Production/Procurement)
Pack Types
(Primary Packaging & Kit Design)
Label Strategy
Shelf Life and Stability Program
Temperature Monitoring/Excursions
Storage Conditions
Shipment Conditions
Shipment Frequency
Inventory Management Strategy
Seeding
Triggers
Prediction Ranges
FIXED VARIABLE

Information Sources
Previous studies and in-house experience
CRO
Clinicians and medical professionals

Forecasting Technology
• Allows for the creation of a clinical forecast that details
material needs in time phases based on Set Algorithm -
Fixed
– Enrollment rates, site and country ramp up, drop out rates
– Protocol design – visit schedule and titration choices
– Overage, site seeding and/or safety stock
– Label Groupings
• Allows for multiple scenarios to be programmed and
compared

Forecasting Technology
• Combines forecast technology with MRP to produce
planned production orders to satisfy demand taking into
account
– Inventory on hand at Sites, Depots, and vendor facilities
– Expiry Dates
– Production capacity and operation duration
– Bill of materials/component availability and lead time for
re-order
– Pending production orders
– Lead time for transfer from Vendor Sites to Depots

Some Thoughts on Overage
Overage = Insurance – Is the cost of insurance high or low?
– Be careful with percentages
• 15% of 10,000 units
• 15% of 100 units
– Overage is primarily affected by the following factors:
• # of Subjects
• # of Regions
• # of Depots
• # of Treatment Groups
• Screening Window
• Central vs. Stratified Randomization Scheme
• Certainty

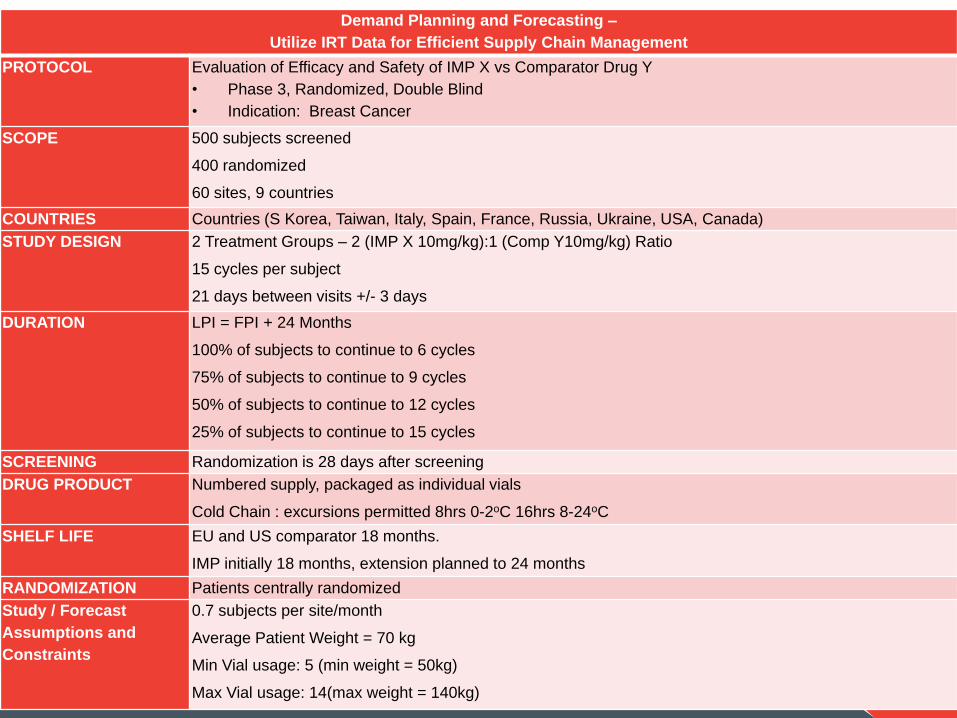
Demand Planning and Forecasting –
Utilize IRT Data for Efficient Supply Chain Management
PROTOCOL Evaluation of Efficacy and Safety of IMP X vs Comparator Drug Y
• Phase 3, Randomized, Double Blind
• Indication: Breast Cancer
SCOPE 500 subjects screened
400 randomized
60 sites, 9 countries
COUNTRIES Countries (S Korea, Taiwan, Italy, Spain, France, Russia, Ukraine, USA, Canada)
STUDY DESIGN 2 Treatment Groups – 2 (IMP X 10mg/kg):1 (Comp Y10mg/kg) Ratio
15 cycles per subject
21 days between visits +/- 3 days
DURATION LPI = FPI + 24 Months
100% of subjects to continue to 6 cycles
75% of subjects to continue to 9 cycles
50% of subjects to continue to 12 cycles
25% of subjects to continue to 15 cycles
SCREENING Randomization is 28 days after screening
DRUG PRODUCT Numbered supply, packaged as individual vials
Cold Chain : excursions permitted 8hrs 0-2oC 16hrs 8-24oC
SHELF LIFE EU and US comparator 18 months.
IMP initially 18 months, extension planned to 24 months
RANDOMIZATION Patients centrally randomized
Study / Forecast
Assumptions and
Constraints
0.7 subjects per site/month
Average Patient Weight = 70 kg
Min Vial usage: 5 (min weight = 50kg)
Max Vial usage: 14(max weight = 140kg)
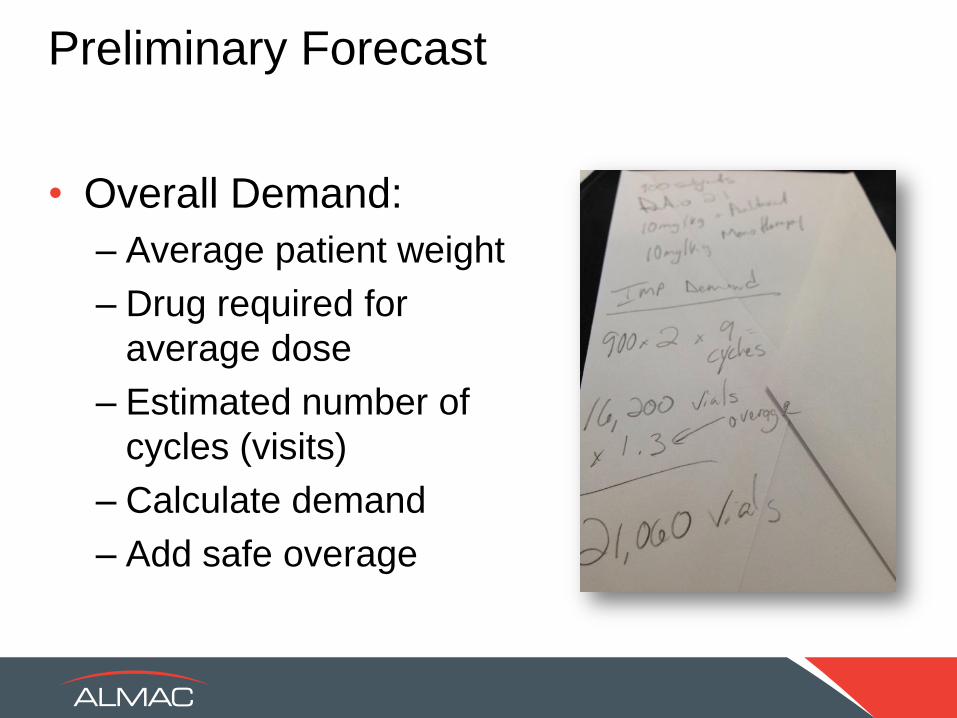
Preliminary Forecast
• Overall Demand:
– Average patient weight
– Drug required for
average dose
– Estimated number of
cycles (visits)
– Calculate demand
– Add safe overage


Study Design
Forecast
IRT Development
Bulk or API Forecast
26
Study
Start
Supply Outlook

IRT
Study Design
Drug Supply
Demand Assumptions
DATA

IRT
Modules Inventory
Management Reporting
Data Integration

Managing Drug in IRT
• Inventory Calculation
– Set Algorithm - Fixed
– Step-by-step procedures
– Established at system build
• Adjustable values
– Suggested at beginning of study
– Easily modified as new data becomes available
– Dials to fine tune medication management

Common Site Inventory Management Methodologies
Initial shipment
Trigger and resupply
Randomization projections
Visit projections

Initial Supply to Sites
Screening Window = 3 to 10 days
Shipping Lead Time = 7 days
Screening Window = 10 to 21 days
Supplies shipped at site activation
Supplies shipped at patient screening
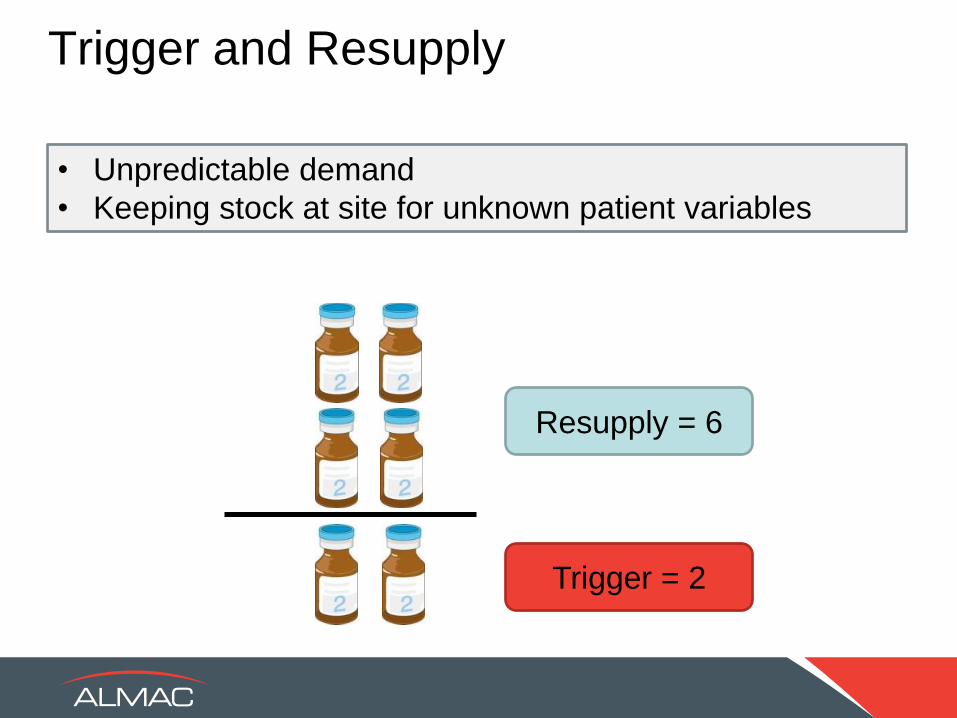
Trigger and Resupply
Trigger = 2
Resupply = 6
• Unpredictable demand
• Keeping stock at site for unknown patient variables

Randomization Projections
• 2 Treatment groups A and B
• 1:1 ratio
• Block size 4
• Enrollment prediction of 4 patients/site/month
Centralized Randomization Site Stratified Randomization
4 Type A kits 2 Type A kits
4 Type B kits 2 Type B kits

Visit Projections
• Using the visit schedule, IRT calculates when
subjects are expected to come in for visits and what
treatment they are on
• Orders will be placed for specific patient need X days
before the visit
• Often referred to as a “predictive look ahead”
Visit 1 [WEEK 1]
Visit 2 [WEEK 2]
Visit 3 [WEEK 3]

Projection Time Frame
Use Short Look Ahead Use Long Look Ahead
Short Transit Time Long Transit time
Short Expiration Long Expiration
High Discontinue Low Discontinue
Low Supply Availability High Supply Availability
Limited Site Storage No Site Storage Issues
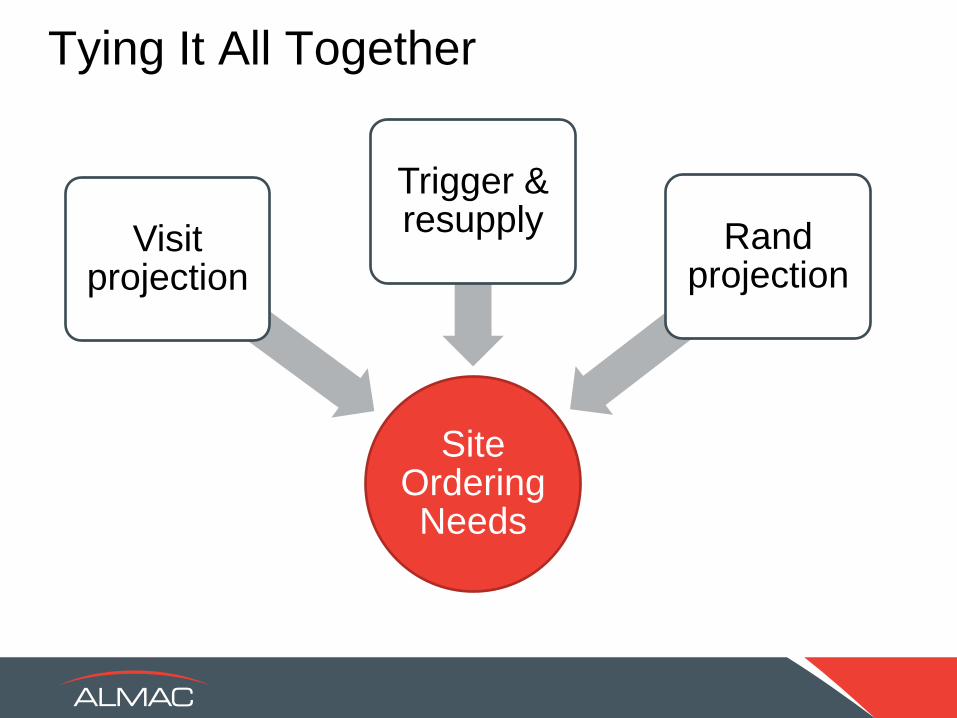
Tying It All Together
Site Ordering Needs
Visit projection
Trigger & resupply Rand
projection

Let’s Get Into Your Teams!
• On the pages provided, you have a
scenario to consider
• You have 25 minutes to discuss
• Think about how you would:
– Consider the supply/forecast constraints
– Apply IRT settings using assumptions
• Feedback to the group on your thoughts
Demand Planning and Forecasting –
Utilize IRT Data for Efficient Supply Chain Management
PROTOCOL Evaluation of Efficacy and Safety of IMP X vs Comparator Drug Y
• Phase 3, Randomized, Double Blind
• Indication: Breast Cancer
SCOPE 500 subjects screened
400 randomized
60 sites, 9 countries
COUNTRIES Countries (S Korea, Taiwan, Italy, Spain, France, Russia, Ukraine, USA, Canada)
STUDY DESIGN 2 Treatment Groups – 2 (IMP X 10mg/kg):1 (Comp Y10mg/kg) Ratio
15 cycles per subject
21 days between visits +/- 3 days
DURATION LPI = FPI + 24 Months
100% of subjects to continue to 6 cycles
75% of subjects to continue to 9 cycles
50% of subjects to continue to 12 cycles
25% of subjects to continue to 15 cycles
SCREENING Randomization is 28 days after screening
DRUG PRODUCT Numbered supply, packaged as individual vials
Cold Chain : excursions permitted 8hrs 0-2oC 16hrs 8-24oC
SHELF LIFE EU and US comparator 18 months.
IMP initially 18 months, extension planned to 24 months
RANDOMIZATION Patients centrally randomized
Study / Forecast
Assumptions and
Constraints
0.7 subjects per site/month
Average Patient Weight = 70 kg
Min Vial usage: 5 (min weight = 50kg)
Max Vial usage: 14(max weight = 140kg)

Building
Flexibility
is more
important
than
Accuracy


“Forecasting is hard, especially first thing in the morning.”
.

SESSION 2
Managing Your Forecast

IRT
Study Design
Drug Supply
Demand Assumptions
DATA

What, when, and how
we check our work,
and make adjustments

Monitoring Forecast Drivers
– Site activation data
– Enrollment:
• Actual monthly enrollment is captured and forecast updated
• Estimated enrollment rate can be re-calculated for future projection
• Drop-out Rate – confirm agreement with projection or add to forecast
– Rate of drug supply utilization
• Is it in agreement with forecast?
• Should assumptions be modified?
– Frequency of forecast updates has to be decided upon
• When do we have enough data to merit a baseline change?
– Source of Data
• How will data be collected?

Forecast Maintenance Benefits of Monitoring
• Supply Utilization / Inventory Balance
• Comparator Purchasing
• Assessment of retest/expiry date impact
• Adjustment to IRT Drug Management Settings
Adjusting assumptions allows for optimization of clinical supply chain
• Adjust Production Schedule based on demand
• Adapt to changing lead times and demand
Supply Utilization and Inventory Balance
• Strategic Sourcing Comparator Purchasing
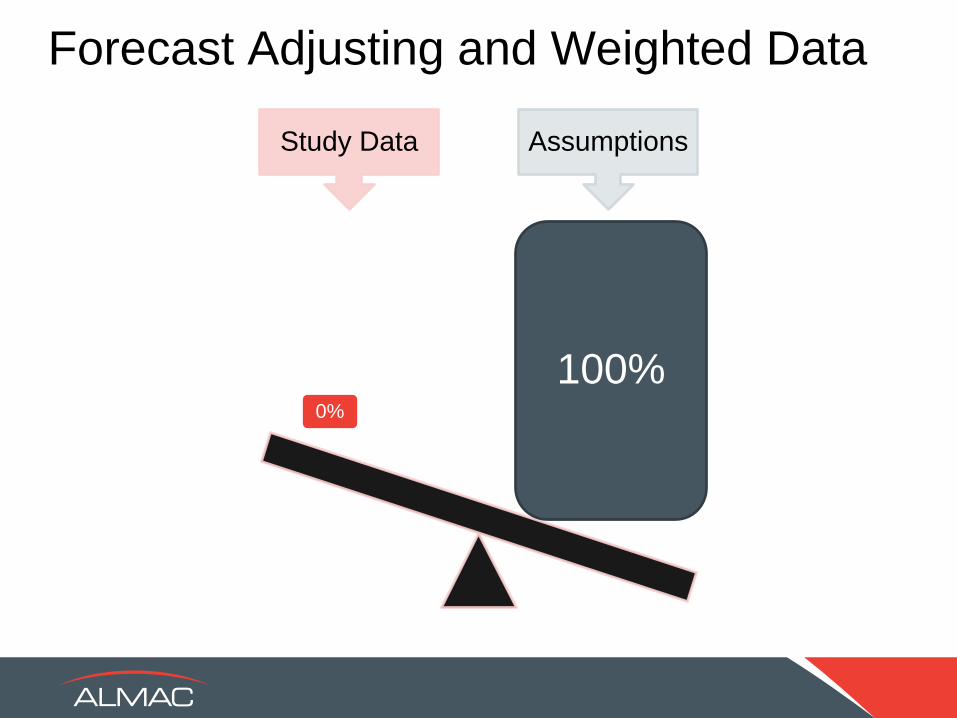
Forecast Adjusting and Weighted Data
Study Data Assumptions
0%
100%

Forecast Adjusting and Weighted Data
Study Data Assumptions
25% 75%

Forecast Adjusting and Weighted Data
Study Data Assumptions
25% 75%

Application of Weighted Average
Enrollment Actual Vials
Per Dose Weight of
Study Data
Initial
Forecasted
Vials per
Dose
Weight of
Initial
Forecast
Updated
Forecasted
Vials per
Dose
0% 0 0% 9 100% 9
25% 6.5 25% 9 75% 8.375
50% 6.4 50% 9 50% 7.7
75% 6.2 75% 9 25% 6.9

Average Patient Weight
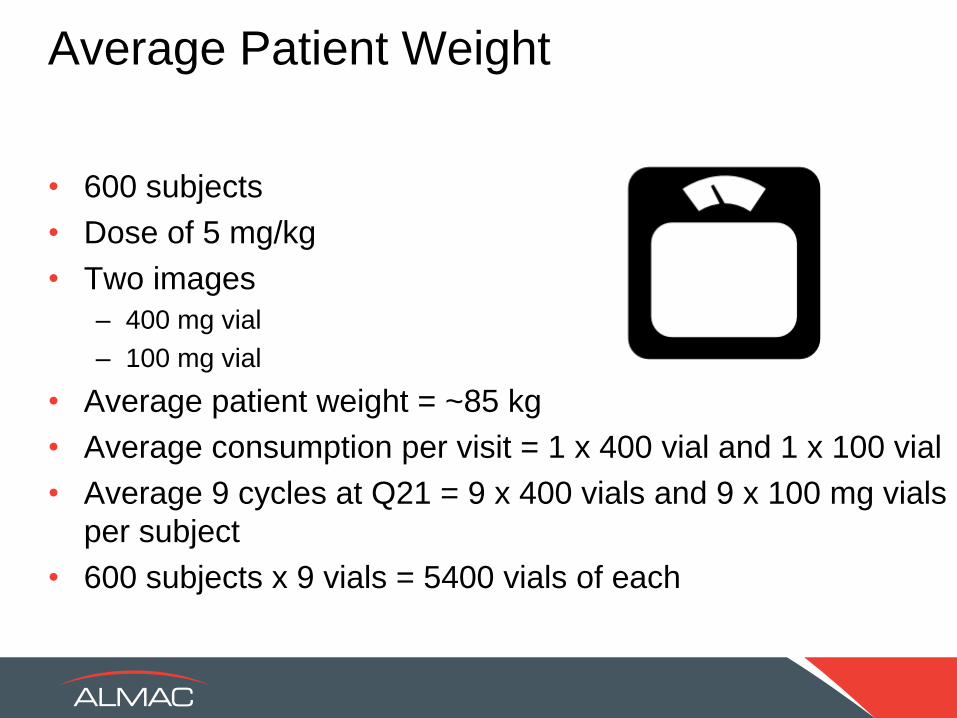
Average Patient Weight
• 600 subjects
• Dose of 5 mg/kg
• Two images
– 400 mg vial
– 100 mg vial
• Average patient weight = ~85 kg
• Average consumption per visit = 1 x 400 vial and 1 x 100 vial
• Average 9 cycles at Q21 = 9 x 400 vials and 9 x 100 mg vials
per subject
• 600 subjects x 9 vials = 5400 vials of each

Average Patient Weight
Dose Ranges
(Kg) Number of
Subjects in Range 400 mg 100 mg
50-60 75 0 3
61-80 145 1 0
81-100 250 1 1
101-120 110 1 2
121-140 20 1 3

Average Patient Weight
• With interim study data and adjusted outlook:
4,725 vials
of 400 mg
Over-forecasted
by 14.2%
6,795 vials
of 100 mg
Under-forecasted
by 25.8%

Leveraging Maintenance Data

Patient Weight Analysis
0
2000
4000
6000
8000
10000
12000
14000
16000 Supply Calculation by Average Weight
Cumulative Kits Released
Cumulative Projected Demand
Cumulative Projected Demand (Revised Assignment Qty)
Cumulative Actual Demand

Supply Utilization Monitoring
Comparison of Projected To Actual Treatment Preference
COUNTRY / REGION
TPC-1 TPC-2 TPC-3 TPC-4 TPC-5 TPC-6 Screened
Patient Total
WESTERN EUROPE Initial Assumption
26.0% 30.0% 20.0% 9.0% 5.0% 10.0%
Treatment of Physician's Choice (TPC): Preference
per Screening Data
Feb-13 46.7% 28.0% 11.7% 5.1% 1.4% 7.0% 214
Mar-13 50.8% 25.8% 0.1% 4.3% 1.2% 6.3% 256
Apr-13 51.9% 25.6% 11.3% 4.4% 1.4% 5.5% 293
May-13 53.5% 24.5% 10.9% 4.8% 1.2% 5.1% 331
Jun-13 54.7% 23.3% 10.6% 4.9% 1.6% 4.9% 369
Jul-13 54.6% 22.8% 11.4% 4.9% 1.7% 4.6% 412

Enrollment Monitoring
0
500
1000
1500
2000
2500
3000
3500
4000 Patient Visit Projections - Scenario Comparison
Projected Enrollment Visits 1) 6500 Pts in 18 Months 2) Interim Analysis 3) 4000 Pts in 9 Months Actual Enrollment Visits 10,500 Pts in 7 Months
Projected Re-supply Visits
Actual Re-supply Visits

IRT Adjustments
Forecast Adjustments
Trigger levels Patient / site / month
Predictive ranges High discontinuation
Site enrollment strategy Slow enrollment,
frequent small shipments, etc.
Expiry rules Supply crunch

Evolution of Forecasting Throughout Trial

Get Into Your Teams!
• Let’s reassess our study based on data
• You have 25 minutes to discuss
• Think about how you would:
– Consider the supply/forecast
– IRT settings using actuals
• Feedback to the group on your thoughts

Demand Planning and Forecasting –
Utilize IRT Data for Efficient Supply Chain Management
PROTOCOL Evaluation of Efficacy and Safety of IMP X vs Comparator Drug Y
• Phase 3, Randomized, Double Blind
• Indication: Breast Cancer
SCOPE 500 subjects screened
400 randomized
60 sites, 9 countries
COUNTRIES Countries (S Korea, Taiwan, Italy, Spain, France, Russia, Ukraine, USA, Canada)
STUDY DESIGN 2 Treatment Groups – 2 (IMP X 10mg/kg):1 (Comp Y10mg/kg) Ratio
15 cycles per subject
21 days between visits +/- 3 days
DURATION LPI = FPI + 24 Months
100% of subjects to continue to 6 cycles
75% of subjects to continue to 9 cycles
50% of subjects to continue to 12 cycles
25% of subjects to continue to 15 cycles
SCREENING Randomization is 28 days after screening
DRUG PRODUCT Numbered supply, packaged as individual vials
Cold Chain : excursions permitted 8hrs 0-2oC 16hrs 8-24oC
SHELF LIFE EU and US comparator 18 months.
IMP initially 18 months, extension planned to 24 months
RANDOMIZATION Patients centrally randomized
Study / Forecast
Assumptions and
Constraints
0.7 subjects per site/month
Average Patient Weight = 70 kg
Min Vial usage: 5 (min weight = 50kg)
Max Vial usage: 14(max weight = 140kg)

6 Common Pitfalls
Stress Test New Med
Management Ideas

Unsortable Data
Weight Based Calculations

Unplanned Reports

Alert Numbness

See No Data
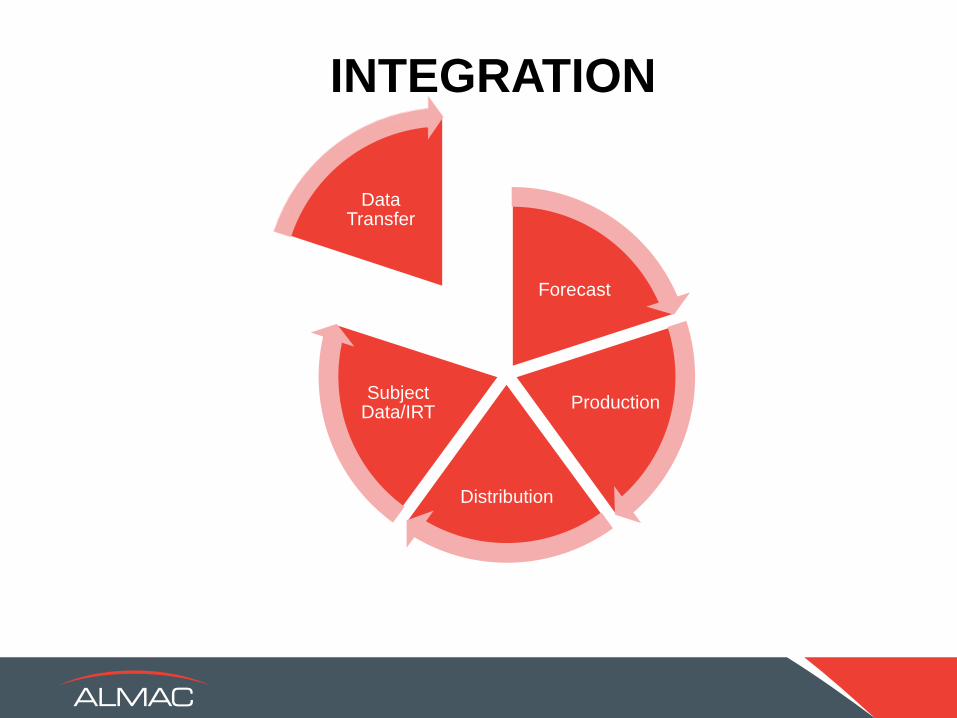
Forecast
Production
Distribution
Subject Data/IRT
Data Transfer
INTEGRATION

Integration of Technology
Provides real time
clinical trials data:
• Randomization
• Dispensing
• Resupply
• Expiry date management
Interactive Voice and Web
Response System IXRS®
Powerful computational
tool determines:
• What is needed
• When is it needed by
• How much is needed
Material Resource
Planner MRP
Details material need in
time phases used to:
• Develop manufacturing
and distribution strategy
• Scenario evaluation
• Budget management
• Risk management
Demand Forecast
INTEGRATION OF TECHNOLOGY ALLOWS GREATER VISIBILITY OF DEMAND IN
THE SUPPLY CHAIN ALLOWING RISKS TO BE IDENTIFIED AND MITIGATED
Confidential © Almac 2014

• Can receive patient and drug usage events directly from the IRT via automatic data transfer
• Automatically adjusts forecast based on drug usage data
• Calculates a “net forecast “ based on available inventory and expiry dates
• Comparison reports for forecasted vs. actual usage
• Enables modification of production activities
• 3 Integrated elements of SupplyWiseTM
• Clinical Forecast
• Material Resource Planning system (MRP)
• Patient Data integration with IRT
Integration of Technology

SupplyWise
INITIAL FORECAST
• Projected patient demand
• Visit schedule
• Protocol variables
• Scenario comparisons
NET FORECAST INPUTS
• Site inventory
• Patients dispensing events
• Expiry date
TECHNOLOGY SOLUTION
MANUFACTURING
PLAN
Detailed component
planning
MRP
Creates planned
production orders
based on:
• Forecast
• Safety Stock
• Pending production
orders
• Existing inventory
• Item Bill of Materials
DISPENSING
to Patients
Almac & Depot Inventory
considered by MRP
Inventory at or in transit to sites considered in Net Forecast
Actual patient event data
considered in Net forecast
Patient Event Data
DISTRIBUTION
Depots & Sites
Drug Orders
Data Integration with (IVRS / IWRS)
Inventory Release File

Incremental Application of Weighted Average
Enrollment Actual Vials
Per Dose Weight of
Study Data
Initial
Forecasted
Vials per
Dose
Weight of
Initial
Forecast
Updated
Forecasted
Vials per
Dose
0% 0 0% 9 100% 9
2% 6.5 2% 9 98% 8.95
4% 6.4 4% 9 96% 8.896
6% 6.6 6% 9 94% 8.832

Key Take-Aways
Supply Forecast & IRT Touch Points
- Consider the needs of all stakeholders
- Technology facilitates success
- Integrate systems for fluid data flow
Pre-study Set Up
- Flexibility in IRT design is critical
- At the beginning, work with the end in mind
Ongoing Study Forecast & IRT Adjustment
- Reduction in overage as data accrues
- Site resupply configurations to match demand


![[IRT] Item Response Theory - Survey Design · Title irt — Introduction to IRT models DescriptionRemarks and examplesReferencesAlso see Description Item response theory (IRT) is](https://img.pdfslide.us/doc/110x75/605f13066a7f910fdc25b6b6/irt-item-response-theory-survey-design-title-irt-a-introduction-to-irt-models.jpg)