Embed Size (px)
Citation preview
MULTIVARIATE BEHAVIORAL RESEARCH 523
Multivariate Behavioral Research, 36 (4), 523-562Copyright © 2001, Lawrence Erlbaum Associates, Inc.
Fitting Item Response Theory Models to Two PersonalityInventories: Issues and Insights
Oleksandr S. Chernyshenko, Stephen Stark, Kim-Yin Chan,Fritz Drasgow and Bruce Williams
University of Illinois at Urbana-Champaign
The present study compared the fit of several IRT models to two personality assessmentinstruments. Data from 13,059 individuals responding to the US-English version of theFifth Edition of the Sixteen Personality Factor Questionnaire (16PF) and 1,770 individualsresponding to Goldberg’s 50 item Big Five Personality measure were analyzed. Variousissues pertaining to the fit of the IRT models to personality data were considered. Weexamined two of the most popular parametric models designed for dichotomously scoreditems (i.e., the two- and three-parameter logistic models) and a parametric model forpolytomous items (Samejima’s graded response model). Also examined were Levine’snonparametric maximum likelihood formula scoring models for dichotomous andpolytomous data, which were previously found to provide good fits to several cognitiveability tests (Drasgow, Levine, Tsien, Williams, & Mead, 1995). The two- and three-parameter logistic models fit some scales reasonably well but not others; the gradedresponse model generally did not fit well. The nonparametric formula scoring modelsprovided the best fit of the models considered. Several implications of these findings forpersonality measurement and personnel selection were described.
Personality assessment is currently enjoying a rebirth in Industrial andOrganizational psychology (Hough & Schneider, 1996). Since the mid-1980s, several meta-analytic studies have demonstrated the usefulness ofpersonality variables for predicting important work outcomes (e.g., Barrick& Mount, 1991, 1993; Ones, Viswesvaran, & Schmidt, 1993), while othershave suggested that personality variables have less adverse impact againstminorities than measures of cognitive ability (e.g., Feingold, 1994; Hough,1996; Ones et al., 1993; Sackett, Burris, & Callahan, 1989). Becausepersonality does not correlate strongly with intelligence, it is hoped that
We greatly appreciate the help of Michael Levine on providing his insightfulcomments on drafts of this article have substantially improved its quality. This researchwas supported in part by an NSF grant to Michael Levine, grant # 9515038.
Please address correspondence regarding this manuscript to Oleksandr S.Chernyshenko, Department of Psychology, University of Illinois at Urbana-Champaign,E. Daniel St., Champaign, IL, 61820. Electronic mail may be sent [email protected].
O. Chernyshenko, S. Stark, K. Chan, F. Drasgow, and B. Williams
524 MULTIVARIATE BEHAVIORAL RESEARCH
personality measures can provide incremental validity for predicting job-related criteria. This has important implications for the practice of personnelselection (Hough, Eaton, Dunnette, Kamp, & McCloy, 1990; Tett, Jackson,& Rothstein, 1991).
The increased use of personality constructs in selection, training andpromotion inevitably brings attention to the quality and fairness of personalitytesting. Adequately addressing these issues requires sophisticatedmathematical methods. Traditional classical test theory approaches thatevaluated psychological measures at the level of total scores have beencomplemented by more recent item response theory (IRT) approaches thatfocus on item level data. For example, Waller, Tellegen, McDonald andLykken (1996) used IRT for the design and development of personalityscales. Others have used IRT to detect items that are biased against genderand ethnic groups (e.g., Gratias & Harvey, 1998; Jennings & Schmitt, 1998)and to address the issue of faking on personality tests (e.g., Flanagan, Raju,& Haygood, 1998; Zickar & Robie, 1998).
Item response theory relates characteristics of items (item parameters)and characteristics of individuals (latent traits) to the probability of choosingeach of the response categories. This probabilistic relationship ismathematically defined by the item response function (IRF), which is anonlinear regression of the probability of choosing to an item responsecategory on a latent trait, �. There are several families of item responsefunctions that can be used to model unidimensional or multidimensional datahaving dichotomous or polytomous response formats.
IRT methods allow personality researchers to improve test constructionand evaluate the quality of individual items. At a broader level, IRT may evenhelp us understand how people respond to personality items. Some of theadvantages of IRT over classical methods include: (a) item parameters arenot subpopulation dependent; (b) the person parameter is not specific to theset of items forming the test; and (c) measurement precision is not assumedto be constant; instead IRT methods allow researchers to calculateconditional standard errors of measurement (see Rouse, Finger, & Butcher,1999, for a recent review). Another advantage of IRT is that it can be usedto develop computerized adaptive assessment instruments.
Despite the appeal of IRT, we argue that researchers and practitionersneed to pay more attention to the fundamental issue of model-data fit whenusing IRT models to describe personality data. Without evidence of modelfit, IRT results may be suspect. Throughout this study we will examine howcommonly used IRT models (dichotomous and polytomous) fit data from twowidely used personality inventories. Our purpose is three-fold: (a) raiseawareness of model-data fit issues in the personality domain; (b) highlight
O. Chernyshenko, S. Stark, K. Chan, F. Drasgow, and B. Williams
MULTIVARIATE BEHAVIORAL RESEARCH 525
new indices of model-data fit; and (c) stimulate research on applications ofIRT to noncognitive data.
There is no a priori justification why any specific IRT model shoulddescribe data adequately. More general models that have less restrictiveassumptions will generally fit better but they require larger samples toestimate their increasing numbers of parameters and quickly becomeimpractical for test developers. Regardless of mathematical complexity, theuse of any model must eventually be justified on the basis of empirical results,and not only on a priori grounds (Lord, 1980). One can use a model withconfidence only after repeatedly verifying that model predictions correspondto the observed data. For example, extensive research has been conductedto assess the fit of IRT models to multiple-choice cognitive ability tests.Overall, good correspondence has been established between the three-parameter logistic (3PL) model and cognitive ability data. Similarconclusions have yet to be reached for personality data.
Intuitively, one expects that unidimensional IRT models should fitpersonality data well, provided that a single factor model adequatelydescribes the data. This is a reasonable assumption because the majority ofpersonality scales have been developed using the factor analytic method ofscale construction (Hogan, 1991). However, IRT makes some assumptionsthat are stronger than those made by the common factor model. As notedby McDonald (1999, p. 255), the common factor model assumes weak localindependence, which means that the covariance of all pairs of items is zerofor respondents with a fixed latent trait level; IRT on the other hand, assumesstrong local independence meaning that the probability of a response patternfactorizes; that is, it can be written as the product of the probabilities of itemresponses for a given subpopulation of respondents. Consequently, it ispossible to have violations of strong local independence, but no violations ofweak local independence. Thus, poorly fitting unidimensional IRT modelsmay be observed even though factor analytic methods suggest that a singlecommon factor underlies the responses. In our opinion, only empiricalstudies can sufficiently address the issue of model-data fit in personality.
Current Research on Model-Data Fit in Personality
To date, few attempts have been made to determine which IRT models(if any) can fit personality data adequately. One influential study thatspecifically addressed this issue was Reise and Waller’s (1990) paper on thefit of the one-parameter logistic (1PL) and two-parameter-logistic (2PL)models to the dichotomously scored Multidimensional PersonalityQuestionnaire (MPQ; Tellegen, 1982). They utilized several methods for
O. Chernyshenko, S. Stark, K. Chan, F. Drasgow, and B. Williams
526 MULTIVARIATE BEHAVIORAL RESEARCH
assessing the suitability of personality data for IRT analyses, including theassessment of unidimensionality and model-data fit. Their results showedthat the 2PL model provided an adequate fit to the MPQ data. Consequently,they went on to advocate the use of IRT methods for the assessment ofnormal personality.
Given these findings, personality researchers have apparently assumedthat IRT models, commonly applied to cognitive data, are also appropriate forpersonality data. Most researchers have chosen one of the IRT models (e.g.,the 2PL or 3PL) and estimated item parameters with conveniently availablecomputer programs such as BILOG (Mislevy & Bock, 1991). For example,Ellis, Becker and Kimmel (1993) used the 3PL model to evaluate themeasurement equivalence of the Trier Personality Inventory (Becker, 1989),and Waller et al. (1996) used the 2PL model in their analysis of the MPQ.Rouse, Finger and Butcher (1999) also used the 2PL model to evaluatescales of the Personality Psychopathology Five (Psy-5, Harkness &McNulty, 1994), while Cooke and Michie (1997) fit the 2PL to data from theHare Psychopathy Checklist-Revised (Hare, 1991). Schmit and Ryan(1997) used the graded response model to address the specificity of itemcontent in the NEO-PI Conscientiousness scale. These researcherschecked whether their data were unidimensional, but did not report how welltheir model fit the observed data.
Assessing the fit of IRT models is difficult. As Reise, Widaman andPugh (1993) note, there are many useful fit statistics for factor analysis andstructural equation modeling, but few parallel measures for IRT. Clearly,developing measures of fit for IRT is an important area for future researchby psychometricians.
In sum, these studies show that IRT can improve the assessment ofpersonality, and, consequently, aid personnel selection in many ways.Nevertheless, these findings are meaningful only to the extent that the IRTmodels adequately fit personality data. The research on fit is limited to onestudy that used only two IRT models and one personality questionnaire and,thus, many fundamental questions remain unanswered. For example, we donot know whether the 3PL model is more appropriate than the 2PL model forpersonality data: Reise and Waller (1990) did not attempt to fit the 3PL modeleven though they noted that several items had “lower asymptotes”corresponding to the c-parameter in the 3PL model. Reise and Wallerargued that guessing was not expected on a personality test such as theMPQ. Subsequently, other researchers have suggested that guessing oncognitive ability items may be analogous to faking on personality items (seeRouse et al., 1999). Thus, examination of the fit of the 3PL model topersonality data is needed. It is also unclear how well IRT models can fit
O. Chernyshenko, S. Stark, K. Chan, F. Drasgow, and B. Williams
MULTIVARIATE BEHAVIORAL RESEARCH 527
polytomous responses that are typical of many personality inventories. Reiseand Waller (1990) only reported model-data fit for a dichotomously scoredinventory (i.e., the MPQ). Hence, it is time to take a hard look at the fit ofIRT models to personality data by evaluating a variety of IRT models andpersonality item formats.
Here, it is necessary to acknowledge the trade off between searching formodels that adequately describe item responses and rejecting items that donot fit a chosen model. Although increasing the complexity of models willimprove fit, it will also increase the sample size needed for IRT analyses, aswell as possibly hinder applications of IRT in practical settings. On the otherhand, outright rejection of items that do not fit a particular model may resultin elimination of classes of items from personality instruments [see Roberts,Laughlin & Wedell (1999) for a specific example]. We believe that it isimportant to have psychometric models that are general enough to describewhat are considered to be psychometrically “good” personality items. In thismanuscript we worked with existing personality inventories. They containitems that were selected from pools of hundreds of items using carefulscreening processes. Thus, we believe that these items can be considered“good” and our task was to find a model general enough to describe them.If we could not assume that the items were of “good” quality, then the issueof determining the generality required of an IRT model would be morecomplex because it becomes difficult to separate problems due to “bad”items from problems due to inadequate IRT models.
Models
In the present article, a series of unidimensional IRT models ofincreasing complexity was applied to data from two personality inventoriesto examine the degree of generality needed to fit personality itemsadequately. Models examined included those used for dichotomously scoreditems (i.e., the 2PL model and 3PL model) and a model for polytomous items(i.e., Samejima’s, 1969, graded response [SGR] model). The 2PL, 3PL andSGR models are nested parametric models in the sense that the 2PL modelcan be obtained from the two more complex models by setting someparameters to zero. Also examined were Levine’s maximum likelihoodformula scoring (MFS) models for dichotomous and polytomous data(Levine, 1984), which have provided a good fit for several cognitive abilitytests (Drasgow et al., 1995). The polytomous MFS model can be consideredthe most general of the models studied because it does not requiredichotomizing item responses, its item response functions do not have aspecific parametric form, and, hence the item response functions may
O. Chernyshenko, S. Stark, K. Chan, F. Drasgow, and B. Williams
528 MULTIVARIATE BEHAVIORAL RESEARCH
assume a wide variety of shapes. It is particularly useful when parametricmodels do not fit the data and a researcher wants to discover the shape ofitem response functions (Levine, 1984).
Dichotomous Models
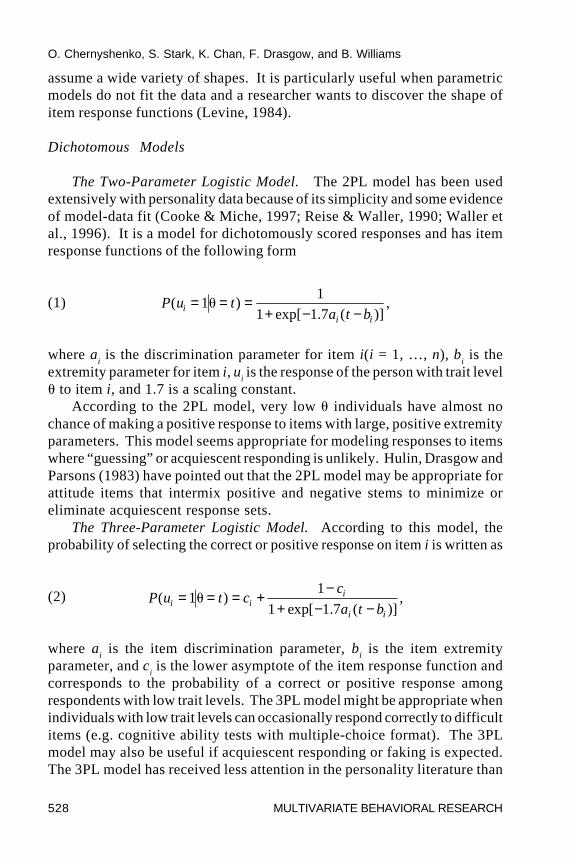
The Two-Parameter Logistic Model. The 2PL model has been usedextensively with personality data because of its simplicity and some evidenceof model-data fit (Cooke & Miche, 1997; Reise & Waller, 1990; Waller etal., 1996). It is a model for dichotomously scored responses and has itemresponse functions of the following form
(1) P u ta t bi
i i
( 1 )1
1 exp[ 1.7 ( )],= = =
+ − −�
where ai is the discrimination parameter for item i(i = 1, …, n), b
i is the
extremity parameter for item i, ui is the response of the person with trait level
� to item i, and 1.7 is a scaling constant.According to the 2PL model, very low � individuals have almost no
chance of making a positive response to items with large, positive extremityparameters. This model seems appropriate for modeling responses to itemswhere “guessing” or acquiescent responding is unlikely. Hulin, Drasgow andParsons (1983) have pointed out that the 2PL model may be appropriate forattitude items that intermix positive and negative stems to minimize oreliminate acquiescent response sets.
The Three-Parameter Logistic Model. According to this model, theprobability of selecting the correct or positive response on item i is written as
(2) P u t cc
a t bi ii
i i
( 1 )1
1 exp[ 1.7 ( )],= = = +
−+ − −
�
where ai is the item discrimination parameter, b
i is the item extremity
parameter, and ci is the lower asymptote of the item response function and
corresponds to the probability of a correct or positive response amongrespondents with low trait levels. The 3PL model might be appropriate whenindividuals with low trait levels can occasionally respond correctly to difficultitems (e.g. cognitive ability tests with multiple-choice format). The 3PLmodel may also be useful if acquiescent responding or faking is expected.The 3PL model has received less attention in the personality literature than
O. Chernyshenko, S. Stark, K. Chan, F. Drasgow, and B. Williams
MULTIVARIATE BEHAVIORAL RESEARCH 529
the 2PL model. The only example we could find was the Ellis et al. (1993)paper that used this model to evaluate the measurement equivalence ofEnglish and German versions of the Trier Personality Inventory.
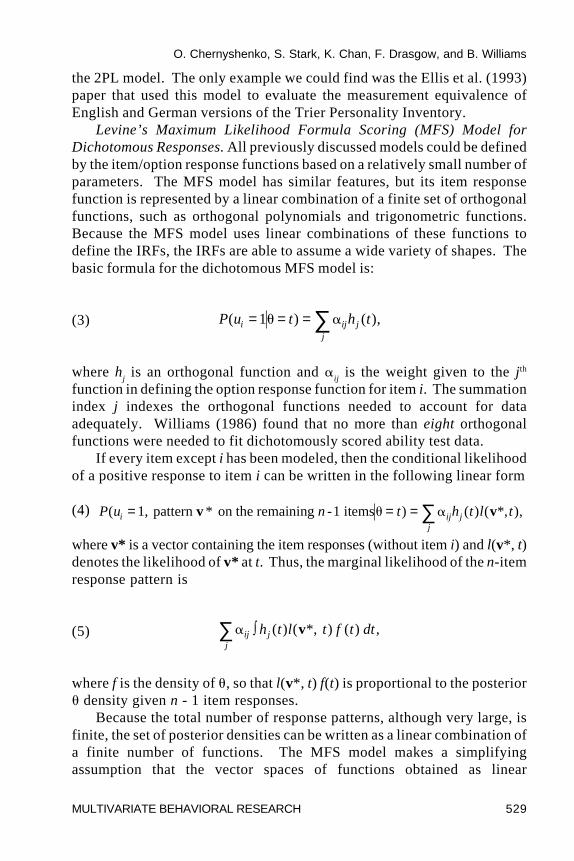
Levine’s Maximum Likelihood Formula Scoring (MFS) Model forDichotomous Responses. All previously discussed models could be definedby the item/option response functions based on a relatively small number ofparameters. The MFS model has similar features, but its item responsefunction is represented by a linear combination of a finite set of orthogonalfunctions, such as orthogonal polynomials and trigonometric functions.Because the MFS model uses linear combinations of these functions todefine the IRFs, the IRFs are able to assume a wide variety of shapes. Thebasic formula for the dichotomous MFS model is:
(3) P u t h ti ij jj
( 1 ) ( ),= = =∑� �
where hj is an orthogonal function and �
ij is the weight given to the jth
function in defining the option response function for item i. The summationindex j indexes the orthogonal functions needed to account for dataadequately. Williams (1986) found that no more than eight orthogonalfunctions were needed to fit dichotomously scored ability test data.
If every item except i has been modeled, then the conditional likelihoodof a positive response to item i can be written in the following linear form
(4) P u n t h t l ti ij jj
( 1, pattern on the remaining -1 items ) ( ) ( *, ),= = =∑v v* � �
where v* is a vector containing the item responses (without item i) and l(v*, t)denotes the likelihood of v* at t. Thus, the marginal likelihood of the n-itemresponse pattern is
(5) �ij jj
h t l t f t dtz∑ ( ) ( *, ) ( ) ,v
where f is the density of �, so that l(v*, t) f(t) is proportional to the posterior� density given n - 1 item responses.
Because the total number of response patterns, although very large, isfinite, the set of posterior densities can be written as a linear combination ofa finite number of functions. The MFS model makes a simplifyingassumption that the vector spaces of functions obtained as linear
O. Chernyshenko, S. Stark, K. Chan, F. Drasgow, and B. Williams
530 MULTIVARIATE BEHAVIORAL RESEARCH
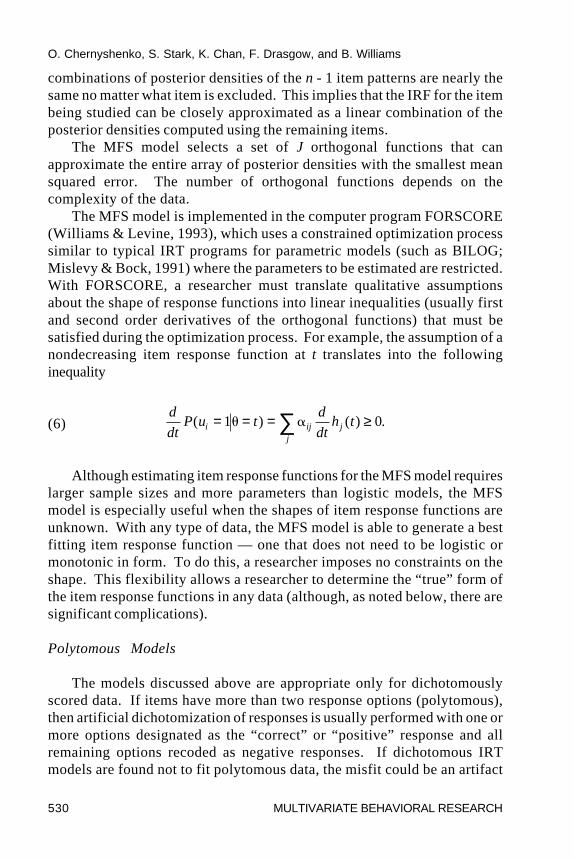
combinations of posterior densities of the n - 1 item patterns are nearly thesame no matter what item is excluded. This implies that the IRF for the itembeing studied can be closely approximated as a linear combination of theposterior densities computed using the remaining items.
The MFS model selects a set of J orthogonal functions that canapproximate the entire array of posterior densities with the smallest meansquared error. The number of orthogonal functions depends on thecomplexity of the data.
The MFS model is implemented in the computer program FORSCORE(Williams & Levine, 1993), which uses a constrained optimization processsimilar to typical IRT programs for parametric models (such as BILOG;Mislevy & Bock, 1991) where the parameters to be estimated are restricted.With FORSCORE, a researcher must translate qualitative assumptionsabout the shape of response functions into linear inequalities (usually firstand second order derivatives of the orthogonal functions) that must besatisfied during the optimization process. For example, the assumption of anondecreasing item response function at t translates into the followinginequality
(6)d
dtP u t
d
dth ti ij j
j
( 1 ) ( ) 0.= = = ≥∑� �
Although estimating item response functions for the MFS model requireslarger sample sizes and more parameters than logistic models, the MFSmodel is especially useful when the shapes of item response functions areunknown. With any type of data, the MFS model is able to generate a bestfitting item response function — one that does not need to be logistic ormonotonic in form. To do this, a researcher imposes no constraints on theshape. This flexibility allows a researcher to determine the “true” form ofthe item response functions in any data (although, as noted below, there aresignificant complications).
Polytomous Models
The models discussed above are appropriate only for dichotomouslyscored data. If items have more than two response options (polytomous),then artificial dichotomization of responses is usually performed with one ormore options designated as the “correct” or “positive” response and allremaining options recoded as negative responses. If dichotomous IRTmodels are found not to fit polytomous data, the misfit could be an artifact
O. Chernyshenko, S. Stark, K. Chan, F. Drasgow, and B. Williams
MULTIVARIATE BEHAVIORAL RESEARCH 531
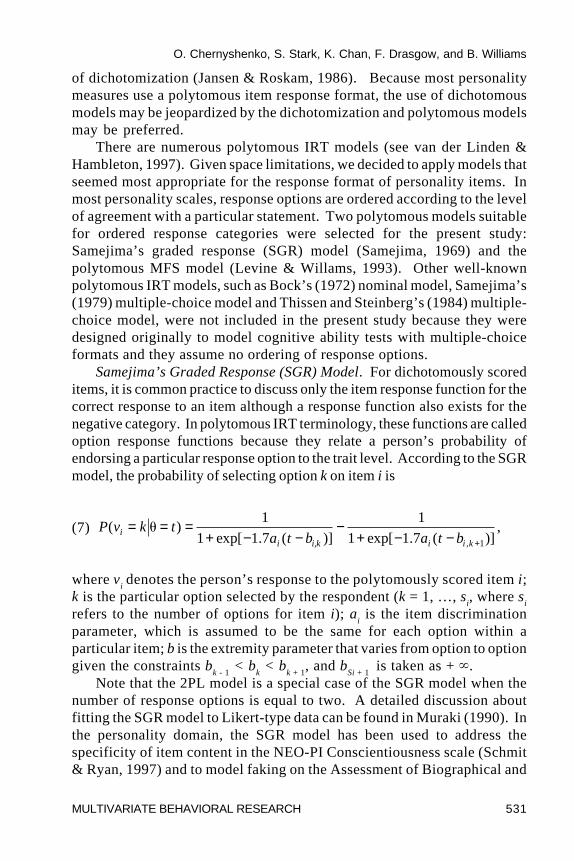
of dichotomization (Jansen & Roskam, 1986). Because most personalitymeasures use a polytomous item response format, the use of dichotomousmodels may be jeopardized by the dichotomization and polytomous modelsmay be preferred.
There are numerous polytomous IRT models (see van der Linden &Hambleton, 1997). Given space limitations, we decided to apply models thatseemed most appropriate for the response format of personality items. Inmost personality scales, response options are ordered according to the levelof agreement with a particular statement. Two polytomous models suitablefor ordered response categories were selected for the present study:Samejima’s graded response (SGR) model (Samejima, 1969) and thepolytomous MFS model (Levine & Willams, 1993). Other well-knownpolytomous IRT models, such as Bock’s (1972) nominal model, Samejima’s(1979) multiple-choice model and Thissen and Steinberg’s (1984) multiple-choice model, were not included in the present study because they weredesigned originally to model cognitive ability tests with multiple-choiceformats and they assume no ordering of response options.
Samejima’s Graded Response (SGR) Model. For dichotomously scoreditems, it is common practice to discuss only the item response function for thecorrect response to an item although a response function also exists for thenegative category. In polytomous IRT terminology, these functions are calledoption response functions because they relate a person’s probability ofendorsing a particular response option to the trait level. According to the SGRmodel, the probability of selecting option k on item i is
(7) P v k ta t b a t bi
i i,k i i k
( )1
1 exp[ 1.7 ( )]
1
1 exp[ 1.7 ( )],
, 1
= = =+ − −
−+ − − +
�
where vi denotes the person’s response to the polytomously scored item i;
k is the particular option selected by the respondent (k = 1, …, si, where s
i
refers to the number of options for item i); ai is the item discrimination
parameter, which is assumed to be the same for each option within aparticular item; b is the extremity parameter that varies from option to optiongiven the constraints b
k - 1 < b
k < b
k + 1, and b
Si + 1
is taken as + �.
Note that the 2PL model is a special case of the SGR model when thenumber of response options is equal to two. A detailed discussion aboutfitting the SGR model to Likert-type data can be found in Muraki (1990). Inthe personality domain, the SGR model has been used to address thespecificity of item content in the NEO-PI Conscientiousness scale (Schmit& Ryan, 1997) and to model faking on the Assessment of Biographical and
O. Chernyshenko, S. Stark, K. Chan, F. Drasgow, and B. Williams
532 MULTIVARIATE BEHAVIORAL RESEARCH
Life Events (ABLE; Peterson, Hough, Dunnette, Rosse, Toquam, & Wing,1990) personality inventory. Zickar and Drasgow (1996) presented someevidence that the SGR model did not fit the ABLE data well, but did notexplore that issue in detail.
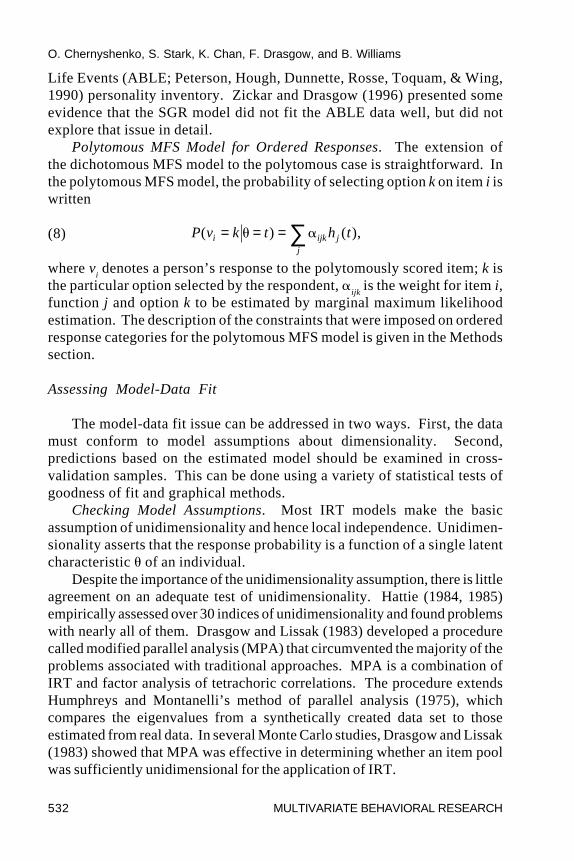
Polytomous MFS Model for Ordered Responses. The extension ofthe dichotomous MFS model to the polytomous case is straightforward. Inthe polytomous MFS model, the probability of selecting option k on item i iswritten
(8) P v k t h ti ijk jj
( ) ( ),= = =∑� �
where vi denotes a person’s response to the polytomously scored item; k is
the particular option selected by the respondent, �ijk
is the weight for item i,function j and option k to be estimated by marginal maximum likelihoodestimation. The description of the constraints that were imposed on orderedresponse categories for the polytomous MFS model is given in the Methodssection.
Assessing Model-Data Fit
The model-data fit issue can be addressed in two ways. First, the datamust conform to model assumptions about dimensionality. Second,predictions based on the estimated model should be examined in cross-validation samples. This can be done using a variety of statistical tests ofgoodness of fit and graphical methods.
Checking Model Assumptions. Most IRT models make the basicassumption of unidimensionality and hence local independence. Unidimen-sionality asserts that the response probability is a function of a single latentcharacteristic � of an individual.
Despite the importance of the unidimensionality assumption, there is littleagreement on an adequate test of unidimensionality. Hattie (1984, 1985)empirically assessed over 30 indices of unidimensionality and found problemswith nearly all of them. Drasgow and Lissak (1983) developed a procedurecalled modified parallel analysis (MPA) that circumvented the majority of theproblems associated with traditional approaches. MPA is a combination ofIRT and factor analysis of tetrachoric correlations. The procedure extendsHumphreys and Montanelli’s method of parallel analysis (1975), whichcompares the eigenvalues from a synthetically created data set to thoseestimated from real data. In several Monte Carlo studies, Drasgow and Lissak(1983) showed that MPA was effective in determining whether an item poolwas sufficiently unidimensional for the application of IRT.
O. Chernyshenko, S. Stark, K. Chan, F. Drasgow, and B. Williams
MULTIVARIATE BEHAVIORAL RESEARCH 533
Another frequently used method for assessing unidimensionality isStout’s nonparametric DIMTEST (Stout, 1987). It is a conditionalcovariance based hypothesis testing procedure that assesses whether twosubtests are dimensionally distinct. Unfortunately, the utility of theDIMTEST procedure for personality measurement is limited due to the shortlength of personality scales. Simulation studies (personal communicationwith William Stout) indicated that at least 20 items are needed to obtainaccurate results for the DIMTEST procedure, however, the majority ofpersonality scales rarely exceed 15 items.
The confirmatory factor analysis (CFA) approach that tests a one-factormodel is also appropriate for assessing scale unidimensionality. It is easierto implement than MPA and has many well-established goodness of fitindices. On the other hand, we are unaware of any simulation studies thatused fit statistics from CFA to determine whether an item pool wassufficiently unidimensional for IRT analyses. Hence it is difficult to judge theappropriateness of using a unidimensional IRT model based on CFAgoodness of fit indices.
In this article, we chose to use MPA and CFA approaches to assess theunidimensionality of personality scales. Stout’s DIMTEST procedure wasnot utilized because the longest scale we examined had only 14 items.
Checking Model-Data Fit. Drasgow et al. (1995) advocated acombination of complementary graphical and statistical methods to evaluatethe adequacy of model predictions. In our study, both graphical fit plots andchi-square goodness of fit tests for single items, pairs, and triples were usedto investigate the fit of IRT models to personality data.
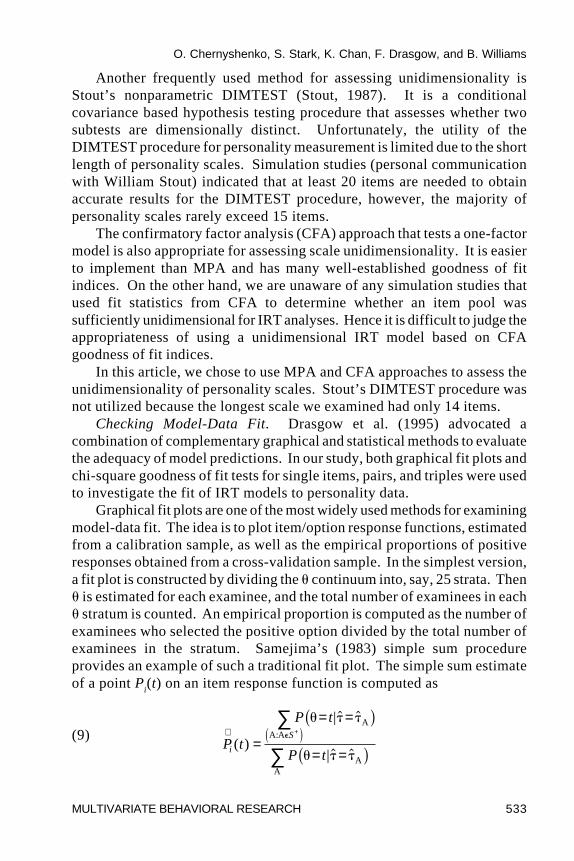
Graphical fit plots are one of the most widely used methods for examiningmodel-data fit. The idea is to plot item/option response functions, estimatedfrom a calibration sample, as well as the empirical proportions of positiveresponses obtained from a cross-validation sample. In the simplest version,a fit plot is constructed by dividing the � continuum into, say, 25 strata. Then� is estimated for each examinee, and the total number of examinees in each� stratum is counted. An empirical proportion is computed as the number ofexaminees who selected the positive option divided by the total number ofexaminees in the stratum. Samejima’s (1983) simple sum procedureprovides an example of such a traditional fit plot. The simple sum estimateof a point P
i(t) on an item response function is computed as
(9)P t
P t
P ti
S∧=
= =
= =
+∑
∑( )
|
|
AA:A
AA
� � �
� � �
�
$ $
$ $
b g
b ge j
O. Chernyshenko, S. Stark, K. Chan, F. Drasgow, and B. Williams
534 MULTIVARIATE BEHAVIORAL RESEARCH
where the summation in the denominator is over all examinees in the sample,the summation in the numerator is over only the examinees who correctlyanswered the item i, $� is a � estimator computed from responses to all itemsexcept the target item, and $�A is the value of $� computed from examineeA’s data.
The problem with this straightforward approach is that the � estimate( $� ) for the individual is hardly ever equal to the true � due to estimation error.Error in $� can change the fit plot such that even with a very large sampleand perfectly estimated response functions, the sample fit plot may differsubstantially and systematically from the true response function. Thisproblem is especially pronounced for short tests where � estimates havelarger error.
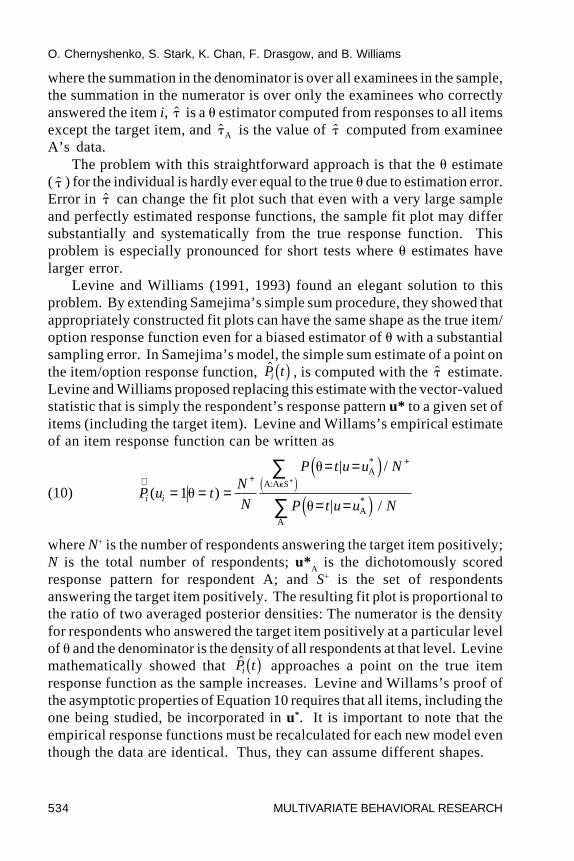
Levine and Williams (1991, 1993) found an elegant solution to thisproblem. By extending Samejima’s simple sum procedure, they showed thatappropriately constructed fit plots can have the same shape as the true item/option response function even for a biased estimator of � with a substantialsampling error. In Samejima’s model, the simple sum estimate of a point onthe item/option response function, $P ti b g , is computed with the $� estimate.Levine and Williams proposed replacing this estimate with the vector-valuedstatistic that is simply the respondent’s response pattern u* to a given set ofitems (including the target item). Levine and Willams’s empirical estimateof an item response function can be written as
(10) P u tN
N
P t u u N
P t u u Ni i
S∧ +
+
= = =
= =
= =
+∑
∑( 1 )
/
/
AA:A
AA
�
�
�
�
|
|
*
*
d i
d ie j
where N+ is the number of respondents answering the target item positively;N is the total number of respondents; u*
A is the dichotomously scored
response pattern for respondent A; and S+ is the set of respondentsanswering the target item positively. The resulting fit plot is proportional tothe ratio of two averaged posterior densities: The numerator is the densityfor respondents who answered the target item positively at a particular levelof � and the denominator is the density of all respondents at that level. Levinemathematically showed that $P ti b g approaches a point on the true itemresponse function as the sample increases. Levine and Willams’s proof ofthe asymptotic properties of Equation 10 requires that all items, including theone being studied, be incorporated in u*. It is important to note that theempirical response functions must be recalculated for each new model eventhough the data are identical. Thus, they can assume different shapes.
O. Chernyshenko, S. Stark, K. Chan, F. Drasgow, and B. Williams
MULTIVARIATE BEHAVIORAL RESEARCH 535
Statistical tests of goodness of fit (i.e., �2 fit statistics) are probably themost widely used in model-data fit assessment. Unfortunately, they are oftenviewed as inconclusive evidence of adequate model-data fit because of theirsensitivity to sample size and their insensitivity to certain forms of model-datamisfit. As with the fit plots, we used an improved method of computing thisstatistic: The adjusted chi-square to degrees of freedom ratio.
The ordinary �2 for item i is computed from the expected and observedfrequencies,
(11) �ii i
ik
s O k E k
E k2
2
1
,=−
=∑ b g b g
b g
where s is the number of keyed options, Oi(k) is the observed frequency of
endorsing option k, and Ei(k) is the expected frequency of option k under the
specific IRT model. The expected frequency of respondents selecting eachoption is computed using
(12) E k N P v k t f t dt,i ib g c h b g= = =z �
where f(•) is the � density, usually taken to be the standard normal becauseitem/option response functions are scaled in reference to this distribution. Inour study, the above integral was evaluated by numerical quadrature using 61grid points on the interval (-3, +3). To bypass the sensitivity to sample size andto allow comparisons between different samples and tests, the �2 was firstadjusted to the magnitude that would be expected in a sample of 3,000. Then,the ratio of chi-square to the degrees of freedom was computed. A ratio ofmore than 3.0 for any given item was viewed as indicative of model-data misfit.
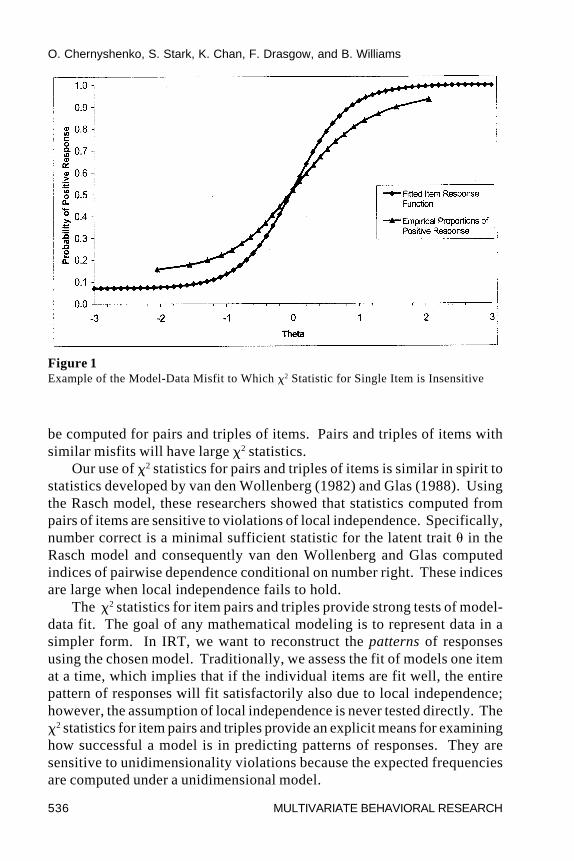
Van der Wollenberg (1982) showed that �2 statistics for single items arein many instances insensitive to unidimensionality violations; instead, for theRasch model, �2 statistics for item singles are mainly sensitive to whether theitems vary in discrimination. In addition, the �2 statistic for a single item, asimplemented here, is insensitive to certain types of misfit. Figure 1 showsan example of this problem where the empirical IRF consistently lies abovethe estimated IRF at low trait levels and below it at high trait levels. Althoughit is visually clear that the data do not fit the IRT model, the �2 for an individualitem will be close to zero, because it is a marginal statistic and the estimatedIRF is integrated with a normal theta density; consequently, many differentintegrands can integrate to the same constant (i.e., the observed marginalnumber endorsing the item). To avoid these problems, the �2 statistic should
O. Chernyshenko, S. Stark, K. Chan, F. Drasgow, and B. Williams
536 MULTIVARIATE BEHAVIORAL RESEARCH
be computed for pairs and triples of items. Pairs and triples of items withsimilar misfits will have large �2 statistics.
Our use of �2 statistics for pairs and triples of items is similar in spirit tostatistics developed by van den Wollenberg (1982) and Glas (1988). Usingthe Rasch model, these researchers showed that statistics computed frompairs of items are sensitive to violations of local independence. Specifically,number correct is a minimal sufficient statistic for the latent trait � in theRasch model and consequently van den Wollenberg and Glas computedindices of pairwise dependence conditional on number right. These indicesare large when local independence fails to hold.
The �2 statistics for item pairs and triples provide strong tests of model-data fit. The goal of any mathematical modeling is to represent data in asimpler form. In IRT, we want to reconstruct the patterns of responsesusing the chosen model. Traditionally, we assess the fit of models one itemat a time, which implies that if the individual items are fit well, the entirepattern of responses will fit satisfactorily also due to local independence;however, the assumption of local independence is never tested directly. The�2 statistics for item pairs and triples provide an explicit means for examininghow successful a model is in predicting patterns of responses. They aresensitive to unidimensionality violations because the expected frequenciesare computed under a unidimensional model.
Figure 1Example of the Model-Data Misfit to Which �2 Statistic for Single Item is Insensitive
O. Chernyshenko, S. Stark, K. Chan, F. Drasgow, and B. Williams
MULTIVARIATE BEHAVIORAL RESEARCH 537
The expected frequency for a pair of items in the (k, k�)th cell of the two-way table for items i and i� is computed as follows:
(13) E k k N P v k t P v k t f t dti,i i i′ ′′ = = = = ′ =z, ,b g c h c h b g� �
and, the observed frequencies are counted in each cell. Some cells arecombined so that the expected frequencies exceed 5. The usual �2 for a two-way table is then calculated. A similar procedure is carried out with itemtriples. Algebraically, if model-data misfit occurs for an item pair or tripleat the same trait level, the �2 will increase even for the kinds of misfitpresented in Figure 1.
Previous research with cognitive ability data found the adjusted chi-squareto degrees of freedom ratio statistic for item singles, pairs and triples to be veryuseful for comparing several competing IRT models (Drasgow et al., 1995). Thebest fitting models had small (below 3) adjusted chi square to degrees of freedomratios for item singles as well as small ratios for pairs and triples.
In sum, if the ratio of chi-square to the degrees of freedom exceeds 3.0for item singles, pairs, or triples, one can infer that the parametric form of theitem/option response function is violated or that the data aremultidimensional. Both of these outcomes indicate that the chosen IRTmodel does not fit the data.
Method
Data
The five models described previously were fitted to data from twopersonality inventories. These included the Fifth Edition of the SixteenPersonality Factor Questionnaire (16PF, Conn & Rieke, 1994) andGoldberg’s 50-item measure of the Big Five Factor markers (Goldberg, 1997,1998). Both the 16PF and Goldberg’s Big Five are among the most widelyused personality inventories in research and practice today.
16PF. The first data set consisted of 13,059 individuals responding to theUS-English version of the Fifth Edition of the 16PF. The data were testprotocols sent to the Institute for Personality and Ability Testing (IPAT) byits customers for the purpose of creating computer-generated interpretivereports in 1995 and 1996 for the purposes of research, counseling/development, and selection. 170 items from 16 noncognitive scales wereanalyzed. The 16 scales were Warmth (11 items), Emotional Stability (10items), Dominance (10 items), Liveliness (10 items), Rule-Consciousness(11 items), Social Boldness (10 items), Sensitivity (11 items), Vigilance (10
O. Chernyshenko, S. Stark, K. Chan, F. Drasgow, and B. Williams
538 MULTIVARIATE BEHAVIORAL RESEARCH
items), Abstractedness (11 items), Privateness (10 items), Apprehension (10items), Openness to Change (14 items), Self-Reliance (10 items),Perfectionism (10 items), Tension (10 items), and Impression Management(12 items).
The raw polytomous data (three response options) were prepared foranalysis by reverse scoring items that were negatively worded and, whenappropriate, dichotomizing. The responses were scored so that the “high”option (“c”) indicated high standing on the trait continuum. For thedichotomous models, the middle option (“b”) was coded as “high” andassigned a score of one. Past research (and our experience as well)indicated that combining the middle response option with either the “low” orthe “high” response options has little effect on the resulting item parameters.
The IRT calibration sample consisted of 6,530 respondents. This samplewas formed by taking every second respondent from the total data set,beginning with the first respondent. Thus, only respondents with odd countnumbers from the original data set were used for IRT calibration of the items.The remaining 6,529 cases formed the “empirical sample” that was used tocross-validate the estimated IRT models. Table 1 presents the summarystatistics for the 16PF scales.
The Big Five Personality Factor Scales. The second data setconsisted of 1,594 Singapore military recruits and 274 Junior Collegestudents (total: 1,768) who had responded to Goldberg’s (1997, 1998) publicdomain, 50-item measure of the Big Five personality factor markers. Thedata were collected as part of a dissertation research effort by Chan (1999),in which several self-report measures were administered in English, theofficial language of Singapore. The age of the respondents ranged from 17to 24. All had at least a high school education conducted primarily in Englishin Singapore. The military sample was entirely male, whereas 60% of thestudent sample was female. Although the soldiers were asked to indicatetheir identification numbers due to the longitudinal nature of Chan’sresearch, there was no reason to suspect that they may have faked theirresponses because they were not job applicants — military service iscompulsory in Singapore. The students answered the questionnaireanonymously.
The measure consisted of five 10-item subscales measuringExtraversion, Agreeableness, Conscientiousness, Emotional Stability, andIntellectance or Openness to Experience. Respondents were asked howwell each of the 50-items described them on a five-point scale as follows: (1)Very inaccurate, (2) Moderately inaccurate, (3) Neither inaccurate noraccurate, (4) Moderately accurate, (5) Very accurate. Table 1 presents thesummary statistics for the Big Five scales, and the valid cases used for the
O. Chernyshenko, S. Stark, K. Chan, F. Drasgow, and B. Williams
MULTIVARIATE BEHAVIORAL RESEARCH 539
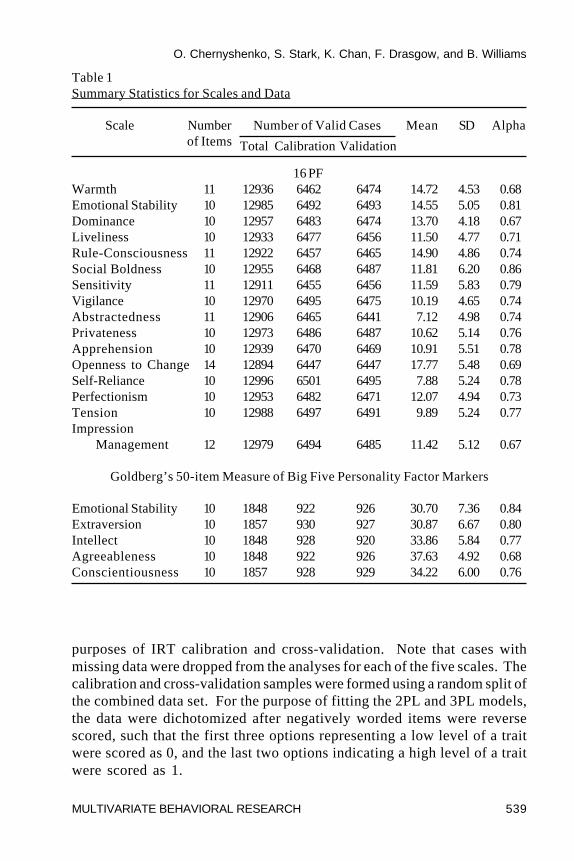
purposes of IRT calibration and cross-validation. Note that cases withmissing data were dropped from the analyses for each of the five scales. Thecalibration and cross-validation samples were formed using a random split ofthe combined data set. For the purpose of fitting the 2PL and 3PL models,the data were dichotomized after negatively worded items were reversescored, such that the first three options representing a low level of a traitwere scored as 0, and the last two options indicating a high level of a traitwere scored as 1.
Table 1Summary Statistics for Scales and Data
Scale Number Number of Valid Cases Mean SD Alphaof Items Total Calibration Validation
16 PFWarmth 11 12936 6462 6474 14.72 4.53 0.68Emotional Stability 10 12985 6492 6493 14.55 5.05 0.81Dominance 10 12957 6483 6474 13.70 4.18 0.67Liveliness 10 12933 6477 6456 11.50 4.77 0.71Rule-Consciousness 11 12922 6457 6465 14.90 4.86 0.74Social Boldness 10 12955 6468 6487 11.81 6.20 0.86Sensitivity 11 12911 6455 6456 11.59 5.83 0.79Vigilance 10 12970 6495 6475 10.19 4.65 0.74Abstractedness 11 12906 6465 6441 7.12 4.98 0.74Privateness 10 12973 6486 6487 10.62 5.14 0.76Apprehension 10 12939 6470 6469 10.91 5.51 0.78Openness to Change 14 12894 6447 6447 17.77 5.48 0.69Self-Reliance 10 12996 6501 6495 7.88 5.24 0.78Perfectionism 10 12953 6482 6471 12.07 4.94 0.73Tension 10 12988 6497 6491 9.89 5.24 0.77Impression
Management 12 12979 6494 6485 11.42 5.12 0.67
Goldberg’s 50-item Measure of Big Five Personality Factor Markers
Emotional Stability 10 1848 922 926 30.70 7.36 0.84Extraversion 10 1857 930 927 30.87 6.67 0.80Intellect 10 1848 928 920 33.86 5.84 0.77Agreeableness 10 1848 922 926 37.63 4.92 0.68Conscientiousness 10 1857 928 929 34.22 6.00 0.76
O. Chernyshenko, S. Stark, K. Chan, F. Drasgow, and B. Williams
540 MULTIVARIATE BEHAVIORAL RESEARCH
Analyses
Modified Parallel Analysis (MPA) of Scale Unidimensionality. Totest the assumption of scale unidimensionality, MPA was performed for eachscale (Drasgow & Lissak, 1983). First, inter-item tetrachoric correlationswere computed using PRELIS (Jöreskog & Sörbom, 1989). A principal axisfactoring (PAF) was then conducted to extract the common factors. Screeplots of eigenvalues were then constructed (Hambleton, Swaminathan, &Rogers, 1991).
Next, BILOG (Mislevy & Bock, 1991) was used to estimate itemparameters for the 3PL model for each of the 16PF and Big Five scales.These item parameters were used to create synthetic data sets that weretruly unidimensional and contained the same number of simulatedexaminees as our original samples. As before, inter-item tetrachoriccorrelations for the simulated data of each scale were computed andfactor analyzed using PAF to obtain the eigenvalues. The eigenvaluesfrom the synthetic data sets were superimposed on the scree plots of thereal data for each scale, and the differences in second eigenvalues wereexamined.
Assessing Unidimensionality with Confirmatory Factor Analysis(CFA). The LISREL-8 program (Jöreskog & Sörbom, 1993) was used to fita one factor model to the polychoric correlation matrix for the items fromeach personality scale. Each factor loading in the factor loading matrix (�)was set to be a free parameter. The factor variance was fixed at 1.0 andmaximum likelihood parameter estimation was used.
IRT Calibration of Items. The parameters of the 2PL and 3PL modelswere estimated using BILOG (Mislevy & Bock, 1991). Thissen’s (1991)MULTILOG program was used for the SGR model. Williams and Levine’s(1993) FORSCORE program was used for both MFS models. Allprograms utilized marginal maximum likelihood estimation to obtainparameters. Both data sets were analyzed using the same convergencecriteria for all models. With all parametric models, the lower asymptoteparameter was constrained to be between 0 and 1, the item discriminationparameter was constrained to be positive, and the item extremityparameter was constrained to lie between –3 and + 3 to avoid implausiblevalues.
With the MFS models, several qualitative assumptions about the shapesof item response functions were imposed to constrain optimization.FORSCORE can accommodate a variety of constraints includingmonotonicity, concavity and smoothness; they can be assumed globally orjust over an interval, for some or all items. In the present article, only
O. Chernyshenko, S. Stark, K. Chan, F. Drasgow, and B. Williams
MULTIVARIATE BEHAVIORAL RESEARCH 541
smoothness constraints were imposed for the dichotomous MFS model. Inthe case of the polytomous MFS analysis of the 16PF data, we placedinverted-U constraints on the middle option and monotonicity constraints onother options. The polytomous MFS model was not used for the Big Fiveitems because the sample size was inadequate for estimated increasednumber of parameters.
Model-Data Fit. After calibrating a test, the fit of each model wasevaluated using a cross-validation sample. Fit plots for each item wereconstructed using Williams’s (1999) EMPOCC program. As explainedpreviously, rather than assigning each examinee to a cell and incrementingthe examinee count in that cell, as in the usual fit plot histogram, theexaminees’ posterior densities were used to distribute the counts over the �continuum represented by the 25 � strata. Chi-square statistics werecomputed for single items and all possible pairs and triples of items withineach personality scale and then adjusted to a sample size of 3,000. The ratiosof �2 statistics to their degrees of freedom were then computed. Tosummarize the large number of adjusted ratios, we sorted them into sixintervals: very small (<1), small (�1 and <2), medium (�2 and <3),moderately large (�3 and <4), large (�4 and <5), and very large (�5).Means and standard deviations of adjusted �2/df ratios were also computedfor each scale.
Results
16PF
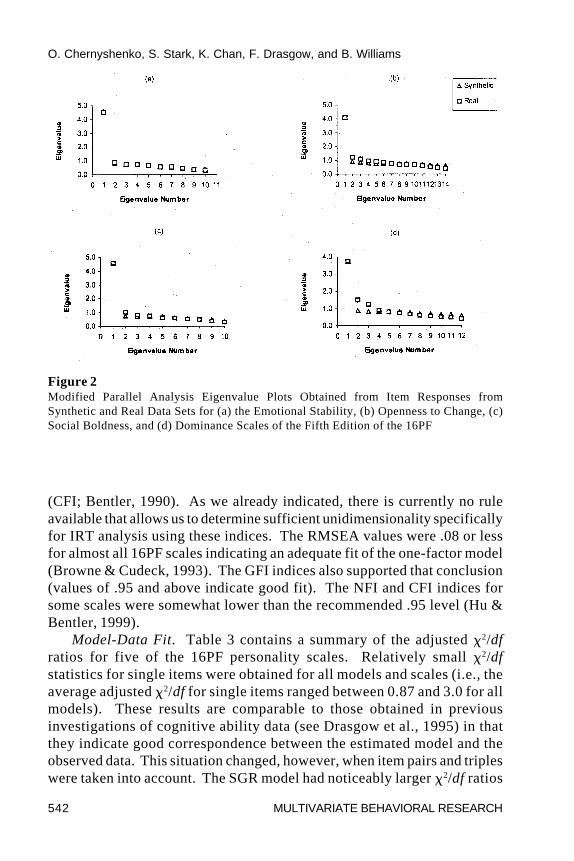
Unidimensionality. Figure 2 presents four typical eigenvalue plotsobtained by modified parallel analyses of the 16PF scales (space limitationsprohibit an extended presentation of the results for each scale). Asrecommended by Drasgow and Lissak (1983), a visual comparison of thesecond eigenvalues was performed. None of the plots exceeded therecommended criteria for data with little or no guessing (These criteria arepresented graphically in Drasgow and Lissak.). Therefore, based on theMPA method for dimensionality assessment, we were satisfied that thenoncognitive scales of the 16PF were sufficiently unidimensional for IRTanalysis.
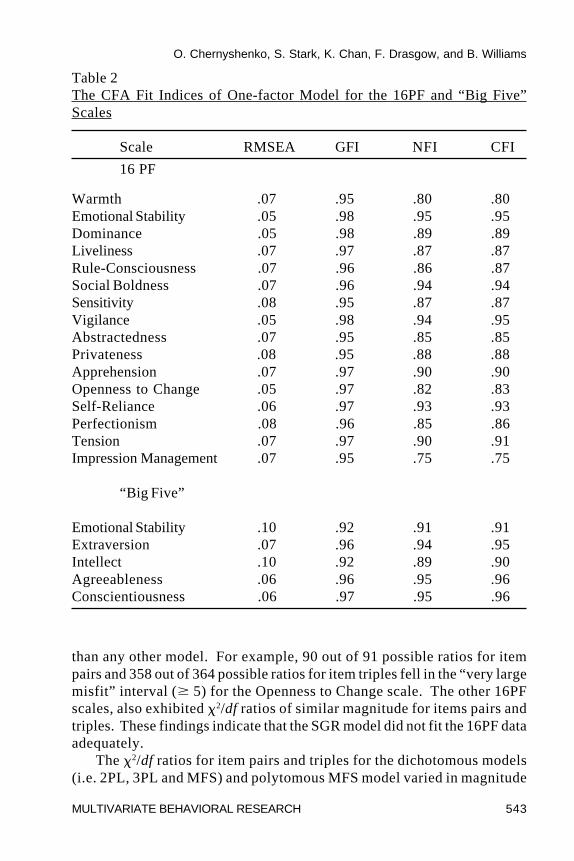
The values of four commonly utilized goodness of fit indices that indicatehow well a one- factor model fit each personality scale are reported in Table2. These include the Root Mean Square Error of Approximation (RMSEA;Steiger & Lind, 1980), Goodness of Fit Index (GFI; Tanaka & Huba, 1984),Normed Fit Index (NFI; Bentler & Bonett, 1980) and Comparative Fit Index
O. Chernyshenko, S. Stark, K. Chan, F. Drasgow, and B. Williams
542 MULTIVARIATE BEHAVIORAL RESEARCH
(CFI; Bentler, 1990). As we already indicated, there is currently no ruleavailable that allows us to determine sufficient unidimensionality specificallyfor IRT analysis using these indices. The RMSEA values were .08 or lessfor almost all 16PF scales indicating an adequate fit of the one-factor model(Browne & Cudeck, 1993). The GFI indices also supported that conclusion(values of .95 and above indicate good fit). The NFI and CFI indices forsome scales were somewhat lower than the recommended .95 level (Hu &Bentler, 1999).
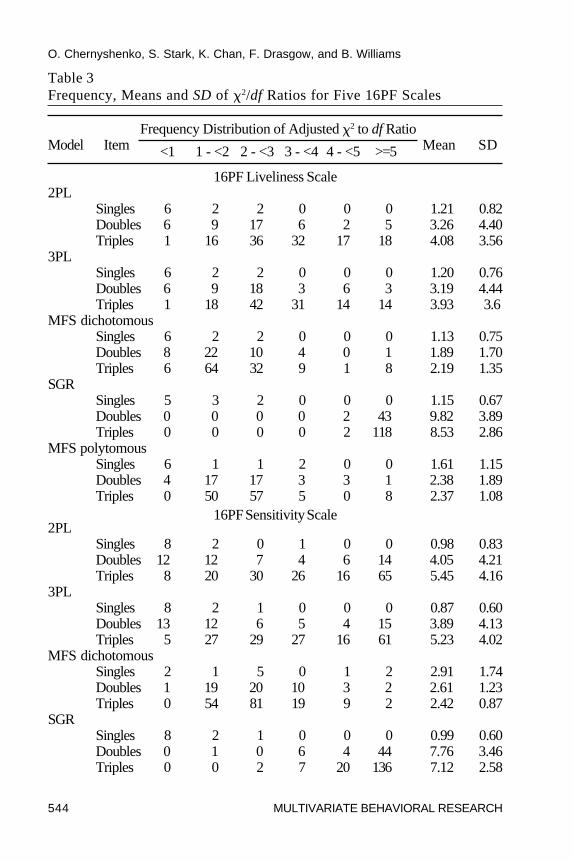
Model-Data Fit. Table 3 contains a summary of the adjusted �2/dfratios for five of the 16PF personality scales. Relatively small �2/dfstatistics for single items were obtained for all models and scales (i.e., theaverage adjusted �2/df for single items ranged between 0.87 and 3.0 for allmodels). These results are comparable to those obtained in previousinvestigations of cognitive ability data (see Drasgow et al., 1995) in thatthey indicate good correspondence between the estimated model and theobserved data. This situation changed, however, when item pairs and tripleswere taken into account. The SGR model had noticeably larger �2/df ratios
Figure 2Modified Parallel Analysis Eigenvalue Plots Obtained from Item Responses fromSynthetic and Real Data Sets for (a) the Emotional Stability, (b) Openness to Change, (c)Social Boldness, and (d) Dominance Scales of the Fifth Edition of the 16PF
O. Chernyshenko, S. Stark, K. Chan, F. Drasgow, and B. Williams
MULTIVARIATE BEHAVIORAL RESEARCH 543
than any other model. For example, 90 out of 91 possible ratios for itempairs and 358 out of 364 possible ratios for item triples fell in the “very largemisfit” interval (� 5) for the Openness to Change scale. The other 16PFscales, also exhibited �2/df ratios of similar magnitude for items pairs andtriples. These findings indicate that the SGR model did not fit the 16PF dataadequately.
The �2/df ratios for item pairs and triples for the dichotomous models(i.e. 2PL, 3PL and MFS) and polytomous MFS model varied in magnitude
Table 2The CFA Fit Indices of One-factor Model for the 16PF and “Big Five”Scales
Scale RMSEA GFI NFI CFI
16 PF
Warmth .07 .95 .80 .80Emotional Stability .05 .98 .95 .95Dominance .05 .98 .89 .89Liveliness .07 .97 .87 .87Rule-Consciousness .07 .96 .86 .87Social Boldness .07 .96 .94 .94Sensitivity .08 .95 .87 .87Vigilance .05 .98 .94 .95Abstractedness .07 .95 .85 .85Privateness .08 .95 .88 .88Apprehension .07 .97 .90 .90Openness to Change .05 .97 .82 .83Self-Reliance .06 .97 .93 .93Perfectionism .08 .96 .85 .86Tension .07 .97 .90 .91Impression Management .07 .95 .75 .75
“Big Five”
Emotional Stability .10 .92 .91 .91Extraversion .07 .96 .94 .95Intellect .10 .92 .89 .90Agreeableness .06 .96 .95 .96Conscientiousness .06 .97 .95 .96
O. Chernyshenko, S. Stark, K. Chan, F. Drasgow, and B. Williams
544 MULTIVARIATE BEHAVIORAL RESEARCH
Table 3Frequency, Means and SD of �2/df Ratios for Five 16PF Scales
Frequency Distribution of Adjusted �2 to df RatioModel Item <1 1 - <2 2 - <3 3 - <4 4 - <5 >=5 Mean SD
16PF Liveliness Scale2PL
Singles 6 2 2 0 0 0 1.21 0.82Doubles 6 9 17 6 2 5 3.26 4.40Triples 1 16 36 32 17 18 4.08 3.56
3PLSingles 6 2 2 0 0 0 1.20 0.76Doubles 6 9 18 3 6 3 3.19 4.44Triples 1 18 42 31 14 14 3.93 3.6
MFS dichotomousSingles 6 2 2 0 0 0 1.13 0.75Doubles 8 22 10 4 0 1 1.89 1.70Triples 6 64 32 9 1 8 2.19 1.35
SGRSingles 5 3 2 0 0 0 1.15 0.67Doubles 0 0 0 0 2 43 9.82 3.89Triples 0 0 0 0 2 118 8.53 2.86
MFS polytomousSingles 6 1 1 2 0 0 1.61 1.15Doubles 4 17 17 3 3 1 2.38 1.89Triples 0 50 57 5 0 8 2.37 1.08
16PF Sensitivity Scale2PL
Singles 8 2 0 1 0 0 0.98 0.83Doubles 12 12 7 4 6 14 4.05 4.21Triples 8 20 30 26 16 65 5.45 4.16
3PLSingles 8 2 1 0 0 0 0.87 0.60Doubles 13 12 6 5 4 15 3.89 4.13Triples 5 27 29 27 16 61 5.23 4.02
MFS dichotomousSingles 2 1 5 0 1 2 2.91 1.74Doubles 1 19 20 10 3 2 2.61 1.23Triples 0 54 81 19 9 2 2.42 0.87
SGRSingles 8 2 1 0 0 0 0.99 0.60Doubles 0 1 0 6 4 44 7.76 3.46Triples 0 0 2 7 20 136 7.12 2.58
O. Chernyshenko, S. Stark, K. Chan, F. Drasgow, and B. Williams
MULTIVARIATE BEHAVIORAL RESEARCH 545
Frequency Distribution of Adjusted �2 to df RatioModel Item <1 1 - <2 2 - <3 3 - <4 4 - <5 >=5 Mean SD
MFS polytomousSingles 4 4 2 0 1 0 1.55 1.09Doubles 3 22 12 5 8 5 2.68 1.39Triples 0 52 66 34 11 2 2.58 0.93
16PF Openness to Change Scale2PL
Singles 7 3 2 1 0 1 1.72 1.31Doubles 7 39 23 7 4 11 2.59 1.81Triples 0 139 91 59 43 32 2.83 1.36
3PLSingles 7 3 2 1 0 1 1.66 1.29Doubles 10 43 17 8 3 10 2.56 1.94Triples 5 134 101 47 47 30 2.79 1.41
MFS dichotomousSingles 7 3 1 2 1 0 1.64 1.21Doubles 16 42 19 5 2 7 2.10 1.51Triples 20 186 84 42 25 7 2.17 1.09
SGRSingles 4 6 3 0 0 1 1.69 1.31Doubles 0 0 0 0 1 90 9.67 2.71Triples 0 0 0 0 6 358 8.32 2.41
MFS polytomousSingles 6 5 2 0 0 1 1.49 1.16Doubles 1 35 37 11 4 3 2.40 0.98Triples 0 138 195 30 1 0 2.23 0.52
16PF Tension Scale2PL
Singles 5 3 0 0 0 2 2.08 2.42Doubles 8 9 12 6 4 6 3.04 2.92Triples 1 33 39 21 7 19 3.41 2.22
3PLSingles 7 1 0 0 0 2 1.97 2.34Doubles 12 9 10 7 2 5 2.84 2.75Triples 0 32 37 26 6 19 3.37 2.03
MFS dichotomousSingles 2 4 1 0 1 2 3.00 2.85Doubles 5 16 9 6 6 3 2.72 2.09Triples 6 40 49 17 0 8 2.51 1.47
Table 3 (cont.)
O. Chernyshenko, S. Stark, K. Chan, F. Drasgow, and B. Williams
546 MULTIVARIATE BEHAVIORAL RESEARCH
Frequency Distribution of Adjusted �2 to df RatioModel Item <1 1 - <2 2 - <3 3 - <4 4 - <5 >=5 Mean SD
SGRSingles 2 3 3 1 0 1 2.09 1.32Doubles 0 0 0 0 1 44 9.76 3.77Triples 0 0 0 1 6 113 7.87 2.44
MFS polytomousSingles 2 4 3 1 0 0 2.02 0.86Doubles 0 23 14 5 1 2 2.33 1.32Triples 0 80 22 14 4 0 2.06 0.75
16PF Impression Management Scale2PL
Singles 8 1 1 1 0 1 1.56 1.59Doubles 7 14 19 3 8 15 4.72 5.67Triples 1 30 46 37 16 90 5.81 4.50
3PLSingles 8 1 1 1 0 1 1.53 1.46Doubles 5 17 16 5 9 14 4.68 5.67Triples 1 31 48 35 15 90 5.76 4.45
MFS dichotomousSingles 3 5 2 2 0 0 1.80 0.84Doubles 4 31 19 6 4 2 2.49 2.46Triples 1 94 78 26 9 12 2.71 2.04
SGRSingles 6 3 1 0 2 0 1.56 1.31Doubles 1 5 4 4 7 45 6.81 3.72Triples 0 0 7 20 33 160 6.25 2.02
MFS polytomousSingles 7 4 0 0 0 1 1.40 1.33Doubles 2 34 10 8 6 6 2.66 1.83Triples 1 82 77 35 16 9 2.56 1.09
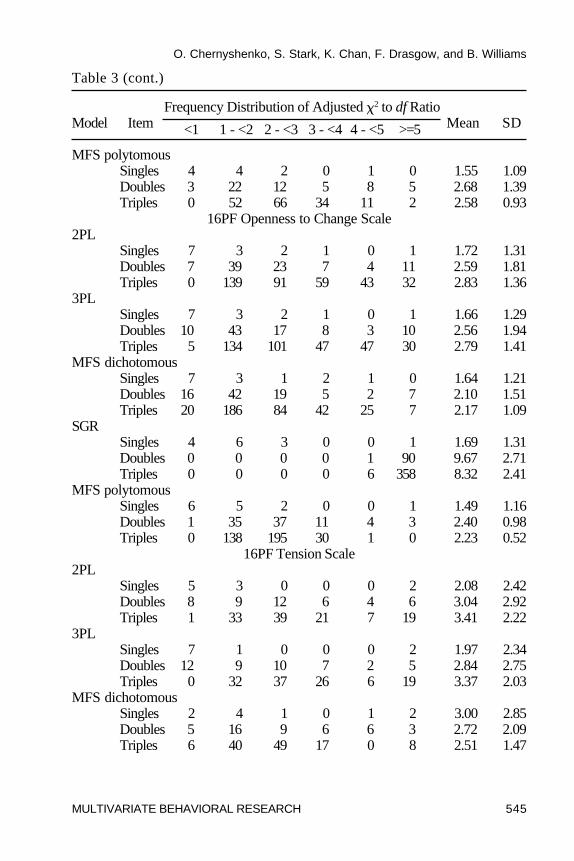
across the scales. Essentially, the results can be grouped into twocategories. One set of scales showed good parametric fit, while the otherset demonstrated a lack of parametric fit. In particular, the Openness toChange and Tension scales appeared to be fit well by dichotomous logisticmodels. Both 2PL and 3PL models had the majority of �2/df ratios for itempairs and triples in the very small to medium range ( 3). For example, themean of the 2PL ratios for the Openness to Change scale was 2.59 for pairs
Table 3 (cont.)
O. Chernyshenko, S. Stark, K. Chan, F. Drasgow, and B. Williams
MULTIVARIATE BEHAVIORAL RESEARCH 547
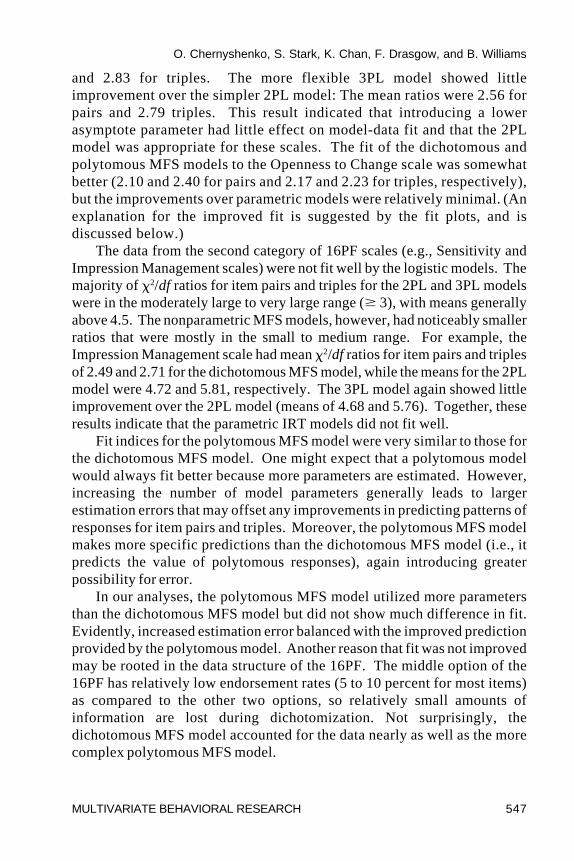
and 2.83 for triples. The more flexible 3PL model showed littleimprovement over the simpler 2PL model: The mean ratios were 2.56 forpairs and 2.79 triples. This result indicated that introducing a lowerasymptote parameter had little effect on model-data fit and that the 2PLmodel was appropriate for these scales. The fit of the dichotomous andpolytomous MFS models to the Openness to Change scale was somewhatbetter (2.10 and 2.40 for pairs and 2.17 and 2.23 for triples, respectively),but the improvements over parametric models were relatively minimal. (Anexplanation for the improved fit is suggested by the fit plots, and isdiscussed below.)
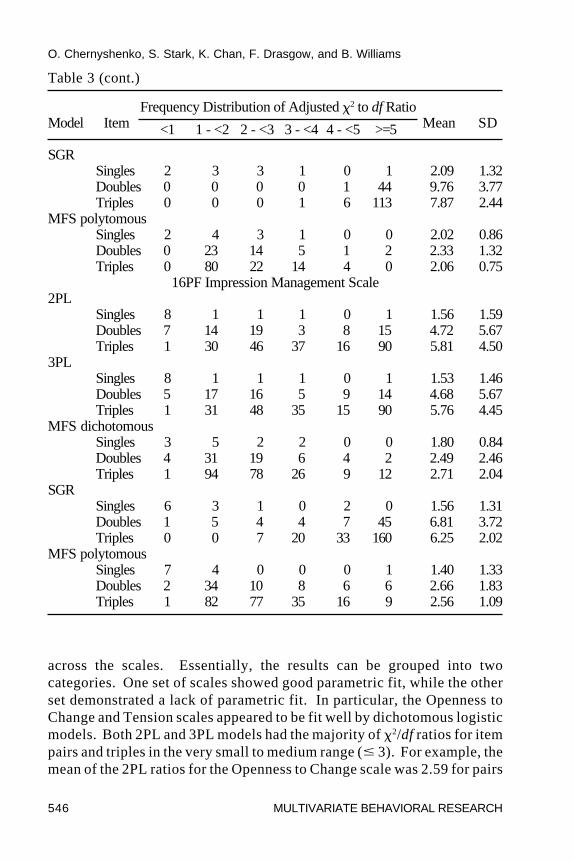
The data from the second category of 16PF scales (e.g., Sensitivity andImpression Management scales) were not fit well by the logistic models. Themajority of �2/df ratios for item pairs and triples for the 2PL and 3PL modelswere in the moderately large to very large range (� 3), with means generallyabove 4.5. The nonparametric MFS models, however, had noticeably smallerratios that were mostly in the small to medium range. For example, theImpression Management scale had mean �2/df ratios for item pairs and triplesof 2.49 and 2.71 for the dichotomous MFS model, while the means for the 2PLmodel were 4.72 and 5.81, respectively. The 3PL model again showed littleimprovement over the 2PL model (means of 4.68 and 5.76). Together, theseresults indicate that the parametric IRT models did not fit well.
Fit indices for the polytomous MFS model were very similar to those forthe dichotomous MFS model. One might expect that a polytomous modelwould always fit better because more parameters are estimated. However,increasing the number of model parameters generally leads to largerestimation errors that may offset any improvements in predicting patterns ofresponses for item pairs and triples. Moreover, the polytomous MFS modelmakes more specific predictions than the dichotomous MFS model (i.e., itpredicts the value of polytomous responses), again introducing greaterpossibility for error.
In our analyses, the polytomous MFS model utilized more parametersthan the dichotomous MFS model but did not show much difference in fit.Evidently, increased estimation error balanced with the improved predictionprovided by the polytomous model. Another reason that fit was not improvedmay be rooted in the data structure of the 16PF. The middle option of the16PF has relatively low endorsement rates (5 to 10 percent for most items)as compared to the other two options, so relatively small amounts ofinformation are lost during dichotomization. Not surprisingly, thedichotomous MFS model accounted for the data nearly as well as the morecomplex polytomous MFS model.
O. Chernyshenko, S. Stark, K. Chan, F. Drasgow, and B. Williams
548 MULTIVARIATE BEHAVIORAL RESEARCH
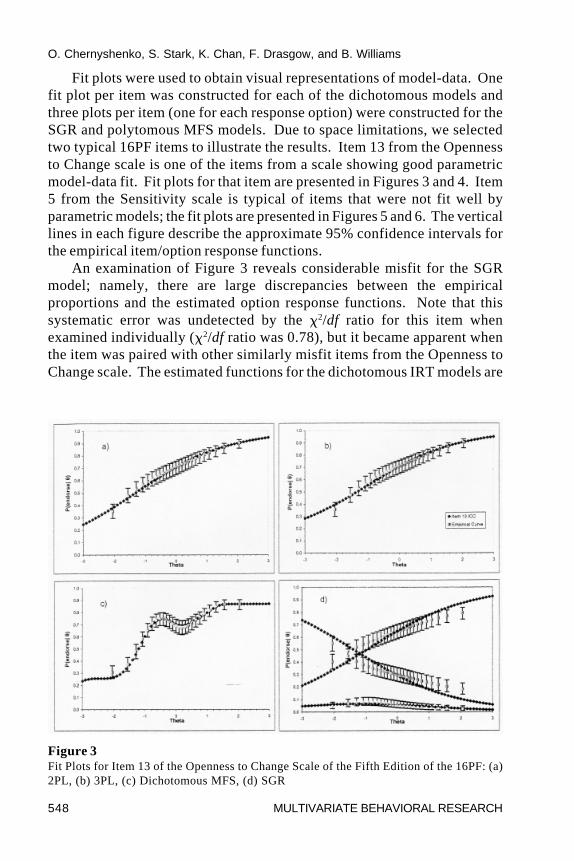
Fit plots were used to obtain visual representations of model-data. Onefit plot per item was constructed for each of the dichotomous models andthree plots per item (one for each response option) were constructed for theSGR and polytomous MFS models. Due to space limitations, we selectedtwo typical 16PF items to illustrate the results. Item 13 from the Opennessto Change scale is one of the items from a scale showing good parametricmodel-data fit. Fit plots for that item are presented in Figures 3 and 4. Item5 from the Sensitivity scale is typical of items that were not fit well byparametric models; the fit plots are presented in Figures 5 and 6. The verticallines in each figure describe the approximate 95% confidence intervals forthe empirical item/option response functions.
An examination of Figure 3 reveals considerable misfit for the SGRmodel; namely, there are large discrepancies between the empiricalproportions and the estimated option response functions. Note that thissystematic error was undetected by the �2/df ratio for this item whenexamined individually (�2/df ratio was 0.78), but it became apparent whenthe item was paired with other similarly misfit items from the Openness toChange scale. The estimated functions for the dichotomous IRT models are
Figure 3Fit Plots for Item 13 of the Openness to Change Scale of the Fifth Edition of the 16PF: (a)2PL, (b) 3PL, (c) Dichotomous MFS, (d) SGR
O. Chernyshenko, S. Stark, K. Chan, F. Drasgow, and B. Williams
MULTIVARIATE BEHAVIORAL RESEARCH 549
much more satisfactory than those estimated for the SGR model, becausethey fit the empirical proportions better. Note, however, that both modelsadequately described the lower tail of the response function, so there waslittle need for a lower asymptote parameter. The shape of the item responsefunction estimated by the dichotomous MFS model resembled the shape of2PL and 3PL logistic functions with the exception of a moderate oscillationnear � = 0. Also, note that the 2PL, 3PL, and MFS models had similarpatterns of �2/df ratios.
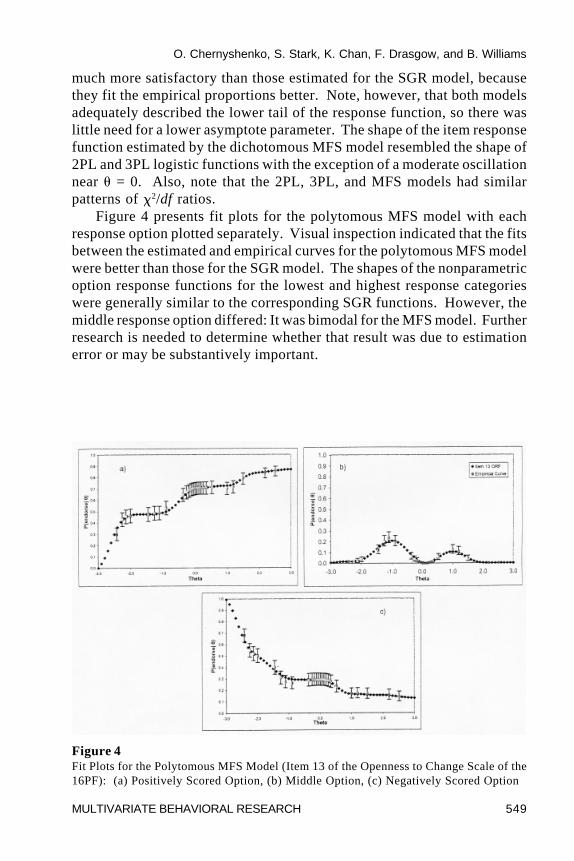
Figure 4 presents fit plots for the polytomous MFS model with eachresponse option plotted separately. Visual inspection indicated that the fitsbetween the estimated and empirical curves for the polytomous MFS modelwere better than those for the SGR model. The shapes of the nonparametricoption response functions for the lowest and highest response categorieswere generally similar to the corresponding SGR functions. However, themiddle response option differed: It was bimodal for the MFS model. Furtherresearch is needed to determine whether that result was due to estimationerror or may be substantively important.
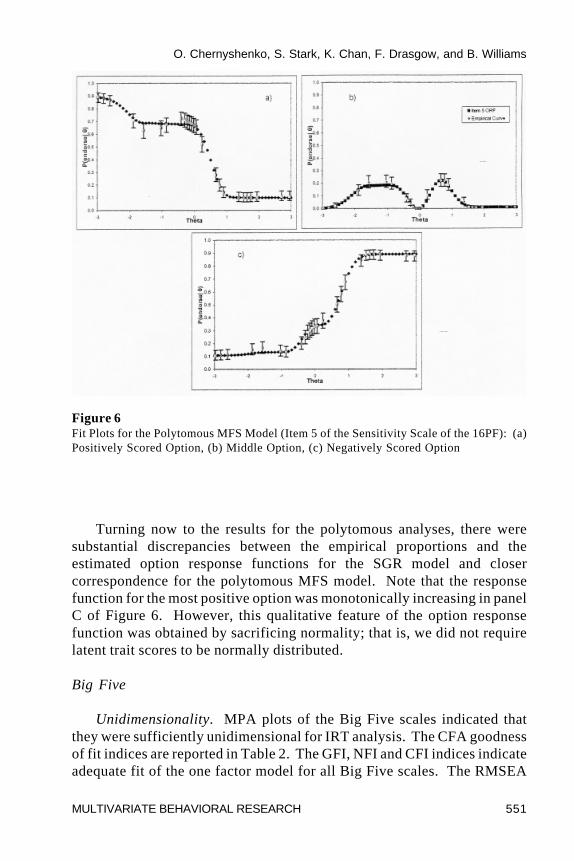
Figure 4Fit Plots for the Polytomous MFS Model (Item 13 of the Openness to Change Scale of the16PF): (a) Positively Scored Option, (b) Middle Option, (c) Negatively Scored Option
O. Chernyshenko, S. Stark, K. Chan, F. Drasgow, and B. Williams
550 MULTIVARIATE BEHAVIORAL RESEARCH
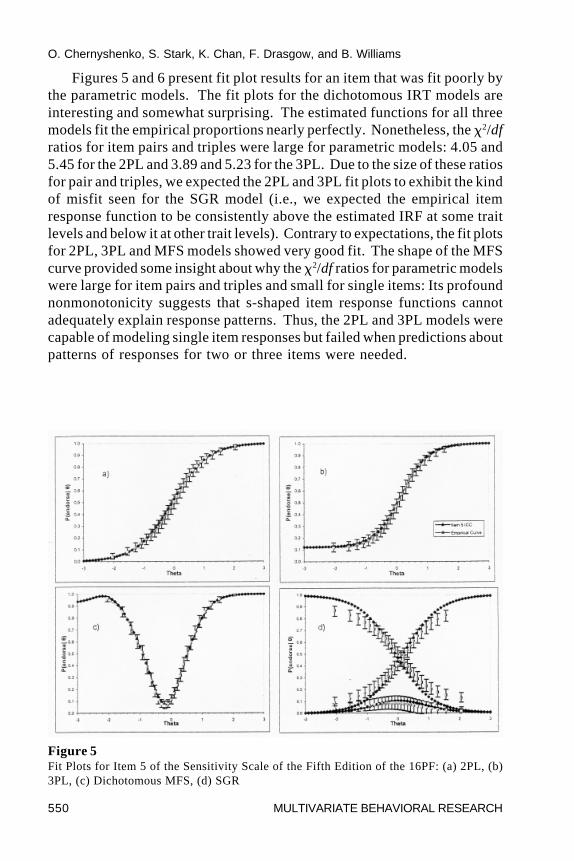
Figures 5 and 6 present fit plot results for an item that was fit poorly bythe parametric models. The fit plots for the dichotomous IRT models areinteresting and somewhat surprising. The estimated functions for all threemodels fit the empirical proportions nearly perfectly. Nonetheless, the �2/dfratios for item pairs and triples were large for parametric models: 4.05 and5.45 for the 2PL and 3.89 and 5.23 for the 3PL. Due to the size of these ratiosfor pair and triples, we expected the 2PL and 3PL fit plots to exhibit the kindof misfit seen for the SGR model (i.e., we expected the empirical itemresponse function to be consistently above the estimated IRF at some traitlevels and below it at other trait levels). Contrary to expectations, the fit plotsfor 2PL, 3PL and MFS models showed very good fit. The shape of the MFScurve provided some insight about why the �2/df ratios for parametric modelswere large for item pairs and triples and small for single items: Its profoundnonmonotonicity suggests that s-shaped item response functions cannotadequately explain response patterns. Thus, the 2PL and 3PL models werecapable of modeling single item responses but failed when predictions aboutpatterns of responses for two or three items were needed.
Figure 5Fit Plots for Item 5 of the Sensitivity Scale of the Fifth Edition of the 16PF: (a) 2PL, (b)3PL, (c) Dichotomous MFS, (d) SGR
O. Chernyshenko, S. Stark, K. Chan, F. Drasgow, and B. Williams
MULTIVARIATE BEHAVIORAL RESEARCH 551
Turning now to the results for the polytomous analyses, there weresubstantial discrepancies between the empirical proportions and theestimated option response functions for the SGR model and closercorrespondence for the polytomous MFS model. Note that the responsefunction for the most positive option was monotonically increasing in panelC of Figure 6. However, this qualitative feature of the option responsefunction was obtained by sacrificing normality; that is, we did not requirelatent trait scores to be normally distributed.
Big Five
Unidimensionality. MPA plots of the Big Five scales indicated thatthey were sufficiently unidimensional for IRT analysis. The CFA goodnessof fit indices are reported in Table 2. The GFI, NFI and CFI indices indicateadequate fit of the one factor model for all Big Five scales. The RMSEA
Figure 6Fit Plots for the Polytomous MFS Model (Item 5 of the Sensitivity Scale of the 16PF): (a)Positively Scored Option, (b) Middle Option, (c) Negatively Scored Option
O. Chernyshenko, S. Stark, K. Chan, F. Drasgow, and B. Williams
552 MULTIVARIATE BEHAVIORAL RESEARCH
scores for Emotional Stability and Intellect scales, however, were somewhatlarge.
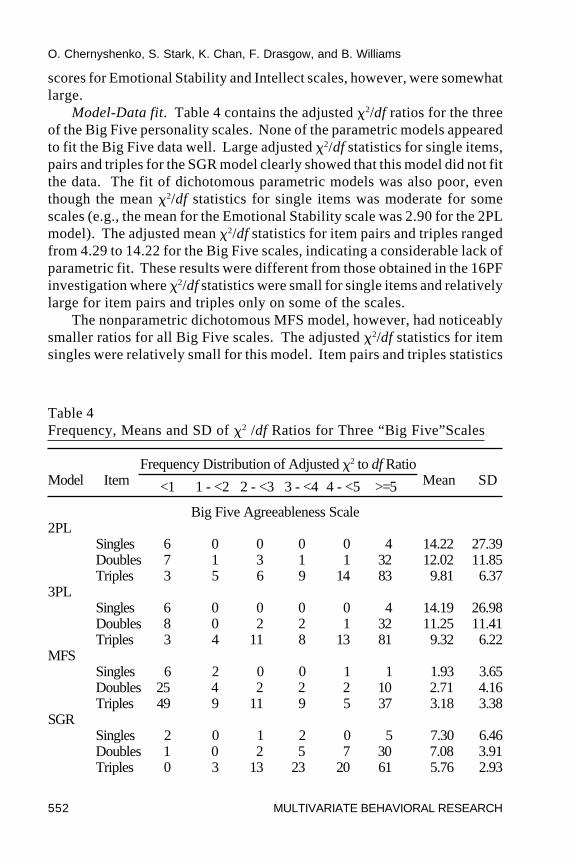
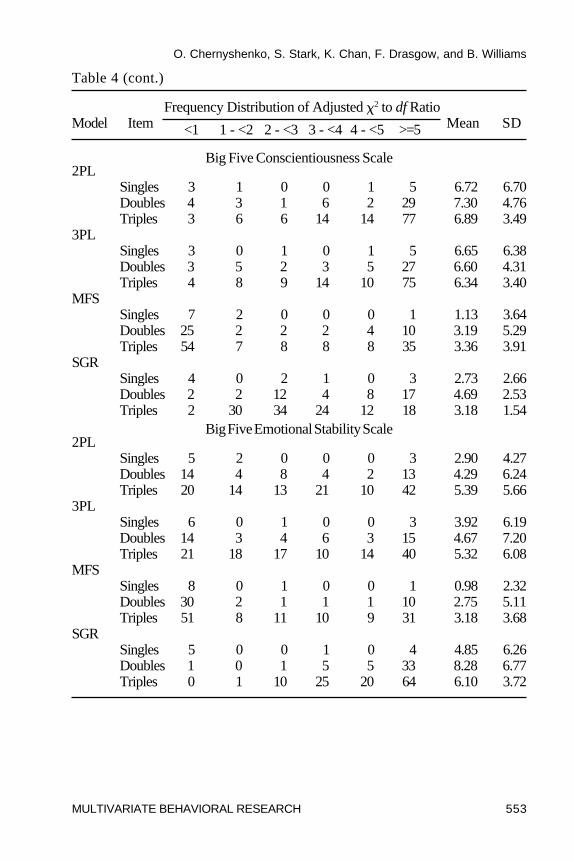
Model-Data fit. Table 4 contains the adjusted �2/df ratios for the threeof the Big Five personality scales. None of the parametric models appearedto fit the Big Five data well. Large adjusted �2/df statistics for single items,pairs and triples for the SGR model clearly showed that this model did not fitthe data. The fit of dichotomous parametric models was also poor, eventhough the mean �2/df statistics for single items was moderate for somescales (e.g., the mean for the Emotional Stability scale was 2.90 for the 2PLmodel). The adjusted mean �2/df statistics for item pairs and triples rangedfrom 4.29 to 14.22 for the Big Five scales, indicating a considerable lack ofparametric fit. These results were different from those obtained in the 16PFinvestigation where �2/df statistics were small for single items and relativelylarge for item pairs and triples only on some of the scales.
The nonparametric dichotomous MFS model, however, had noticeablysmaller ratios for all Big Five scales. The adjusted �2/df statistics for itemsingles were relatively small for this model. Item pairs and triples statistics
Table 4Frequency, Means and SD of �2 /df Ratios for Three “Big Five”Scales
Frequency Distribution of Adjusted �2 to df RatioModel Item <1 1 - <2 2 - <3 3 - <4 4 - <5 >=5 Mean SD
Big Five Agreeableness Scale2PL
Singles 6 0 0 0 0 4 14.22 27.39Doubles 7 1 3 1 1 32 12.02 11.85Triples 3 5 6 9 14 83 9.81 6.37
3PLSingles 6 0 0 0 0 4 14.19 26.98Doubles 8 0 2 2 1 32 11.25 11.41Triples 3 4 11 8 13 81 9.32 6.22
MFSSingles 6 2 0 0 1 1 1.93 3.65Doubles 25 4 2 2 2 10 2.71 4.16Triples 49 9 11 9 5 37 3.18 3.38
SGRSingles 2 0 1 2 0 5 7.30 6.46Doubles 1 0 2 5 7 30 7.08 3.91Triples 0 3 13 23 20 61 5.76 2.93
O. Chernyshenko, S. Stark, K. Chan, F. Drasgow, and B. Williams
MULTIVARIATE BEHAVIORAL RESEARCH 553
Frequency Distribution of Adjusted �2 to df RatioModel Item <1 1 - <2 2 - <3 3 - <4 4 - <5 >=5 Mean SD
Big Five Conscientiousness Scale2PL
Singles 3 1 0 0 1 5 6.72 6.70Doubles 4 3 1 6 2 29 7.30 4.76Triples 3 6 6 14 14 77 6.89 3.49
3PLSingles 3 0 1 0 1 5 6.65 6.38Doubles 3 5 2 3 5 27 6.60 4.31Triples 4 8 9 14 10 75 6.34 3.40
MFSSingles 7 2 0 0 0 1 1.13 3.64Doubles 25 2 2 2 4 10 3.19 5.29Triples 54 7 8 8 8 35 3.36 3.91
SGRSingles 4 0 2 1 0 3 2.73 2.66Doubles 2 2 12 4 8 17 4.69 2.53Triples 2 30 34 24 12 18 3.18 1.54
Big Five Emotional Stability Scale2PL
Singles 5 2 0 0 0 3 2.90 4.27Doubles 14 4 8 4 2 13 4.29 6.24Triples 20 14 13 21 10 42 5.39 5.66
3PLSingles 6 0 1 0 0 3 3.92 6.19Doubles 14 3 4 6 3 15 4.67 7.20Triples 21 18 17 10 14 40 5.32 6.08
MFSSingles 8 0 1 0 0 1 0.98 2.32Doubles 30 2 1 1 1 10 2.75 5.11Triples 51 8 11 10 9 31 3.18 3.68
SGRSingles 5 0 0 1 0 4 4.85 6.26Doubles 1 0 1 5 5 33 8.28 6.77Triples 0 1 10 25 20 64 6.10 3.72
Table 4 (cont.)
O. Chernyshenko, S. Stark, K. Chan, F. Drasgow, and B. Williams
554 MULTIVARIATE BEHAVIORAL RESEARCH
were close to or below 3.0 indicating good fit of the MFS model to the data.This is surprising because dichotomous MFS was the most complex modelfor the Big Five items; estimation errors resulting from the small (N = 930)calibration samples were expected to create substantial challenges forcross-validation. Doubtlessly such estimation errors occurred, but thenonparametric model’s ability to fit the Big Five data was not substantiallyaffected.
Fit plots for the Big Five results are not presented due to spacelimitations. Recall that within each 16PF scale, the items tended to havesimilarly shaped MFS response functions. In contrast, there was substantialvariation in the shapes of the MFS response functions within the Big Fivescales. Whereas some items seemed to conform to the monotonic, s-shapeof the logistic function, other items had response functions that were clearlynonmonotonic.
Discussion
The main conclusion from this study is that the issue of fitting IRT modelsto personality data is more complicated than previously suggested. Ourresearch differed markedly from other investigations of model-data fitbecause we fit several increasingly complicated IRT models to twopersonality inventories and used improved statistical and graphical fitprocedures. In contrast to previous researchers that focused on fit statisticsfor item singles, we examined interactions among items by studying itempairs and triples. The results showed that the 2PL and 3PL logistic modelsdid not consistently fit the data from the 16PF or the Big Five. Specifically,some of the 16PF scales were fitted well by the 2PL model but others werenot. None of the 16PF or Big Five scales were fitted adequately by the SGRmodel. The nonparametric MFS models appeared to fit all 16PF and Big Fivescales; note, however, that the item response functions differed markedly intheir shapes across scales.
Two important questions arise from these findings: (a) why don’ttraditional logistic models fit personality scales consistently? and (b) whatare the effects (if any) of model-data misfit on the applications of IRT inpersonality measurement? Although more research is clearly needed toadequately answer these questions, we will share some of our thoughts onthese topics.
Our first hypothesis about the source of model-data misfit for personalityscales was very straightforward. We were hoping to identify a specific typeof item that could not be fit by IRT models. As an anonymous reviewersuggested, the negatively keyed items might be problematic. To test this
O. Chernyshenko, S. Stark, K. Chan, F. Drasgow, and B. Williams
MULTIVARIATE BEHAVIORAL RESEARCH 555
hypothesis, we created a group of positively keyed items and a group ofnegatively keyed items for each scale, computed the average chi-square fitstatistic for each group, and examined the differences. No noticeabledifferences were found. For example, the conscientiousness scale of the BigFive inventory had 6 positively keyed items and 4 negatively keyed items.The average adjusted �2/df statistic for positive item singles was 8.08 whilethe same statistic for negatively keyed items was 4.52. Both exceeded therecommended 3.0 level. The adjusted �2/df statistics for all pairs of positiveand negative items examined separately were 6.94 and 6.48 respectively.This indicates essentially no difference in model-data fit between the twogroups of items. Similar results were obtained for other Big Five and 16PFscales.
We also looked at the content of items in search of possible answers.Because the 16PF is a copyrighted instrument, we can only discuss the contentof items from the Big Five inventory (public domain), but similar conclusionscan be reached for the 16PF data. Let us consider the following items fromthe Conscientiousness scale of the Big Five inventory: “I pay attention todetails,” “I make a mess of things,” “I like order.” All three items showed goodfit for the 3PL model at the level of single items (adjusted �2/df ranged from0 to 2.41). However, when we examined patterns of responses to theseitems, only one pair (item 1 and item 3) fit the model well (adjusted �2/df was0.01); the other two pairs showed considerable misfit (adjusted �2/df were13.37 and 6.68). It is unclear why the local independence assumption for theitem “I like order” is violated when it is paired with the item “I make messof things,” but not violated when it is paired with the item “I pay attention todetails.” Overall, we were unable to identify any group of items or anycontent problems that would result in consistently better or worse fit by theparametric models.
A reviewer of this manuscript presented an interesting explanation forthe above example of misfit. This reviewer noted that one possibleexplanation of local dependence for the “I like order” and “I make a messof things” is that these two items assess a “neatness” dimension, while “I payattention to details” assesses a “vigilance to fine points” dimension. It is quitepossible that individuals may endorse the “neatness” items and not endorsethe “details” item. The reviewer’s comment brings an important point to ourdiscussion. It draws attention to the issue of multidimensionality as thepossible cause of misfit. In our article we uncovered a contradictionbetween the outcomes of the unidimensionality analyses (MPA, CFA) andthe results of the two- and three-item chi-square fit statistics. As we notedin the Introduction, the chi-square test is a stronger test for model-data fitbecause it requires modeling of patterns of responses. When chi-square
O. Chernyshenko, S. Stark, K. Chan, F. Drasgow, and B. Williams
556 MULTIVARIATE BEHAVIORAL RESEARCH
statistics are large, two explanations are possible: (a) violation of theunidimensionality assumption and (b) the model fits the data inadequately. Itis possible that the chi-square statistics were much more sensitive toviolations of unidimensionality than were the MPA and CFA statistics. Notethat the RMSEA values in Table 2 indicated only a “fair” fit in the majorityof cases, thus, supporting the multidimensionality hypothesis. However, inour previous research we found that cognitive ability scales with similarMPA and CFA statistics did not have large chi-square statistics for the 3PLmodel. That fact directs our attention to the possibility that traditional logisticmodels may be inappropriate for personality items.
Our second hypothesis about the source of model-data misfit forpersonality scales concerns the nature of responses to personality items.Many researchers have argued that individuals might respond differently topersonality items than cognitive ability items. Cronbach (1960) was one ofthe first psychometricians who emphasized the distinction between tests oftypical and maximum performance. Maximum performance tests aredesigned to reflect what an individual “can do” (i.e., can provide a correctanswer to an algebra question), whereas typical performance tests aredesigned to reflect what an individual “will do” or “usually does” (i.e., talksto many different people at parties). Traditionally the typical vs. maximumperformance distinction was maintained primarily to separate tests into twodomains: the cognitive ability domain and the nonability domain (e.g.,personality). Recently, Campbell (1990) and Sackett, Zedeck and Fogli(1988) emphasized that this distinction goes beyond the simple classificationissue and involves differences in test responding. While responding tocognitive ability tests, the individual is aware that his/her performance isbeing monitored and, hence, he/she is motivated to do the task, expend a highlevel of effort on the task and maintain a high level of effort throughout themeasurement period. Clearly, the behavior of the individual is severelyrestricted by the testing situation. In contrast, individuals have a great arrayof choices regarding the time on task, level of effort, and persistence of effortwhile answering typical performance tests. Thus, it is possible thattraditional IRT models can model well the constrained responding tomaximum performance tests, but cannot model the complexity of respondingto typical performance tests. In our study, we found that the morecomplicated MFS model adequately captured the responses to personalityitems while logistic models failed to provide such consistency.
Additional arguments regarding the fundamental difference betweenresponding to personality and cognitive ability items can be found in theattitude measurement literature. There has been an increasing number ofpublications suggesting that the Likert approach to scale construction may
O. Chernyshenko, S. Stark, K. Chan, F. Drasgow, and B. Williams
MULTIVARIATE BEHAVIORAL RESEARCH 557
have limitations for noncognitive items (e.g., Andrich, 1988, Roberts,Laughlin, & Wedell, 1999). The Likert procedure assumes that respondingto personality items follows a dominance (or cumulative) responseprocess (Coombs, 1964); namely, the individual has a high probability ofendorsing an item if he/she is located above the item on the underlyingcontinuum. However, several researchers (Andrich, 1996; Roberts et al.,1999) have argued that this assumption might be flawed for attitude items.They have found that participants generally use some type of ideal pointresponse process. The premise of this process is that the probability of aperson endorsing an item depends on both the location of the person and theposition of the statement along the latent trait continuum. People tend toagree with statements having scale values similar to their own, while theytend to disagree with statements having scale values that are either more orless extreme. Thus, ideal point models have nonmonotonic item responsefunctions.
We believe that personality items are essentially attitude statements aboutpeople’s own behavior. Consequently, we are not particularly surprised thatlogistic models have some problems fitting personality items. The adequateperformance of logistic models on some personality scales may be explainedby the fact that items were preselected to be so extreme that we were unableto observe individuals with extremely high trait levels who began to agree lesswith statements because the item did not reflect the extremity of their positionon the trait continuum. Scales that were fitted poorly by logistic models mayhave had less extreme items and more individuals with extreme trait levels.While that did not affect the fit of individual items much, the misfit increasedexponentially as pairs and triples of these less extreme items were considered.In our study, the Tension scale of the 16PF was fit well by the 3PL model while,the Sensitivity scale was fit poorly. It may be the case that it was easier togenerate extreme items for the Tension scale of the 16PF than for theSensitivity scale. Similarly, it may be easier to write extreme items for therelatively narrow constructs of the 16PF than for the broad constructs of theBig Five. Currently, we are conducting a series of studies that explore the issueof fit of ideal point models to personality data.
In summary, the fit of the traditional IRT models to personality data is amatter of concern. How much the violation of parametric model assumptionsillustrated in this paper affects the applications of traditional IRT models inpersonality measurement is another question. One interesting result has beenfound by Stark, Chernyshenko, Chan, Drasgow and Lee (2001) while conductinga differential item functioning (DIF) analysis of the 16PF scales. In that study,two approaches to DIF were used: a parametric approach based on IRT (Lord’schi square; Lord, 1980) and a nonparametric approach (SIBTEST; Stout &
O. Chernyshenko, S. Stark, K. Chan, F. Drasgow, and B. Williams
558 MULTIVARIATE BEHAVIORAL RESEARCH
Roussos, 1996). In general, the same items were identified as having DIF byparametric and nonparametric approaches for scales that were fit well by the3PL model, but different items were identified by SIBTEST and Lord’s chi-square as having DIF for scales that had model-data misfit. For personnelselection, where DIF studies are used widely as part of test development andvalidation, disagreement between DIF methods poses a considerable problem.If the items flagged as DIF depend on the analysis then we do not know whichitems are truly a problem and, thus, we cannot improve our measurementinstrument to satisfy today’s testing standards. Other problems that result fromapplying poorly fitted IRT models may involve difficulties in assessing the qualityof individual items (e.g., finding highly discriminating items), creating parallel testforms or selecting items during computer adaptive testing. In contrast, selectionof an IRT model that provides a good fit would enable personnel psychologiststo take full advantage of modern psychometric theory and to improve manyaspects of personality measurement.
We feel that future research should focus on two issues. First, from apsychometric viewpoint, more complex models (e.g., MFS) should beconsidered when modeling existing personality data. Second, otherapproaches to personality scale construction (e.g., ideal point) should beattempted.
References
Andrich, D. (1988). The application of an unfolding model of the PIRT type to themeasurement of attitude. Applied Psychological Measurement, 12, 33-51.
Andrich, D. (1996). A hyperbolic cosine latent trait model for unfolding polytomousresponses: Reconciling Thurstone and Likert methodologies. British Journal ofMathematical and Statistical Psychology, 49, 347-365.
Barrick, M. R. & Mount M. K. (1991). The Big Five personality dimensions and jobperformance: A meta-analysis. Personnel Psychology, 44, 1-26.
Barrick, M. R. & Mount, M. K. (1993). Autonomy as a moderator of relationshipsbetween the Big Five personality dimensions and job performance: A meta-analysis.Journal of Applied Psychology, 78, 111-118.
Becker, P. (1989). Der Trier Persönlichkeitsfragebogen (TPF) Handanweisung [The TrierPersonality Inventory (TIP) Manual]. Göttingen, West Germany: Hogrefe.
Bentler, P. M. (1990). Comparative fix indexes in structural models. PsychologicalBulletin, 107, 238-246.
Bentler, P. M. & Bonett, D. G. (1980). Significance tests and goodness of fit in the analysisof covariance structures. Psychological Bulletin, 88, 588-606.
Bock, R. D. (1972). Estimating item parameters and latent ability when responses arescored in two or more nominal categories. Psychometrika, 37, 29-51.
Browne, M. W. & Cudeck, R. (1993). Alternative ways of assessing model fit. In K. A.Bollen & J. S. Long (Eds.), Testing structural equation models (pp. 136-162).Newbury Park, CA: Sage.
O. Chernyshenko, S. Stark, K. Chan, F. Drasgow, and B. Williams
MULTIVARIATE BEHAVIORAL RESEARCH 559
Campbell, J. P. (1990). The role of theory in industrial and organizational psychology. InM. D. Dunnette & L. M. Hough (Eds.), Handbook of industrial and organizationalpsychology: Vol. 2. (2nd ed., pp. 39-73). Palo Alto: Consulting Psychologists Press.
Chan, K. (1999). Toward a theory of individual differences and leadership: Understandingthe motivation to lead. Unpublished doctoral dissertation, University of Illinois,Urbana-Champaign.
Conn, S. & Rieke, M. L. (Eds.). (1994). The 16PF fifth edition technical manual.Champaign, IL: Institute for Personality and Ability Testing.
Cooke, D. J. & Michie, C. (1997). An item response theory analysis of the HarePsychopathy Checklist-Revised. Psychological Assessment, 9, 3-14.
Coombs, C. H. (1964). A theory of data. New York: Wiley.Cronbach, L. J. (1960). Essentials of psychological testing. New York: Harper.Drasgow, F., Levine M. V., Tsien, S., Williams B. A., & Mead, A. D. (1995). Fitting
polytomous item response theory models to multiple-choice tests. AppliedPsychological Measurement, 19, 143-165.
Drasgow, F. & Lissak, R. I. (1983). Modified parallel analysis: A procedure for examiningthe latent dimensionality of dichotomously scored item responses. Journal of AppliedPsychology, 68, 363-373.
Ellis, B. B., Becker, P., & Kimmel, H. D. (1993). An item response theory evaluation of anEnglish version of the Trier Personality Inventory. Journal of Cross-CulturalPsychology, 2, 133-148.
Feingold, A. (1994). Gender differences in personality: A meta-analysis. PsychologicalBulletin, 116, 429 456.
Flanagan, W., Raju, N. S., & Haygood, J. M. (1998, April). Impression management,measurement equivalence, and personality factors: Can IRT be used to determine theimpact of faking. In F. Drasgow (Chair), Improvements in measurement: Applicationof item response theory. Symposium conducted at the 13th annual conference of theSociety for Industrial and Organizational Psychology, Dallas, TX.
Glas, C. A. W. (1988). The derivation of some tests for the Rasch model from themultinomial distribution. Psychometrika, 53, 525-546.
Goldberg, L. R. (1997). A broad-bandwidth, public-domain, personality inventorymeasuring the lower-level facets of several five-factor models. In I. Mervielde, I.Deary, F. De Fruyt, & F. Ostendorf (Eds.), Personality psychology in Europe, Vol. 7.The Netherlands: Tilburg University Press.
Goldberg, L. R. (1998, March 18). International Personality Item Pool: A scientificcollaboratory for the development of advanced measures of personality and otherindividual differences. [On-line]. Available HTTP: http//ipip.ori.org/ipip/ipip.html.
Gratias, M. & Harvey, R. J. (1998, April). Gender and ethnicity-based differential itemfunctioning on the MBTI. Paper presented at the 13th Annual Conference of theSociety of Industrial and Organizational Psychology, Dallas, TX.
Hambleton, R. K., Swaminathan, H., & Rogers, H. J. (1991). Fundamentals of itemresponse theory. Newbury Park, CA: Sage.
Hare, R. D. (1991). The Hare Psychopathy Checklist-Revised. Toronto, Ontario, Canada:Multi-Health Systems.
Harkness, A. R. & McNulty, J. L. (1994). The Personality Psychopathology Five (PSY-5): Issues from the pages of a diagnostic manual instead of a dictionary. In S. Strack &M. Lorr, (Eds.), Differentiating normal and abnormal personality. (pp. 291-315).New York: Springer.
Hattie, J. A. (1984). An empirical study of various indices for determiningunidimensionality. Multivariate Behavioral Research, 19, 49-78.

O. Chernyshenko, S. Stark, K. Chan, F. Drasgow, and B. Williams
560 MULTIVARIATE BEHAVIORAL RESEARCH
Hattie, J. A. (1985). Methodology review: Assessing unidimensionality of tests and items.Applied Psychological Measurement, 9, 139-164.
Hogan, R. T. (1991). Personality and personality measurement. In M. D. Dunnette & L.M. Hough (Eds.), Handbook of industrial and organizational psychology: Vol. 2 (2nded., pp. 873-919). Palo Alto: Consulting Psychologists Press.
Hough, L. M. (1996). Personality at work: Issues and evidence. In M. D. Hakel (Ed.),Beyond multiple choice: Evaluating alternatives to traditional testing for selection.Hillsdale, NJ: Erlbaum.
Hough, L. M., Eaton, N. K., Dunnette, M. D., Kamp, J. D., & McCloy, R. A. (1990).Criterion-related validities of personality constructs and the effect of responsedistortion on those validities. Journal of Applied Psychology, 75, 95-108.
Hough, L. M. & Schneider, R. J. (1996). Personality traits, taxonomies, and applicationsin organizations. In K. R. Murphy (Ed.), Individual differences and behavior inorganizations. San Francisco, CA: Jossey Bass.
Hu, L. & Bentler, P. M. (1999). Cutoff criteria for fit indexes in covariance structureanalysis: Conventional criteria versus new alternatives. Structural EquationModeling, 6, 1-55.
Hulin, C. L., Drasgow, F., & Parsons C. K. (1983). Item response theory: Applications topsychological measurement. Homewood, IL: Dow Jones-Irwin.
Humphreys, L. G. & Montanelli, R. G. (1975). An investigation of the parallel analysiscriterion for determining the number of common factors. Multivariate BehavioralResearch, 10, 193-205.
Jansen, P. G. & Roskam, E. E. (1986). Latent trait models and dichotomization of gradedresponses. Psychometrika, 51, 69-91.
Jennings, D. & Schmitt, N. W. (1998, April). Examination of differential item functioning:Subgroups and personality. Paper presented at the 13th Annual Conference of theSociety of Industrial and Organizational Psychology, Dallas, TX.
Jöreskog, K. G. & Sörbom, D. (1989). LISREL 7: A guide to the program and applications(2nd Ed.). Chicago: SPSS.
Levine, M. V. (1984). An introduction to multilinear formula score theory. (Personnel andTraining Research Programs, Office of Naval Research, Measurement Series No. 84-4). Arlington, VA: Personnel and Training Research Programs.
Levine, M. V. & Williams, B. A. (1991, May). An overview and evaluation of non-parametric IRF estimation strategies. Paper presented at the Office of Naval ResearchContractors’ Meeting on Model-Based Measurement, Princeton, NJ.
Levine, M. V. & Williams, B. A. (1993). Nonparametric models for polychotomouslyscored item responses: Analysis and integration. Unpublished manuscript.
Lord, F. M. (1980). Applications of item response theory to practical testing problems.Hillsdale, NJ: Erlbaum.
McDonald, R. P. (1999). Test theory: A unified treatment. Mahwah, NJ: Erlbaum.Mislevy, R. J. & Bock, R. D. (1991). BILOG user’s guide. Chicago, IL: Scientific
Software.Muraki, E. (1990). Fitting a polytomous item response model to Likert-type data. Applied
Psychological Measurement, 14, 59-71.Ones, D. S., Viswesvaran, C., & Schmidt, F. L. (1993). Comprehensive meta-analysis of
integrity test validities: Findings and implications for personnel selection and theoriesof job performance. Journal of Applied Psychology, 78, 679-703.
Peterson, N. G., Hough, L. M., Dunnette, M. D., Rosse, R. L., Toquam, J. L., & Wing, A.(1990). Project A: Specification of the predictor domain and development of newselection/classification tests. Personnel Psychology, 43, 247-276.
O. Chernyshenko, S. Stark, K. Chan, F. Drasgow, and B. Williams
MULTIVARIATE BEHAVIORAL RESEARCH 561
Reise, S. P. & Waller, N. G. (1990). Fitting the two-parameter model to personality data.Applied Psychological Measurement, 14, 45-58.
Reise, S. P., Widaman, K. F., & Pugh, R. H. (1993). Confirmatory factor analysis and itemresponse theory: Two approaches for exploring measurement invariance.Psychological Bulletin, 114, 552-566.
Roberts, J. S., Laughlin, J. E., & Wedell, D. H. (1999). Validity issues in the Likert andThurstone approaches to attitude measurement. Educational and PsychologicalMeasurement, 59, 211-233.
Rouse, S. V., Finger, M. S., & Butcher, J. N. (1999). Advances in clinical personalitymeasurement: An item response theory analysis of the MMPI-2 PSY-5 scales.Journal of Personality Assessment, 72, 282-307.
Sackett, P. R., Burris, L. R., & Callahan, C. (1989). Integrity testing for personnelselection: An update. Personnel Psychology, 42, 491-529.
Sackett, P. R., Zedeck, S., & Fogli, L. (1988). Relations between measures of typical andmaximum job performance. Journal of Applied Psychology, 73, 482-486.
Samejima, F. (1969). Estimation of latent ability using a response pattern of graded scores.(Psychometric Monograph No. 18). Iowa City, IA: Psychometric Society.
Samejima, F. (1979). A new family of models for the multiple choice item (Research ReportN0. 79-4). Knoxville: University of Tennessee, Department of Psychology.
Samejima, F. (1983). Some methods and approaches of estimating the operatingcharacteristics of discrete item responses. In H. Wainer & S. Messick (Eds.),Principles of modern psychological measurement: A Festschrift for Frederick M. Lord(pp. 159-182). Hillsdale NJ: Erlbaum.
Schmit, M. J. & Ryan, A. M. (1997, April). Specificity of item content in personality tests:An IRT analysis. Paper presented at the 12th Annual SIOP Conference, St. Louis,MO.
Stark, S., Chernyshenko, O. S., Chan, K. Y., Drasgow, F., & Lee, W. (2001). Effects of thetesting situation on item responding: Cause for concern. Journal of AppliedPsychology, 86, 943-953.
Steiger, J. H. & Lind, J. M. (1980, June). Statistically based tests for the number of commonfactors. Paper presented at the annual meeting of the Psychometric Society, IowaCity, IA.
Stout, W. (1987). A nonparametric approach for assessing latent trait unidimensionality.Psychometrika, 52, 589-617.
Stout, W. & Roussos, L. (1996). SIBTEST manual. Statistical Laboratory for Educationaland Psychological Measurement, University of Illinois at Urbana-Champaign.
Tanaka, J. S & Huba, G. J. (1984). Structures of psychological distress: Testingconfirmatory hierarchical models. Journal of Consulting and Clinical Psychology, 52,719-721.
Tellegen, A. (1982). A brief manual for the Multidimensional Personality Questionaire.Unpublished manuscript, University of Minnesota.
Tett, R. P., Jackson, D. N., & Rothstein, M. (1991). Personality measures as predictors ofjob performance: A meta-analytic review. Personnel Psychology, 44, 703-742.
Thissen, D. (1991). MULTILOG user’s guide (Version 6.0). Mooresville, IN: ScientificSoftware.
Thissen, D. & Steinberg, L. (1984). A response model for multiple choice items.Psychometrika, 49, 501-519.
Van den Wollenberg, A. L. (1982). Two new test statistics for the Rasch model.Psychometrika, 47, 123-140.
O. Chernyshenko, S. Stark, K. Chan, F. Drasgow, and B. Williams
562 MULTIVARIATE BEHAVIORAL RESEARCH
Van der Linden, W. J. & Hambleton, R. K. (1997). Handbook of modern item responsetheory. New York: Springer.
Waller, N. G., Tellegen, A., McDonald, R. P., & Lykken, D. T. (1996). Exploring nonlinearmodels in personality assessment: Development and preliminary validation of anegative emotionality scale. Journal of Personality, 64, 545-576.
Williams, B. A. (1986, August). The shapes of item response functions. Paper presented atthe Office of Naval Research Model-Based Measurement Contractors Conference,Gatlinburg, TN.
Williams, B. A. (1999). EMPOCC: A computer program for IRT fit plots. Unpublishedmanuscript. University of Illinois: Urbana-Champaign
Williams, B. A. & Levine, M. V. (1993). FORSCORE: A computer program fornonparametric item response theory. Unpublished manuscript. Department ofEducational Psychology, University of Illinois: Urbana-Champaign.
Zickar, M. J. & Drasgow, F. (1996). Detecting faking on a personality instrument usingappropriateness measurement. Applied Psychological Measurement, 20, 71-87.
Zickar, M. & Robie, C. (1998, April). Modeling faking good on personality items: An item-level analysis. Paper presented at the 13th Annual Conference of the Society ofIndustrial and Organizational Psychology, Dallas, TX.
Accepted October, 2000.


![[IRT] Item Response Theory - Survey Design · Title irt — Introduction to IRT models DescriptionRemarks and examplesReferencesAlso see Description Item response theory (IRT) is](https://img.pdfslide.us/doc/110x75/605f13066a7f910fdc25b6b6/irt-item-response-theory-survey-design-title-irt-a-introduction-to-irt-models.jpg)