Embed Size (px)
Citation preview
GALLEY P
ROOF
Demand for Palm Oil in the Balkans using Autoregressive Distributed Lag (ARDL)
(Permintaan Minyak Sawit di Balkan menggunakan Lat Tertabur Autoregresif)
Kalsom Zakaria
Malaysian Palm Oil Board
Jirsah A Bakar Kunchu
KDU University College
Kamalrudin Mohamed Salleh
Malaysian Palm Oil Board
Balu Nambiappan
Malaysian Palm Oil Board
Nur Ain Mohd Hassan
Malaysian Palm Oil Board
Abdul Hafizh Mohd Azam
Universiti Kabangsaan Malaysia
ABSTRACT
Demand for edible oils and fats in the Balkan countries shows an increasing trend, including the demand for palm oil.
Imports of palm oil for this region are mainly sourced directly from major producing countries, namely Indonesia and
Malaysia. The Balkan countries also import palm oil from non-palm oil producing countries like the Netherlands,
Germany and Italy. This study differs from existing studies on palm oil demand as it focuses on palm oil demand
specifically in the 4 countries of the Balkan Region. Therefore, the quarterly data from from 2008 to 2016 are used to
examine the factors affecting demand for palm oil in the Balkans using, this study used autoregressive distributed lag
(ARDL). The result of the bound test from 4 Balkan countries only in 3 countries shows that the studied variables and
palm oil demand there is a long-run relationship. The countries are Bulgaria, Croatia and Greece. This study also shows
that GDP, population and palm oil price have significant influence on the demand for palm oil in the Balkan countries.
Key words: Palm Oil Demand; Balkans; Malaysia; ARDL
ABSTRAK
Permintaan untuk minyak dan lemak di negara-negara Balkan menunjukkan trend yang meningkat, termasuklah
permintaan terhadap minyak sawit. Negara-negara Balkan mengimport kelapa sawit secara terus dari negara pengeluar
iaitu Indonesia dan juga Malaysia. Selain itu, negara-negara Balkan juga mengimport minyak sawit daripada negara
bukan pengeluar minyak sawit seperti Belanda, Jerman dan Itali. Kajian ini berbeza dengan kajian sedia ada mengenai
permintaan minyak sawit kerana ia memberi tumpuan kepada permintaan minyak sawit khususnya di 4 negara di Balkan.
Oleh itu, data sukuan tahun dari tahun 2008 hingga 2016 digunakan untuk mengkaji faktor-faktor yang mempengaruhi
permintaan minyak sawit di Balkan menggunakan autoregressive distributed lag (ARDL). Hasil ujian mendapati daripada
4 negara yang terdapat di Balkan, hanya 3 negara yang menunjukkan wujudnya hubungan jangka panjang antara
pembolehubah yang dikaji dengan permintaan minyak sawit. Negara-negara tersebut adalah Bulgaria, Croatia dan
Greece. Kajian ini juga menunjukkan bahawa KDNK, populasi dan harga minyak sawit mempunyai pengaruh yang
signifikan terhadap permintaan minyak sawit di negara-negara Balkan.
Kata Kunci: Permintaan minyak sawit; Balkans; Malaysia; ARDL
INTRODUCTION
Agriculture is the main income for the Balkan countries. The Balkan Region has vast fertile plains contributing to its high
yield of quality products from agricultural crops. Western Balkan consists of 10 countries, namely Albania, Bosnia and
Jurnal Ekonomi Malaysia 53(1) 2019
http://dx.doi.org/10.17576/JEM-2019-5301-12
GALLEY P
ROOF
Herzegovina, Croatia, Macedonia, Montenegro, Serbia, Greece, Bulgaria, Romania and Slovenia which forms the core
European region. Despite the region being known for its instability and the recent history of wars and civil conflicts, not
much is known with regards to the changes that have taken place in the economic and social welfare systems and the
dynamic processes of transition, development and the European integration that has occurred for the past two decades.
Although the Southern part of the peninsula and some other regions are mountainous and rugged, this making it unsuitable
for grains production, the Balkan Peninsula has over two times of land usage rate if compared to the rest of the world
(Kaya 2014).
The Balkans are well-known for the richness of natural resources mainly agriculture and the production of
vegetable oils, mainly sunflower oil. Romania, Bulgaria and Serbia are the major producers of sunflower oil in this region.
The sunflower oil industry plays an important role in the Balkans’ economy. Therefore, this stimulates rapid development
in the production of sunflower in the Balkans region (Epure et al. 2012). However, the demand for palm oil also shows an
increasing trend due to its usage in various industries, including the food industry. Due to its health benefits and
comparative price advantage to other vegetable oils, the use of palm oil is as important as sunflower oil in the Balkans
(Abdullah 2011).
The sunflower plant has a high adaptation capability allowing it to grow, both in dry and wet weather. Besides
that, it requires less workers due to the higher mechanization used in its production. However, influence of the weather
during spring and summer causes some uncertainty when it comes to production. Sunflower plants have a natural enemy in
the form of a parasite named “Broomrape” (Orobanche cumana Wallr). The existences of these parasites in the Balkan
region have a great impact in the production rate. This situation gives the opportunity for palm oil to enter the Balkans
region beside other vegetables oil and fats like rapeseed oil, soya bean oil and olive oil. (Kaya 2014).
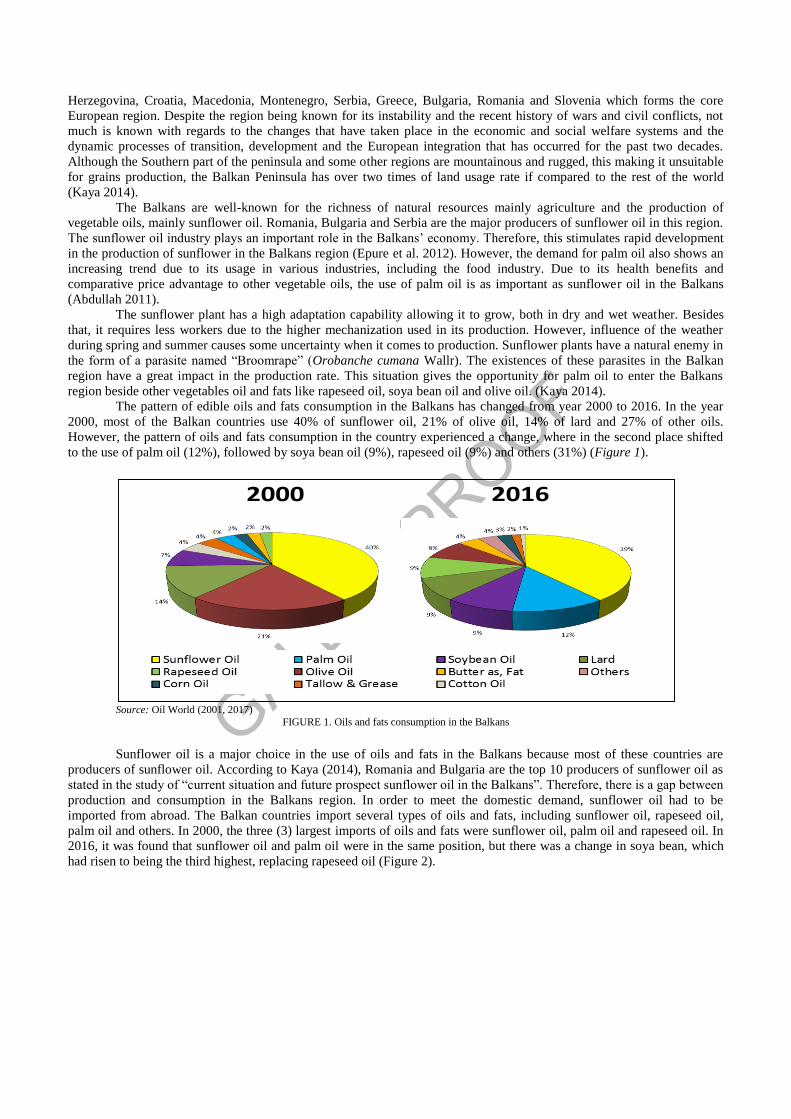
The pattern of edible oils and fats consumption in the Balkans has changed from year 2000 to 2016. In the year
2000, most of the Balkan countries use 40% of sunflower oil, 21% of olive oil, 14% of lard and 27% of other oils.
However, the pattern of oils and fats consumption in the country experienced a change, where in the second place shifted
to the use of palm oil (12%), followed by soya bean oil (9%), rapeseed oil (9%) and others (31%) (Figure 1).
Source: Oil World (2001, 2017)
FIGURE 1. Oils and fats consumption in the Balkans
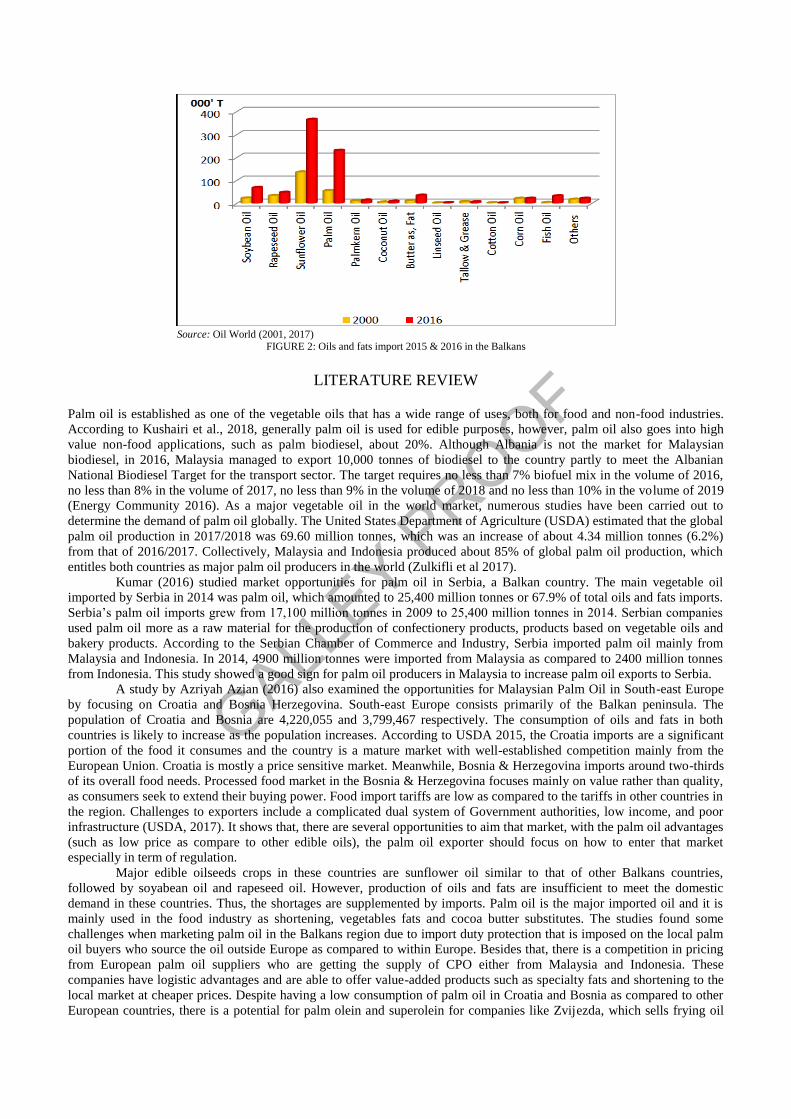
Sunflower oil is a major choice in the use of oils and fats in the Balkans because most of these countries are
producers of sunflower oil. According to Kaya (2014), Romania and Bulgaria are the top 10 producers of sunflower oil as
stated in the study of “current situation and future prospect sunflower oil in the Balkans”. Therefore, there is a gap between
production and consumption in the Balkans region. In order to meet the domestic demand, sunflower oil had to be
imported from abroad. The Balkan countries import several types of oils and fats, including sunflower oil, rapeseed oil,
palm oil and others. In 2000, the three (3) largest imports of oils and fats were sunflower oil, palm oil and rapeseed oil. In
2016, it was found that sunflower oil and palm oil were in the same position, but there was a change in soya bean, which
had risen to being the third highest, replacing rapeseed oil (Figure 2).
2000 2016
GALLEY P
ROOF
Source: Oil World (2001, 2017) FIGURE 2: Oils and fats import 2015 & 2016 in the Balkans
LITERATURE REVIEW Palm oil is established as one of the vegetable oils that has a wide range of uses, both for food and non-food industries.
According to Kushairi et al., 2018, generally palm oil is used for edible purposes, however, palm oil also goes into high
value non-food applications, such as palm biodiesel, about 20%. Although Albania is not the market for Malaysian
biodiesel, in 2016, Malaysia managed to export 10,000 tonnes of biodiesel to the country partly to meet the Albanian
National Biodiesel Target for the transport sector. The target requires no less than 7% biofuel mix in the volume of 2016,
no less than 8% in the volume of 2017, no less than 9% in the volume of 2018 and no less than 10% in the volume of 2019
(Energy Community 2016). As a major vegetable oil in the world market, numerous studies have been carried out to
determine the demand of palm oil globally. The United States Department of Agriculture (USDA) estimated that the global
palm oil production in 2017/2018 was 69.60 million tonnes, which was an increase of about 4.34 million tonnes (6.2%)
from that of 2016/2017. Collectively, Malaysia and Indonesia produced about 85% of global palm oil production, which
entitles both countries as major palm oil producers in the world (Zulkifli et al 2017).
Kumar (2016) studied market opportunities for palm oil in Serbia, a Balkan country. The main vegetable oil
imported by Serbia in 2014 was palm oil, which amounted to 25,400 million tonnes or 67.9% of total oils and fats imports.
Serbia’s palm oil imports grew from 17,100 million tonnes in 2009 to 25,400 million tonnes in 2014. Serbian companies
used palm oil more as a raw material for the production of confectionery products, products based on vegetable oils and
bakery products. According to the Serbian Chamber of Commerce and Industry, Serbia imported palm oil mainly from
Malaysia and Indonesia. In 2014, 4900 million tonnes were imported from Malaysia as compared to 2400 million tonnes
from Indonesia. This study showed a good sign for palm oil producers in Malaysia to increase palm oil exports to Serbia.
A study by Azriyah Azian (2016) also examined the opportunities for Malaysian Palm Oil in South-east Europe
by focusing on Croatia and Bosnia Herzegovina. South-east Europe consists primarily of the Balkan peninsula. The
population of Croatia and Bosnia are 4,220,055 and 3,799,467 respectively. The consumption of oils and fats in both
countries is likely to increase as the population increases. According to USDA 2015, the Croatia imports are a significant
portion of the food it consumes and the country is a mature market with well-established competition mainly from the
European Union. Croatia is mostly a price sensitive market. Meanwhile, Bosnia & Herzegovina imports around two-thirds
of its overall food needs. Processed food market in the Bosnia & Herzegovina focuses mainly on value rather than quality,
as consumers seek to extend their buying power. Food import tariffs are low as compared to the tariffs in other countries in
the region. Challenges to exporters include a complicated dual system of Government authorities, low income, and poor
infrastructure (USDA, 2017). It shows that, there are several opportunities to aim that market, with the palm oil advantages
(such as low price as compare to other edible oils), the palm oil exporter should focus on how to enter that market
especially in term of regulation.
Major edible oilseeds crops in these countries are sunflower oil similar to that of other Balkans countries,
followed by soyabean oil and rapeseed oil. However, production of oils and fats are insufficient to meet the domestic
demand in these countries. Thus, the shortages are supplemented by imports. Palm oil is the major imported oil and it is
mainly used in the food industry as shortening, vegetables fats and cocoa butter substitutes. The studies found some
challenges when marketing palm oil in the Balkans region due to import duty protection that is imposed on the local palm
oil buyers who source the oil outside Europe as compared to within Europe. Besides that, there is a competition in pricing
from European palm oil suppliers who are getting the supply of CPO either from Malaysia and Indonesia. These
companies have logistic advantages and are able to offer value-added products such as specialty fats and shortening to the
local market at cheaper prices. Despite having a low consumption of palm oil in Croatia and Bosnia as compared to other
European countries, there is a potential for palm olein and superolein for companies like Zvijezda, which sells frying oil
GALLEY P
ROOF
and specialty fats, especially like Vocar. This proves that Malaysian palm oil companies can still explore the potential in
this region.
Another recent study about palm oil demand studied by Yean and Dong (2014) elaborate the position of
Malaysian palm oil in the worlds market 2035. This study aimed to perform quantitative analysis on domestic supply and
demand outlook of Malaysia’s palm oil, including biodiesel demand, and its ability to supply to the global markets in 2035
in the context of restricted expansion of oil palm plantation area. Oil price increment along with the strong intention to
reduce greenhouse gas emissions in the transport sector has driven up demand for palm oil as an important raw material for
biofuel, owing largely to its price and productivity competitiveness as compared to other vegetable oils. Malaysia is known
as the world’s second top producer of palm oil, supplying about 12.8% of the global consumption of vegetable oils in 2009
and 2010. Malaysia exported more than 642,000 tonnes of palm biodiesel, mainly to Europe and USA. Nowadays,
Malaysia exported to more than 200 markets (Balu et al. 2018). The major consumed edible vegetable oil in Malaysia
during 1960 was coconut oil, which was 80% from the supplies of other vegetable oils. Beginning in the 1960s with the
expansion of commercial planting of palm oil, demand for oil palm increased in line with population growth and
consumers replace from coconut oil to palm oil. The study found that Malaysia was the leading exporter for palm oil and
an export tax structure that favored exports of palm oil products rather than CPO. Palm oil export is expected to increase to
23.3 million tonnes in 2035. Future increase on demand could be seen in year 2035 as palm oil would be the world’s
largest edible oil consumed. Therefore, producers need to focus on the role of palm oil globally in the food and biofuel
industry. Yield and process improvement has to be explored as an alternative to new oil palm plantations for further
increases in the production of palm oil. With an expected exportable palm oil surplus of over 23 million tonnes in 2035,
Malaysia will remain as the most competitive producer in the world of vegetable oils and biofuel markets.
Zakaria et al (2018) also studied about palm oil demand in Turkey using Autoregressive Distributed Lag (ARDL)
method for the period 1980 to 2015. The study looked deeper into factors that influenced the demand for palm oil in
Turkey in the long run. The study found that the price competitiveness was the main reason for the increasing demand for
palm oil in Turkey. These studies also found that price competitiveness, income, price of substitutes were also significant
influence demand for palm oil.
Amiruddin et.al (2005) examined the market potential and challenges for the Malaysian palm oil industry in
facing competition from other vegetable oils using Vector error correction model (VECM). The analysis was used to
distinguish the short and long term relationship between the vegetable oil price variables. These studies found that
soyabean oil and palm oil have become significant in influencing other vegetable oil prices. Palm oil was then the second
most produced vegetable oil after soyabean oil and had become a price leader for several vegetable oils. Palm oil
producing countries must co-operate and implement a stock intelligent mechanism to as not to allow key market players to
make profits.
METHODOLOGY
World palm oil import data from the Balkans peninsular during 2008-2016 was collected, the data is. GDP, population,
palm oil price and the Balkans palm oil import data used in this study based on the demand function. Annual data on
Malaysian palm oil exports to the Balkans were collected from the United Nations International Trade Statistics Database
(UN Comtrade). The Balkans’ palm oil importers are Bulgaria, Croatia, Greece and Romania.
ARDL BOUND TEST
For empirical analysis, this study firstly investigated the stationarity property of the study variables which is GDP,
population, palm oil price and the Balkans palm oil import by employing used unit root tests, which includes the
Augmented Dickey-Fuller (ADF) and the Phillips-Perron (PP) tests. If these variables are integrated to the order one (I(1)),
co-integration techniques can be used to model these long-run relationships. Hence, pre-testing for unit roots is often a first
step in co-integration modelling.
The study then employed the Autoregressive Distributed Lag (ARDL) bound testing approach to co-integration
developed by Pesaran et al. (2001) to verify the long-run relationships between the variables; GDP, population, palm oil
price and the Balkans palm oil import. This method was chosen for its advantages with small numbers of observation as
well as the fact that it can be applied irrespective of the order of integration, i.e., I(0) or I(1). In addition, the ARDL
method avoids the larger number of specifications to be made in the standard co-integration test. These include decisions
regarding the number of endogenous and exogenous variables (if any) to be included in the treatment of deterministic
elements, as well as the optimal number of lags to be specified. By employing the ARDL method, it is possible to have
different variables that have different optimal lags, which is impossible with the standard co-integration test. Moreover, the
model can be used with a limited sample data.
GALLEY P
ROOF
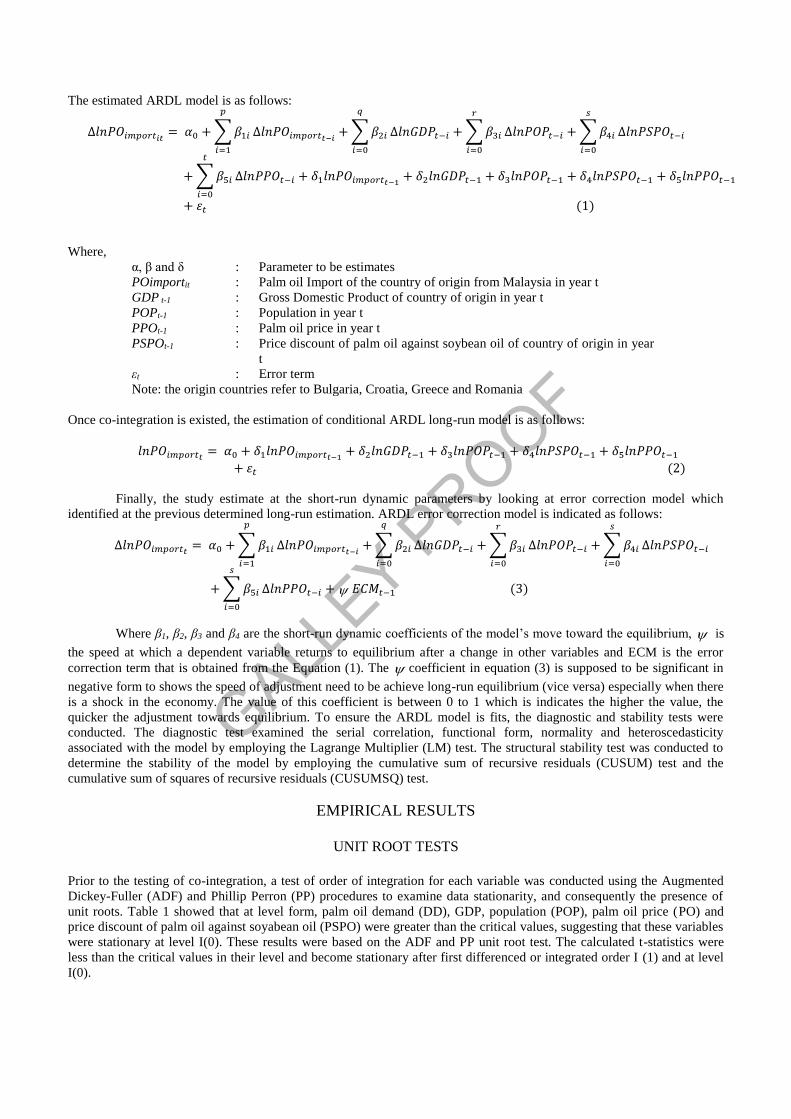
The estimated ARDL model is as follows:
∆𝑙𝑛𝑃𝑂𝑖𝑚𝑝𝑜𝑟𝑡𝑖𝑡= 𝛼0 + ∑ 𝛽1𝑖
𝑝
𝑖=1
∆𝑙𝑛𝑃𝑂𝑖𝑚𝑝𝑜𝑟𝑡𝑡−𝑖+ ∑ 𝛽2𝑖
𝑞
𝑖=0
∆𝑙𝑛𝐺𝐷𝑃𝑡−𝑖 + ∑ 𝛽3𝑖
𝑟
𝑖=0
∆𝑙𝑛𝑃𝑂𝑃𝑡−𝑖 + ∑ 𝛽4𝑖
𝑠
𝑖=0
∆𝑙𝑛𝑃𝑆𝑃𝑂𝑡−𝑖
+ ∑ 𝛽5𝑖
𝑡
𝑖=0
∆𝑙𝑛𝑃𝑃𝑂𝑡−𝑖 + 𝛿1𝑙𝑛𝑃𝑂𝑖𝑚𝑝𝑜𝑟𝑡𝑡−1+ 𝛿2𝑙𝑛𝐺𝐷𝑃𝑡−1 + 𝛿3𝑙𝑛𝑃𝑂𝑃𝑡−1 + 𝛿4𝑙𝑛𝑃𝑆𝑃𝑂𝑡−1 + 𝛿5𝑙𝑛𝑃𝑃𝑂𝑡−1
+ 휀𝑡 (1)
Where,
α, β and δ : Parameter to be estimates
POimportit : Palm oil Import of the country of origin from Malaysia in year t
GDP t-1 : Gross Domestic Product of country of origin in year t
POPt-1 : Population in year t
PPOt-1 : Palm oil price in year t
PSPOt-1 : Price discount of palm oil against soybean oil of country of origin in year
t
εt : Error term
Note: the origin countries refer to Bulgaria, Croatia, Greece and Romania
Once co-integration is existed, the estimation of conditional ARDL long-run model is as follows:
𝑙𝑛𝑃𝑂𝑖𝑚𝑝𝑜𝑟𝑡𝑡= 𝛼0 + 𝛿1𝑙𝑛𝑃𝑂𝑖𝑚𝑝𝑜𝑟𝑡𝑡−1
+ 𝛿2𝑙𝑛𝐺𝐷𝑃𝑡−1 + 𝛿3𝑙𝑛𝑃𝑂𝑃𝑡−1 + 𝛿4𝑙𝑛𝑃𝑆𝑃𝑂𝑡−1 + 𝛿5𝑙𝑛𝑃𝑃𝑂𝑡−1
+ 휀𝑡 (2)
Finally, the study estimate at the short-run dynamic parameters by looking at error correction model which
identified at the previous determined long-run estimation. ARDL error correction model is indicated as follows:
∆𝑙𝑛𝑃𝑂𝑖𝑚𝑝𝑜𝑟𝑡𝑡= 𝛼0 + ∑ 𝛽1𝑖
𝑝
𝑖=1
∆𝑙𝑛𝑃𝑂𝑖𝑚𝑝𝑜𝑟𝑡𝑡−𝑖+ ∑ 𝛽2𝑖
𝑞
𝑖=0
∆𝑙𝑛𝐺𝐷𝑃𝑡−𝑖 + ∑ 𝛽3𝑖
𝑟
𝑖=0
∆𝑙𝑛𝑃𝑂𝑃𝑡−𝑖 + ∑ 𝛽4𝑖
𝑠
𝑖=0
∆𝑙𝑛𝑃𝑆𝑃𝑂𝑡−𝑖
+ ∑ 𝛽5𝑖
𝑠
𝑖=0
∆𝑙𝑛𝑃𝑃𝑂𝑡−𝑖 + 𝐸𝐶𝑀𝑡−1 (3)
Where β1, β2, β3 and β4 are the short-run dynamic coefficients of the model’s move toward the equilibrium, is
the speed at which a dependent variable returns to equilibrium after a change in other variables and ECM is the error
correction term that is obtained from the Equation (1). The coefficient in equation (3) is supposed to be significant in
negative form to shows the speed of adjustment need to be achieve long-run equilibrium (vice versa) especially when there
is a shock in the economy. The value of this coefficient is between 0 to 1 which is indicates the higher the value, the
quicker the adjustment towards equilibrium. To ensure the ARDL model is fits, the diagnostic and stability tests were
conducted. The diagnostic test examined the serial correlation, functional form, normality and heteroscedasticity
associated with the model by employing the Lagrange Multiplier (LM) test. The structural stability test was conducted to
determine the stability of the model by employing the cumulative sum of recursive residuals (CUSUM) test and the
cumulative sum of squares of recursive residuals (CUSUMSQ) test.
EMPIRICAL RESULTS
UNIT ROOT TESTS
Prior to the testing of co-integration, a test of order of integration for each variable was conducted using the Augmented
Dickey-Fuller (ADF) and Phillip Perron (PP) procedures to examine data stationarity, and consequently the presence of
unit roots. Table 1 showed that at level form, palm oil demand (DD), GDP, population (POP), palm oil price (PO) and
price discount of palm oil against soyabean oil (PSPO) were greater than the critical values, suggesting that these variables
were stationary at level I(0). These results were based on the ADF and PP unit root test. The calculated t-statistics were
less than the critical values in their level and become stationary after first differenced or integrated order I (1) and at level
I(0).
GALLEY P
ROOF
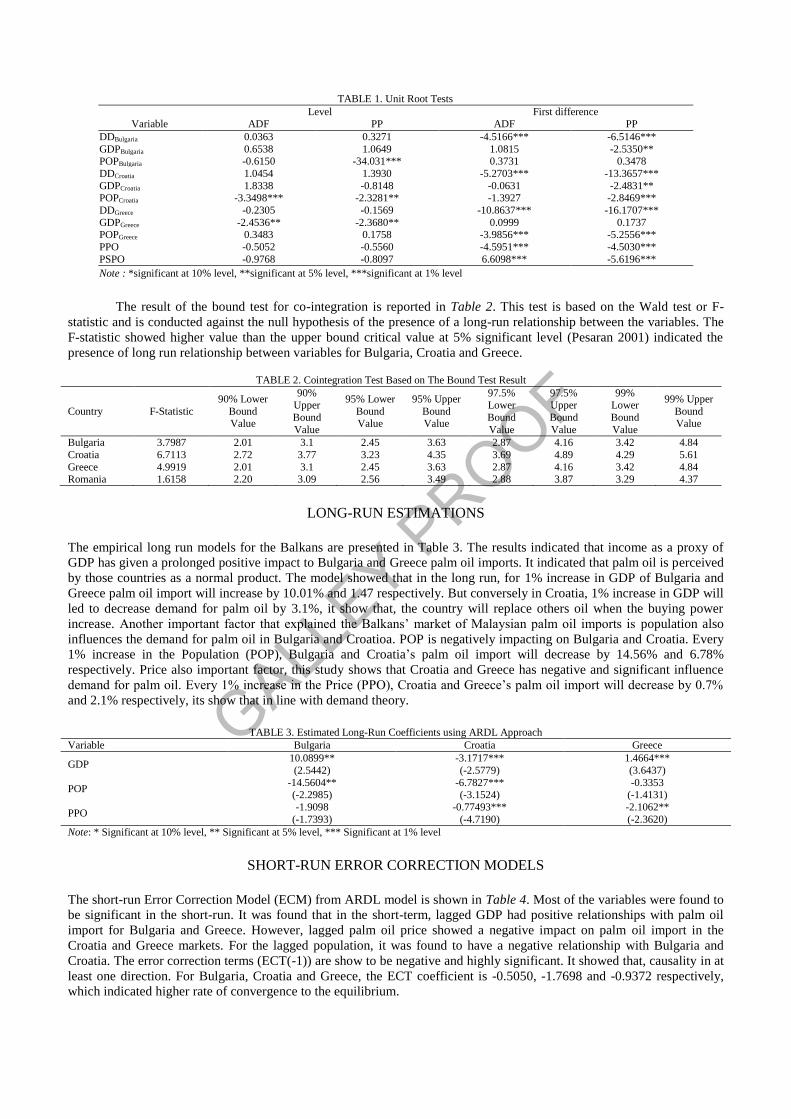
TABLE 1. Unit Root Tests
Level First difference Variable ADF PP ADF PP
DDBulgaria 0.0363 0.3271 -4.5166*** -6.5146***
GDPBulgaria 0.6538 1.0649 1.0815 -2.5350** POPBulgaria -0.6150 -34.031*** 0.3731 0.3478
DDCroatia 1.0454 1.3930 -5.2703*** -13.3657***
GDPCroatia 1.8338 -0.8148 -0.0631 -2.4831** POPCroatia -3.3498*** -2.3281** -1.3927 -2.8469***
DDGreece -0.2305 -0.1569 -10.8637*** -16.1707***
GDPGreece -2.4536** -2.3680** 0.0999 0.1737 POPGreece 0.3483 0.1758 -3.9856*** -5.2556***
PPO -0.5052 -0.5560 -4.5951*** -4.5030***
PSPO -0.9768 -0.8097 6.6098*** -5.6196***
Note : *significant at 10% level, **significant at 5% level, ***significant at 1% level
The result of the bound test for co-integration is reported in Table 2. This test is based on the Wald test or F-
statistic and is conducted against the null hypothesis of the presence of a long-run relationship between the variables. The
F-statistic showed higher value than the upper bound critical value at 5% significant level (Pesaran 2001) indicated the
presence of long run relationship between variables for Bulgaria, Croatia and Greece.
TABLE 2. Cointegration Test Based on The Bound Test Result
Country F-Statistic
90% Lower
Bound Value
90% Upper
Bound
Value
95% Lower
Bound Value
95% Upper
Bound Value
97.5% Lower
Bound
Value
97.5% Upper
Bound
Value
99% Lower
Bound
Value
99% Upper
Bound Value
Bulgaria 3.7987 2.01 3.1 2.45 3.63 2.87 4.16 3.42 4.84
Croatia 6.7113 2.72 3.77 3.23 4.35 3.69 4.89 4.29 5.61
Greece 4.9919 2.01 3.1 2.45 3.63 2.87 4.16 3.42 4.84 Romania 1.6158 2.20 3.09 2.56 3.49 2.88 3.87 3.29 4.37
LONG-RUN ESTIMATIONS
The empirical long run models for the Balkans are presented in Table 3. The results indicated that income as a proxy of
GDP has given a prolonged positive impact to Bulgaria and Greece palm oil imports. It indicated that palm oil is perceived
by those countries as a normal product. The model showed that in the long run, for 1% increase in GDP of Bulgaria and
Greece palm oil import will increase by 10.01% and 1.47 respectively. But conversely in Croatia, 1% increase in GDP will
led to decrease demand for palm oil by 3.1%, it show that, the country will replace others oil when the buying power
increase. Another important factor that explained the Balkans’ market of Malaysian palm oil imports is population also
influences the demand for palm oil in Bulgaria and Croatioa. POP is negatively impacting on Bulgaria and Croatia. Every
1% increase in the Population (POP), Bulgaria and Croatia’s palm oil import will decrease by 14.56% and 6.78%
respectively. Price also important factor, this study shows that Croatia and Greece has negative and significant influence
demand for palm oil. Every 1% increase in the Price (PPO), Croatia and Greece’s palm oil import will decrease by 0.7%
and 2.1% respectively, its show that in line with demand theory.
TABLE 3. Estimated Long-Run Coefficients using ARDL Approach
Variable Bulgaria Croatia Greece
GDP 10.0899**
(2.5442)
-3.1717***
(-2.5779)
1.4664***
(3.6437)
POP -14.5604** (-2.2985)
-6.7827*** (-3.1524)
-0.3353 (-1.4131)
PPO -1.9098
(-1.7393)
-0.77493***
(-4.7190)
-2.1062**
(-2.3620)
Note: * Significant at 10% level, ** Significant at 5% level, *** Significant at 1% level
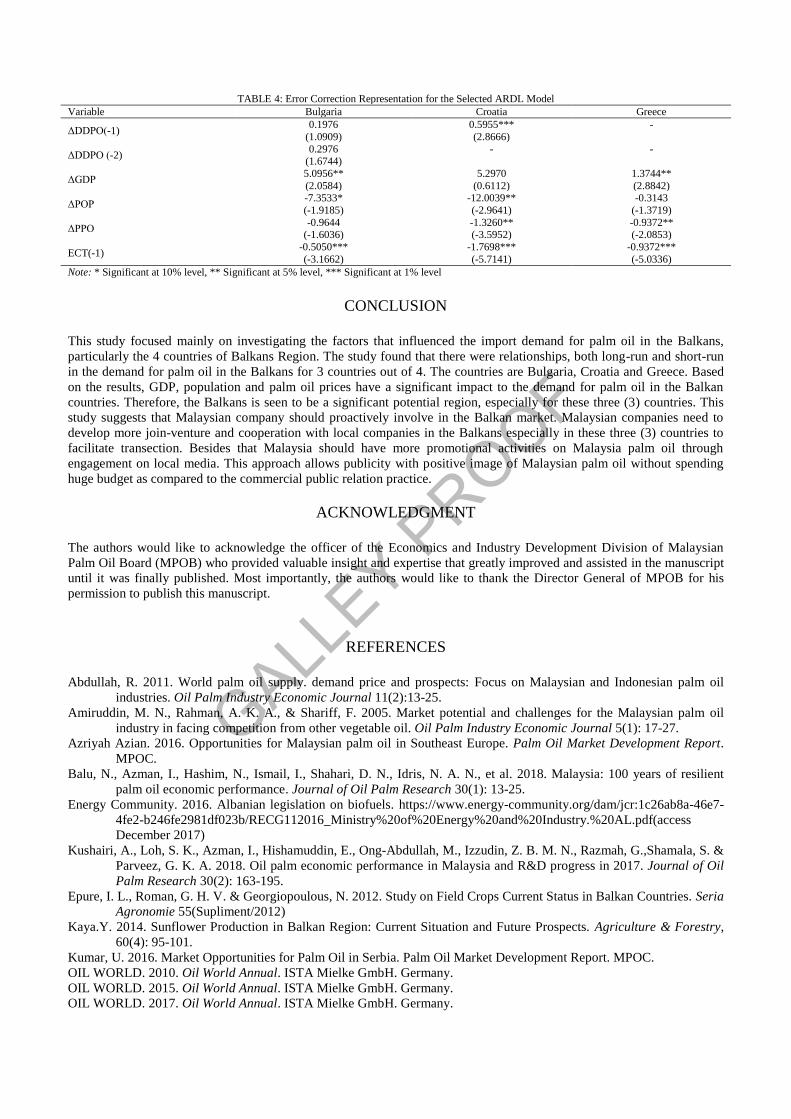
SHORT-RUN ERROR CORRECTION MODELS
The short-run Error Correction Model (ECM) from ARDL model is shown in Table 4. Most of the variables were found to
be significant in the short-run. It was found that in the short-term, lagged GDP had positive relationships with palm oil
import for Bulgaria and Greece. However, lagged palm oil price showed a negative impact on palm oil import in the
Croatia and Greece markets. For the lagged population, it was found to have a negative relationship with Bulgaria and
Croatia. The error correction terms (ECT(-1)) are show to be negative and highly significant. It showed that, causality in at
least one direction. For Bulgaria, Croatia and Greece, the ECT coefficient is -0.5050, -1.7698 and -0.9372 respectively,
which indicated higher rate of convergence to the equilibrium.
GALLEY P
ROOF
TABLE 4: Error Correction Representation for the Selected ARDL Model
Variable Bulgaria Croatia Greece
ΔDDPO(-1) 0.1976
(1.0909)
0.5955***
(2.8666)
-
ΔDDPO (-2) 0.2976
(1.6744) - -
ΔGDP 5.0956**
(2.0584)
5.2970
(0.6112)
1.3744**
(2.8842)
ΔPOP -7.3533*
(-1.9185)
-12.0039**
(-2.9641)
-0.3143
(-1.3719)
ΔPPO -0.9644
(-1.6036) -1.3260** (-3.5952)
-0.9372** (-2.0853)
ECT(-1) -0.5050***
(-3.1662)
-1.7698***
(-5.7141)
-0.9372***
(-5.0336)
Note: * Significant at 10% level, ** Significant at 5% level, *** Significant at 1% level
CONCLUSION
This study focused mainly on investigating the factors that influenced the import demand for palm oil in the Balkans,
particularly the 4 countries of Balkans Region. The study found that there were relationships, both long-run and short-run
in the demand for palm oil in the Balkans for 3 countries out of 4. The countries are Bulgaria, Croatia and Greece. Based
on the results, GDP, population and palm oil prices have a significant impact to the demand for palm oil in the Balkan
countries. Therefore, the Balkans is seen to be a significant potential region, especially for these three (3) countries. This
study suggests that Malaysian company should proactively involve in the Balkan market. Malaysian companies need to
develop more join-venture and cooperation with local companies in the Balkans especially in these three (3) countries to
facilitate transection. Besides that Malaysia should have more promotional activities on Malaysia palm oil through
engagement on local media. This approach allows publicity with positive image of Malaysian palm oil without spending
huge budget as compared to the commercial public relation practice.
ACKNOWLEDGMENT
The authors would like to acknowledge the officer of the Economics and Industry Development Division of Malaysian
Palm Oil Board (MPOB) who provided valuable insight and expertise that greatly improved and assisted in the manuscript
until it was finally published. Most importantly, the authors would like to thank the Director General of MPOB for his
permission to publish this manuscript.
REFERENCES
Abdullah, R. 2011. World palm oil supply. demand price and prospects: Focus on Malaysian and Indonesian palm oil
industries. Oil Palm Industry Economic Journal 11(2):13-25.
Amiruddin, M. N., Rahman, A. K. A., & Shariff, F. 2005. Market potential and challenges for the Malaysian palm oil
industry in facing competition from other vegetable oil. Oil Palm Industry Economic Journal 5(1): 17-27.
Azriyah Azian. 2016. Opportunities for Malaysian palm oil in Southeast Europe. Palm Oil Market Development Report.
MPOC.
Balu, N., Azman, I., Hashim, N., Ismail, I., Shahari, D. N., Idris, N. A. N., et al. 2018. Malaysia: 100 years of resilient
palm oil economic performance. Journal of Oil Palm Research 30(1): 13-25.
Energy Community. 2016. Albanian legislation on biofuels. https://www.energy-community.org/dam/jcr:1c26ab8a-46e7-
4fe2-b246fe2981df023b/RECG112016_Ministry%20of%20Energy%20and%20Industry.%20AL.pdf(access
December 2017)
Kushairi, A., Loh, S. K., Azman, I., Hishamuddin, E., Ong-Abdullah, M., Izzudin, Z. B. M. N., Razmah, G.,Shamala, S. &
Parveez, G. K. A. 2018. Oil palm economic performance in Malaysia and R&D progress in 2017. Journal of Oil
Palm Research 30(2): 163-195.
Epure, I. L., Roman, G. H. V. & Georgiopoulous, N. 2012. Study on Field Crops Current Status in Balkan Countries. Seria
Agronomie 55(Supliment/2012)
Kaya.Y. 2014. Sunflower Production in Balkan Region: Current Situation and Future Prospects. Agriculture & Forestry,
60(4): 95-101.
Kumar, U. 2016. Market Opportunities for Palm Oil in Serbia. Palm Oil Market Development Report. MPOC.
OIL WORLD. 2010. Oil World Annual. ISTA Mielke GmbH. Germany.
OIL WORLD. 2015. Oil World Annual. ISTA Mielke GmbH. Germany.
OIL WORLD. 2017. Oil World Annual. ISTA Mielke GmbH. Germany.
GALLEY P
ROOF
Pesaran M. H., Shin, Y., & Smith, R. J. 2001. Bounds Testing Approaches to the Analysis of Level Relationship. Journal
of Applied Econometrics 16(3): 289-326
UNCOMTRADE. 2018. United Nations Commodity Trade Statistic Data-Based Department of economic and Social
Affair / Statistic Devision, UN Comtrade. https://comtrade.un.org/data/ (accessed on December 2018)
USDA. 2015. Croatia: Exporter Guide. https://gain.fas.usda.gov/Recent%20GAIN% 20Publications/Exporter%20Guide_
Zagreb_Croatia_11-12-2015.pdf (accessed15 December 2017)
USDA. 2017. Bosnia and Herzegovina: Exporter Guide. https://www.fas.usda.gov/data/bosnia-and-herzegovina-exporter-
guide-2 (accessed 15 December 2017).
Yean, G. P. & Dong, L. Z. 2014. Econometric study on Malaysia’s palm oil position in the world market to 2035.
Renewable and Sustainable Energy Reviews 39(1): 740-747
Zakaria, K., N Balu, Baharin, N. M. & Rapiee, N. M. 2018. Demand for palm oil in Turkey. Oil Palm Industry Economic
Journal 17(2): 9-15.
Zulkifli, Y., Norziha, A., Naqiuddin M., Fadila, A. M., Nor Azwani, A. B., Suzana, M., et al. 2017. Designing the oil palm
of the future. Journal of Oil Palm Research 29(4): 440-445.
Kalsom Zakaria*
Malaysian Palm Oil Board
6 Persiaran Institusi
Bandar Baru Bangi,
43000 Kajang Selangor
MALAYSIA
E-mail: [email protected]
Jirsah A Bakar Kunchu
KDU University Collage Sdn. Bhd.
Ultropolis Glenmarie
Jalan Kontraktor U1/14 Seksyen U1
40150 Shah Alam Selangor
MALAYSIA
E-mail: [email protected]
Kamalrudin Mohamed Salleh
Malaysian Palm Oil Board
6 Persiaran Institusi
Bandar Baru Bangi
43000 Kajang Selangor
MALAYSIA
E-mail: [email protected]
Abdul Hafizh Mohd Azam
Faculty of Economics and Management
National University of Malaysia
43600 Bangi, Selangor
MALAYSIA
E-mail: [email protected]
Nur Ain Mohd Hassan
Malaysian Palm Oil Board
6 Persiaran Institusi
Bandar Baru Bangi
43000 KAJANG SELANGOR
MALAYSIA
E-mail: [email protected]
Balu Nambiappan
Malaysian Palm Oil Board
6 Persiaran Institusi
Bandar Baru Bangi
43000 Kajang Selangor