Embed Size (px)
Citation preview
769
The Journal of Economic History, Vol. 76, No. 3 (September 2016). © The Economic History Association. All rights reserved. doi:
Elisabeth Ruth Perlman is Ph.D. Candidate, Department of Economics, Boston University, 270 Bay State Road, Boston, MA 02215. E-mail: [email protected]. Steven Sprick Schuster is Assistant Professor, Department of Economics, Colgate University, 13 Oak Drive, Hamilton, NY, 13346. E-mail: [email protected].
We are extremely grateful to Laurent Bouton, Bob Margo, Carola Frydman, Daniele Paserman, Florian Ploeckl, Richard Baker, Claudio Ferraz, Debbie Goldschmidt, Nate Young, Briana Sprick Schuster, Peter Sims, Matt Berntsen, Ross Corliss, James Feigenbaum, anonymous referees, and numerous seminar participants for their helpful ideas, advice, and comments. All errors are our own.
Delivering the Vote: The Political Effect of Free Mail Delivery
in Early Twentieth Century AmericaElisabEth Ruth PERlman and stEvEn sPRick schustER
The rollout of Rural Free Delivery (RFD) in the early twentieth century dramatically increased the frequency with which rural voters received information. This article examines the effect of RFD on voters’ and Representatives’ behavior using a panel dataset and instrumental variables. Communities receiving more routes spread their votes to more parties; there is no evidence it changed turnout. RFD shifted positions taken by Representatives in line with rural constituents, including increased support for pro-temperance and anti-immigration policies. These results appear only in counties with newspapers, supporting the hypothesis that information flows play a crucial role in the political process.
“As the whole world has been drawn closer together by the inventions and uses of steam and electricity, so farmers may be drawn closer together by the universal practice of free delivery.”
—Matthew Williams of Verndale, Minnesota as quoted in the 1900 Yearbook of the United States Department of Agriculture
Changes to information flows affect the behavior of both the electorate and politicians. When deciding whether to vote and for whom to
vote, coordinating with other voters, and interacting with their elected officials, potential voters rely on information from candidates, media sources, and peers. However, information networks and access to mass media are usually endogenous to political activity, limiting researchers’ ability to identify settings through which to measure the causal effects of information on political outcomes. Rural Free Delivery (RFD), which introduced daily mail to millions of rural homes at the turn of the twen-tieth century, provides a unique opportunity to explore this relationship.

Perlman and Sprick Schuster770
The late nineteenth century and early twentieth century saw significant changes in how information was gathered and disseminated throughout the United States. The invention of the web rotary press made large-scale newspaper and magazine printing runs possible. The establishment of telegraph and telephone lines across the country increased the speed of interpersonal communication. These developments had great potential to affect the political process, as they changed the ability of individuals to acquire information, and of political candidates and parties to send messages to voters.
Advancements in information distribution were especially important for residents of rural areas, whose isolation was an acute concern for policy-makers.1 This isolation was notably apparent in rural residents’ lack of access to daily mail. Since 1863, city dwellers enjoyed either at-home mail delivery or close proximity to post offices, while rural residents had to travel several miles to the nearest post office. These concerns led to a push for the expansion of daily mail delivery to rural homes. Created on an experimental basis in 1896, and rolled out across the country during the first decade of the twentieth century, RFD changed the flow of informa-tion to rural communities and the information networks within them.
Any attempt to estimate the causal effect of voter information on polit-ical outcomes faces a severe endogeneity problem. People with more robust information networks will vote in different ways than will people with less robust information networks due to unobserved characteristics, instead of a causal effect of information. We address this problem in two ways. First, RFD caused an almost immediate change in the availability of information to individuals affected by the service, which allows us to use a panel dataset to control for time-invariant county characteris-tics. Second, any RFD route required approval by the United States Post Office, which required that routes be placed along roads that were pass-able year-round. We therefore use a set of instrumental variables that capture pre-existing road quality to estimate the causal effect of RFD on political activity. While these variables are related to levels in political activity, we show that they are not associated with trends in political activity, which, in the presence of time and place fixed effects, is our primary identifying assumption.
We find results consistent with the hypothesis that an increase in infor-mation to rural voters increases their political power. Though we can rule
1 In his 1903 Annual Message to Congress, President Theodore Roosevelt said, “Rural free delivery, taken in connection with the telephone, the bicycle, and the trolley, accomplishes much toward lessening the isolation of farm life and making it brighter and more attractive.”

The Political Effect of Free Mail Delivery 771
out a large effect of RFD on voter turnout in Congressional elections, we find that RFD routes increased the competitiveness of Congressional elec-tions and increased vote share for small parties (which in this era tended to support Populist causes). The observed effects are larger in communi-ties with daily newspapers, providing support to the hypothesis that RFD changed voting behavior primarily by changing the level of information available to voters. We also find a change in the behavior of elected offi-cials in response to RFD allocation. The policy positions of members of the House of Representatives shifted toward stances associated with rural communities, which were primary associated with Populist causes.
MOTIVATION
According to contemporary reports, RFD led to large changes in the amount of mail sent and received and total newspaper circulation. Increased mail affected the bidirectional flow of information, while higher newspaper circulation changed the dissemination of information. Each of these effects changed the structure of networks and information flows in rural communities, and could have changed the way in which voters reached their decisions and their relationships with their Congressional Representatives.
Matthew Gentzkow, Jesse M. Shapiro, and Michael Sinkinson (2011) showed that the entry of the first newspaper in a county led to a small but significant increase in voter turnout. Using data from a field experiment, Alan S. Gerber, Dean Karlan, and Daniel Bergan (2009) showed that people in Virginia who received a newspaper, regardless of its political slant, were 8 percent more likely to vote for a Democratic for governor in the 2005 elections.2 The expansion of local newspaper circulation asso-ciated with RFD affected the ability of rural voters to coordinate their votes behind individual parties or candidates, and to advocate for specific policies.3 Small parties, including the Greenback and Populist parties, advocated farmer-friendly policies, while the Grange continued to be a strong unofficial political player.4 RFD provided a mechanism through which these groups could more easily reach rural voters.
2 Prat and Strömberg (2011) surveys a number of other studies.3 The temperance movement was of specific interest to many of these smaller parties. The
Grange was involved in the temperance movement since at least 1874 (Buck 1913), and noted temperance advocate Mary Elizabeth Lease was an early Populist candidate.
4 The National Grange of the Order of Patrons of Husbandry, founded in 1867, became a powerful force in the 1870s when falling prices for agricultural goods provided incentive for farmers to organize. The Grange was a farmers’ organization run by local farm families, providing education, social events, and political advocacy on all manner of issues about which farmers cared.

Perlman and Sprick Schuster772
Research has consistently shown that social capital leads to an increased ability of voters to elicit favorable policies from elected officials. David Strömberg (2004) found that communities in the United States with increased access to radio broadcasts received greater relief funds from the federal government during the New Deal. In Strömberg’s model, when one group becomes better informed, politicians change their behavior by choosing policies favored by the better informed group. Within the context of RFD, this translates to a prediction that Representatives in Congressional districts that receive more routes would shift their posi-tions towards policies favored by rural communities.
Further supporting the idea that information about elected officials changes outcomes, Gentzkow, Edward L. Glaeser, and Claudia Goldin (2006) found the early twentieth century conversion of newspapers from being politically-affiliated to independent to be correlated with a decrease in political corruption. Using data from the late twentieth and early twenty-first century, Strömberg and James M. Synder (2010) showed that in areas where newspaper markets and Congressional districts poorly overlap, voters are less able to recognize their elected officials, who in turn appear to be less responsive to those constituents.
The motivation for such empirical work lies in voting models of imperfect information and models outlining the social motivation for voting. The importance of well-informed voters goes back to Nicolas de Condorcet’s Jury Theorem from 1785, which assumes that voters are well informed. In describing what they call the “Swing Voter’s Curse,” Timothy J. Feddersen and Wolfgang Pesendorfer (1996) illustrate the role of information on the potential voter’s decision to participate in an election and his ability to influence the behavior of others. The “Bandwagon Effect” described by Herbert A. Simon (1954), Roger J. Bowden (1987), and Albert Mehrabian (1998), predicts that people will become more inclined to vote for a candidate as the candidate’s odds of winning increase. Given that a voter’s perception of a candidate’s popu-larity with other voters most likely comes from media sources and polls, this too is a story of information.
In the political science literature, the concept of electoral connection (Mayhew 1974) argues that office-motivated politicians use policies to increase their chance of re-election. This connection is dependent on poten-tial voters being able to obtain information on their politicians’ actions. While David Mayhew’s focus was post-WWII politics, Jamie L. Carson and Jeffery A. Jenkins (2011) provide evidence that politicians throughout the period studied in our article were responsive to the will of voters.
This article contributes to two literatures: the relationship between information and political development, and historical studies of the effects

The Political Effect of Free Mail Delivery 773
of RFD. Wayne E. Fuller (1955, 1959, 1964) provides valuable historical context on the establishment of RFD, and several articles have used RFD to test economic or political science hypotheses. Daniel P. Carpenter (2000) investigated models of state building through several large-scale postal initiatives (including RFD), while Samuel Kernell (2001) consid-ered the effect of the individual political gains that members of Congress believed they would receive with the implementation of RFD during the Post Office’s transition from a system of patronage to a service. James Feigenbaum and Martin Rotemberg (n.d.) are studying the effect of RFD expansion of information on investment choices.
Research on the political economy effect of information and mass media includes the effect of newspapers (Gentzkow, Shapiro, and Sinkinson 2011; Chiang and Knight 2011), radio (Strömberg 2004), tele-vision (Enikolopov, Petrova, and Zhuravskaya 2009; DellaVigna and Kaplan 2007), and Internet (Falck, Gold, and Heblich 2014). Although RFD rapidly changed millions of individuals’ access to information, we are unaware of any research using RFD to explore causal effects of infor-mation acquisition on political outcomes, nor any that looks at how RFD affected the elected representatives’ policy positions.
RURAL FREE DELIVERY
While rural daily mail delivery is often taken for granted today, the disparity in service quality between rural and urban households in the late nineteenth century was large. While people living in cities enjoyed close proximity to post offices or direct home delivery, rural homes could only receive or send mail by traveling long distances. Even in the best condi-tions, a trip to the post office for someone who lived five miles away would likely entail three and a half hours of travel.5 Conditions were seldom ideal, making travel times much longer, and the mail itself was often delayed (Fuller 1964, p. 15).6 In periods of bad weather, families living on farms would sometimes go weeks without mail.
RFD was promoted as a way to address this disparity in postal service by bringing free daily mail to rural residents.7 Under the system, rural routes emanating from existing post offices were established and served daily by rural carriers. Any family wishing to be served by the system
5 Taking walking speed to be 3.18 miles an hour, the preferred human walking speed found by Browning et al. (2006) and slightly faster than the speed used in Google maps.
6 Rural roads in the time before the automobile were poor. Fuller notes that “only about seven percent of the nation’s roadways had been improved with gravel, shell, oil, or some other substance by 1906” (Fuller 1964, p. 180).
7 The service was “free” in the sense that in that there was no cost above postage.

Perlman and Sprick Schuster774
needed only to erect a weatherproof box along the route to receive mail. Early advocates of RFD highlighted its potential to alleviate the monotony of rural life. In 1900, Indiana State Senator Thomas J. Lindley wrote of RFD, “[the farmer] no longer feels the isolation of country life. I think the system will contribute largely to prevent the threatened congestion of population in our cities and towns” (Greathouse 1901).
The first high profile call for RFD came in 1891, from Postmaster General John Wanamaker.8 As Postmaster General he proposed a number of radical changes to the Post Office Department—government owner-ship of the telegraph and telephone lines, parcel post, and a postal savings bank—many of which angered established business interests (Fuller 1964, pp. 21, 24). Newspapers also saw the particular benefit to their business of RFD, and newspaper owners became strong promoters of the program (Fuller 1964, p. 21).
Wanamaker proposed that RFD’s feasibility be tested by the imple-mentation of limited delivery in a few rural towns (Fuller 1964, p. 18). Wanamaker’s successor, Wilson Bissell, opposed RFD in any form, and never used the fund allocated for Wanamaker’s plan (Fuller 1964, p. 33).9 In 1896, under Postmaster William Wilson, the first experimental routes (82 in all) were established (Fuller 1964, p. 39).
In Congress, RFD had broader support from Republicans than from Democrats. Kernell and Michael P. McDonald (1999) argue that polit-ical competition from the Populist Party drove Republican lawmakers to support RFD in the 1890s.10 When President William McKinley’s admin-istration took over in 1897, several RFD supporters were appointed to positions in the Post Office (Fuller 1964, p. 40). Assistant Postmaster Perry Heath and Superintendent of Free Delivery August W. Machen were politically savvy bureaucrats, and likely anticipated the pressure requests for routes would put on House members if they were sent to Representatives directly. Thus, in 1898 the Post Office formalized the mechanism for route allocation: communities wishing to receive a route were to petition their Representative, and route establishment required approval from both the Representative and Postmaster. Representatives were inundated with petitions from farm communities (Fuller 1964,
8 Wannamaker was the founder of a successful department store, and a staunch supporter of President Benjamin Harrison’s campaign.
9 The position of Postmaster General was an appointed member of the President’s Cabinet until 1971, and the position was often used as part of the system of patronage politics.
10 Democrats consistently argued that RFD was costly and unnecessary. In his 1894 Message, President Grover Cleveland argued, “[t]he estimated cost of rural free delivery generally is so very large that it ought not be considered in the current state of affairs.”

The Political Effect of Free Mail Delivery 775
p. 41). In the face of widespread constituent support for the program, even Representatives initially opposed to RFD were forced to support it (Carpenter 2000).
The 1903 Yearbook of the United States Department of Agriculture described the process of obtaining a route thus:
The delivery of mails by rural carriers is extended in response to petitions presented by the people desiring the service upon forms prepared by the Department...the route shall be from 20 to 25 miles in length…. and so adjusted that at least 100 domiciles shall be included in the service. Such a petition...is investigated by one of the special agents in the field, who transmits the papers, with a map of the route or routes to be followed, to the Superintendent in Washington for his adjudication.
These guidelines were determined by the feasibility and cost effective-ness of mail delivery and were the same as those outlined in 1898. One hundred families was deemed the minimum number of households neces-sary to justify a route, while 25 miles was viewed as the longest route mail carriers could reliably serve, and a route necessitated that roads were passable year-round (Fuller 1964, p. 182). These regulations applied equally to all communities; even if a town had the misfortune of featuring rough terrain or impassable roads, the Post Office did not exercise leni-ency in its decision to approve or reject a route. These official guidelines were largely unchanged during the duration of the rollout of RFD.11 It is important for our identification strategy that these guidelines were not determined by Representatives, whose motivations were political.
Facing mounting pressure from rural communities, Congress made RFD a permanent program in 1902. Rapid expansion of RFD followed quickly. Between 1900 and 1908, the number of RFD routes increased from 1,259 to 39,277. Though many communities were left unserved and some are unserved to this day, additional route allocation all but halted by 1908.12 By that year, more than 88 percent of routes that would ever be extant had been established (Kernell 2001). During the 1910 Postal Appropriations hearing, Fourth Assistant Postmaster General P.V. De Graw claimed that all communities qualifying for RFD under the 1898 guidelines had received routes, and that only a liberalization of the rules regarding the number of houses served would allow for further route allo-cation (Post Office Appropriation Bill 1912, p. 462). In 1909, facing a
11 In later years of the rollout (post-1904), the Post Office loosened the requirements to allow for routes serving as few as 60 families. However, this change appeared to be the results of increased Congressional funding and decreases in transportation costs.
12 The Post Office estimated in its 1916 report that 83 percent of the rural population was served in that year. Burlington, IL is a rural community that remains unserved today.

Perlman and Sprick Schuster776
deficit in the Treasury, President William Howard Taft ordered a dramatic cut in the Post Office budget, which made route creation significantly more difficult (Fuller 1964, p. 78). We omit the period of rollout for RFD (1901–1907), and only use the years before 1901 and after 1907 in our analysis.
In 1916 Congress passed legislation stating the goal of the postal service to “be extended so as to serve, as nearly as practicable, the entire rural population of the United States.”13 To move towards this goal, the post office codified the use of automobiles for RFD routes, and expanded the length of routes considerably. Our sample ends in 1916.
It was the contemporary belief that some were better able to secure new routes than others. Route allocation was correlated with a number of factors likely associated with different levels of political activity. Communities had to apply for routes; therefore, more motivated commu-nities would have received routes more quickly. Additionally, because routes required sponsorship by a Representative, the speed at which a community received a route was in part a function of Representative char-acteristics. RFD was seen as a Republican project, and many believed that the Post Office was more responsive to Republican requests, particu-larly Representatives facing competitive elections (Carpenter 2000).
To address this endogeneity problem, we use both place and time fixed effects and a set of instrumental variables. However, the inclusion of fixed effects will not provide unbiased estimates. Therefore, we use a set of instruments correlated with route allocation. In the presence of place fixed effects, our identifying assumption is that the instruments are uncorrelated with trends in our outcome variables.
EFFECT ON VOTERS
The estimation of the effect of RFD rollout on voter behavior proceeds in two parts: a fixed effects estimation and an instrumental variables estimation.
Fixed Effects Estimation
To understand how counties that received more RFD routes changed compared to those that received fewer, we use a fixed effects model with year and place fixed effects to control for time and place-invariant
13 Act of 28 July 1916, 39 Stat. 412, 423.

The Political Effect of Free Mail Delivery 777
characteristics. The basic specification for each of our county-level polit-ical outcomes is:
Yct = bRoutesct + gc + dt + µXct + uct , (1)
where Yct are our political outcomes, such as voter turnout; gc and dt are a set of county and year dummies; Xct is a vector of county characteris-tics: percent of the population living in communities of more than 2,500 people and the square of that value, the percent of farmland that was “improved,” the percent of non-white residents, the percent of white, foreign-born residents, the natural logarithm of the population, and dummies for the presence of Jim Crow voting laws, whether women had the right to vote, direct election in party primaries, and secret (Australian) ballots; Routesct is the number of routes in county c in year t. Therefore, b, the coefficient on the number of routes, is the estimate of the causal effect of RFD routes.14
As mentioned earlier, we eliminate the years 1901 to 1907 from our analysis. Additionally, we hold the number of routes in all years 1908 and later constant at their 1908 values, and all years 1900 and earlier fixed at their 1900 values.15 Due to the changes in the structure of the rural postal system after the 1916 legislation, we focus only on the five elections immediately following the rollout of RFD (1908–1916) and the five elections immediately before (1892–1900). Given the possibility of state-level shocks (such as Gubernatorial elections), we cluster standard errors at the state level.
Data
We compiled the county-level RFD route allocations using the 1908 U.S. Official Postal Guide, which listed the number of RFD routes emanating from each post office. This gives a measure of the intensity of RFD service within a county. This is, to our knowledge, the first attempt to compile statistics on the full allocation of routes. We also compiled the number of routes in 1900 for each county using the Report of the Postmaster General for the Fiscal Year Ended June 30, 1899. Since the official establishment of the RFD came in 1902, very few routes existed in 1900.
14 All percents are expressed as a number between 0 and 100.15 While some routes were created or expanded from 1908–1916, we argue that this was due
largely to population changes, which created new communities that satisfied the Post Office’s requirements for route allocation.

Perlman and Sprick Schuster778
Our voting data are from Jerome M. Clubb, William H. Flanigan, and Nancy H. Zingale (2006), which provides data on county-level voting in each year, including total number of votes, turnout, and vote share for most major and minor parties in elections for the House of Representatives.16 County characteristics data are from Michael Haines (2010). We used the method described in Richard Hornbeck (2010) to harmonize the county boundaries to their 1890 boundaries. In considering the behavior of elected officials, we use the DW-Nominate scores of Representatives (Poole and Rosenthal 2001), as well as their specific votes on temperance and immigration, two of the most decisive issues of the time. Biographical data on elected officials are from Carroll McKibbin (1997).
We constructed our newspaper dataset by supplementing an existing dataset by Gentzkow, Shapiro, and Sinkinson (2011), which provides circulation data on all English-language daily newspapers printed within a county, excluding professional or social publications. We added data on semi-weekly and three times weekly papers, using the N.W. Ayer and Son’s American Newspaper Annual. This variable does not provide perfect data on newspaper readership, as all newspapers are attributed to the printing county. However, Gentzkow, Shapiro, and Sinkinson (2011) estimated that more than 80 percent of current newspapers are read in the counties in which they were printed, and argue that this number is likely larger for our period of study.
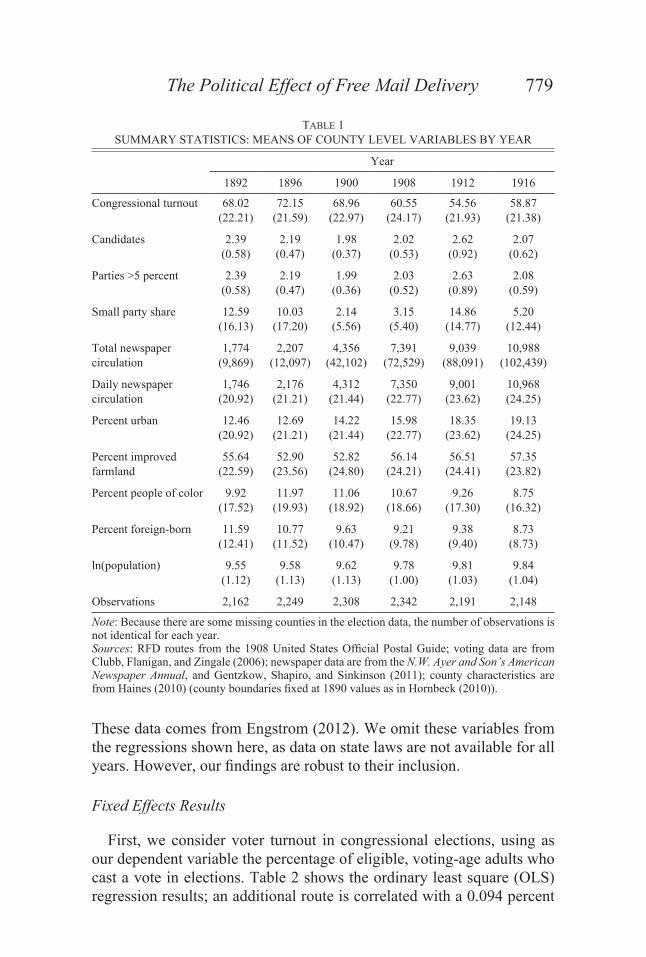
Table 1 shows the trends in most of our outcome and explanatory vari-ables.17 Voter turnout decreased and newspaper circulation increased significantly over our sample period. The increase in circulation was driven entirely by the expansion of daily papers (as expected from the work of Fuller (1964)). The average number of routes in 1908 was about 14, while 81 percent of all counties received at least one route.
This period featured a number of changes to voting procedures. As Erik J. Engstrom (2012) has shown, many of these changes affected the turnout of voters, and changes in electoral laws explain much of the decline in voter turnout in the late nineteenth and early twentieth century. Therefore, we include dummy variables for the presence of Jim Crow laws, secret (Australian) ballots, direct election in party primaries, and women’s suffrage. Additionally, in the Appendix, we include laws for office bloc ballots, party column ballots, and off-November elections.18
16 Senate seats were assigned by state legislatures until 1914, and are therefore omitted from this analysis. All Congressional election outcomes refer only to elections for the House of Representatives.
17 Although the table does not show statistics on mid-term election years, these years are included in our sample.
18 Bloc ballots are ballots in which candidates are grouped by the office they are seeking, making split-ticket voting easier. Party column ballots are ballots that groups candidates by parties.
The Political Effect of Free Mail Delivery 779
These data comes from Engstrom (2012). We omit these variables from the regressions shown here, as data on state laws are not available for all years. However, our findings are robust to their inclusion.
Fixed Effects Results
First, we consider voter turnout in congressional elections, using as our dependent variable the percentage of eligible, voting-age adults who cast a vote in elections. Table 2 shows the ordinary least square (OLS) regression results; an additional route is correlated with a 0.094 percent
tablE 1SUMMARY STATISTICS: MEANS OF COUNTY LEVEL VARIABLES BY YEAR
Year
1892 1896 1900 1908 1912 1916
Congressional turnout 68.02(22.21)
72.15(21.59)
68.96(22.97)
60.55(24.17)
54.56(21.93)
58.87(21.38)
Candidates 2.39(0.58)
2.19(0.47)
1.98(0.37)
2.02(0.53)
2.62(0.92)
2.07(0.62)
Parties >5 percent 2.39(0.58)
2.19(0.47)
1.99(0.36)
2.03(0.52)
2.63(0.89)
2.08(0.59)
Small party share 12.59(16.13)
10.03(17.20)
2.14(5.56)
3.15(5.40)
14.86(14.77)
5.20(12.44)
Total newspaper circulation
1,774(9,869)
2,207(12,097)
4,356(42,102)
7,391(72,529)
9,039(88,091)
10,988(102,439)
Daily newspaper circulation
1,746(20.92)
2,176(21.21)
4,312(21.44)
7,350(22.77)
9,001(23.62)
10,968(24.25)
Percent urban 12.46(20.92)
12.69(21.21)
14.22(21.44)
15.98(22.77)
18.35(23.62)
19.13(24.25)
Percent improved farmland
55.64(22.59)
52.90(23.56)
52.82(24.80)
56.14(24.21)
56.51(24.41)
57.35(23.82)
Percent people of color 9.92(17.52)
11.97(19.93)
11.06(18.92)
10.67(18.66)
9.26(17.30)
8.75 (16.32)
Percent foreign-born 11.59(12.41)
10.77(11.52)
9.63(10.47)
9.21(9.78)
9.38(9.40)
8.73(8.73)
ln(population) 9.55(1.12)
9.58(1.13)
9.62(1.13)
9.78(1.00)
9.81(1.03)
9.84(1.04)
Observations 2,162 2,249 2,308 2,342 2,191 2,148
Note: Because there are some missing counties in the election data, the number of observations is not identical for each year.Sources: RFD routes from the 1908 United States Official Postal Guide; voting data are from Clubb, Flanigan, and Zingale (2006); newspaper data are from the N.W. Ayer and Son’s American Newspaper Annual, and Gentzkow, Shapiro, and Sinkinson (2011); county characteristics are from Haines (2010) (county boundaries fixed at 1890 values as in Hornbeck (2010)).

Perlman and Sprick Schuster780
decrease in voter turnout in Congressional elections. However, this result is not precisely estimated. We also convert our route variable into a dummy variable equal to one if a county has a route, and zero other-wise. Receiving RFD at all is associated with a 2.70 percent, statistically significant, drop in voter turnout.
Next, we consider election competition. We constructed a set of vari-ables that measure the number of candidates who receive vote shares above certain thresholds. Since any threshold is arbitrary, we use several (5, 10, and 20 percent). We present only the results for the 10 percent threshold; other results are in an Online Appendix. We use this instead of the margin of victory, a more obvious measure of competitiveness. We do this because treatment (RFD routes) varies at the county level, while margins of victory vary only at the Congressional district level.
tablE 2FIXED EFFECTS RESULTS FOR VOTER OUTCOMES
(1) (2) (3) (4)
Variables Turnout Turnout >10 PercentSmall Party
Share
RFD routes –0.0935(0.0600)
0.00552***(0.00156)
0.113**(0.0441)
RFD dummy –2.679*(1.378)
Demographics Yes Yes Yes YesCounty F.E. Yes Yes Yes YesYear F.E. Yes Yes Yes Yes
Counties 2,403 2,403 2,403 2,403Observations 22,433 22,433 22,433 22,433R-squared 0.807 0.807 0.439 0.371
Standard errors, clustered at state level, in parentheses.* = Significant at the 10 percent level.** = Significant at the 5 percent level.*** = Significant at the 1 percent level.Additional controls include county and year fixed effects, the percent of the county that lives in an urban area and it’s square, the percent of the county’s farm land that is improved, the percent of the county that is not white, the percent of the county that is foreign born, the logarithm of the county’s population, and dummy variables indicating the presence of Jim Crow laws, women’s suffrage, secret ballots, and direct primaries.Sources: RFD routes from the 1908 United States Official Postal Guide; voting data are from Clubb, Flanigan, and Zingale (2006); newspaper data are from the N.W. Ayer and Son’s American Newspaper Annual, and Gentzkow, Shapiro, and Sinkinson (2011); county characteristics are from Haines (2010) (county boundaries fixed at 1890 values as in Hornbeck (2010)).

The Political Effect of Free Mail Delivery 781
This allows us to use within-district variation in RFD routes and political competitiveness.
The OLS regressions of RFD routes on the number of parties show that more routes are associated with broader support for parties, as seen in column 3 of Table 2. Counties that received more routes voted for a wider variety of parties.19 Regardless of the threshold, the coefficient on RFD routes is precisely estimated, with an additional route being asso-ciated with an increase in the number of competitive parties within a county by 0.0055.
To better understand these findings, we consider the cumulative vote share of small parties, which we identify as any party other than Republican and Democratic. Lower information transmission costs may be more beneficial to small parties, whose low visibility may have made it difficult to attract votes before the introduction of RFD. Additionally, voters’ ability to coordinate behind less visible candidates may have increased with the introduction of RFD.
The results are presented in column 4 of Table 2. The coefficient of 0.11 is statistically significant and means that a one standard deviation change in the number of routes is associated with a 0.12 standard devia-tion change in the vote share of small parties within a county. Taken along with the results from column 3, we can see that counties that received more routes changed their voting behavior by voting for a wider range of parties, to the benefit of smaller political parties.
Figure 1 shows the results of running a local polynomial smoothing on a number of voter outcomes by the number of RFD routes a county has in 1908. We consider the pre-rollout (1892–1900) and post-rollout (1908–1916) periods separately. Counties do not appear to differ in turnout between the pre- and post-rollout groups. However, counties with more routes show positive shifts in the values of the other outcome variables. Figure 2 plots the difference between the pre- and post-period averages of the residuals from the regression specified in equation (1). For all outcomes but turnout this figure shows a pattern in the differ-ences between the pre- and post-period averages that starts at zero for counties that received very few routes and that increases with number of routes. This suggests that routes are related to increases in the number of competitive parties, but not to levels of voter turnout.
Given the endogenous nature of route allocation, we cannot interpret the OLS estimates as unbiased; previous research suggests a downward
19 In the North an additional route is associated with a lower Democratic vote share and in the South with a lower Republican vote share. Overall a greater number of routes are associated with Populist and Progressive parties gaining vote share.

Perlman and Sprick Schuster782
bias to all of our estimates. Kernell and McDonald (1999) provide evidence that Representatives facing competitive elections prior to the establishment of RFD were more motivated to acquire routes for their districts. This echoes claims by Fuller (1964), who argued that motivated Representatives (especially Republicans) were able to obtain more routes leading up to contested elections. Voter turnout is typically higher in competitive elections, as is the number of competitive parties. This means that we should expect to see above average voter turnout and competi-tiveness in the years before RFD associated with high levels of route allocation. If these variables drop in the period after RFD, either because politicians have bought votes and reduced competition or because of regressions to the mean, OLS estimates will suffer from a downward bias.
Using a cross-section of our data (1908 values) we regressed the number of routes allocated to a county as a function of county charac-teristics and the level of election competition. We constructed a set of
FiguRE 1VOTER OUTCOMES VS. NUMBER OF RFD ROUTES IN 1908
Sources: RFD routes from the 1908 United States Official Postal Guide; voting data are from Clubb, Flanigan, and Zingale (2006); county characteristics are from Haines (2010) (county boundaries fixed at 1890 values as in Hornbeck (2010)).

The Political Effect of Free Mail Delivery 783
dummy variables, indicating whether a district had an election with a margin of victory of 20 percentage points or less or 10 points or less, in any of the three elections prior to the establishment of RFD (1896, 1898, 1900). Table 3 presents the results. Counties in competitive districts enjoyed between 0.84 and 1.27 more RFD routes, a 6 percent to 9 percent increase. These results support the claim of a downward bias in our OLS estimates.
There is a potential explanation for RFD to lead to a decrease in turnout. Kernell and McDonald (1999) point out that RFD routes elimi-nated thousands of fourth class post office positions. These were impor-tant patronage jobs, and postmasters were well-connected advocates for the Representative.20 To the extent that postmasters were able to mobi-lize voters for the incumbent, the introduction of RFD could lead to a decrease in the turnout of voters and an increase in electoral competi-tiveness in counties. However, instead of being a source of bias in our
FiguRE 2FIRST DIFFERENCES OF VOTER OUTCOMES VS. NUMBER OF RFD ROUTES IN 1908
Sources: RFD routes from the 1908 United States Official Postal Guide; voting data are from Clubb, Flanigan, and Zingale (2006); county characteristics are from Haines (2010) (county boundaries fixed at 1890 values as in Hornbeck (2010)).
20 In contrast mail carriers were hired through an apolitical civil-service system.

Perlman and Sprick Schuster784
fixed-effect estimates, this is a potential mechanism through which RFD could change our outcome variables.
RFD does not appear to be associated with observable economic agri-cultural variables. Regressing the number of routes on either the percent of farmland that is improved, or the acreage of farmland within a county, using the fixed-effects specification above, fails to find either economi-cally or statistically significant results. For example, one more RFD route is associated with a statistically insignificant 0.006 percent decrease in the percent of farmland that was improved. If the bias of our OLS esti-mates were due to omitted economic variables, we would expect RFD routes to be associated with observable economic variables as well.21
Instrumental Variables Estimation
To address the bias of fixed effects coefficients, we use two sets of instruments for the number of routes a county receives. In choosing suit-able instruments, we focus on the requirement that routes be along pass-able roads. The ability for communities to successfully petition for an RFD route was a function of the quality of roads over that time period.
21 We also looked for changes in the number of banks, using county-level numbers of banks in 1900 and 1910. We also fail to observe a relationship between RFD and bank growth.
tablE 3DETERMINANTS OF ROUTE ALLOCATION
(1) (2)Variables 20 Percent 10 PercentClose election 1.270**
(0.561)0.843*(0.479)
Demographics Yes YesState F.E. Yes Yes
Counties/observations 2,549 2,549R-squared 0.634 0.616
Standard errors, clustered the Congressional District level, in parentheses.* = Significant at the 10 percent level.** = Significant at the 5 percent level.*** = Significant at the 1 percent level.Additional controls include county and year fixed effects, the percent of the county that lives in an urban area and it’s square, the percent of the county’s farm land that is improved, the percent of the county that is not white, the percent of the county that is foreign born, the logarithm of the county’s population, and dummy variables indicating the presence of Jim Crow laws, women’s suffrage, secret ballots, and direct primaries.Sources: See Table 2.

The Political Effect of Free Mail Delivery 785
With the existence of place fixed effects, our goal is to find variables uncorrelated with trends in our outcome variables. Therefore, even if the instrumental variable is correlated with levels of political activity, it will fall into the place fixed effect, and will be uncorrelated with the error term in our second stage regression.
The first is county-level spending of roads and bridges in 1890. At that time, counties and townships bore the brunt of road funding (Fuller 1955). Because 1890 is well before the establishment of even the experimental RFD routes, it would have been impossible for county officials to have built roads in anticipation of preferential rural route allocation. Additionally, with the establishment of the Office of Road Inquiry, government responsibility for roads no longer fell on counties, so concerns of auto-correlation of county spending in years during our sample are minimized.
Our other instrument is a set of laws that outline the statutory environ-ment in each state at the onset of RFD route allocation. Between 1888 and 1895, almost every state passed numerous laws related to roads.22 These laws had lasting impacts on the ability of rural communities to establish roads. Therefore, these laws can be used as instruments for route alloca-tion. We use these state-level laws in combination with the county-level instruments.
The dataset on county-level spending on roads and bridges was constructed using the Report on Wealth, Debt, and Taxation.23 To deter-mine the state laws passed with regards to local road construction, we used a unique set of documents that provide data on laws passed by state legislatures in the period immediately before the establishment of the first RFD routes.24 We found that relevant legislation fell into one of the following categories:
1. Outlining road quality rules, or establishing an office of overseer.2. Establishment of road commissioners, or empowering county com-
missioners to govern roads; in smaller states this took the form of the establishment of state road offices.
3. Use of convict labor for road construction.4. Allocation of state money for road construction.
22 According to the Office of Road Inquiry, most state laws concerning the establishment of roads before 1885 were largely ineffectual.
23 Report on Wealth, Debt, and Taxation at the Eleventh Census, 1890: Valuation and Taxation.24 State Laws Relating to the Management of Roads: Enacted in 1888–1893, and State Laws
Relating to the Management of Roads: Enacted in 1894–1895, both published by the U.S. Department of Agriculture, Office of Road Inquiry.

Perlman and Sprick Schuster786
We constructed a dataset with four dummy variables, each equal to one if a state passed a law, and zero otherwise. Southern states, where poor road quality was continually noted as an impediment to the approval of peti-tions for RFD routes, had few laws governing the construction of roads. Most Midwestern states passed at least one law, while Western states were particularly proactive in passing legislation.
Thus, the first stage of our two stage least squares estimation is:
Routesct φ Spendingc * Postt + ηLawsc * Postt + dt + gc + bXct + ect , (2)
where Routesct is the number of routes in county c and year t; Lawsc is the set of law dummies; Spendingc is log of spending on roads in 1890; dt and gc are time and county fixed effects; Xct is the set of covariates used in our second stage. We interact each of our instruments with a Postt dummy variable, equal to one if the year is 1908 or after, and zero otherwise.
Table 4 shows the results for this regression, performed separately for county- and state-level variables. Increased spending on roads and bridges in 1890 is associated with increased RFD route allocation a decade later. Laws providing mechanisms for oversight and governance over the roads appears to increase the number of routes a county receives, laws allocating state funds, or the use of convict labor led to a decrease in the number of routes. These laws may have been aimed at the construc-tion of highways, and diverted resources away from rural roads. As the F-statistics show, our county-level instrument is sufficiently strong, but the set of state laws are too weak to be used as an instrument by itself.25 We use both county- and state-level instruments together in all instru-mental variable (IV) regressions.
Clearly, improved roads can affect rural life in several ways, including access to markets and travel times to urban centers, which may in turn affect political behavior completely independently of RFD. However, our instruments were chosen because they would have affected the quality of roads in both the pre- and post-rollout periods. If the effect of roads on our outcome variables is common in the pre- and post-rollout periods, it will be captured by the place fixed effect. This assumes that the instrumental variables do not place communities on different paths. Fortunately, this assumption can be evaluated, by looking for parallel trends in our outcome variables across different values of our instru-mental variables.
25 We will present the Kleibergen-Paap Wald statistic with our IV regressions.

The Political Effect of Free Mail Delivery 787
If the instruments are valid, time shocks should be similar across different values of the instrument. To test this, we separate our sample into counties that spend positive amounts on roads and bridges in 1890, and counties that spent nothing. Figure 3 shows that the behavior of coun-ties that spent positive amounts of money on roads and bridges appears to follow the same trends as counties that spent nothing.
tablE 4FIRST STAGE REGRESSION
Variables
(1)Instrument: Spending
(2)Instrument: State Laws
Road spending 0.000121***(0.0000385)
Oversight 2.713(2.35)
Governance 5.198*(2.949)
Convict labor –7.001***(2.497)
State money –6.865*(3.98)
F-stat. (excluded instruments) 9.93 3.56
Demographics Yes YesCounty/state F.E. Yes YesYear F.E. Yes Yes
Counties/states 2,403 43Observations 22,212 22,212R-squared 0.768 0.775
Standard errors, clustered at state level, in parentheses.* = Significant at the 10 percent level.** = Significant at the 5 percent level.*** = Significant at the 1 percent level.Additional controls include county and year fixed effects, the percent of the county that lives in an urban area and it’s square, the percent of the county’s farm land that is improved, the percent of the county that is not white, the percent of the county that is foreign born, the logarithm of the county’s population, and dummy variables indicating the presence of Jim Crow laws, women’s suffrage, secret ballots, and direct primaries.Sources: RFD routes from the 1908 United States Official Postal Guide; voting data are from Clubb, Flanigan, and Zingale (2006); newspaper data are from the N.W. Ayer and Son’s American Newspaper Annual, and Gentzkow, Shapiro, and Sinkinson (2011); county characteristics are from Haines (2010) (county boundaries fixed at 1890 values as in Hornbeck (2010)); spending are collected from the Report on Wealth, Debt, and Taxation (Upton 1895); state laws information are from Stone (1894, 1896).

Perlman and Sprick Schuster788
We see from the fixed effects results that urbanization had an impact on voting behavior, and it is possible that the instrumental variables changed the density of rural communities. Using the 1900 and 1910 censuses, we regressed the increase in the percent of population living in urban areas in a county on our instruments. We find that none of our instruments affect in the rate of urbanization, as the estimates fail to be statistically significant.
One well-documented drawback to using IV involves the “intent-to-treat,” which may limit the generalization of our findings. The effect that each of our instrumental variables may have on the allocation of routes depends on the region, climate, and a host of other factors. For example, the point estimate on spending on roads is positive in all regions of the country, but has a coefficient of 0.0000675 in Midwestern states and one that is more than 5.5 times higher (0.000372) in the South, though both point estimates are statistically significant.26 This may have been due to the flat land in the Midwest, which required less grading to be passable. In the South, an area where the Postal Service repeatedly denied many
FiguRE 3TRENDS, SPENDING
Sources: Voting data are from Clubb, Flanigan, and Zingale (2006); spending are collected from the “Report on Wealth, Debt, and Taxation” (Upton 1895).
26 Regions are using the five regions as defined in the census data.

The Political Effect of Free Mail Delivery 789
petitions for routes due to poor roads, government action may have had more of an impact in determining where routes were allocated. These results also provide assurance that the IV estimates do not violate the monotonicity assumption. As Joshua Angrist, Guido W. Imbens, and Donald B. Rubin (1996) show, in order for IV regressions to provide an estimate of the local average treatment effect, the instrument cannot affect two different groups in opposite ways. This means that increased road spending should only affect the number of routes a community receives by increasing that number (monotonicity). However, we observe road spending to lead to more routes in all geographic regions.
The results from the IV regression are presented in Table 5.27 Column 1 shows the results using voter turnout as the dependent variable. The nega-tive correlation seen in the OLS results disappears, and we now observe a
27 IV regressions were done using STATA’s xtivreg2 command (Schaffer 2010). Residual sum of squares is calculated using the structural equation, instead of the residuals for second-stage regression. Wooldridge (2006) warns against making statistical judgments from r-squared in IV regressions, since its value does not have the standard interpretation of the squared correlation coefficient.
tablE 5IV REGRESSION FOR VOTER OUTCOMES
(1) (2) (3)
Variables Turnout > 10 Percent Small Party Share
RFD routes 0.130(0.321)
0.0247***(0.00782)
0.831**(0.355)
F-stat. 10.4 10.4 10.4
Demographics Yes Yes YesCounty F.E. Yes Yes YesYear F.E. Yes Yes Yes
Counties 2,403 2,403 2,403Observations 22,212 22,212 22,212R-squared 0.147 –0.033 –0.107
Standard errors, clustered at state level, in parentheses.The cluster-robust Kleibergen-Paap Wald rk F statistic is reported.* = Significant at the 10 percent level.** = Significant at the 5 percent level.*** = Significant at the 1 percent level.Additional controls include county and year fixed effects, the percent of the county that lives in an urban area and it’s square, the percent of the county’s farm land that is improved, the percent of the county that is not white, the percent of the county that is foreign born, the logarithm of the county’s population, and dummy variables indicating the presence of Jim Crow laws, women’s suffrage, secret ballots, and direct primaries.Sources: See Table 4.

Perlman and Sprick Schuster790
positive coefficient. An additional route leads to a 0.13 percentage point increase in turnout, though this estimate is not precise.
The IV results for the number of parties receiving 10 percent of the vote, shown in column 2, match the OLS finding of a positive causal effect, and point estimates that are larger than those found in the OLS regressions. The point estimate of 0.0247 means that a one standard deviation increase in the number of routes leads to an increase of 0.55 in the number of parties competitive in an election. As before, we find a shift towards small parties with the rollout of RFD. The IV point estimate, 0.831, is very precisely estimated, and about 7.5 times larger than the OLS estimates. For all regressions, the Kleibergen-Paap Wald statistic is 10.4, indicating that weak instruments are not a concern with this specification.
We find that RFD increased competition, but failed to increase voter turnout in Congressional elections. For each of our measures of the distribution of votes across a county, the IV regressions are roughly consistent with the OLS findings, the point estimates are larger in the IV specification.
Because our treatment variable does not vary within the pre- and post-rollout time periods, an alternative specification to the fixed effects analysis described above is first-differences. One concern with the fixed effects analysis is that the accuracy of our estimates could derive from the numerous pre- and post-election observations for the same county, instead of from variation in the instrument or the number of routes. We calculate each variable by taking the average within a county over all elections held in 1908 and later, and subtracting from this value the average of all elec-tions held in 1900 and before. Results of the IV regressions are presented in an Online Appendix. The previous findings for the effect of RFD do not significantly change. The results are similar to those found in Table 5.
Potential Mechanisms
Up to this point, we have not made any attempt to disentangle the mechanisms through which RFD affected political behavior. RFD could have potentially changed political behavior because of increases in the mail, a decrease in the number of fourth class postmasters, or some other reason.28 Anecdotal evidence suggests that the introduction of rural routes
28 Parcel Post was introduced in 1913. To see if its introduction drove the observed effect, we restricted our sample to just the post-rollout years (1908–1916), and ran the IV regression using 1908–1912 as the pre-treatment sample and 1914–1916 as the post-treatment sample. If RFD had a stronger effect after parcel post, we would expect a positive coefficient on routes. We do not observe a positive effect.

The Political Effect of Free Mail Delivery 791
increased the circulation of newspapers. One of the first reports from local postal carriers on the effect of RFD included the following state-ment by a postal worker in Oregon (Department of Agriculture 1903):
Before free delivery was started there were 13 [subscriptions to] daily papers taken at Turner (OR) post office. Today there are 113. This shows that the farmers are getting in touch with the world and are quick to avail themselves of all educational facilities.
Using a dataset on newspapers, we find that one additional route is asso-ciated with a 1.77 percent increase in total newspaper circulation. The potential for newspapers to impact political behavior follows directly from their role as a conveyor of information about policy debates, news of social or political importance, and even candidates’ behavior. Newspapers provided a wealth of information about political activity. For example, over a five-day period in 1904, the Bemidji (MN) Daily Pioneer included stories about the Wisconsin Secretary of State completing the state’s ballot, an Indiana Senator speaking at Indiana University, and an illness contracted by a Minnesota gubernatorial candidate. Similarly, Kernell and Gary C. Jacobson (1987) show that late nineteenth century newspa-pers provided extensive coverage of the daily behavior of Congress.
To test the hypothesis that newspapers were an important mechanism through which RFD routes affected political behavior, we compared the impact of RFD in counties with and without newspapers by estimating each group separately.29 Table 6 shows that the causal effect of RFD is larger in counties with daily newspapers. The estimate for turnout is posi-tive in counties with newspapers, but mildly negative in counties without newspapers, though neither point estimate is statistically different from zero. For measures of competitiveness, the causal effect in counties with newspapers is at least four times as large as counties without newspa-pers, and though the point estimates for the vote share of small parties is similar in counties with and without newspapers (columns 5 and 9), it is only precisely estimated in counties with newspapers.30 If RFD only affected political behavior only through the impact of better roads (or any other mechanism that was independent of newspapers), we would expect the coefficient on the number of routes to be identical for both groups.
29 We do this instead of interacting our Route variable, because doing so would have required using both our Route variable and the interaction term as instrumented variables, significantly decreasing the power of our instruments. To ensure that our sub-samples do not change over time, we defined a county as having a newspaper only if it had a newspaper by 1900.
30 These results are strongest in the North in places with Republican papers.

Perlman and Sprick Schuster792
These results are suggestive, not conclusive, evidence that newspapers played a critical role in the political changes that occurred because of RFD.
If RFD led to changes in economic outcomes, these changes could in turn affect political outcomes. We find no evidence that RFD led to changes in observable economic variables for rural areas. Specifically, using both (1) the amount of farmland in a county (both as a level, and as a percentage of total area), and (2) the percent of improved farmland on farms, as our outcome variables in the IV regressions, we find that the number of routes has no effect on these outcomes. Using farmland as the outcome variable, the sign is negative but it is very imprecisely estimated, as it is when improved farmland is used as the outcome. RFD routes did not appear to have an effect on observable agricultural outcomes, providing further evidence that it was information, instead of some other mechanism, that is driving our results.
tablE 6EFFECTS BY NEWSPAPER PRESENCE FOR VOTER OUTCOMES
(1)Turnout
(2)Turnout
(3)> 10 percent
(4)> 10 percent
(5)Small Party
Share
(6)Small Party
Share
Newspaper No Yes No Yes No Yes
RFD routes –0.181(0.385)
0.0725(0.249)
0.00692(0.00941)
0.0287***(0.00754)
0.563(0.381)
0.577**(0.288)
F-stat. 14.28 10.1 14.28 10.1 14.28 10.1
Demographics Yes Yes Yes Yes Yes YesCounty F.E. Yes Yes Yes Yes Yes YesYear F.E. Yes Yes Yes Yes Yes Yes
Counties 1685 718 1685 718 1685 718Observations 15,214 6,998 15,214 6,998 15,214 6,998R-squared 0.181 0.138 0.035 –0.121 –0.015 –0.067
Standard errors, clustered at state level, in parentheses.The cluster-robust Kleibergen-Paap Wald rk F statistic is reported.* = Significant at the 10 percent level.** = Significant at the 5 percent level.*** = Significant at the 1 percent level.Additional controls include county and year fixed effects, the percent of the county that lives in an urban area and it’s square, the percent of the county’s farm land that is improved, the percent of the county that is not white, the percent of the county that is foreign born, the logarithm of the county’s population, and dummy variables indicating the presence of Jim Crow laws, women’s suffrage, secret ballots, and direct primaries.Sources: See Table 4.
The Political Effect of Free Mail Delivery 793
CONGRESSIONAL REPRESENTATIVES
With richer information networks, voters may select Representatives with different attributes, or they may elicit different actions from elected officials. We consider the potential effect that better-informed voters may have on Representatives. Voters may punish Representatives who act against the voters’ wishes, but will only do so if they are aware of the Representative’s actions. Therefore, if one subset of voters receives a positive shock in their access to information, we would expect to observe a shift in the policy positions of elected officials towards positions favor-able to this better-informed subset. We estimate the impact of RFD on both the overall policy positions of Representatives and their support of several specific policies.
Developed by Keith Poole and Howard Rosenthal, DW-Nominate assigns each member of the House of Representatives a score based on roll-call votes over two separate dimensions. The first dimension is inter-preted as the traditional liberal-conservative stances and will be the focus of our analysis. We use this score as our dependent variable in both the OLS and IV specifications above, along with a political party dummy variables. Because the DW-Nominate score only varies at the congres-sional district level, we aggregate each of our county-level variables up to the district level.31
We first consider what stances were typically associated with rural communities over our sample period. Figure 4 shows the correlation between the percentage of urban residents in a district, and the policy stances of elected officials. Even when controlling for party membership, Representatives of rural districts feature more negative DW-Nominate scores. Therefore, we would expect RFD routes to result in a negative shift in the policy scores of elected officials.
Columns 1 and 2 in Table 7 show the effect of routes on the policy decisions of Representatives. No strong correlation is observed in the OLS results. Our instrumental variable results, however, show strong causal effects. Districts with more RFD routes see negative shifts in the DW-Nominate scores of their elected officials. Because we included dummies for party affiliation, this result cannot be the result of shifts from one party to another. The point estimate for the IV regression of –0.00103, which is significant at the 5 percent level, indicates that a one
31 For counties that straddle more than one congressional district, we divided each variable into the number of districts into which the county was split, and distributed those values evenly across the districts.

Perlman and Sprick Schuster794
standard deviation change in the number of routes leads to a change of 0.68 standard deviations in the DW-Nominate score. This shift can be seen in Figure 4, which shows both the within-party means of DW-Nominate scores and the shift a one standard deviation change in the number of routes would cause from this mean. As a negative shift in DW-Nominate scores indicates more rural-friendly stances, an increased number of routes caused the elected officials to adopt policies more in line with rural voters.
To illustrate shifts in Representatives’ positions, we examine two issues that were particularly contentious in this period: pro-temperance policies and immigration restrictions. Pushes for immigration restric-tions and the prohibition of alcohol were tied to the Nativist movement, which sought to restrict the spread of foreign in-migration and culture in America. Nativists, who were frequently rural Protestants, often took aim at Irish Roman Catholics and Jewish Americans, for whom alcohol was part of their culture. Although support for both policies came from a variety of groups, support was systematically greater in rural areas (Engs 2003, p. 263).
FiguRE 4DW-NOMINATE SCORES VS. PERCENT URBAN
Sources: Data about elected officials from the DW-Nominate project; county characteristics are from Haines (2010).

The Political Effect of Free Mail Delivery 795
We chose these two issues for a number of reasons. First, unlike many hot topics of the time, they were salient through the whole period of 1892–1916.32 Second, immigration restrictions and temperance are also plausibly exogenous to the issue of RFD. One would not expect a person’s positions on either issue to be directly affected by either receiving or not receiving RFD, unlike policies dealing with infrastructure or agricultural subsidies.
tablE 7POLICY DECISIONS AND ROUTE ALLOCATION
Dependent Variable: Number of Votes For or Against
DW Nominate Temperance Immigration Restriction
Variables (1)DW
Nominate
(2)DW
Nominate
(3)Votes For
(4)Votes
Against
(5)Votes For
(6)Votes
Against
OLS IV IV IV IV IVRFD routes 0.000065
(0.000306)–0.00103**(0.000505)
0.0135***(0.00313)
–0.0123***(0.00284)
0.00916**(0.00398)
–0.00891*(0.00461)
F-stat. 6.81+ 3.91++ 3.91++ 5.03+++ 5.03+++
Demographics Yes Yes Yes Yes Yes YesCounty F.E. Yes Yes Yes Yes Yes YesYear F.E. Yes Yes Yes Yes Yes Yes
Districts 368 359 359 359 359 359Observations 2,795 2,785 2,053 2,053 2,053 2,053R-squared 0.703 0.153 0.047 0.031 0.206 –0.023
+ When standard errors are clustered at the district level the F statistic is 16.7.++ When standard errors are clustered at the district level the F statistic is 10.12.+++ When standard errors are clustered at the district level the F statistic is 13.42. Standard errors, clustered at state level, in parentheses.The cluster-robust Kleibergen-Paap Wald rk F statistic is reported.* = Significant at the 10 percent level.** = Significant at the 5 percent level.*** = Significant at the 1 percent level.Additional controls include county and year fixed effects, the percent of the county that lives in an urban area and it’s square, the percent of the county’s farm land that is improved, the percent of the county that is not white, the percent of the county that is foreign born, the logarithm of the county’s population, and dummy variables indicating the presence of Jim Crow laws, women’s suffrage, secret ballots, and direct primaries.Sources: See Table 4.
32 Monetary policy was debated during the early part of our period (e.g., William Jennings Bryan’s “Cross of Gold” speech). However, after the United States formally adopted the gold standard in 1900, Congress only called a few votes on these issues.

Perlman and Sprick Schuster796
During our sample period, Congress voted many times on these two issues. For example, the 62nd and 63rd Congresses voted on temper-ance-related issues three times in each Congress, while the 64th Congress voted six times. Not counting procedural votes, we observe 28 votes on immigration restrictions and 27 votes on temperance. The list of House floor votes and issue codes was taken from Poole and Rosenthal (2001). For each vote pertaining to temperance policies or immigration restric-tion, we used the Congressional Record to determine if a “yea” (or a “nay”) vote is a vote explicitly for or against, or if the voter was not clearly taking a position (i.e., a “present” vote).
Columns 3–6 of Table 7 examines the relationship between RFD routes and votes supporting temperance or immigration restrictions; the “for” columns estimate the effect of RFD on the number of times a Representative voted explicitly for a temperance-related policy, whereas the “against” columns estimate the effect of RFD on the number of times a Representative explicitly voted against a temperance-related policy.33 A one standard deviation increase in the number of RFD routes leads to 0.92 more votes for temperance and a decrease of 0.84 votes against it in a given district. The within-Representative increase in likelihood to vote for temperance explains about 40 percent of this within district change, with changes in the identity of the Representative explaining the rest. Similarly, Columns 5 and 6 examine the relationship between RFD routes and votes supporting immigration restriction. An increase of one standard deviation in the number of RFD routes leads to 0.63 more votes for immigration restrictions, and a decrease of 0.61 votes against immi-gration restrictions in a given district.
CONCLUDING REMARKS
Timely and affordable access to information is a major driver of both economic and political activity. In the late nineteenth and early twentieth century public information was largely conveyed through newspapers, making access to the public discourse contingent on timely and convenient access to the daily paper. The implementation of RFD dramatically increased rural America’s connection to the outside world, making it feasible to get daily news, and reducing the cost of private communication. Using data on the number of RFD routes in a county, we estimate the impact of access to information on voters’ and elected Representatives’ behavior. In doing so, we shed light on how increased information flows changed political outcomes by increasing political participation and voice for rural areas.
33 In each of these, absence from the vote or a “present” vote are coded as a zero.

The Political Effect of Free Mail Delivery 797
RFD significantly increased the consumption of daily newspapers. We estimate that there was a 25 percent increase in the circulation of newspa-pers in areas which received the service. The rural resident became better-informed of the political goings on far from his farm gate, increasing their effective voice as citizens. It made rural voters better informed about political issues, and about the range of available parties, allowing them to better select their preferred candidates.
Our results suggest that RFD had a substantial effect on the political behavior of rural citizens. While rural mail routes did not lead to an increase in voter turnout, it broadened the number of political parties able to appeal to rural voters. A one standard deviation change in routes led to 0.4 additional parties receiving a competitive percentage of the votes. RFD routes also increased the vote share for smaller political parties, many of which were advocating for policies in line with rural tastes. These results are driven largely by counties which had newspapers by 1900.
RFD allowed farmers to more effectively monitor their elected Representatives, leading to a more effective political voice for rural resi-dences. An increase of one standard deviation in routes led to a negative shift of 0.67 standard deviations in their Representative’s DW-Nominate score, moving it towards positions popular in rural areas. In terms of specific policies, a one standard deviation in RFD routes led to 0.9 more votes for temperance and 0.6 more votes for immigration restrictions. This suggests that support for several Populist causes that were taken up in the Progressive Era were strengthened by the existence of RFD.
Our results provide support to theories of political empowerment, as voters with increased access to mail and news elicit more favorable poli-cies from their elected officials. RFD, in increasing individuals’ access to information and newspapers, increased their social capital. The impor-tance of social capital on the development and evolution of democracies has been well established (Lipset 1959; Woolcock 2001), as has the role of information networks and access to mass media (Blair 2000). Through our study of RFD, we have been able to more fully explore the mecha-nisms through which this development occurs, and show the importance of information networks on the democratic process.
Appendix A: State Election LawsAppendix Table 1 replicates the results from Table 5, with the inclusion of three
state law variables: office block ballots, party column ballots, and off-November elec-tions. These variables were omitted from the primary regressions because data was not

Perlman and Sprick Schuster798
available for all years. The point estimates are similar to those shown in Table 5, though the estimates are not as precisely estimated. Regressions broken down by the presence of newspapers like those presented in Table 6 are not shown here, but are likewise similar.
Appendix B: Effects by RegionAppendix Table 2 shows our primary results split by region, presence of a paper and,
in the South, race composition of a county. At this level of disaggregation the instru-ment is often weak. The variables measuring competition are positive in the North East and Midwest in counties with papers. There is no statistically significant effect of RFD on these outcomes in the South Central region and the West, though the point estimates are large in counties with papers in the West. In the South there is a negative effect in counties with papers. RFD helped rural voters coordinate, through papers. In the South there is a negative effect of RFD for both turnout and competition, primarily in coun-ties with papers and with higher white populations. We also observe (not shown in the table) a drop in the vote share for the Republican party (and an increase in the vote share for the Democrats) in these largely white counties with newspapers. It appears that in the South, where the Democratic party is dominant (the average number of parties
aPPEndix tablE 1IV REGRESSION FOR VOTER OUTCOMES: ALL ELECTION LAWS
(1) (2) (3)
Variables Turnout > 10 Percent Small Party Share
RFD routes 0.0943(0.333)
0.0206**(0.00820)
0.719*(0.371)
F-stat. 10.7 10.7 10.7
Demographics Yes Yes YesCounty F.E. Yes Yes YesYear F.E. Yes Yes Yes
Counties 2,403 2,403 2,403Observations 21,663 21,663 21,663R-squared 0.154 0.002 –0.069
Standard errors, clustered at state level, in parentheses.*** p<0.01, ** p<0.05, * p<0.1Additional controls include county and year fixed effects, the percent of the county that lives in an urban area and it’s square, the percent of the county’s farm land that is improved, the percent of the county that is not white, the percent of the county that is foreign born, the logarithm of the county’s population, and dummy variables indicating the presence of Jim Crow laws, women’s suffrage, secret ballots, and direct primaries.Sources: See Table 4.

The Political Effect of Free Mail Delivery 799
aPPEndix tablE 2IV REGRESSION FOR VOTER OUTCOMES SPLIT BY REGION
(1) (2) (3) (4) (5) (6)No Paper Paper No Paper Paper No Paper Paper
NE NE MW MW South Central South Central
Turnout
RFD routes 0.527(0.725)
–0.289(0.201)
–0.0997(0.462)
0.108(0.394)
–1.802**(0.754)
–1.081***(0.257)
Number of parties with > 10 percent
RFD routes –0.00801(0.00759)
0.0193***(0.00209)
0.00923(0.00777)
0.0256**(0.0104)
0.0110(0.0116)
0.00559(0.00426)
Small party shareRFD routes –0.271
(0.232)0.429***(0.0541)
1.454***(0.446)
1.224**(0.525)
0.438(0.538)
0.469***(0.133)
Counties 76 138 647 372 591 97Wald-stat. 3.738 50.97 7.581 5.343 11906 54.75
(7) (8) (9) (10) (11) (12)<13 Percent Nonwhite >13 Percent NonwhiteNo Paper Paper No Paper Paper No Paper Paper
South South South South West West
Turnout
RFD routes
–0.467***(0.152)
–0.634***(0.243)
3.015(2.676)
0.773(1.226)
–3.327***(0.479)
–0.642**(0.266)
Number of parties with > 10 percentRFD routes
0.00476(0.00301)
–0.0130***(0.00456)
0.0181(0.0280)
–0.0258*(0.0138)
0.0568(0.104)
–0.00289(0.0144)
Small party shareRFD routes
0.214(0.150)
–0.350***(0.0726)
2.946(2.187)
0.365(0.846)
–1.987**(0.956)
–0.00193(0.474)
Counties 68 15 147 32 156 64Wald-stat. 33.91 2.141 7.350 11.46 101
Standard errors, clustered at state level, in parentheses.*** p<0.01, ** p<0.05, * p<0.1Additional controls include county and year fixed effects, the percent of the county that lives in an urban area and it’s square, the percent of the county’s farm land that is improved, the percent of the county that is not white, the percent of the county that is foreign born, the logarithm of the county’s population, and dummy variables indicating the presence of Jim Crow laws, women’s suffrage, secret ballots, and direct primaries.Sources: See Table 4.

Perlman and Sprick Schuster800
receiving 5 percent of the vote is less than 1.25), RFD lead to an increase in that domi-nance. Again, however, the low Wald statistics suggest that we should be cautious about claims.
REFERENCES
Angrist, Joshua D., Guido W. Imbens, and Donald B. Rubin. “Identification of Causal Effects Using Instrumental Variables.” Journal of the American Statistical Association 91, no. 434 (1996): 444–55.
Bemidji [MN] Daily Pioneer, 25 October 1904. Chronicling America: Historic American Newspapers, http://chroniclingamerica.loc.gov/.
Blair, Harry. “Participation and Accountability at the Periphery: Democratic Local Governance in Six Countries.” World Development 28, no. 1 (2000): 21–39.
Bowden, Roger J. “Repeated Sampling in the Presence of Publication Effects.” Journal of the American Statistical Association 82, no. 398 (1987): 476–84.
Raymond C. Browning, Emily A. Baker, Jessica A. Herron, et. al. “Effects of Obesity and Sex on the Energetic Cost and Preferred Speed of Walking.” Journal of Applied Physiology 100, no. 2 (2006): 390–98.
Buck, Solon Justus. The Granger Movement: A Study of Agricultural Organization and Its Political, Economic, and Social Manifestations, 1870–1880. Cambridge, MA: Harvard University Press, 1913.
Carpenter, Daniel. “State Building through Reputation Building: Coalitions of Esteem and Program Innovation in the National Postal System, 1883–1913.” Studies in American Political Development 14 (Fall 2000): 121–55.
Carson, Jamie L., and Jeffery A. Jenkins. “Examining the Electoral Connection across Time.” Annual Review of Political Science 14 (2011): 25–46.
Chiang, Chun-Fang, and Brian Knight. “Media Bias and Influence: Evidence from Newspaper Endorsements.” Review of Economic Studies 78, no. 3 (2011): 795– 820.
Clubb, Jerome M., William H. Flanigan, and Nancy H. Zingale. Electoral Data for Counties in the United States: Presidential and Congressional Races, 1840–1972 [Computer File]. 2006.
Condorcet, Nicolas de. Essay on the Application of Analysis to the Probability of Majority Decisions. Paris: 1785.
DellaVigna, Stefano, and Ethan Kaplan. “The Fox News Effect: Media Bias and Voting.” Quarterly Journal of Economics 122, no. 3 (2007): 1187–234.
Engs, Ruth C. The Progressive Era’s Health Reform Movement: A Historical Dictionary. Westport, CT: Praeger Publishers, 2003.
Engstrom, Erik J. “The Rise and Decline of Turnout in Congressional Elections: Electoral Institutions, Competition, and Strategic Mobilization.” American Journal of Political Science 56, no. 2 (2012): 373-86.
Enikolopov, Ruben, Maria Petrova, and Ekaterina Zhuravskaya. “Media and Political Persuasion: Evidence from Russia.” American Economic Review 101, no. 7 (2009): 3253–85.
Falck, Oliver, Robert Gold, and Stephan Heblich. “E-lections: Voting Behavior and the Internet.” American Economic Review 104, no. 7 (2014): 2238–65.
The Political Effect of Free Mail Delivery 801
Feddersen, Timothy J., and Wolfgang Pesendorfer. “The Swing Voter’s Curse.” American Economic Review 86, no. 3 (1996): 404–24.
Feigenbaum, James J., and Martin Rotemberg. “Information and Investment: Impacts of the Introduction of Rural Free Delivery.” Unpublished Manuscript, n.d.
Fuller, Wayne Edison. “Good Roads and Rural Free Delivery of Mail.” Mississippi Valley Historical Review 42, no. 1 (1955): 67–83.
_______. “The South and Rural Free Delivery of Mail.” Journal of Southern History 25, no. 4 (1959): 499–521.
_______. RFD: The Changing Face of Rural America. Bloomington, IN: Indiana University Press, 1964.
Gentzkow, Matthew, Edward L. Glaeser, and Claudia Goldin. “The Rise of the Fourth Estate: How Newspapers Became Informative and Why It Mattered.” In Corruption and Reform: Lessons from America’s Economic History, edited by Edward L. Glaeser and Claudia Goldin, 187–230. Chicago: University of Chicago Press, 2006.
Gentzkow, Matthew, Jesse M. Shapiro, and Michael Sinkinson. “The Effect of Newspaper Entry and Exit on Electoral Politics.” American Economic Review 101, no. 7 (2011), 2980–3018.
_______. Number and Circulation of US Daily Newspapers by City and Political Affiliation, 1869–2004 [Computer File]. 2012.
Gerber, Alan S., Dean Karlan, and Daniel Bergan. “Does the Media Matter? A Field Experiment Measuring the Effect of Newspapers on Voting Behavior and Political Opinions.” American Economic Journal: Applied Economics 1, no. 2 (2009): 35–52.
Greathouse, Charles H. “Free Delivery of Rural Mails.” In Yearbook of the Department of Agriculture 1900, 513–528 Washington, D.C.: GPO, 1901.
Haines, Michael R. Historical, Demographic, Economic, and Social Data: The United States, 1790–2002 [Computer File]. 2010.
Hornbeck, Richard. “Barbed Wire: Property Rights and Agricultural Development.” Quarterly Journal of Economics 125, no. 2 (2010): 767–810.
Kernell, Samuel. “Rural Free Delivery as a Critical Test of Alternative Models of American Political Development.” Studies in American Political Development 15, no. 1 (2001): 103–12.
Kernell, Samuel, and Gary C. Jacobson. “Congress and the Presidency as News in the Nineteenth Century.” Journal of Politics 49 (1987): 1016–35.
Kernell, Samuel, and Michael P. McDonald. “Congress and America’s Political Development: The Transformation of the Post Office from Patronage to Service.” American Journal of Political Science 43, no. 3 (1999): 792–811.
Lipset, Seymour Martin. “Some Social Requisites of Democracy: Economic Development and Political Legitimacy.” American Political Science Review 53, no. 1 (1959): 69–105.
Mayhew, David. The Electoral Connection. New Haven, CT: Yale University Press, 1974.
McKibbin, Carroll. Roster of United States Congressional Officeholders and Biographical Characteristics of Members of the United States Congress, 1789–1996: Merged Data [Computer File]. 1997.

Perlman and Sprick Schuster802
Mehrabian, Albert. “Effects of Poll Reports on Voter Preferences.” Journal of Applied Social Psychology 28, no. 23 (1998): 2119–30.
N. W. Ayer & Son. N. W. Ayer & Son’s American Newspaper Annual: Containing a Catalogue of American Newspapers, a List of All Newspapers of the United States and Canada. Philadelphia, PA: N. W. Ayer & Son, 1900.
Poole, Keith T., and Howard Rosenthal. “D-Nominate After 10 Years: A Comparative Update to Congress: A Political-Economic History of Roll-Call Voting.” Legislative Studies Quarterly 26, no. 1 (2001): 5–29.
Post Office Department. Rural Free Delivery: Its History and Development. Extracts from the Annual Report of First Assistant Postmaster-General Perry S. Heath for the Fiscal Year Ended June 30, 1899. Washington, D.C.: GPO, 1899.
Post Office Department. United States Official Postal Guide. Albany, NY: J. B. Lyon Company, Printers, 1908.
Prat, Andrea, and David Strömberg. “The Political Economy of Mass Media.” Unpublished Manuscript, February 2011.
Schaffer, Mark E. xtivreg2: Stata Module to Perform Extended IV/2SLS, GMM and AC/HAC, LIML and k-class Regression for Panel Data Models [Computer File]. 2010.
Simon, Herbert A. “Bandwagon and Underdog Effects and the Possibility of Election Predictions.” Public Opinion Quarterly 18, no. 3 (1954): 245–53.
Stone, Roy. State Laws Relating to the Management of Roads Enacted in 1888–1893. U.S. Department of Agriculture. Washington, D.C.: GPO, 1894.
_______. State Laws Relating to the Management of Roads Enacted in 1894–1895. U.S. Department of Agriculture. Washington, D.C.: GPO, 1896.
Strömberg, David. “Radio’s Impact on Public Spending.” Quarterly Journal of Economics 119, no. 1 (2004): 189–221.
Strömberg, David, and James M. Synder. “Press Coverage and Political Accountability.” Journal of Political Economy 118, no. 2 (2010): 355–408.
Upton, Jacob Kendrick. Report on Wealth, Debt and Taxation at the Eleventh Census, 1890. Part II: Valuation and Taxation. Washington, D.C.: GPO, 1895.
U.S. Committee on the Post Office and Post Road. Post Office Appropriation Bill. Post Office Appropriation Bill, 1912: Hearings Before The Committee On The Post Office And Post Roads, House Of Representatives. December, 1910. Washington, D.C.: GPO, 1912.
U.S. Department of Agriculture. “Appendix: Free Delivery of Rural Mails.” In Yearbook of the Department of Agriculture, 1902, 746–47. Washington, D.C.: GPO, 1903.
Woolcock, Michael. “The Place of Social Capital in Understanding Social and Economic Outcomes.” Canadian Journal of Policy Research 2, no. 1 (2001): 11–17.
Wooldridge, Jeremy M. Econometric Analysis of Cross Section and Panel Data. Cambridge, MA: MIT Press, 2006.