Embed Size (px)
Citation preview

2011 ANNUAL REPORT
DELivERiNgGrowth
ATWOOD OCEA
NICS, IN
C. 2
011 A
nn
UA
l ReP
OR
T
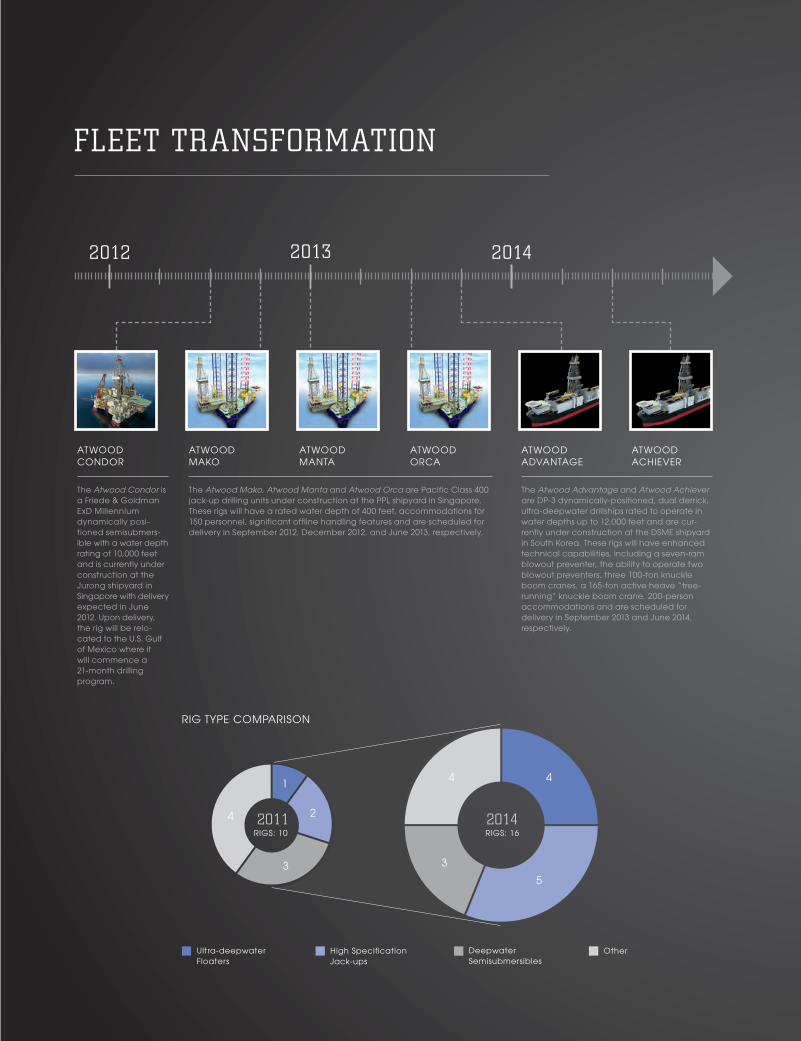
FLEEt trANSFormAtIoN
ATWOOD MAKO
ATWOOD MAnTA
ATWOOD COnDOR
ATWOOD ORCA
ATWOOD ACHIeVeR
ATWOOD ADVAnTAGe
RIG TYPE COMPARISON
Ultra-deepwater Floaters
Deepwater Semisubmersibles
High SpecificationJack-ups
Other
RIGS: 10 RIGS: 16
1
4 2
3
2011
4
5
4
3
2014
The Atwood Condor is a Friede & Goldman exD Millennium dynamically posi-tioned semisubmers-ible with a water depth rating of 10,000 feet and is currently under construction at the Jurong shipyard in Singapore with delivery expected in June 2012. Upon delivery, the rig will be relo-cated to the U.S. Gulf of Mexico where it will commence a 21-month drilling program.
The Atwood Mako, Atwood Manta and Atwood Orca are Pacific Class 400 jack-up drilling units under construction at the PPl shipyard in Singapore. These rigs will have a rated water depth of 400 feet, accommodations for 150 personnel, significant offline handling features and are scheduled for delivery in September 2012, December 2012, and June 2013, respectively.
The Atwood Advantage and Atwood Achiever are DP-3 dynamically-positioned, dual derrick, ultra-deepwater drillships rated to operate in water depths up to 12,000 feet and are cur-rently under construction at the DSMe shipyard in South Korea. These rigs will have enhanced technical capabilities, including a seven-ram blowout preventer, the ability to operate two blowout preventers, three 100-ton knuckle boom cranes, a 165-ton active heave “tree-running” knuckle boom crane, 200-person accommodations and are scheduled for delivery in September 2013 and June 2014, respectively.
2012 2013 2014
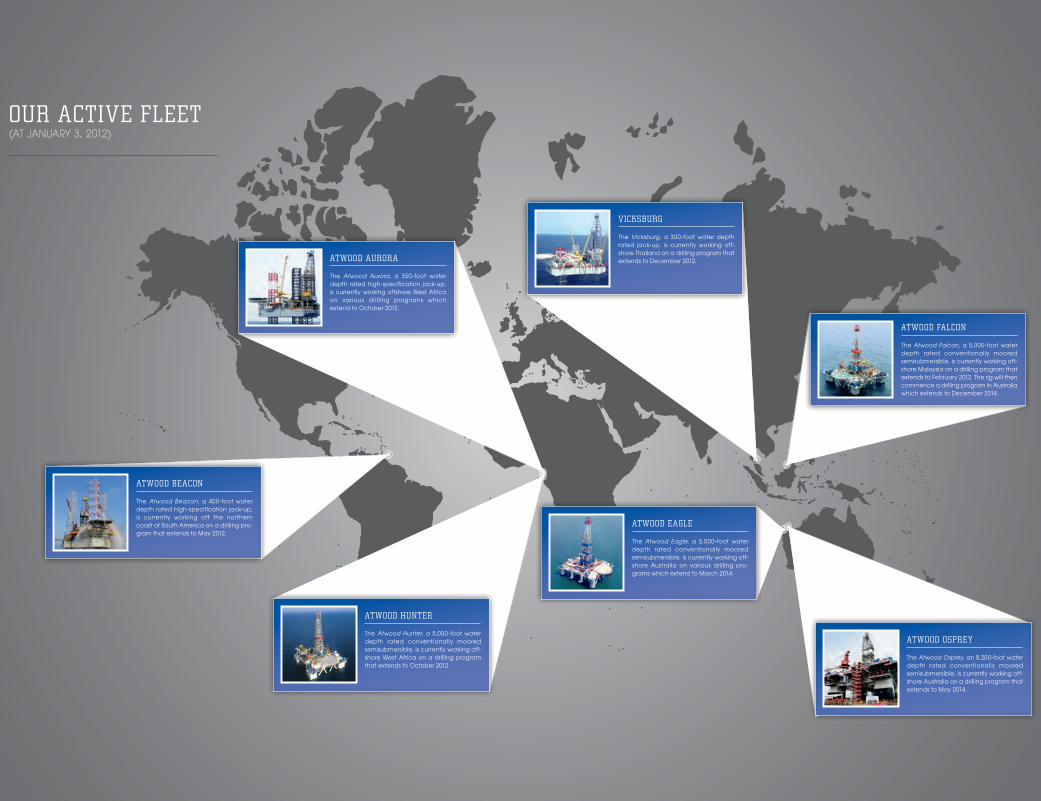
our ActIvE FLEEt(AT jANUARy 3, 2012)
AtwooD AurorA
The Atwood Aurora, a 350-foot water depth rated high-specification jack-up, is currently working offshore West Africa on various dri l l ing programs which extend to October 2012.
AtwooD BEAcoN
The Atwood Beacon, a 400-foot water depth rated high-specification jack-up, is currently working off the northern coast of South America on a drilling pro-gram that extends to May 2012.
vIckSBurG
The Vicksburg, a 300-foot water depth rated jack-up, is currently working off-shore Thailand on a drilling program that extends to December 2012.
AtwooD FALcoN
The Atwood Falcon, a 5,000-foot water depth rated conventionally moored semisubmersible, is currently working off-shore Malaysia on a drilling program that extends to February 2012. The rig will then commence a drilling program in Australia which extends to December 2014.
AtwooD oSprEy
The Atwood Osprey, an 8,200-foot water depth rated conventionally moored semisubmersible, is currently working off-shore Australia on a drilling program that extends to May 2014.
AtwooD EAGLE
The Atwood Eagle, a 5,000-foot water depth rated conventionally moored semisubmersible, is currently working off-shore Australia on various drilling pro-grams which extend to March 2014.
AtwooD huNtEr
The Atwood Hunter, a 5,000-foot water depth rated conventionally moored semisubmersible, is currently working off-shore West Africa on a drilling program that extends to October 2012.
Ann
ual R
ep
ort
De
sig
n b
y C
urra
n &
Co
nno
rs, I
nc. /
ww
w.c
urra
n-c
onn
ors
.co
m
REVENUESin millions
2011
$700
$600
$500
$400
$300
$200
$100
020102009200820072006
NET INCOMEin millions
2011
$300
$250
$200
$150
$100
$50
020102009200820072006
CAPITAL EXPENDITURESin millions
2011
$600
$500
$400
$300
$200
$100
020102009200820072006
SHAREHOLDERS’ EQUITYin millions
2011
$1,800
$1,600
$1,400
$1,200
$1,000
$800
$600
$400
$200
020102009200820072006
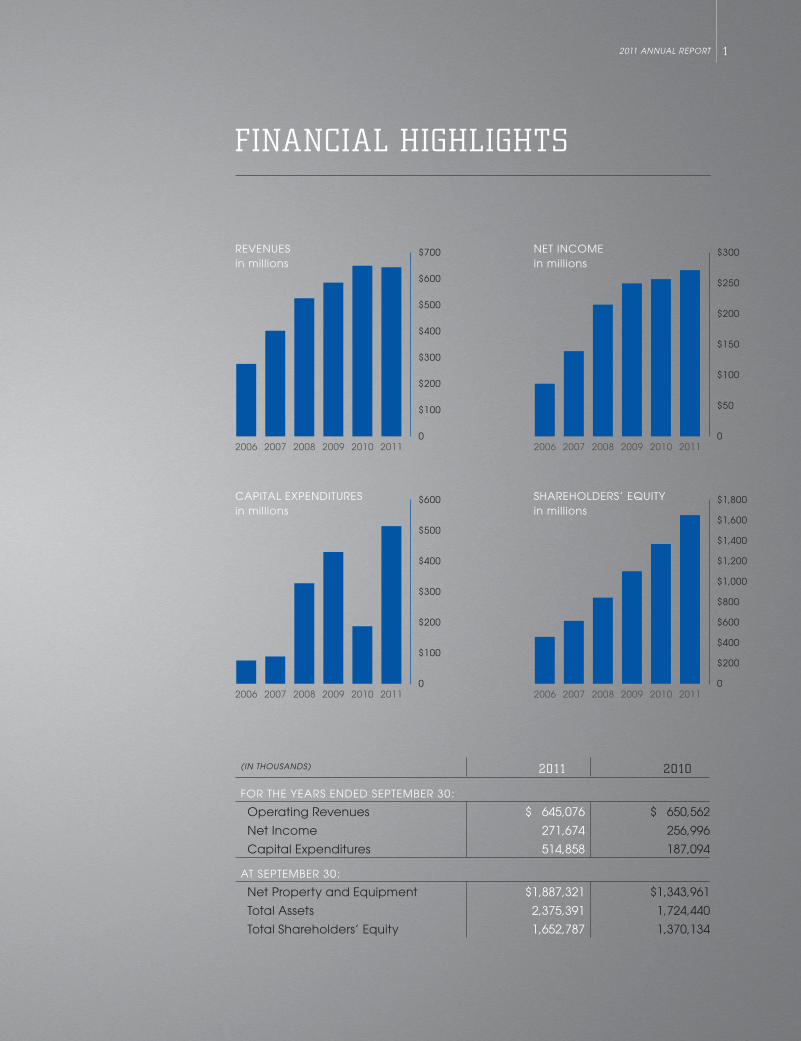
financial highlights
2011 annual report 1
(in thousands) 2011 2010
For the years ended september 30:
operating revenues $ 645,076 $ 650,562
net Income 271,674 256,996
Capital expenditures 514,858 187,094
at september 30:
net property and equipment $ 1,887,321 $ 1,343,961
total assets 2,375,391 1,724,440
total shareholders’ equity 1,652,787 1,370,134
226567_CNC_Narr.indd 1 1/6/12 5:26 AM
atwood oceanics, inc.2
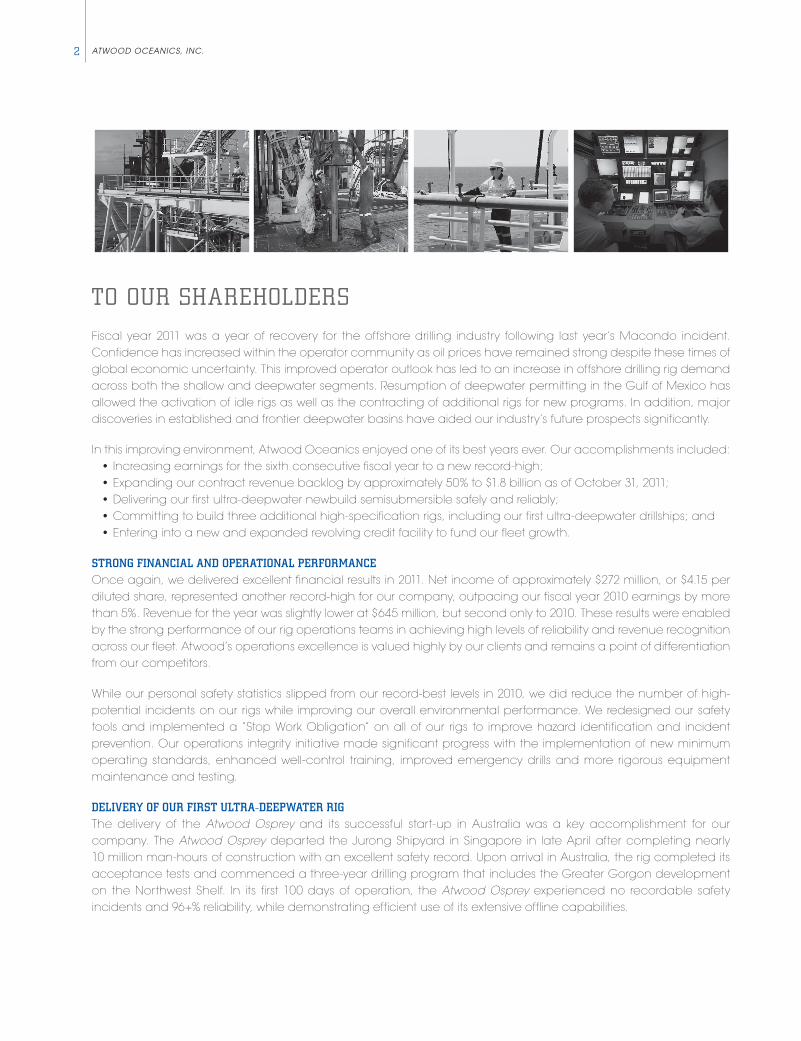
to our shareholders
Fiscal year 2011 was a year of recovery for the offshore drilling industry following last year’s Macondo incident. Confidence has increased within the operator community as oil prices have remained strong despite these times of global economic uncertainty. This improved operator outlook has led to an increase in offshore drilling rig demand across both the shallow and deepwater segments. Resumption of deepwater permitting in the Gulf of Mexico has allowed the activation of idle rigs as well as the contracting of additional rigs for new programs. In addition, major discoveries in established and frontier deepwater basins have aided our industry’s future prospects significantly.
In this improving environment, Atwood Oceanics enjoyed one of its best years ever. Our accomplishments included: • Increasing earnings for the sixth consecutive fiscal year to a new record-high; • Expanding our contract revenue backlog by approximately 50% to $1.8 billion as of October 31, 2011; • Delivering our first ultra-deepwater newbuild semisubmersible safely and reliably; • Committing to build three additional high-specification rigs, including our first ultra-deepwater drillships; and • Entering into a new and expanded revolving credit facility to fund our fleet growth.
Strong Financial and operational perFormance Once again, we delivered excellent financial results in 2011. Net income of approximately $272 million, or $4.15 per diluted share, represented another record-high for our company, outpacing our fiscal year 2010 earnings by more than 5%. Revenue for the year was slightly lower at $645 million, but second only to 2010. These results were enabled by the strong performance of our rig operations teams in achieving high levels of reliability and revenue recognition across our fleet. Atwood’s operations excellence is valued highly by our clients and remains a point of differentiation from our competitors.
While our personal safety statistics slipped from our record-best levels in 2010, we did reduce the number of high-potential incidents on our rigs while improving our overall environmental performance. We redesigned our safety tools and implemented a “Stop Work Obligation” on all of our rigs to improve hazard identification and incident prevention. Our operations integrity initiative made significant progress with the implementation of new minimum operating standards, enhanced well-control training, improved emergency drills and more rigorous equipment maintenance and testing.
delivery oF our FirSt ultra-deepwater rigThe delivery of the Atwood Osprey and its successful start-up in Australia was a key accomplishment for our company. The Atwood Osprey departed the Jurong Shipyard in Singapore in late April after completing nearly 10 million man-hours of construction with an excellent safety record. Upon arrival in Australia, the rig completed its acceptance tests and commenced a three-year drilling program that includes the Greater Gorgon development on the Northwest Shelf. In its first 100 days of operation, the Atwood Osprey experienced no recordable safety incidents and 96+% reliability, while demonstrating efficient use of its extensive offline capabilities.
226567_CNC_Narr.indd 2 1/6/12 5:26 AM
2011 annual report 3
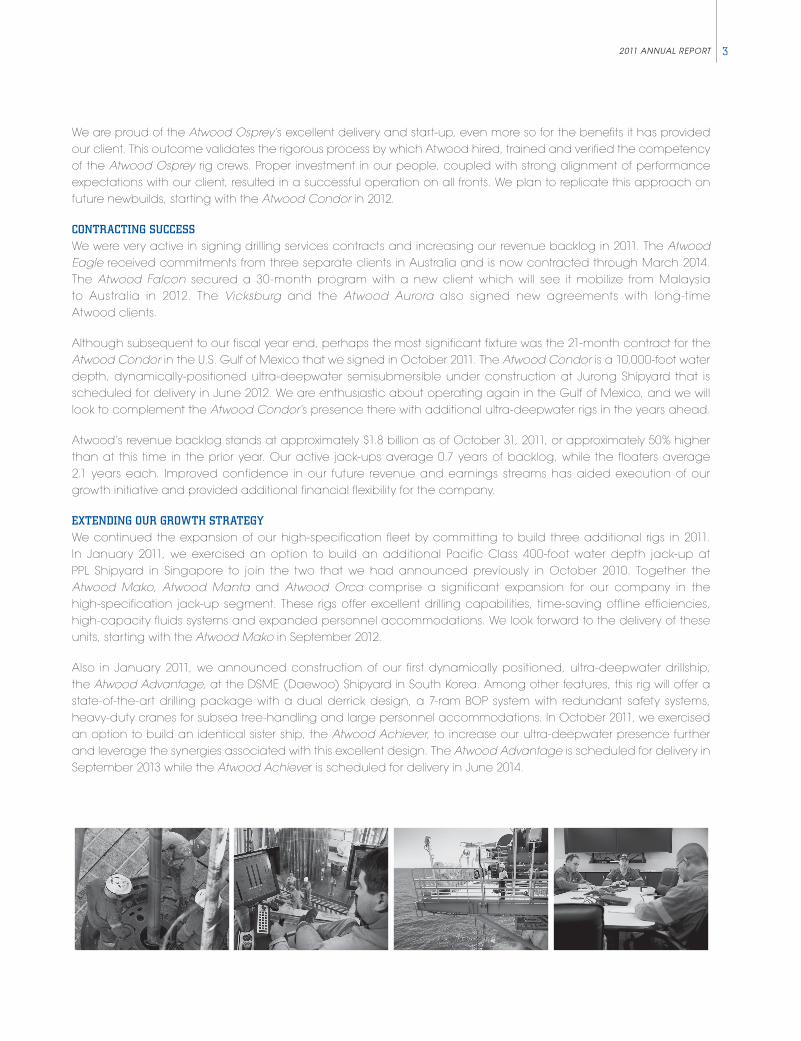
We are proud of the Atwood Osprey’s excellent delivery and start-up, even more so for the benefits it has provided our client. This outcome validates the rigorous process by which Atwood hired, trained and verified the competency of the Atwood Osprey rig crews. Proper investment in our people, coupled with strong alignment of performance expectations with our client, resulted in a successful operation on all fronts. We plan to replicate this approach on future newbuilds, starting with the Atwood Condor in 2012.
contracting SucceSSWe were very active in signing drilling services contracts and increasing our revenue backlog in 2011. The Atwood Eagle received commitments from three separate clients in Australia and is now contracted through March 2014. The Atwood Falcon secured a 30-month program with a new client which will see it mobilize from Malaysia to Australia in 2012. The Vicksburg and the Atwood Aurora also signed new agreements with long-time Atwood clients.
Although subsequent to our fiscal year end, perhaps the most significant fixture was the 21-month contract for the Atwood Condor in the U.S. Gulf of Mexico that we signed in October 2011. The Atwood Condor is a 10,000-foot water depth, dynamically-positioned ultra-deepwater semisubmersible under construction at Jurong Shipyard that is scheduled for delivery in June 2012. We are enthusiastic about operating again in the Gulf of Mexico, and we will look to complement the Atwood Condor’s presence there with additional ultra-deepwater rigs in the years ahead.
Atwood’s revenue backlog stands at approximately $1.8 billion as of October 31, 2011, or approximately 50% higher than at this time in the prior year. Our active jack-ups average 0.7 years of backlog, while the floaters average 2.1 years each. Improved confidence in our future revenue and earnings streams has aided execution of our growth initiative and provided additional financial flexibility for the company.
extending our growth Strategy We continued the expansion of our high-specification fleet by committing to build three additional rigs in 2011. In January 2011, we exercised an option to build an additional Pacific Class 400-foot water depth jack-up at PPL Shipyard in Singapore to join the two that we had announced previously in October 2010. Together the Atwood Mako, Atwood Manta and Atwood Orca comprise a significant expansion for our company in the high-specification jack-up segment. These rigs offer excellent drilling capabilities, time-saving offline efficiencies, high-capacity fluids systems and expanded personnel accommodations. We look forward to the delivery of these units, starting with the Atwood Mako in September 2012.
Also in January 2011, we announced construction of our first dynamically positioned, ultra-deepwater drillship, the Atwood Advantage, at the DSME (Daewoo) Shipyard in South Korea. Among other features, this rig will offer a state-of-the-art drilling package with a dual derrick design, a 7-ram BOP system with redundant safety systems, heavy-duty cranes for subsea tree-handling and large personnel accommodations. In October 2011, we exercised an option to build an identical sister ship, the Atwood Achiever, to increase our ultra-deepwater presence further and leverage the synergies associated with this excellent design. The Atwood Advantage is scheduled for delivery in September 2013 while the Atwood Achiever is scheduled for delivery in June 2014.
226567_CNC_Narr.indd 3 1/6/12 5:26 AM
atwood oceanics, inc.4
Including the Atwood Condor, we are building six high-specification rigs that will significantly modernize our rig fleet and greatly increase our future revenue and earnings potential. We are confident that our use of world-class ship-yards, proven rig designs, turnkey construction contracts and experienced onsite project managers will position us well to replicate the success of the Atwood Osprey.
The combined investment in our rigs under construction is approximately $2.5 billion and will be funded primarily with cash from operations and through access to our new and expanded revolving credit facility. This $750 million facility was executed in May and replaced two smaller credit facilities that were approaching their expiration. This facility offers an upsize option to $1.1 billion that may be utilized to support the final payments on our later newbuild rig deliveries.
other SucceSS meaSureSWe achieved a number of milestones this year that are a source of pride for our company. In October 2011, we were named as one of the best U.S. companies with less than $1 billion in revenue by Forbes magazine, an award based on our consistent growth and financial performance. In November 2011, the Atwood Falcon was named “Floating Rig of the Year” by a major client with a large contracted rig fleet due to the Atwood Falcon’s outstanding safety and operational performance. Finally and importantly, Atwood investors enjoyed a share price appreciation that exceeded that of our major offshore drilling peers for the twelve-month period ending October 31, 2011.
In September, we introduced Our Guiding Principles, a set of related statements that define our mission, our vision, our beliefs and values in a way that is uniquely Atwood. Our Guiding Principles were developed entirely in-house utilizing the input of our rig teams as well as those working at our worldwide offices. These statements comprise our “corporate DNA” and outline our five most critical responsibilities: Safety and Environmental Stewardship, Client Satisfaction, Employee Focus, Value Creation and Integrity and Respect. Our Guiding Principles are an inspiration for our employees and a commitment to the success of our clients and our shareholders.
looking ForwardWhile we achieved much in 2011, we remain singularly focused on our future and the continued execution of our strategy in 2012. We expect to deliver and commence operations on both the Atwood Condor and the Atwood Mako—safely and reliably. We will invest in improving the management systems for our business as we prepare for the significant growth of our company. We will continue to recruit, train, motivate and retain the best people in the offshore drilling industry to sustain our reputation for operational excellence. We will focus on delivering superior shareholder value by executing our strategy and driving our success to the bottom line.
Our company’s future depends on the efforts and performance of the men and women who comprise the grow-ing worldwide Atwood Team. Our Guiding Principles describe our employees as “competent and motivated people who are genuinely committed to the success of our clients and are passionate about offshore drilling.” That’s exactly who they are and how they feel. I appreciate each of our employees for their contributions to Atwood’s suc-cess in 2011 and beyond.
Rob Saltiel
President and Chief Executive Officer
226567_CNC_Narr.indd 4 1/6/12 5:26 AM
52011 ANNUAL REPORT
6 FIVE-YEAR FINANCIAL REVIEW
7 OFFSHORE DRILLING OPERATIONS
9 FORWARD-LOOKING STATEMENTS
10MANAGEMENT’S DISCUSSION AND ANALYSIS OF FINANCIAL CONDITION AND RESULTS OF OPERATIONS
24 MANAGEMENT’S REPORT ON INTERNAL CONTROL OVER FINANCIAL REPORTING
25 REPORT OF INDEPENDENT REGISTERED PUBLIC ACCOUNTING FIRM
26 CONSOLIDATED BALANCE SHEETS
27 CONSOLIDATED STATEMENTS OF OPERATIONS
28 CONSOLIDATED STATEMENTS OF CASH FLOWS
29 CONSOLIDATED STATEMENTS OF CHANGES IN SHAREHOLDERS’ EQUITY
29 CONSOLIDATED STATEMENTS OF COMPREHENSIVE INCOME
30 NOTES TO CONSOLIDATED FINANCIAL STATEMENTS
FINANCIAL INFORMATION
ATwOOd OcEANics, iNc.6
At or For the Years Ended September 30,
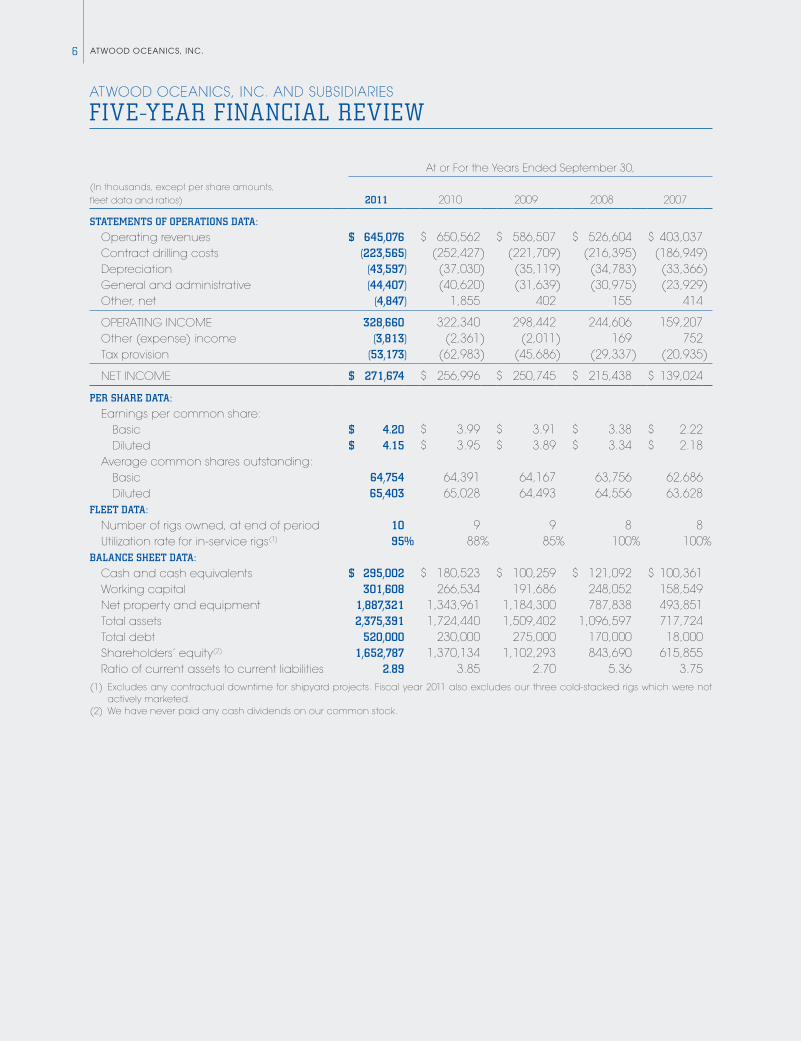
(In thousands, except per share amounts, fleet data and ratios) 2011 2010 2009 2008 2007
STATEMENTS OF OPERATIONS DATA:
Operating revenues $ 645,076 $ 650,562 $ 586,507 $ 526,604 $ 403,037 Contract drilling costs (223,565) (252,427) (221,709) (216,395) (186,949) Depreciation (43,597) (37,030) (35,119) (34,783) (33,366) General and administrative (44,407) (40,620) (31,639) (30,975) (23,929) Other, net (4,847) 1,855 402 155 414
OPERATING INCOME 328,660 322,340 298,442 244,606 159,207 Other (expense) income (3,813) (2,361) (2,011) 169 752 Tax provision (53,173) (62,983) (45,686) (29,337) (20,935)
NET INCOME $ 271,674 $ 256,996 $ 250,745 $ 215,438 $ 139,024
PER SHARE DATA:
Earnings per common share: Basic $ 4.20 $ 3.99 $ 3.91 $ 3.38 $ 2.22 Diluted $ 4.15 $ 3.95 $ 3.89 $ 3.34 $ 2.18 Average common shares outstanding: Basic 64,754 64,391 64,167 63,756 62,686 Diluted 65,403 65,028 64,493 64,556 63,628FLEET DATA:
Number of rigs owned, at end of period 10 9 9 8 8 Utilization rate for in-service rigs(1) 95% 88% 85% 100% 100%BALANCE SHEET DATA:
Cash and cash equivalents $ 295,002 $ 180,523 $ 100,259 $ 121,092 $ 100,361 Working capital 301,608 266,534 191,686 248,052 158,549 Net property and equipment 1,887,321 1,343,961 1,184,300 787,838 493,851 Total assets 2,375,391 1,724,440 1,509,402 1,096,597 717,724 Total debt 520,000 230,000 275,000 170,000 18,000 Shareholders’ equity(2) 1,652,787 1,370,134 1,102,293 843,690 615,855 Ratio of current assets to current liabilities 2.89 3.85 2.70 5.36 3.75(1) Excludes any contractual downtime for shipyard projects. Fiscal year 2011 also excludes our three cold-stacked rigs which were not
actively marketed.(2) We have never paid any cash dividends on our common stock.
ATWOOD OCEANICS, INC. AND SUBSIDIARIES
FIVE-YEAR FINANCIAL REVIEW
72011 ANNUAL REPORT
OFFSHORE DRILLING OPERATIONS
Rig Name
Year(s) Upgraded or Construction Completed
Maximum Water Depth (Feet)
Percentage of FY 2011 Revenues
Location at January 3,
2012 CustomerContract Status at
January 3, 2012
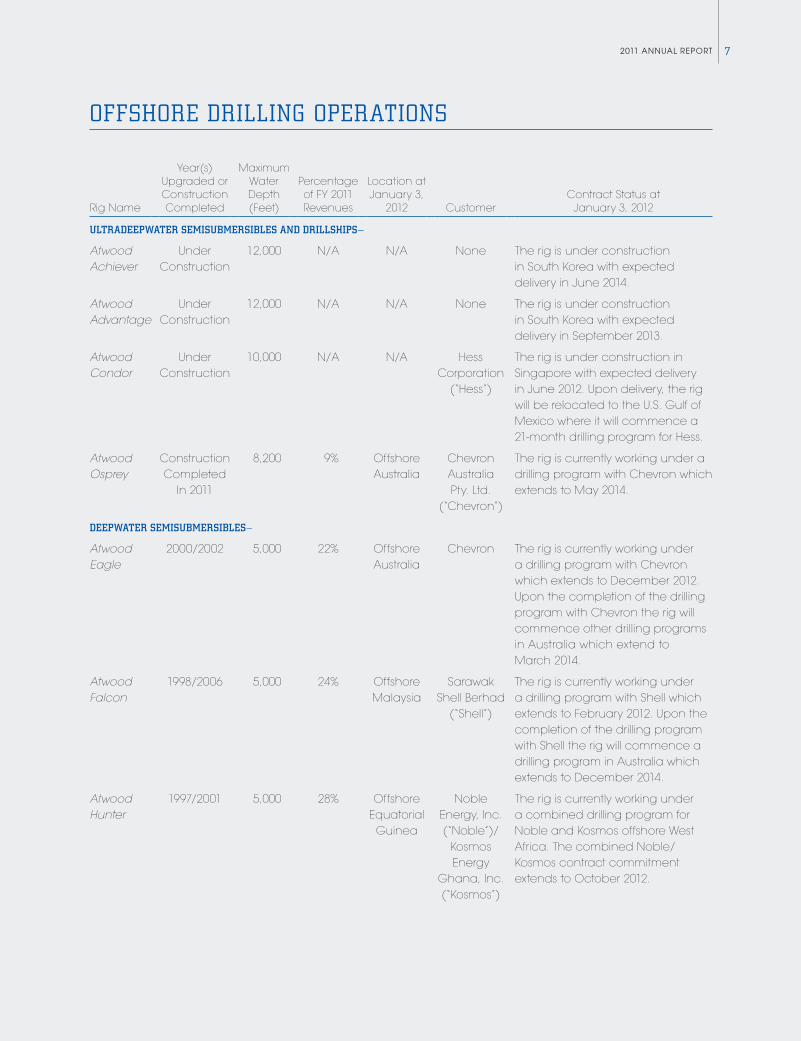
ULTRADEEPWATER SEMISUBMERSIBLES AND DRILLSHIPS—
Atwood Achiever
Under Construction
12,000 N/A N/A None The rig is under construction in South Korea with expected delivery in June 2014.
Atwood Advantage
Under Construction
12,000 N/A N/A None The rig is under construction in South Korea with expected delivery in September 2013.
Atwood Condor
Under Construction
10,000 N/A N/A Hess Corporation
(“Hess”)
The rig is under construction in Singapore with expected delivery in June 2012. Upon delivery, the rig will be relocated to the U.S. Gulf of Mexico where it will commence a 21-month drilling program for Hess.
Atwood Osprey
Construction Completed
In 2011
8,200 9% Offshore Australia
Chevron Australia Pty. Ltd.
(“Chevron”)
The rig is currently working under a drilling program with Chevron which extends to May 2014.
DEEPWATER SEMISUBMERSIBLES—
Atwood Eagle
2000/2002 5,000 22% Offshore Australia
Chevron The rig is currently working under a drilling program with Chevron which extends to December 2012. Upon the completion of the drilling program with Chevron the rig will commence other drilling programs in Australia which extend to March 2014.
Atwood Falcon
1998/2006 5,000 24% Offshore Malaysia
Sarawak Shell Berhad
(“Shell”)
The rig is currently working under a drilling program with Shell which extends to February 2012. Upon the completion of the drilling program with Shell the rig will commence a drilling program in Australia which extends to December 2014.
Atwood Hunter
1997/2001 5,000 28% Offshore Equatorial
Guinea
Noble Energy, Inc. (“Noble”)/
Kosmos Energy
Ghana, Inc. (“Kosmos”)
The rig is currently working under a combined drilling program for Noble and Kosmos offshore West Africa. The combined Noble/Kosmos contract commitment extends to October 2012.
atwood oceanics, inc.8
Rig Name
Year(s) Upgraded or Construction Completed
Maximum Water Depth (Feet)
Percentage of FY 2011 Revenues
Location at January 3,
2012 CustomerContract Status at
January 3, 2012
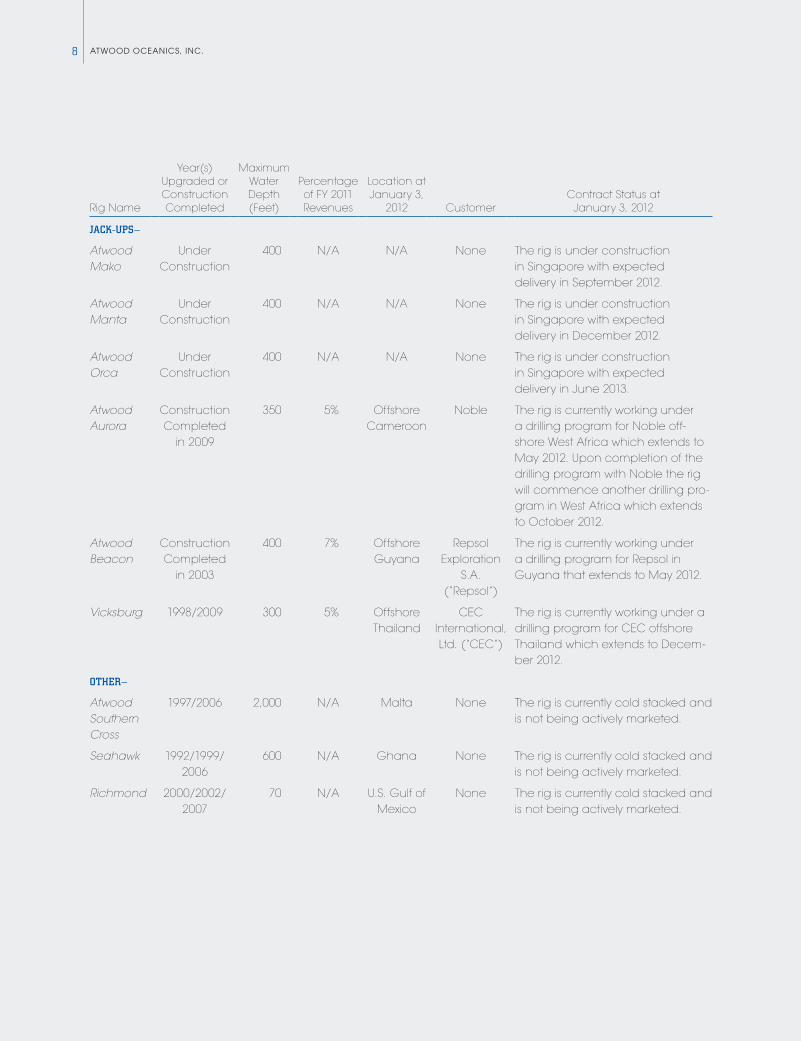
JACK-UPS—
Atwood Mako
Under Construction
400 N/A N/A None The rig is under construction in Singapore with expected delivery in September 2012.
Atwood Manta
Under Construction
400 N/A N/A None The rig is under construction in Singapore with expected delivery in December 2012.
Atwood Orca
Under Construction
400 N/A N/A None The rig is under construction in Singapore with expected delivery in June 2013.
Atwood Aurora
Construction Completed
in 2009
350 5% Offshore Cameroon
Noble The rig is currently working under a drilling program for Noble offshore West Africa which extends to May 2012. Upon completion of the drilling program with Noble the rig will commence another drilling program in West Africa which extends to October 2012.
Atwood Beacon
Construction Completed
in 2003
400 7% Offshore Guyana
Repsol Exploration
S.A. (“Repsol”)
The rig is currently working under a drilling program for Repsol in Guyana that extends to May 2012.
Vicksburg 1998/2009 300 5% Offshore Thailand
CEC International, Ltd. (“CEC”)
The rig is currently working under a drilling program for CEC offshore Thailand which extends to December 2012.
OTHER—
Atwood Southern Cross
1997/2006 2,000 N/A Malta None The rig is currently cold stacked and is not being actively marketed.
Seahawk 1992/1999/ 2006
600 N/A Ghana None The rig is currently cold stacked and is not being actively marketed.
Richmond 2000/2002/ 2007
70 N/A U.S. Gulf of Mexico
None The rig is currently cold stacked and is not being actively marketed.
92011 ANNUAL REPORT
FORWARD-LOOKING STATEMENTS
Statements included in this annual report regarding future financial performance, capital sources and results of operations and other statements, other than statements of historical fact, that address activities, events or devel-opments that we expect, believe or anticipate will or may occur in the future are forward-looking statements within the meaning of Section 27A of the Securities Act of 1933, and Section 21E of the Securities Exchange Act of 1934. Such statements are those concerning strategic plans, expectations and objectives for future operations and performance. When used in this report, the words “believes,” “expects,” “anticipates,” “plans,” “intends,” “estimates,” “projects,” “could,” “should,” “may,” or similar expressions are intended to be among the statements that identify forward-looking statements.
Such statements are subject to numerous risks, uncertainties and assumptions that are beyond our ability to control, including, but not limited to:
• prices of oil and natural gas and industry expectations about future prices; • market conditions, expansion and other development trends in the drilling industry and the global economy
in general; • the operational risks involved in drilling for oil and gas; • the highly competitive and volatile nature of our business; • the impact of governmental or industry regulation, both in the United States and internationally; • the risks of and disruptions to international operations, including political instability and the impact of terrorist
acts, acts of piracy, embargoes, war or other military operations; • our ability to enter into, and the terms, of future drilling contracts, including contracts for our new build units; • our ability to retain the business of one or more significant customers; • our ability to obtain and retain qualified personnel to operate our vessels; • timely access to spare parts, equipment and personnel to maintain and service our fleet; • the termination or renegotiation of contracts by customers or payment or other delays by our customers; • customer requirements for drilling capacity and customer drilling plans; • the adequacy of sources of liquidity for us and for our customers; • changes in tax laws, treaties and regulations; • the risks involved in the construction, upgrade, and repair of our drilling units; • unplanned downtime and repairs on our rigs; and • such other risks discussed in Part I, Item 1A. “Risk Factors” in our Form 10-K for fiscal year 2011 and in our other
reports filed with the Securities and Exchange Commission, or SEC.
Forward-looking statements are made based upon management’s current plans, expectations, estimates, assumptions and beliefs concerning future events impacting us and therefore involve a number of risks and uncertainties. We caution that forward-looking statements are not guarantees and that actual results could differ materially from those expressed or implied in the forward-looking statements. Undue reliance should not be placed on these forward-looking statements, which are applicable only on the date hereof. We undertake no obligation to revise or update these forward-looking statements to reflect events or circumstances that arise after the date hereof or to reflect the occurrence of unanticipated events.
ATwOOd OcEANics, iNc.10
MARKET OUTLOOK
OvERviEw
The following discussion is intended to assist in understanding our financial position at September 30, 2011 and 2010, and our results of operations for each of the fiscal years for the three-year period ended September 30, 2011. Read the accompanying consolidated financial statements and related notes in conjunction with this discussion.
Our fiscal year 2011 financial and operating results include:
• Operating revenues totaling $645 million • Record net income of $272 million and diluted earnings per share of $4.15 • Net cash from operating activities of $340 million • Debt-to-capitalization ratio of 24% at September 30, 2011
iNdUsTRy cONdiTiONs
Over the past year, the offshore drilling market experienced improving utilization rates across all rig classes in response to better-than-anticipated oil prices. The degree of day rate improvement, however, differed in absolute levels between these rig classes with the ultra-deepwater floater market enjoying the most improvement as evi-denced by the near full utilization for this rig class during the year. Day rates for other rig classes also experienced improvement, albeit at a slower pace.
However, the global macro environment, including the geopolitical issues in North Africa and the Middle East, the sovereign debt issues in Europe and slower economic growth in the U.S. and China, introduced a high level of market volatility and threatens to disrupt these favorable and improving offshore drilling market conditions.
On October 1, 2011, the former Bureau of Ocean Energy Management, Regulation and Enforcement (“BOEMRE”) split into two agencies, the Bureau of Ocean Energy Management (“BOEM”) and the Bureau of Safety and Environmental Enforcement (“BSEE”). The BSEE is now responsible for issuing drilling permits. These agencies have recently clarified and simplified the drilling permit process and the industry has seen a significant increase in the number of approved drilling permits. For example, from July 2011 to October 31, 2011, 25 new well drilling permits were awarded. This compares to 15 permits issued for the 15 months prior to July 2011. We are encouraged by this increase in permitting activity and expect permitting activity to continue to increase into 2012. As a result, tendering activity in the U.S. Gulf of Mexico has also increased resulting in several recent drilling contract awards. However, we cannot be certain that such increases will continue into the future or that additional restrictions or regulations will not be implemented which might negatively impact drilling activity in the U.S. Gulf of Mexico.
Additionally, West Africa, East Africa and Brazil are experiencing increased tender requests and contract awards at increasingly higher day rates. Further improvements in ultra-deepwater and deepwater rig utilization and day rates will depend in large part on projected oil prices, the strength of the global economy, and any additional impacts from the Macondo incident and associated new regulatory, legislative and permitting requirements.
Brent oil prices have averaged $105 for the year ended September 30, 2011, ranging from $82 to $124 during this period. At these price levels, we anticipate that our customers will continue to execute drilling programs resulting in increased levels of offshore drilling activity.
ULTRA-dEEPwATER ANd dEEPwATER
Industry-wide, deepwater rig utilization increased from 86% for fiscal year 2010 to 89% for fiscal year 2011, while ultra-deepwater utilization remains at full utilization. We believe only one new build ultra-deepwater unit, which delivers from the shipyard in December 2012, is currently available through the end of calendar year 2012. Conversely, although utilization has increased, there are still approximately three deepwater rigs with availability in 2011. For calendar year 2012, 91% of ultra-deepwater available days are contracted, with 74% of available days contracted for the industry-wide deepwater fleet.
MANAGEMENT’S DISCUSSION AND ANALYSIS OF F INANCIAL CONDITION AND RESULTS OF OPERATIONS
112011 ANNUAL REPORT
The Atwood Osprey continued its three-year contract with Chevron in Australia and is contracted through mid-2014. The Atwood Eagle and Atwood Falcon are contracted through the second quarter of fiscal year 2014 and the first quarter of fiscal year 2015, respectively, while the Atwood Hunter is contracted into the first quarter of fiscal year 2013.
The Atwood Condor, a dynamically positioned, 10,000-foot water depth ultra-deepwater semisubmersible, is on schedule to be delivered from the Jurong shipyard during the third quarter of fiscal year 2012 at a total cost, including project management, drilling, handling tools and spares, of approximately $750 million. The Atwood Condor is contracted to Hess Corporation for 21 months in the U.S. Gulf of Mexico directly after mobilization from the shipyard in Singapore.
The Atwood Advantage, a DP-3 dynamically-positioned, dual derrick, ultra-deepwater drillship rated to operate in water depths up to 12,000 feet, is currently under construction at the Daewoo Shipbuilding and Marine Engineering Co., Ltd. (“DSME”) shipyard in South Korea. The Atwood Advantage will have enhanced technical capabilities, including a seven-ram blowout preventer, the ability to operate two blowout preventers, three 100-ton knuckle boom cranes, a 165-ton active heave “tree-running” knuckle boom crane and 200-person accommodations. The Atwood Advantage is expected to be delivered during the fourth quarter of fiscal year 2013 at a total cost, including project management, drilling, handling tools and spares, of approximately $600 million.
In October 2011, we exercised an option to construct a second ultra-deepwater drillship, the Atwood Achiever, at the DSME shipyard in South Korea. The Atwood Achiever is identical in all material respects to the Atwood Advantage. The Atwood Achiever is expected to be delivered by June 2014 at a total cost, including proj-ect management, drilling, handling tools and spares, of approximately $600 million.
In addition, we have until July 31, 2012 to exercise our option to build an additional ultra-deepwater drillship with DSME. At this time, we have made no determination as to whether the remaining option will be exercised.
Although we currently do not have drilling contracts for the Atwood Advantage or the Atwood Achiever, we expect that the long-term demand for deepwater drilling capacity in established and emerging basins should provide us with opportunities to contract these two rigs prior to their delivery dates.
As of September 30, 2011, we have invested approximately $546 million toward the construction of the Atwood Condor and Atwood Advantage drilling units. As of November 21, 2011, we had $520 million of outstanding borrowings under our revolving credit facility.
JAck-UPs
A bifurcation in day rates and utilization has become more evident in the jack-up market. Currently, higher- specification jack-up rigs are achieving marketed utilization levels of approximately 96% as compared to 82% for the remainder of the global jack-up fleet. Higher-specification rigs represent less than 30% of the global jack-up fleet. We expect this trend to continue into 2012 despite the expected supply increase from new build rigs being delivered throughout next year. We expect that operators will continue to prefer contracting newer, more capable high-specification rigs in continuance of the bifurcation trend.
As a result of new build construction programs initiated during 2005 and continuing through 2010, the jack-up supply continues to increase. As of October 31, 2011, there were 75 new build jack-up rigs under construction, of which eight are scheduled for delivery during the remainder of 2011, while 21 are scheduled for delivery during 2012 and the remainder thereafter. Although the majority of jack-up rigs scheduled for delivery during the remainder of 2011 and 2012 are not contracted, approximately 15% are not considered high-specification rigs (i.e., less than 350-foot water depth capability) and therefore do not compete with the majority of our jack-up fleet.
atwood oceanics, inc.12
The Atwood Aurora and Atwood Beacon are each contracted for eight months in fiscal year 2012. The Vicksburg is contracted through the end of the fiscal first quarter 2013. Due to market bifurcation for high-specification jack-ups, we expect the Atwood Aurora and Atwood Beacon to continue to operate with high utilization and increasing day rates while the Vicksburg may encounter greater competition resulting in lower utilization, with day rates remaining under pressure for the foreseeable future.
We currently have three Pacific Class 400 jack-up drilling units, the Atwood Mako, the Atwood Manta and the Atwood Orca, under construction at the PPL Shipyard Pte. Ltd. (“PPL”) shipyard in Singapore. These new rigs will have a rated water depth of 400 feet, accommodations for 150 personnel and significant offline handling features. The three rigs are expected to cost approximately $190 million each, including project management, drilling, handling tools and spares, and are scheduled for delivery during the fourth quarter of fiscal 2012, the first quarter of fiscal year 2013, and the third quarter of fiscal year 2013, respectively. Although we currently do not have drilling contracts for our three new build jack-ups, we expect to contract these high-specification rigs prior to their delivery dates due to the preference of customers for these newer, more capable high-specification assets.
We have until December 31, 2011 to exercise options to build two additional Pacific Class 400 jack-up drilling units with PPL. At this time, we have made no determination as to whether either of the two remaining options will be exercised.
idled Rigs
During fiscal year 2010, the Atwood Southern Cross, Richmond and Seahawk completed their drilling contracts and were subsequently idled. We anticipate these units will not return to service during fiscal year 2012 due to the lack of sufficient continuous demand, and thus, we are not actively marketing these rigs at this time.
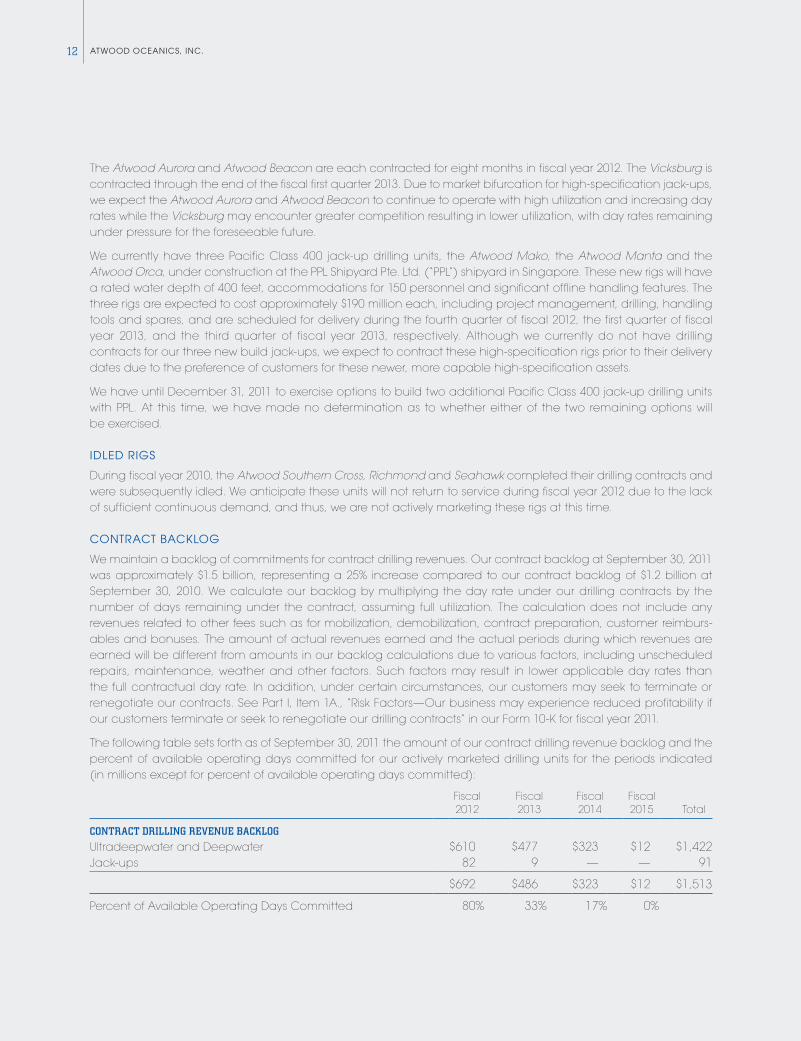
contRact Backlog
We maintain a backlog of commitments for contract drilling revenues. Our contract backlog at September 30, 2011 was approximately $1.5 billion, representing a 25% increase compared to our contract backlog of $1.2 billion at September 30, 2010. We calculate our backlog by multiplying the day rate under our drilling contracts by the number of days remaining under the contract, assuming full utilization. The calculation does not include any revenues related to other fees such as for mobilization, demobilization, contract preparation, customer reimburs-ables and bonuses. The amount of actual revenues earned and the actual periods during which revenues are earned will be different from amounts in our backlog calculations due to various factors, including unscheduled repairs, maintenance, weather and other factors. Such factors may result in lower applicable day rates than the full contractual day rate. In addition, under certain circumstances, our customers may seek to terminate or renegotiate our contracts. See Part I, Item 1A., “Risk Factors—Our business may experience reduced profitability if our customers terminate or seek to renegotiate our drilling contracts” in our Form 10-K for fiscal year 2011.
The following table sets forth as of September 30, 2011 the amount of our contract drilling revenue backlog and the percent of available operating days committed for our actively marketed drilling units for the periods indicated (in millions except for percent of available operating days committed):
Fiscal 2012
Fiscal 2013
Fiscal 2014
Fiscal 2015 Total
ContraCt Drilling revenue BaCklog
Ultradeepwater and Deepwater $610 $477 $323 $12 $1,422Jack-ups 82 9 — — 91
$692 $486 $323 $12 $1,513
Percent of Available Operating Days Committed 80% 33% 17% 0%
132011 ANNUAL REPORT
On October 17, 2011, we announced that one of our subsidiaries was awarded a drilling services contract by Hess Corporation for work in the U.S. Gulf of Mexico for the Atwood Condor. As a result of this contract, our contract backlog as of October 31, 2011 was $1.8 billion.
RESULTS OF OPERATIONS
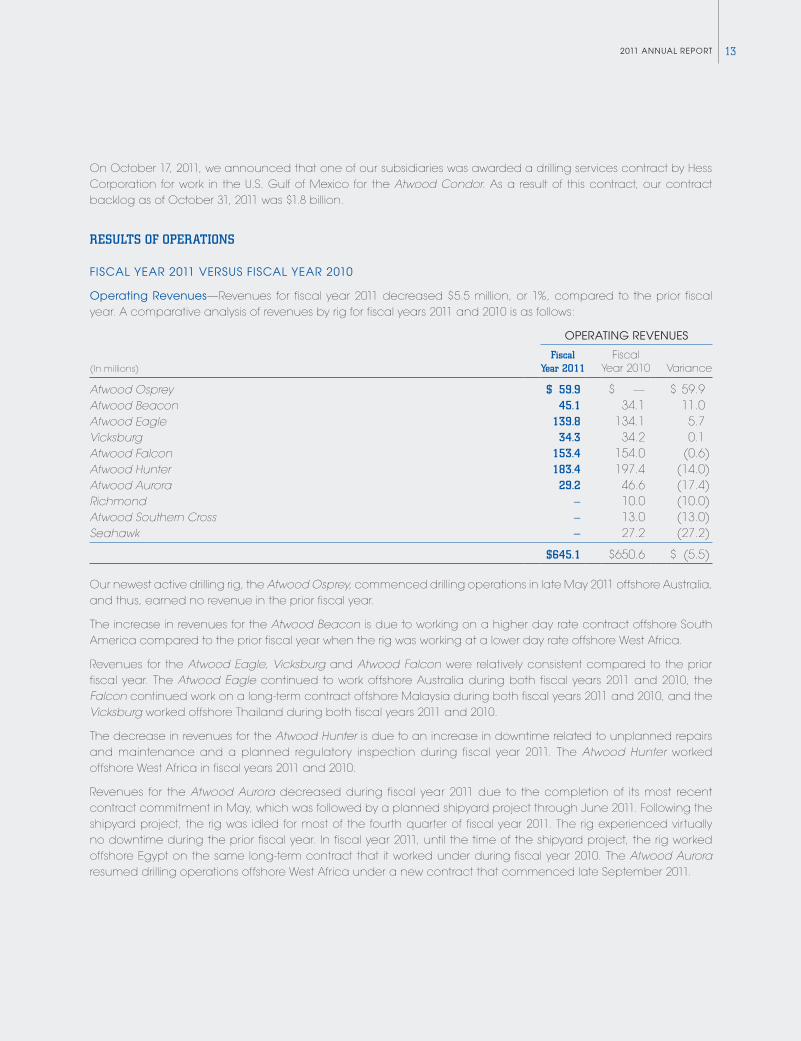
FiscAL yEAR 2011 vERsUs FiscAL yEAR 2010
Operating Revenues—Revenues for fiscal year 2011 decreased $5.5 million, or 1%, compared to the prior fiscal year. A comparative analysis of revenues by rig for fiscal years 2011 and 2010 is as follows:
OPERATiNg REvENUEs
(In millions)Fiscal
Year 2011Fiscal
Year 2010 Variance
Atwood Osprey $ 59.9 $ — $ 59.9Atwood Beacon 45.1 34.1 11.0Atwood Eagle 139.8 134.1 5.7Vicksburg 34.3 34.2 0.1Atwood Falcon 153.4 154.0 (0.6)Atwood Hunter 183.4 197.4 (14.0)Atwood Aurora 29.2 46.6 (17.4)Richmond — 10.0 (10.0)Atwood Southern Cross — 13.0 (13.0)Seahawk — 27.2 (27.2)
$645.1 $650.6 $ (5.5)
Our newest active drilling rig, the Atwood Osprey, commenced drilling operations in late May 2011 offshore Australia, and thus, earned no revenue in the prior fiscal year.
The increase in revenues for the Atwood Beacon is due to working on a higher day rate contract offshore South America compared to the prior fiscal year when the rig was working at a lower day rate offshore West Africa.
Revenues for the Atwood Eagle, Vicksburg and Atwood Falcon were relatively consistent compared to the prior fiscal year. The Atwood Eagle continued to work offshore Australia during both fiscal years 2011 and 2010, the Falcon continued work on a long-term contract offshore Malaysia during both fiscal years 2011 and 2010, and the Vicksburg worked offshore Thailand during both fiscal years 2011 and 2010.
The decrease in revenues for the Atwood Hunter is due to an increase in downtime related to unplanned repairs and maintenance and a planned regulatory inspection during fiscal year 2011. The Atwood Hunter worked offshore West Africa in fiscal years 2011 and 2010.
Revenues for the Atwood Aurora decreased during fiscal year 2011 due to the completion of its most recent contract commitment in May, which was followed by a planned shipyard project through June 2011. Following the shipyard project, the rig was idled for most of the fourth quarter of fiscal year 2011. The rig experienced virtually no downtime during the prior fiscal year. In fiscal year 2011, until the time of the shipyard project, the rig worked offshore Egypt on the same long-term contract that it worked under during fiscal year 2010. The Atwood Aurora resumed drilling operations offshore West Africa under a new contract that commenced late September 2011.
ATwOOd OcEANics, iNc.14
During fiscal year 2010, the Atwood Southern Cross, Richmond, and Seahawk all completed their respective drilling contracts and were subsequently idled. The idle state of these rigs resulted in the decrease of revenues for such rigs for fiscal year 2011 compared to the previous fiscal year.
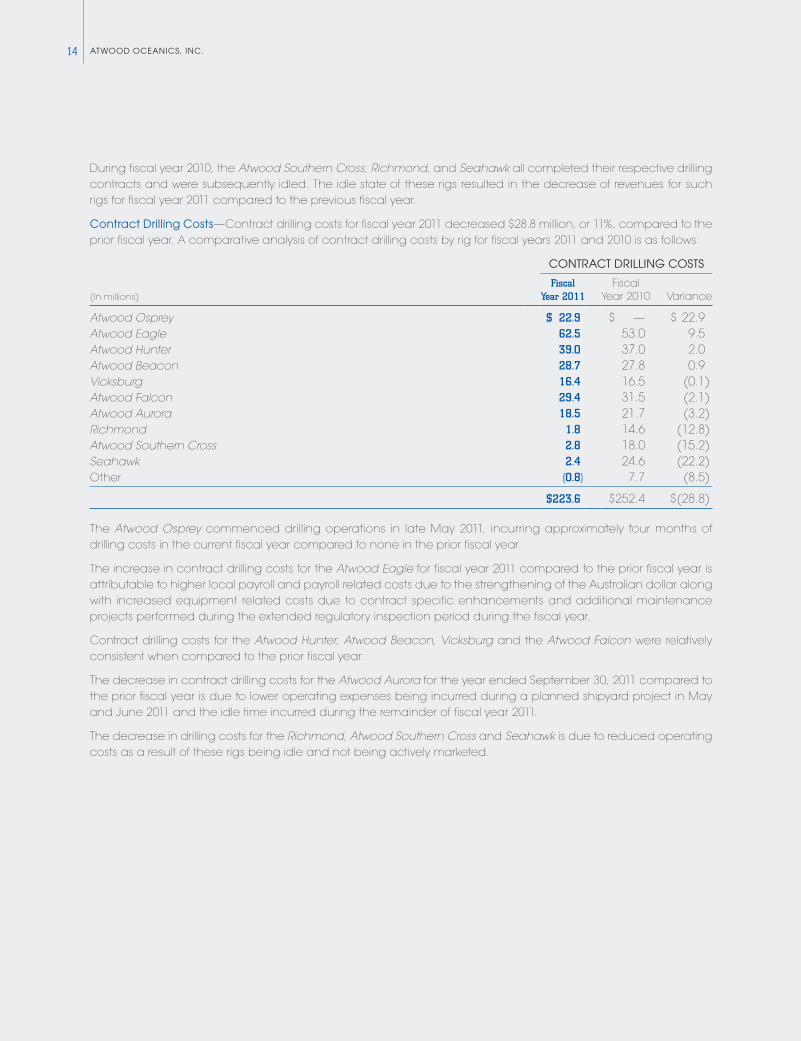
contract drilling costs—Contract drilling costs for fiscal year 2011 decreased $28.8 million, or 11%, compared to the prior fiscal year. A comparative analysis of contract drilling costs by rig for fiscal years 2011 and 2010 is as follows:
cONTRAcT dRiLLiNg cOsTs
(In millions)Fiscal
Year 2011Fiscal
Year 2010 Variance
Atwood Osprey $ 22.9 $ — $ 22.9Atwood Eagle 62.5 53.0 9.5Atwood Hunter 39.0 37.0 2.0Atwood Beacon 28.7 27.8 0.9Vicksburg 16.4 16.5 (0.1)Atwood Falcon 29.4 31.5 (2.1)Atwood Aurora 18.5 21.7 (3.2)Richmond 1.8 14.6 (12.8)Atwood Southern Cross 2.8 18.0 (15.2)Seahawk 2.4 24.6 (22.2)Other (0.8) 7.7 (8.5)
$223.6 $252.4 $(28.8)
The Atwood Osprey commenced drilling operations in late May 2011, incurring approximately four months of drilling costs in the current fiscal year compared to none in the prior fiscal year.
The increase in contract drilling costs for the Atwood Eagle for fiscal year 2011 compared to the prior fiscal year is attributable to higher local payroll and payroll related costs due to the strengthening of the Australian dollar along with increased equipment related costs due to contract specific enhancements and additional maintenance projects performed during the extended regulatory inspection period during the fiscal year.
Contract drilling costs for the Atwood Hunter, Atwood Beacon, Vicksburg and the Atwood Falcon were relatively consistent when compared to the prior fiscal year.
The decrease in contract drilling costs for the Atwood Aurora for the year ended September 30, 2011 compared to the prior fiscal year is due to lower operating expenses being incurred during a planned shipyard project in May and June 2011 and the idle time incurred during the remainder of fiscal year 2011.
The decrease in drilling costs for the Richmond, Atwood Southern Cross and Seahawk is due to reduced operating costs as a result of these rigs being idle and not being actively marketed.
152011 ANNUAL REPORT
Decreases in Other contract drilling costs during the current fiscal year are due to a combination of higher percentage of Other contract drilling costs allocated to rig contract drilling costs in the current fiscal year when compared to the prior fiscal year and recognition of foreign exchange gains in the current fiscal year compared to foreign exchange losses in the prior fiscal year.
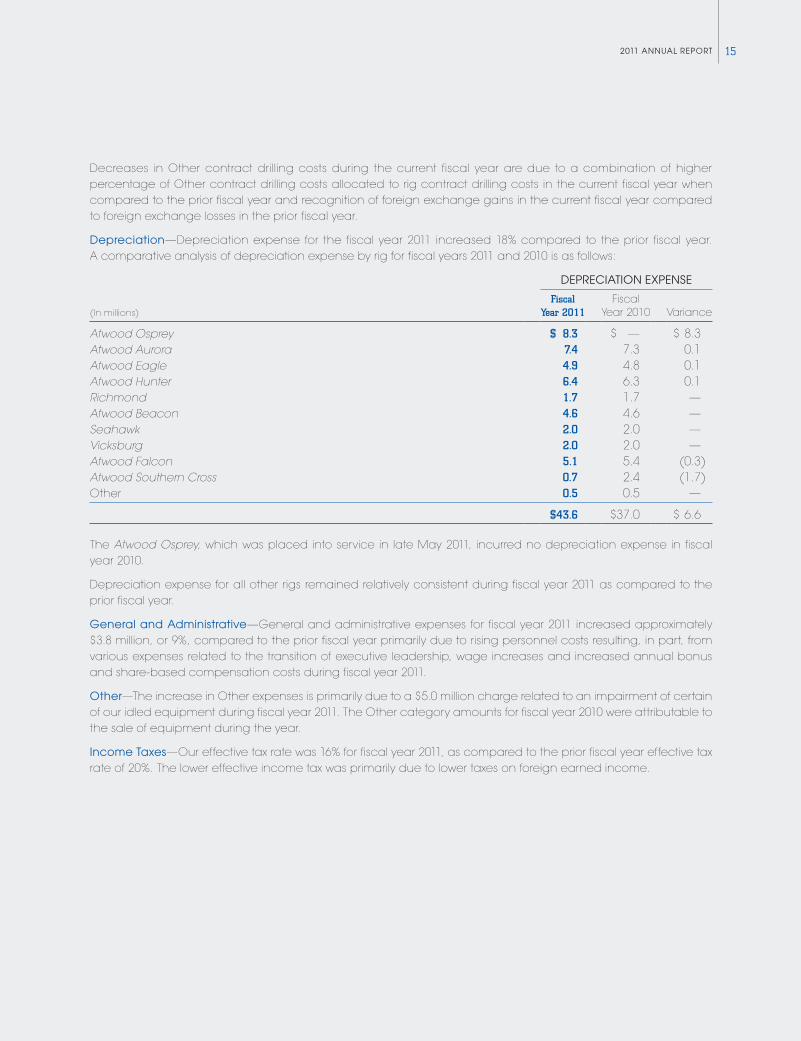
depreciation—Depreciation expense for the fiscal year 2011 increased 18% compared to the prior fiscal year. A comparative analysis of depreciation expense by rig for fiscal years 2011 and 2010 is as follows:
dEPREciATiON ExPENsE
(In millions)Fiscal
Year 2011Fiscal
Year 2010 Variance
Atwood Osprey $ 8.3 $ — $ 8.3Atwood Aurora 7.4 7.3 0.1Atwood Eagle 4.9 4.8 0.1Atwood Hunter 6.4 6.3 0.1Richmond 1.7 1.7 —Atwood Beacon 4.6 4.6 —Seahawk 2.0 2.0 —Vicksburg 2.0 2.0 —Atwood Falcon 5.1 5.4 (0.3)Atwood Southern Cross 0.7 2.4 (1.7)Other 0.5 0.5 —
$43.6 $37.0 $ 6.6
The Atwood Osprey, which was placed into service in late May 2011, incurred no depreciation expense in fiscal year 2010.
Depreciation expense for all other rigs remained relatively consistent during fiscal year 2011 as compared to the prior fiscal year.
general and Administrative—General and administrative expenses for fiscal year 2011 increased approximately $3.8 million, or 9%, compared to the prior fiscal year primarily due to rising personnel costs resulting, in part, from various expenses related to the transition of executive leadership, wage increases and increased annual bonus and share-based compensation costs during fiscal year 2011.
Other—The increase in Other expenses is primarily due to a $5.0 million charge related to an impairment of certain of our idled equipment during fiscal year 2011. The Other category amounts for fiscal year 2010 were attributable to the sale of equipment during the year.
income Taxes—Our effective tax rate was 16% for fiscal year 2011, as compared to the prior fiscal year effective tax rate of 20%. The lower effective income tax was primarily due to lower taxes on foreign earned income.
ATwOOd OcEANics, iNc.16
FiscAL yEAR 2010 vERsUs FiscAL yEAR 2009
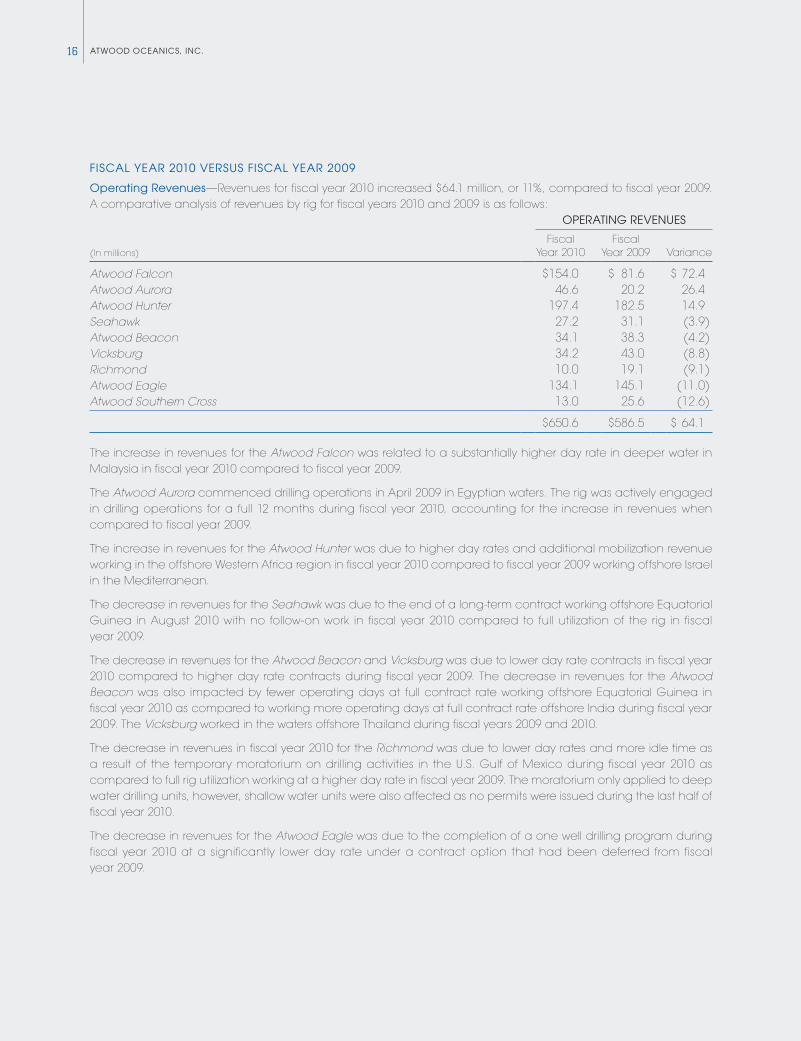
Operating Revenues—Revenues for fiscal year 2010 increased $64.1 million, or 11%, compared to fiscal year 2009. A comparative analysis of revenues by rig for fiscal years 2010 and 2009 is as follows:
OPERATiNg REvENUEs
(In millions)Fiscal
Year 2010Fiscal
Year 2009 Variance
Atwood Falcon $154.0 $ 81.6 $ 72.4Atwood Aurora 46.6 20.2 26.4Atwood Hunter 197.4 182.5 14.9Seahawk 27.2 31.1 (3.9)Atwood Beacon 34.1 38.3 (4.2)Vicksburg 34.2 43.0 (8.8)Richmond 10.0 19.1 (9.1)Atwood Eagle 134.1 145.1 (11.0)Atwood Southern Cross 13.0 25.6 (12.6)
$650.6 $586.5 $ 64.1
The increase in revenues for the Atwood Falcon was related to a substantially higher day rate in deeper water in Malaysia in fiscal year 2010 compared to fiscal year 2009.
The Atwood Aurora commenced drilling operations in April 2009 in Egyptian waters. The rig was actively engaged in drilling operations for a full 12 months during fiscal year 2010, accounting for the increase in revenues when compared to fiscal year 2009.
The increase in revenues for the Atwood Hunter was due to higher day rates and additional mobilization revenue working in the offshore Western Africa region in fiscal year 2010 compared to fiscal year 2009 working offshore Israel in the Mediterranean.
The decrease in revenues for the Seahawk was due to the end of a long-term contract working offshore Equatorial Guinea in August 2010 with no follow-on work in fiscal year 2010 compared to full utilization of the rig in fiscal year 2009.
The decrease in revenues for the Atwood Beacon and Vicksburg was due to lower day rate contracts in fiscal year 2010 compared to higher day rate contracts during fiscal year 2009. The decrease in revenues for the Atwood Beacon was also impacted by fewer operating days at full contract rate working offshore Equatorial Guinea in fiscal year 2010 as compared to working more operating days at full contract rate offshore India during fiscal year 2009. The Vicksburg worked in the waters offshore Thailand during fiscal years 2009 and 2010.
The decrease in revenues in fiscal year 2010 for the Richmond was due to lower day rates and more idle time as a result of the temporary moratorium on drilling activities in the U.S. Gulf of Mexico during fiscal year 2010 as compared to full rig utilization working at a higher day rate in fiscal year 2009. The moratorium only applied to deep water drilling units, however, shallow water units were also affected as no permits were issued during the last half of fiscal year 2010.
The decrease in revenues for the Atwood Eagle was due to the completion of a one well drilling program during fiscal year 2010 at a significantly lower day rate under a contract option that had been deferred from fiscal year 2009.
172011 ANNUAL REPORT
While the Atwood Southern Cross was idle for most of fiscal years 2009 and 2010, the decrease in revenues was due to working at a lower day rate during fiscal year 2010 compared to fiscal year 2009 for the brief time the rig was operational during each fiscal year.
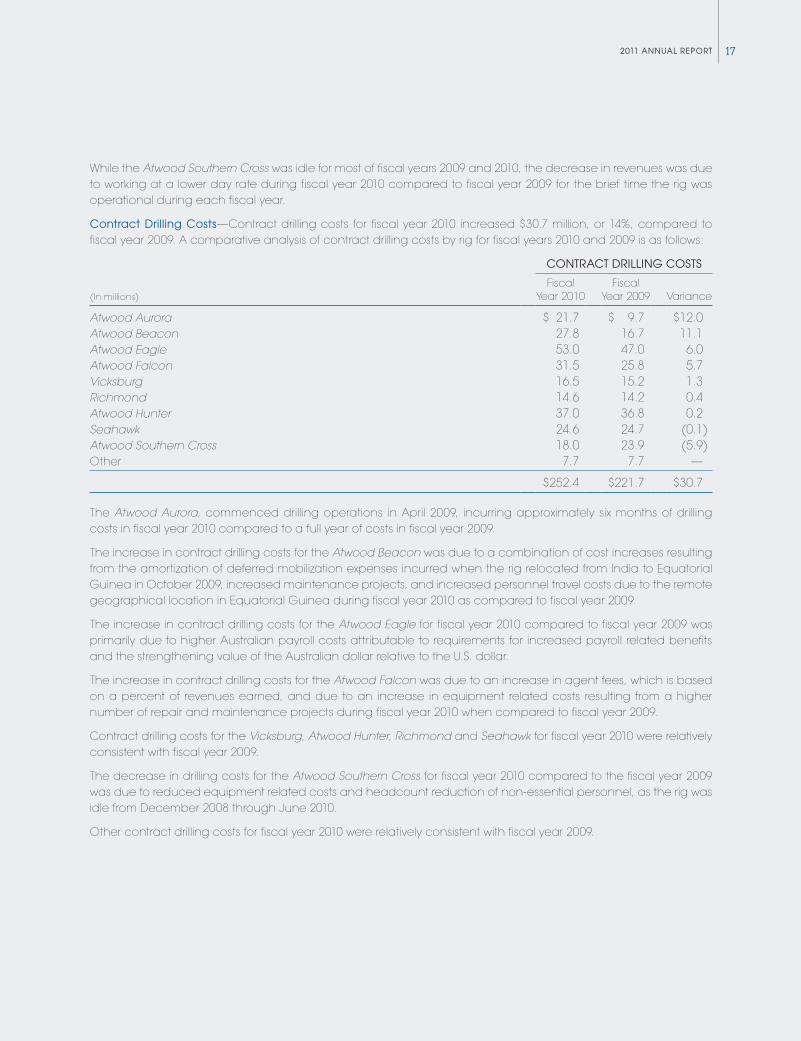
contract drilling costs—Contract drilling costs for fiscal year 2010 increased $30.7 million, or 14%, compared to fiscal year 2009. A comparative analysis of contract drilling costs by rig for fiscal years 2010 and 2009 is as follows:
cONTRAcT dRiLLiNg cOsTs
(In millions)Fiscal
Year 2010Fiscal
Year 2009 Variance
Atwood Aurora $ 21.7 $ 9.7 $12.0Atwood Beacon 27.8 16.7 11.1Atwood Eagle 53.0 47.0 6.0Atwood Falcon 31.5 25.8 5.7Vicksburg 16.5 15.2 1.3Richmond 14.6 14.2 0.4Atwood Hunter 37.0 36.8 0.2Seahawk 24.6 24.7 (0.1)Atwood Southern Cross 18.0 23.9 (5.9)Other 7.7 7.7 —
$252.4 $221.7 $30.7
The Atwood Aurora, commenced drilling operations in April 2009, incurring approximately six months of drilling costs in fiscal year 2010 compared to a full year of costs in fiscal year 2009.
The increase in contract drilling costs for the Atwood Beacon was due to a combination of cost increases resulting from the amortization of deferred mobilization expenses incurred when the rig relocated from India to Equatorial Guinea in October 2009, increased maintenance projects, and increased personnel travel costs due to the remote geographical location in Equatorial Guinea during fiscal year 2010 as compared to fiscal year 2009.
The increase in contract drilling costs for the Atwood Eagle for fiscal year 2010 compared to fiscal year 2009 was primarily due to higher Australian payroll costs attributable to requirements for increased payroll related benefits and the strengthening value of the Australian dollar relative to the U.S. dollar.
The increase in contract drilling costs for the Atwood Falcon was due to an increase in agent fees, which is based on a percent of revenues earned, and due to an increase in equipment related costs resulting from a higher number of repair and maintenance projects during fiscal year 2010 when compared to fiscal year 2009.
Contract drilling costs for the Vicksburg, Atwood Hunter, Richmond and Seahawk for fiscal year 2010 were relatively consistent with fiscal year 2009.
The decrease in drilling costs for the Atwood Southern Cross for fiscal year 2010 compared to the fiscal year 2009 was due to reduced equipment related costs and headcount reduction of non-essential personnel, as the rig was idle from December 2008 through June 2010.
Other contract drilling costs for fiscal year 2010 were relatively consistent with fiscal year 2009.
ATwOOd OcEANics, iNc.18
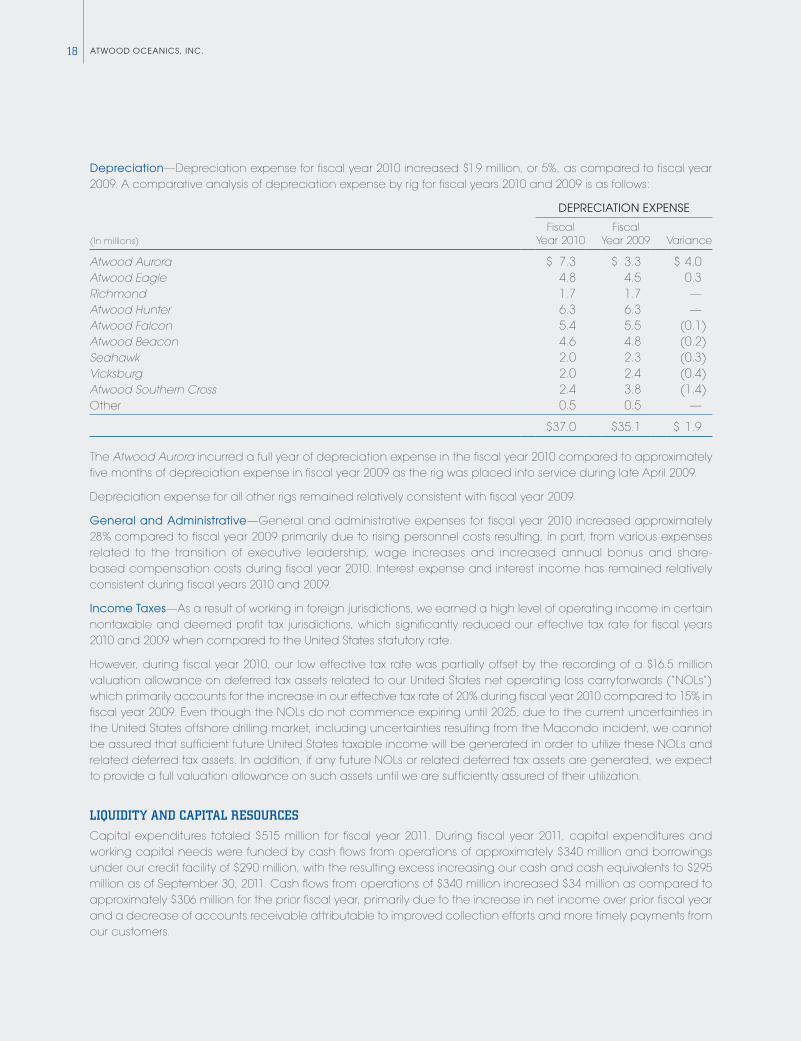
depreciation—Depreciation expense for fiscal year 2010 increased $1.9 million, or 5%, as compared to fiscal year 2009. A comparative analysis of depreciation expense by rig for fiscal years 2010 and 2009 is as follows:
dEPREciATiON ExPENsE
(In millions)Fiscal
Year 2010Fiscal
Year 2009 Variance
Atwood Aurora $ 7.3 $ 3.3 $ 4.0Atwood Eagle 4.8 4.5 0.3Richmond 1.7 1.7 —Atwood Hunter 6.3 6.3 —Atwood Falcon 5.4 5.5 (0.1)Atwood Beacon 4.6 4.8 (0.2)Seahawk 2.0 2.3 (0.3)Vicksburg 2.0 2.4 (0.4)Atwood Southern Cross 2.4 3.8 (1.4)Other 0.5 0.5 —
$37.0 $35.1 $ 1.9
The Atwood Aurora incurred a full year of depreciation expense in the fiscal year 2010 compared to approximately five months of depreciation expense in fiscal year 2009 as the rig was placed into service during late April 2009.
Depreciation expense for all other rigs remained relatively consistent with fiscal year 2009.
general and Administrative—General and administrative expenses for fiscal year 2010 increased approximately 28% compared to fiscal year 2009 primarily due to rising personnel costs resulting, in part, from various expenses related to the transition of executive leadership, wage increases and increased annual bonus and share- based compensation costs during fiscal year 2010. Interest expense and interest income has remained relatively consistent during fiscal years 2010 and 2009.
income Taxes—As a result of working in foreign jurisdictions, we earned a high level of operating income in certain nontaxable and deemed profit tax jurisdictions, which significantly reduced our effective tax rate for fiscal years 2010 and 2009 when compared to the United States statutory rate.
However, during fiscal year 2010, our low effective tax rate was partially offset by the recording of a $16.5 million valuation allowance on deferred tax assets related to our United States net operating loss carryforwards (“NOLs”) which primarily accounts for the increase in our effective tax rate of 20% during fiscal year 2010 compared to 15% in fiscal year 2009. Even though the NOLs do not commence expiring until 2025, due to the current uncertainties in the United States offshore drilling market, including uncertainties resulting from the Macondo incident, we cannot be assured that sufficient future United States taxable income will be generated in order to utilize these NOLs and related deferred tax assets. In addition, if any future NOLs or related deferred tax assets are generated, we expect to provide a full valuation allowance on such assets until we are sufficiently assured of their utilization.
LIQUIDITY AND CAPITAL RESOURCES
Capital expenditures totaled $515 million for fiscal year 2011. During fiscal year 2011, capital expenditures and working capital needs were funded by cash flows from operations of approximately $340 million and borrowings under our credit facility of $290 million, with the resulting excess increasing our cash and cash equivalents to $295 million as of September 30, 2011. Cash flows from operations of $340 million increased $34 million as compared to approximately $306 million for the prior fiscal year, primarily due to the increase in net income over prior fiscal year and a decrease of accounts receivable attributable to improved collection efforts and more timely payments from our customers.
192011 ANNUAL REPORT
Although our cash and cash equivalents have increased to $295 million as of September 30, 2011 from $181 million as of September 30, 2010, our working capital has only increased to $302 million from $267 million for the same fis-cal year end periods primarily due to a $76 million increase in accounts payable as of September 30, 2011 which includes accrued but unpaid invoices related to the ongoing construction of the Atwood Condor.
To date, general inflationary trends have not had a material effect on our operating revenues or expenses.
REvOLviNg cREdiT FAciLiTy
As of September 30, 2011, we had $520 million of outstanding borrowings under our five-year $750 million senior secured revolving credit facility, which we entered into in May 2011 (“2011 Credit Agreement”), for a total debt to capitalization ratio of 24%. As of November 21, 2011, no additional funds had been borrowed subsequent to September 30, 2011. Borrowings under the 2011 Credit Agreement bear interest of the Eurodollar rate plus a margin of 2.50% (approximately 2.8% per annum at September 30, 2011). Certain borrowings effectively bear interest at a fixed rate due to our interest rate swaps. The 2011 Credit Agreement also provides for the issuance, when required, of standby letters of credit. The 2011 Credit Agreement has a commitment fee of 1.0% per annum on the unused portion of the underlying commitment.
The 2011 Credit Agreement contains various financial covenants that impose a maximum leverage ratio of 4.0 to 1.0, a debt to capitalization ratio of 0.5 to 1.0, a minimum interest expense coverage ratio of 3.0 to 1.0 and a minimum collateral maintenance of 150% of the aggregate amount outstanding under the credit facility. In addition, the 2011 Credit Agreement contains limitations on our ability to incur liens; merge, consolidate or sell substantially all assets; pay cash dividends; incur additional indebtedness; make advances, investments or loans; and transact with affiliates. The 2011 Credit Agreement also contains customary events of default, including but not limited to delinquent payments, bankruptcy filings, material adverse judgments, guarantees or security documents not being in full effect, non-compliance with the Employee Retirement Income Security Act of 1974, cross-defaults under other debt agreements, or a change of control. The 2011 Credit Agreement is secured primarily by first preferred mortgages on six of our active drilling units (the Atwood Aurora, the Atwood Beacon, the Atwood Eagle, the Atwood Falcon, the Atwood Hunter, and the Atwood Osprey). We were in compliance with all financial covenants under the 2011 Credit Agreement at September 30, 2011.
Prior to the execution of the 2011 Credit Agreement, we had a five-year $300 million credit facility executed in October 2007 (as amended from time to time, the “2007 Credit Agreement”) and a five-year $280 million credit facility executed in November 2008 (as amended from time to time, the “2008 Credit Agreement”). Both the 2008 Credit Agreement and the 2007 Credit Agreement were retired in May 2011 with funding from the 2011 Credit Agreement.
cAPiTAL ExPENdiTUREs
We estimate that our total capital expenditures for fiscal year 2012 will be approximately $775 million, substantially all of which is contractually committed. These capital expenditures are expected to be funded with existing cash bal-ances on hand, cash flows from operations and additional borrowings under our credit facility. We expect to end fiscal year 2012 with outstanding long-term debt between $725 million and $775 million. As of September 30, 2011, we had expended approximately $650 million on our five drilling units under construction at such time. In October 2011, we exercised an option to construct a second ultra-deepwater drillship, the Atwood Achiever, at the DSME shipyard in South Korea. The Atwood Achiever is expected to be delivered by June 2014 at a total cost, including project management, drilling, handling tools and spares, of approximately $600 million. The expected remaining costs for our six drilling units under construction are as follows (in millions):
Fiscal 2012 Fiscal 2013 Fiscal 2014 Fiscal 2015 Total
$705 $360 $815 $— $1,880
ATwOOd OcEANics, iNc.20
We believe that we will be able to fund primarily all of our additional construction costs prior to mid-fiscal year 2014 with cash on hand, cash flow from operations and borrowings under our revolving credit facility, which has provisions to increase the total commitment to $1.1 billion. We expect to fund any remaining construction costs with additional debt incurrences. We may seek to access the capital markets to fund a portion of our construction program.
OThER
From time to time, we may seek possible expansion and acquisition opportunities relating to our business, which may include the construction or acquisition of rigs or other businesses in addition to those described in this annual report. Such determinations will depend on market conditions and opportunities existing at that time, including with respect to the market for drilling contracts and day rates and the relative costs associated with such expansions or acquisitions. The timing, success or terms of any such efforts and the associated capital commitments are not currently known. In addition to cash on hand, cash flow from operations and borrowings under our revolving credit facility, we may seek to access the capital markets to fund such opportunities. Our ability to access the capital markets depends on a number of factors, including, among others, our credit rating, industry conditions, general economic conditions, market conditions and market perceptions of us and our industry. In addition, we continually review the possibility of disposing of assets that we do not consider core to our long-term business plan.
In addition, in the future, we may seek to redeploy our assets to more active regions if we have the opportunity to do so on attractive terms. We frequently bid for or negotiate with customers regarding multi-year contracts that could require significant capital expenditures and mobilization costs. We expect to fund these opportunities pri-marily with cash on hand, cash flow from operations and borrowings under our revolving credit facility.
OFF-BALANCE SHEET ARRANgEMENTS
We have no off-balance sheet arrangements as that term is defined in Item 303(a)(4)(ii) of Regulations S-K.
COMMITMENTS AND CONTRACTUAL OBLIgATIONS
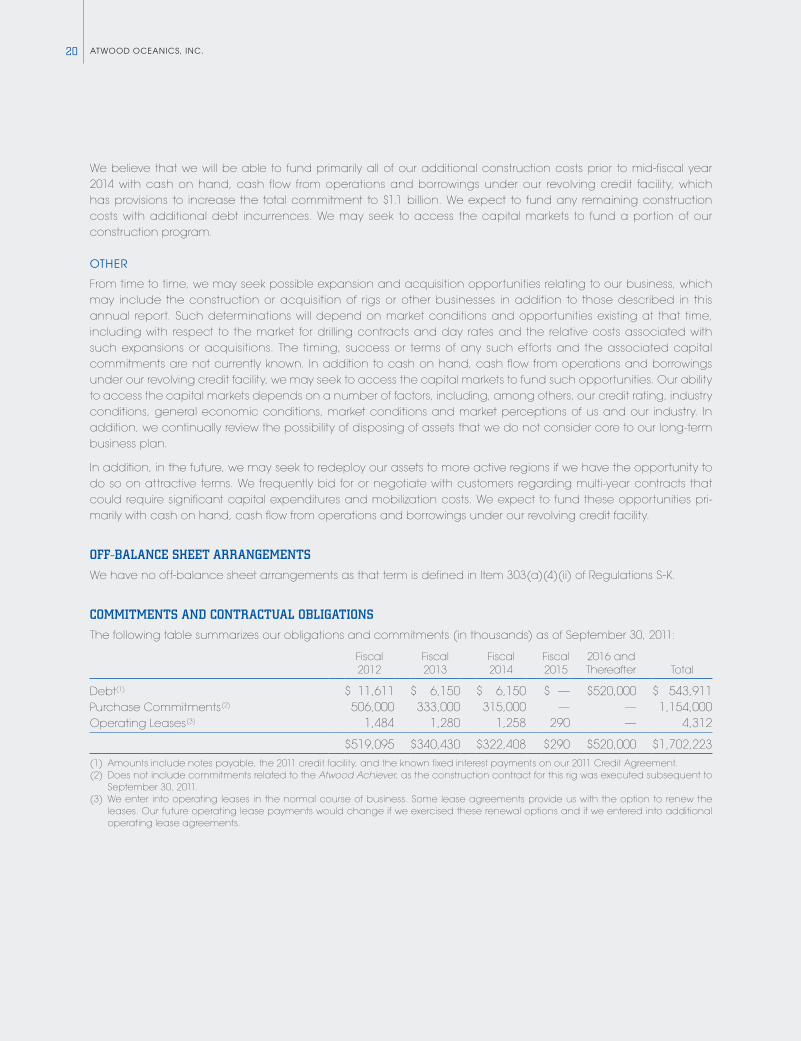
The following table summarizes our obligations and commitments (in thousands) as of September 30, 2011:
Fiscal 2012
Fiscal 2013
Fiscal 2014
Fiscal 2015
2016 and Thereafter Total
Debt(1) $ 11,611 $ 6,150 $ 6,150 $ — $520,000 $ 543,911Purchase Commitments(2) 506,000 333,000 315,000 — — 1,154,000Operating Leases(3) 1,484 1,280 1,258 290 — 4,312
$ 519,095 $ 340,430 $ 322,408 $290 $520,000 $ 1,702,223(1) Amounts include notes payable, the 2011 credit facility, and the known fixed interest payments on our 2011 Credit Agreement.(2) Does not include commitments related to the Atwood Achiever, as the construction contract for this rig was executed subsequent to
September 30, 2011.(3) We enter into operating leases in the normal course of business. Some lease agreements provide us with the option to renew the
leases. Our future operating lease payments would change if we exercised these renewal options and if we entered into additional operating lease agreements.
212011 ANNUAL REPORT
CRITICAL ACCOUNTINg POLICIES
Significant accounting policies are included in Note 2 to our Consolidated Financial Statements for the year ended September 30, 2011. These policies, along with the underlying assumptions and judgments made by manage-ment in their application, have a significant impact on our consolidated financial statements. We identify our most critical accounting policies as those that are the most pervasive and important to the portrayal of our financial position and results of operations, and that require the most difficult, subjective and/or complex judgments by management regarding estimates about matters that are inherently uncertain. Our most critical accounting policies are those related to revenue recognition, property and equipment, impairment of assets, income taxes, and employee stock-based compensation.
REvENUE REcOgNiTiON
We account for contract drilling revenue in accordance with the terms of the underlying drilling contract. These contracts generally provide that revenue is earned and recognized on a daily rate (i.e., “day rate”) basis, and day rates are typically earned for a particular level of service over the life of a contract. Day rate contracts can be performed for a specified period of time or the time required to drill a specified well or number of wells. Revenues from day rate drilling operations, which are classified under contract drilling services, are recognized on a per day basis as services are performed assuming collectability is reasonably assured.
dEFERREd FEEs ANd cOsTs
Fees received prior to the commencement of the drilling contract as compensation for the cost of relocating drilling rigs from one major operating area to another, equipment and upgrade costs reimbursed by the customer, as well as receipt of advance billings of day rates are recognized as earned on a straight-line method over the expected term of the related drilling contract, as are the day rates associated with such contracts. However, fees received upon termination of a drilling contract are generally recognized as earned during the period termination occurs as the termination fee is usually conditional based on the occurrence of an event as defined in the drilling contract, such as obtaining follow-on work to the contract in progress or relocation beyond a certain distance when the contract is completed. In addition, we defer the mobilization costs relating to moving a drilling rig to a new area which are incurred prior to the commencement of the drilling contract and customer requested equipment purchases that will revert to the customer at the end of the applicable drilling contract. We amortize such costs on a straight-line basis over the life of the applicable drilling contract. Contract revenues and drilling costs are reported in the Consolidated Statements of Operations at their gross amounts.
PROPERTy ANd EqUiPmENT
Property and equipment is stated at cost, reduced by provisions to recognize economic impairment in value whenever events or changes in circumstances indicate an asset’s carrying value may not be recoverable. At September 30, 2011, the carrying value of our property and equipment totaled approximately $1.9 billion, which represents approximately 79% of our total assets. The carrying value reflects the application of our property and equipment accounting policies, which incorporate estimates, assumptions and judgments by management relative to the useful lives and salvage values of our units. Once rigs and related equipment are placed in service, they are depreciated on the straight-line method over their estimated useful lives, with depreciation discontinued only during the period when a drilling unit is out of service while undergoing a significant upgrade that extends its useful life. The estimated useful lives of our drilling units and related equipment can range from 3 years to 35 years and our salvage values are generally based on 5% of capitalized costs. Any future increases in our estimates of useful lives or salvage values will have the effect of decreasing future depreciation expense in any one year while spreading the expense out to later years. Any future decreases in our useful lives or salvage values will have the effect of accelerating future depreciation expense.
ATwOOd OcEANics, iNc.22
We evaluate the carrying value of our property and equipment when events or changes in circumstances indicate that the carrying value of such assets may be impaired. In evaluating the need for impairment, we utilize a number of methodologies in the evaluation of our rigs including both a market-based and a modified income-based approach based on potential cash flows. An impairment loss on our property and equipment exists when both the market-based approach and the estimated undiscounted cash flows expected to result from the use of the asset and its eventual disposition are less than the asset’s carrying value. Asset impairment evaluations are, by nature, highly subjective. Operations of our drilling equipment are subject to the offshore drilling requirements of oil and gas exploration and production companies and agencies of foreign governments. These requirements are, in turn, subject to fluctuations in government policies, world demand and price for petroleum products, proved reserves in relation to such demand and the extent to which such demand can be met from onshore sources. The critical estimates which result from these dynamics include projected utilization, day rates, and operating expenses, each of which impacts our estimated future cash flows. Over the last ten years, our equipment utilization rate has averaged approximately 94%; however, if a drilling unit incurs significant idle time or receives day rates below operating costs, its carrying value could become impaired.
The estimates, assumptions and judgments used by management in the application of our property and equip-ment and asset impairment policies reflect both historical experience and expectations regarding future industry conditions and operations. The use of different estimates, assumptions and judgments, especially those involving the useful lives of our rigs and vessels and expectations regarding future industry conditions and operations, would likely result in materially different carrying values of assets and results of operations.
iNcOmE TAxEs
We conduct operations and earn income in numerous foreign countries and are subject to the laws of taxing jurisdictions within those countries, as well as United States federal and state tax laws. At September 30, 2011, we have an approximate $9.8 million net deferred income tax liability. This balance reflects the application of our income tax accounting policies in accordance with Accounting Standards Codification (“ASC”) 740. Such accounting policies incorporate estimates, assumptions and judgments by management relative to the interpretation of applicable tax laws, the application of accounting standards, and future levels of taxable income. The estimates, assumptions and judgments used by management in connection with accounting for income taxes reflect both historical experience and expectations regarding future industry conditions and operations. Changes in these estimates, assumptions and judgments could result in materially different provisions for deferred and current income taxes.
We account for uncertain tax positions in accordance with ASC 740. ASC 740 prescribes a comprehensive model for how companies should recognize, measure, present and disclose in their financial statements uncertain tax positions taken or to be taken on a tax return. The income tax laws and regulations are voluminous and are often ambiguous. As such, we are required to make many subjective assumptions and judgments regarding our tax positions that can materially affect amounts recognized in our consolidated balance sheets and statements of income.
EmPLOyEE shARE-BAsEd cOmPENsATiON
We account for share-based compensation in accordance with ASC 718. Under ASC 718, share-based compen-sation cost is measured at the grant date, based on the calculated fair value of the award, and is recognized as an expense over the requisite service period (generally the vesting period of the equity grant). In addition, share-based compensation cost recognized includes compensation cost for unvested share-based awards as of October 1, 2005.
232011 ANNUAL REPORT
RECENTLY ISSUED ACCOUNTINg PRONOUNCEMENTS
In June 2011, the Financial Accounting Standards Board (“FASB”), issued Accounting Standards Update (“ASU”) 2011-05, “Comprehensive Income (Topic 220): Presentation of Comprehensive Income,” which amends the presentation requirements for comprehensive income and requires that all non-owner changes in stockholders’ equity be presented either as a single continuous statement of comprehensive income or in two separate but consecutive statements. Additionally, the update requires presentation of reclassification adjustments on the face of the financial statement. The update is effective for interim and annual periods beginning after December 15, 2011, with early adoption permitted. We adopted the amendments in this update on June 30, 2011 with no material impact on our consolidated financial statements or disclosures in our financial statements.
In May 2011, the FASB issued ASU 2011-04, “Fair Value Measurement (Topic 820): Amendments to Achieve Common Fair Value Measurement and Disclosure Requirements in U.S. GAAP and IFRS.” The amendment clarifies existing fair value measurement and disclosure requirements, amends certain fair value measurement principles and requires additional disclosures about fair value measurements. ASU 2011-04 is effective for interim and annual periods beginning after December 15, 2011. We will adopt the accounting standards effective January 1, 2012. We do not expect that our adoption will have a material effect on our financial statements or disclosures in our financial statements.
In April 2010, the FASB issued ASU 2010-13, “Compensation—Stock Compensation” (Topic 718). The amendment provides updated guidance on the classification of a share-based payment award as either equity or a liability. The objective of this update is to address the classification of an employee share-based payment award with an exercise price denominated in the currency of a market in which the underlying equity security trades. A share-based payment award that contains a condition that is not a market, performance, or service condition is required to be classified as a liability. We adopted the amendments in this update on October 1, 2010, with no material impact on our financial statements or disclosures in our financial statements.
DISCLOSURES ABOUT MARKET RISK
We are exposed to market risk, including adverse changes in interest rates and foreign currency exchange rates as discussed below.
iNTEREsT RATE Risk
The provisions of the 2011 Credit Agreement provide for a variable interest rate cost on our $520 million outstanding as of September 30, 2011. However, we employ an interest rate risk management strategy that utilizes derivative instruments with respect to $200 million as of September 30, 2011 in order to minimize or eliminate unanticipated fluctuations in earnings and cash flows arising from changes in, and volatility of, interest rates. Effectively, only $320 million of our long-term debt outstanding is subject to changes in interest rates. Thus, a 10% change in the interest rate on the floating rate debt would have an immaterial impact on our annual earnings and cash flows.
FOREigN cURRENcy Risk
As a multinational company, we conduct business in numerous foreign countries. Our functional currency is the U.S. dollar, which is consistent with industry’s practice. Certain of our subsidiaries have monetary assets and liabilities that are denominated in a currency other than our functional currency. Based on September 30, 2011 amounts, a decrease in the value of 10% in foreign currencies relative to the U.S. dollar would have an immaterial effect to our annual earnings and cash flows. We did not have any open derivative contracts relating to foreign currencies at September 30, 2011.
ATwOOd OcEANics, iNc.24
MANAGEMENT’S REPORT ON INTERNAL CONTROL OVER FINANCIAL REPORTINGManagement of Atwood Oceanics, Inc. (which together with its subsidiaries is identified as the “Company,” “we” or “our,” unless stated otherwise or the context requires otherwise) is responsible for establishing and maintaining adequate internal control over financial reporting as defined in Rules 13a-15(f) and 15d-15(f) under the Securities Exchange Act of 1934. Our internal control over financial reporting was designed by management, under the supervision of the Chief Executive Officer and Chief Financial Officer, to provide reasonable assurance regarding the reliability of financial reporting and the preparation of financial statements for external purposes in accordance with accounting principles generally accepted in the United States of America, and includes those policies and procedures that:
(i) pertain to the maintenance of records that, in reasonable detail, accurately and fairly reflect the trans-actions and dispositions of the assets of the Company;
(ii) provide reasonable assurance that transactions are recorded as necessary to permit preparation of financial statements in accordance with accounting principles generally accepted in the United States of America, and that receipts and expenditures of the Company are being made only in accordance with authorizations of management and directors of the Company; and
(iii) provide reasonable assurance regarding prevention or timely detection of unauthorized acquisition, use or disposition of the Company’s assets that could have a material effect on the financial statements.
Because of its inherent limitations, internal control over financial reporting may not prevent or detect misstate-ments. Also, projections of any evaluation of effectiveness to future periods are subject to the risk that controls may become inadequate because of changes in conditions, or that the degree of compliance with the policies and procedures may deteriorate.
Management assessed the effectiveness of the Company’s internal control over financial reporting as of September 30, 2011. In making this assessment, management used the criteria set forth by the Committee of Sponsoring Organizations of the Treadway Commission in Internal Control—Integrated Framework.
Based on our evaluation under the criteria in Internal Control—Integrated Framework, management has concluded that the Company maintained effective internal control over financial reporting as of September 30, 2011. PricewaterhouseCoopers LLP, our independent registered public accounting firm, has issued an attestation report on the effectiveness of the Company’s internal control over financial reporting as of September 30, 2011, which appears on the following page.
ATWOOD OCEANICS, INC.
by
Robert J. Saltiel Mark L. MeyPresident and Senior Vice President andChief Executive Officer Chief Financial Officer
November 22, 2011
252011 ANNUAL REPORT
REPORT OF INDEPENDENT REGISTERED PUBLIC ACCOUNTING FIRMTo the Board of Directors and Shareholders of Atwood Oceanics, Inc.
In our opinion, the accompanying consolidated balance sheets and the related consolidated statements of operations, of cash flows and of changes in shareholders’ equity present fairly, in all material respects, the financial position of Atwood Oceanics, Inc. and its subsidiaries at September 30, 2011 and 2010, and the results of their operations and their cash flows for each of the three years in the period ended September 30, 2011 in conformity with accounting principles generally accepted in the United States of America. Also in our opinion, the Company maintained, in all material respects, effective internal control over financial reporting as of September 30, 2011, based on criteria established in Internal Control—Integrated Framework issued by the Committee of Sponsoring Organizations of the Treadway Commission. The Company’s management is responsible for these financial state-ments, for maintaining effective internal control over financial reporting and for its assessment of the effectiveness of internal control over financial reporting, included in the accompanying Management’s Report on Internal Control Over Financial Reporting. Our responsibility is to express opinions on these financial statements and on the Company’s internal control over financial reporting based on our integrated audits. We conducted our audits in accordance with the standards of the Public Company Accounting Oversight Board (United States). Those standards require that we plan and perform the audits to obtain reasonable assurance about whether the financial statements are free of material misstatement and whether effective internal control over financial reporting was maintained in all material respects. Our audits of the financial statements included examining, on a test basis, evidence supporting the amounts and disclosures in the financial statements, assessing the accounting principles used and significant estimates made by management, and evaluating the overall financial statement presentation. Our audit of internal control over financial reporting included obtaining an understanding of the Company’s internal control over financial reporting, assessing the risk that a material weakness exists, and testing and evaluating the design and operating effectiveness of internal control based on the assessed risk. Our audits also included performing such other procedures as we considered necessary in the circumstances. We believe that our audits provide a reasonable basis for our opinions.
A company’s internal control over financial reporting is a process designed to provide reasonable assurance regarding the reliability of financial reporting and the preparation of financial statements for external purposes in accordance with generally accepted accounting principles. A company’s internal control over financial reporting includes those policies and procedures that (i) pertain to the maintenance of records that, in reasonable detail, accurately and fairly reflect the transactions and dispositions of the assets of the company; (ii) provide reasonable assurance that transactions are recorded as necessary to permit preparation of financial statements in accor-dance with generally accepted accounting principles, and that receipts and expenditures of the company are being made only in accordance with authorizations of management and directors of the company; and (iii) provide reasonable assurance regarding prevention or timely detection of unauthorized acquisition, use, or disposition of the company’s assets that could have a material effect on the financial statements.
Because of its inherent limitations, internal control over financial reporting may not prevent or detect misstate-ments. Also, projections of any evaluation of effectiveness to future periods are subject to the risk that controls may become inadequate because of changes in conditions, or that the degree of compliance with the policies or procedures may deteriorate.
Houston, TexasNovember 22, 2011
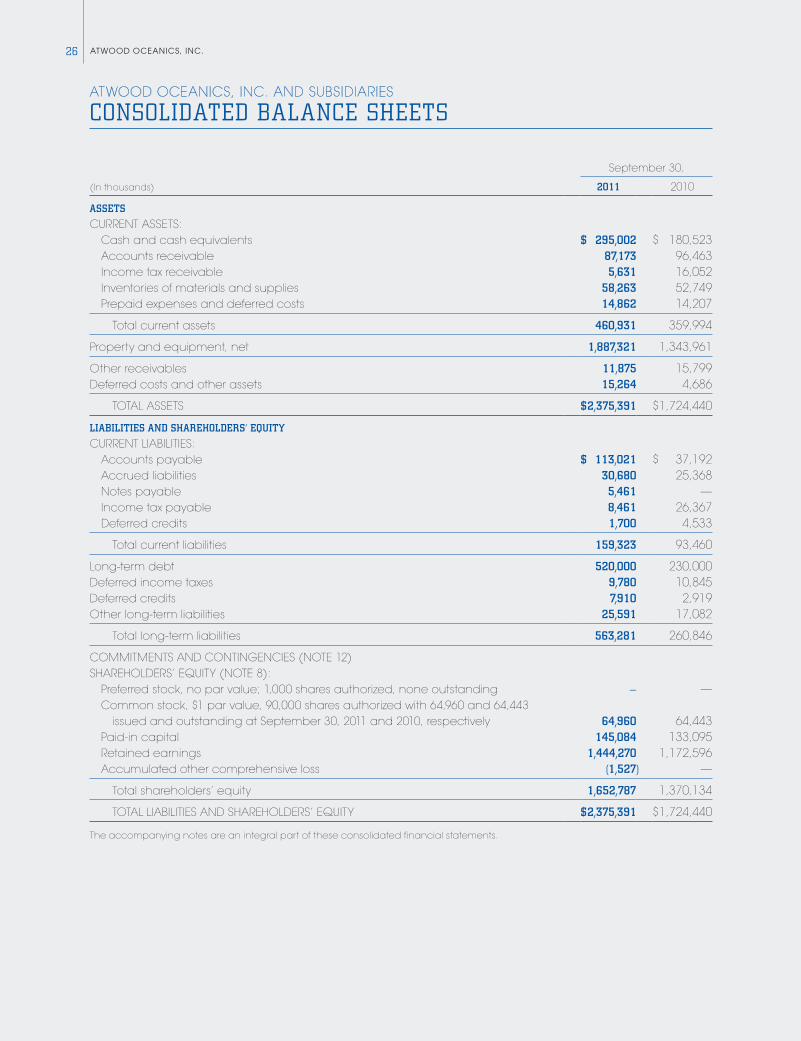
ATwOOd OcEANics, iNc.26
ATWOOD OCEANICS, INC. AND SUBSIDIARIES
CONSOLIDATED BALANCE SHEETS
September 30,
(In thousands) 2011 2010
ASSETS
CURRENT ASSETS: Cash and cash equivalents $ 295,002 $ 180,523 Accounts receivable 87,173 96,463 Income tax receivable 5,631 16,052 Inventories of materials and supplies 58,263 52,749 Prepaid expenses and deferred costs 14,862 14,207
Total current assets 460,931 359,994
Property and equipment, net 1,887,321 1,343,961
Other receivables 11,875 15,799Deferred costs and other assets 15,264 4,686
TOTAL ASSETS $ 2,375,391 $ 1,724,440
LIABILITIES AND SHAREHOLDERS’ EQUITY
CURRENT LIABILITIES: Accounts payable $ 113,021 $ 37,192 Accrued liabilities 30,680 25,368 Notes payable 5,461 — Income tax payable 8,461 26,367 Deferred credits 1,700 4,533
Total current liabilities 159,323 93,460
Long-term debt 520,000 230,000Deferred income taxes 9,780 10,845Deferred credits 7,910 2,919Other long-term liabilities 25,591 17,082
Total long-term liabilities 563,281 260,846
COMMITMENTS AND CONTINGENCIES (NOTE 12)SHAREHOLDERS’ EQUITY (NOTE 8): Preferred stock, no par value; 1,000 shares authorized, none outstanding — — Common stock, $1 par value, 90,000 shares authorized with 64,960 and 64,443
issued and outstanding at September 30, 2011 and 2010, respectively 64,960 64,443 Paid-in capital 145,084 133,095 Retained earnings 1,444,270 1,172,596 Accumulated other comprehensive loss (1,527) —
Total shareholders’ equity 1,652,787 1,370,134
TOTAL LIABILITIES AND SHAREHOLDERS’ EQUITY $ 2,375,391 $ 1,724,440
The accompanying notes are an integral part of these consolidated financial statements.
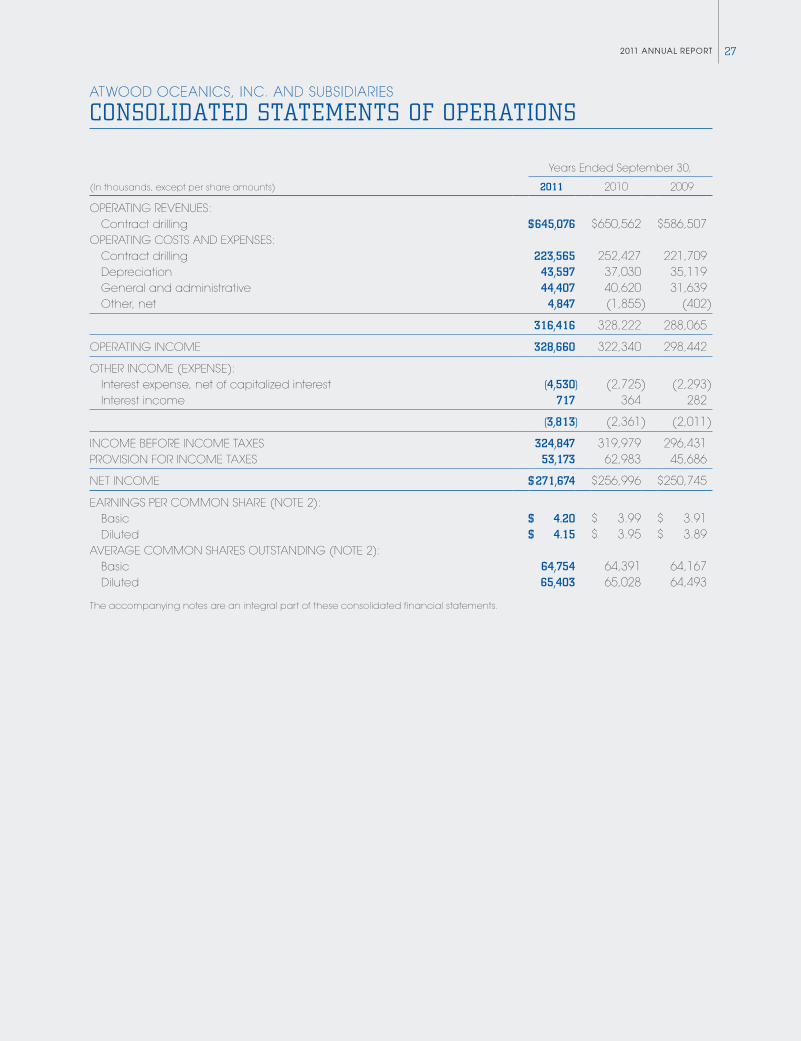
272011 ANNUAL REPORT
ATWOOD OCEANICS, INC. AND SUBSIDIARIES
CONSOLIDATED STATEMENTS OF OPERATIONS
Years Ended September 30,
(In thousands, except per share amounts) 2011 2010 2009
OPERATING REVENUES: Contract drilling $ 645,076 $ 650,562 $ 586,507OPERATING COSTS AND ExPENSES: Contract drilling 223,565 252,427 221,709 Depreciation 43,597 37,030 35,119 General and administrative 44,407 40,620 31,639 Other, net 4,847 (1,855) (402)
316,416 328,222 288,065
OPERATING INCOME 328,660 322,340 298,442
OTHER INCOME (ExPENSE): Interest expense, net of capitalized interest (4,530) (2,725) (2,293) Interest income 717 364 282
(3,813) (2,361) (2,011)
INCOME BEFORE INCOME TAxES 324,847 319,979 296,431PROVISION FOR INCOME TAxES 53,173 62,983 45,686
NET INCOME $ 271,674 $ 256,996 $ 250,745
EARNINGS PER COMMON SHARE (NOTE 2): Basic $ 4.20 $ 3.99 $ 3.91 Diluted $ 4.15 $ 3.95 $ 3.89AVERAGE COMMON SHARES OUTSTANDING (NOTE 2): Basic 64,754 64,391 64,167 Diluted 65,403 65,028 64,493
The accompanying notes are an integral part of these consolidated financial statements.
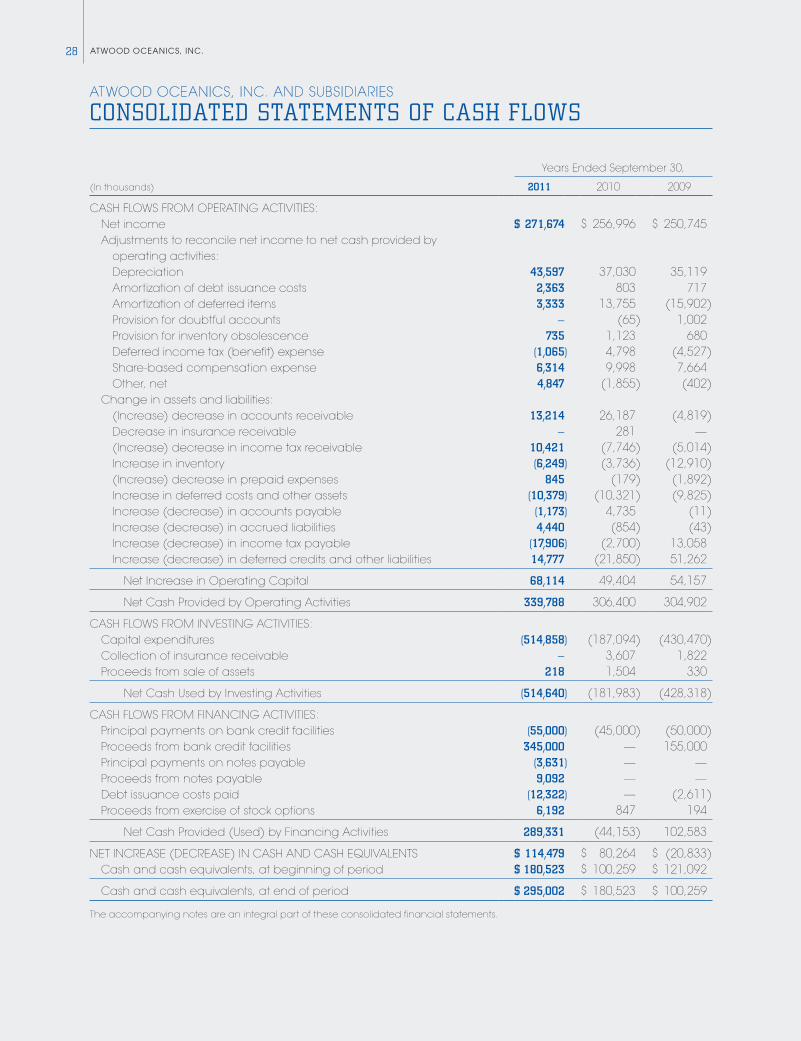
ATwOOd OcEANics, iNc.28
ATWOOD OCEANICS, INC. AND SUBSIDIARIES
CONSOLIDATED STATEMENTS OF CASH FLOWS
Years Ended September 30,
(In thousands) 2011 2010 2009
CASH FLOWS FROM OPERATING ACTIVITIES: Net income $ 271,674 $ 256,996 $ 250,745 Adjustments to reconcile net income to net cash provided by operating activities: Depreciation 43,597 37,030 35,119 Amortization of debt issuance costs 2,363 803 717 Amortization of deferred items 3,333 13,755 (15,902) Provision for doubtful accounts — (65) 1,002 Provision for inventory obsolescence 735 1,123 680 Deferred income tax (benefit) expense (1,065) 4,798 (4,527) Share-based compensation expense 6,314 9,998 7,664 Other, net 4,847 (1,855) (402) Change in assets and liabilities: (Increase) decrease in accounts receivable 13,214 26,187 (4,819) Decrease in insurance receivable — 281 — (Increase) decrease in income tax receivable 10,421 (7,746) (5,014) Increase in inventory (6,249) (3,736) (12,910) (Increase) decrease in prepaid expenses 845 (179) (1,892) Increase in deferred costs and other assets (10,379) (10,321) (9,825) Increase (decrease) in accounts payable (1,173) 4,735 (11) Increase (decrease) in accrued liabilities 4,440 (854) (43) Increase (decrease) in income tax payable (17,906) (2,700) 13,058 Increase (decrease) in deferred credits and other liabilities 14,777 (21,850) 51,262
Net Increase in Operating Capital 68,114 49,404 54,157
Net Cash Provided by Operating Activities 339,788 306,400 304,902
CASH FLOWS FROM INVESTING ACTIVITIES: Capital expenditures (514,858) (187,094) (430,470) Collection of insurance receivable — 3,607 1,822 Proceeds from sale of assets 218 1,504 330
Net Cash Used by Investing Activities (514,640) (181,983) (428,318)
CASH FLOWS FROM FINANCING ACTIVITIES: Principal payments on bank credit facilities (55,000) (45,000) (50,000) Proceeds from bank credit facilities 345,000 — 155,000 Principal payments on notes payable (3,631) — — Proceeds from notes payable 9,092 — — Debt issuance costs paid (12,322) — (2,611) Proceeds from exercise of stock options 6,192 847 194
Net Cash Provided (Used) by Financing Activities 289,331 (44,153) 102,583
NET INCREASE (DECREASE) IN CASH AND CASH EQUIVALENTS $ 114,479 $ 80,264 $ (20,833) Cash and cash equivalents, at beginning of period $ 180,523 $ 100,259 $ 121,092
Cash and cash equivalents, at end of period $ 295,002 $ 180,523 $ 100,259
The accompanying notes are an integral part of these consolidated financial statements.
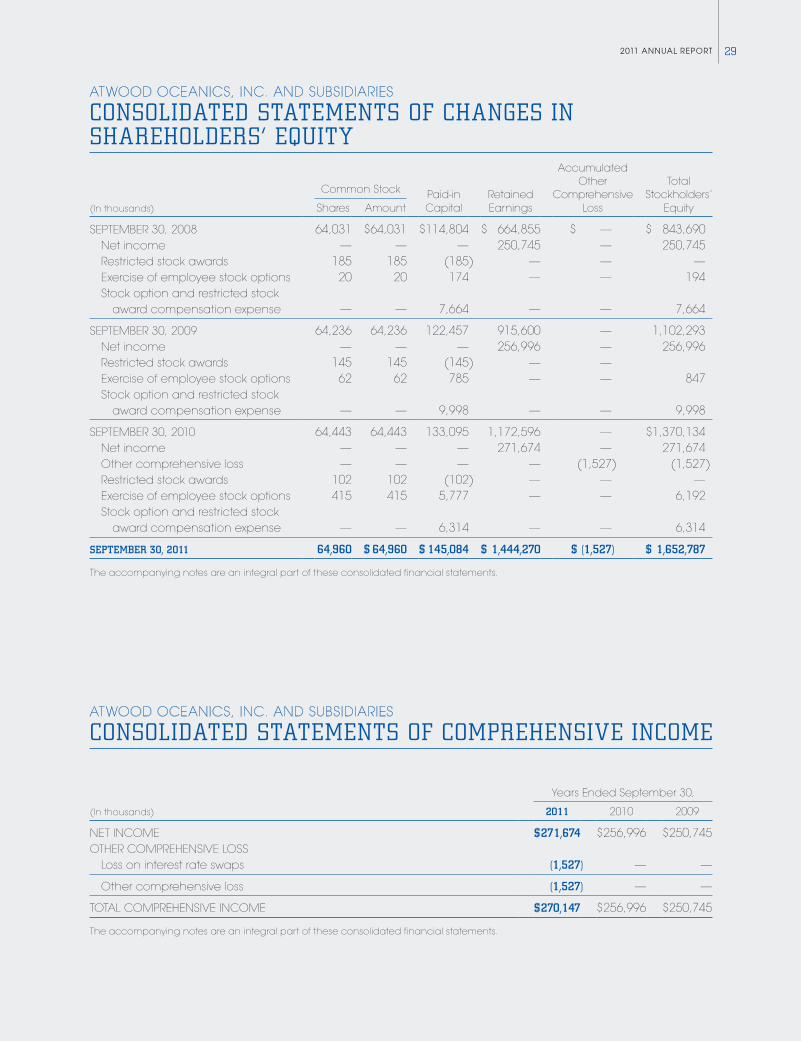
292011 ANNUAL REPORT
ATWOOD OCEANICS, INC. AND SUBSIDIARIES
CONSOLIDATED STATEMENTS OF CHANGES IN SHAREHOLDERS’ EQUITY
Common Stock Paid-in Retained
Accumulated Other
ComprehensiveTotal
Stockholders’(In thousands) Shares Amount Capital Earnings Loss Equity
SEPTEMBER 30, 2008 64,031 $ 64,031 $ 114,804 $ 664,855 $ — $ 843,690 Net income — — — 250,745 — 250,745 Restricted stock awards 185 185 (185) — — — Exercise of employee stock options 20 20 174 — — 194 Stock option and restricted stock
award compensation expense — — 7,664 — — 7,664
SEPTEMBER 30, 2009 64,236 64,236 122,457 915,600 — 1,102,293 Net income — — — 256,996 — 256,996 Restricted stock awards 145 145 (145) — — Exercise of employee stock options 62 62 785 — — 847 Stock option and restricted stock
award compensation expense — — 9,998 — — 9,998
SEPTEMBER 30, 2010 64,443 64,443 133,095 1,172,596 — $1,370,134 Net income — — — 271,674 — 271,674 Other comprehensive loss — — — — (1,527) (1,527) Restricted stock awards 102 102 (102) — — — Exercise of employee stock options 415 415 5,777 — — 6,192 Stock option and restricted stock
award compensation expense — — 6,314 — — 6,314
SEPTEMBER 30, 2011 64,960 $ 64,960 $ 145,084 $ 1,444,270 $ (1,527) $ 1,652,787
The accompanying notes are an integral part of these consolidated financial statements.
ATWOOD OCEANICS, INC. AND SUBSIDIARIES
CONSOLIDATED STATEMENTS OF COMPREHENSIVE INCOME
Years Ended September 30,
(In thousands) 2011 2010 2009
NET INCOME $ 271,674 $ 256,996 $ 250,745OTHER COMPREHENSIVE LOSS Loss on interest rate swaps (1,527) — —
Other comprehensive loss (1,527) — —
TOTAL COMPREHENSIVE INCOME $ 270,147 $ 256,996 $ 250,745
The accompanying notes are an integral part of these consolidated financial statements.
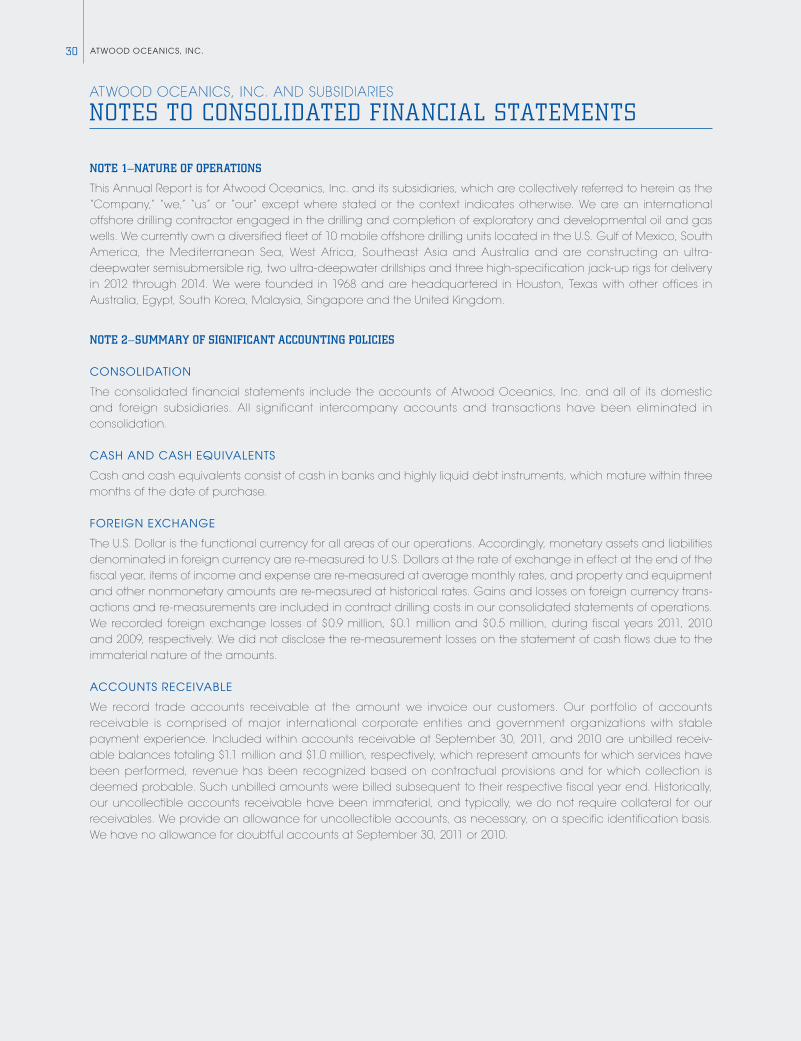
ATwOOd OcEANics, iNc.30
ATWOOD OCEANICS, INC. AND SUBSIDIARIES
NOTES TO CONSOLIDATED FINANCIAL STATEMENTS
NOTE 1—NATURE OF OPERATIONS
This Annual Report is for Atwood Oceanics, Inc. and its subsidiaries, which are collectively referred to herein as the “Company,” “we,” “us” or “our” except where stated or the context indicates otherwise. We are an international offshore drilling contractor engaged in the drilling and completion of exploratory and developmental oil and gas wells. We currently own a diversified fleet of 10 mobile offshore drilling units located in the U.S. Gulf of Mexico, South America, the Mediterranean Sea, West Africa, Southeast Asia and Australia and are constructing an ultra- deepwater semisubmersible rig, two ultra-deepwater drillships and three high-specification jack-up rigs for delivery in 2012 through 2014. We were founded in 1968 and are headquartered in Houston, Texas with other offices in Australia, Egypt, South Korea, Malaysia, Singapore and the United Kingdom.
NOTE 2—SUMMARY OF SIgNIFICANT ACCOUNTINg POLICIES
cONsOLidATiON
The consolidated financial statements include the accounts of Atwood Oceanics, Inc. and all of its domestic and foreign subsidiaries. All significant intercompany accounts and transactions have been eliminated in consolidation.
cAsh ANd cAsh EqUivALENTs
Cash and cash equivalents consist of cash in banks and highly liquid debt instruments, which mature within three months of the date of purchase.
FOREigN ExchANgE
The U.S. Dollar is the functional currency for all areas of our operations. Accordingly, monetary assets and liabilities denominated in foreign currency are re-measured to U.S. Dollars at the rate of exchange in effect at the end of the fiscal year, items of income and expense are re-measured at average monthly rates, and property and equipment and other nonmonetary amounts are re-measured at historical rates. Gains and losses on foreign currency trans-actions and re-measurements are included in contract drilling costs in our consolidated statements of operations. We recorded foreign exchange losses of $0.9 million, $0.1 million and $0.5 million, during fiscal years 2011, 2010 and 2009, respectively. We did not disclose the re-measurement losses on the statement of cash flows due to the immaterial nature of the amounts.
AccOUNTs REcEivABLE
We record trade accounts receivable at the amount we invoice our customers. Our portfolio of accounts receivable is comprised of major international corporate entities and government organizations with stable payment experience. Included within accounts receivable at September 30, 2011, and 2010 are unbilled receiv-able balances totaling $1.1 million and $1.0 million, respectively, which represent amounts for which services have been performed, revenue has been recognized based on contractual provisions and for which collection is deemed probable. Such unbilled amounts were billed subsequent to their respective fiscal year end. Historically, our uncollectible accounts receivable have been immaterial, and typically, we do not require collateral for our receivables. We provide an allowance for uncollectible accounts, as necessary, on a specific identification basis. We have no allowance for doubtful accounts at September 30, 2011 or 2010.
312011 ANNUAL REPORT
iNvENTORiEs OF mATERiAL ANd sUPPLiEs
Inventories consist of spare parts, material and supplies held for consumption and are stated principally at the lower of average cost or market value, net of reserves for excess and obsolete inventory of $2.5 million and $2.0 million at September 30, 2011, and 2010, respectively.
iNcOmE TAxEs
We account for income taxes in accordance with Financial Accounting Standards Board (“FASB”) Accounting Standards Codification (“ASC”) 740. Under ASC 740, deferred income taxes are recorded to reflect the tax conse-quences on future years of differences between the tax basis of assets and liabilities and their financial reporting amounts at each year-end given the provisions of enacted tax laws in each respective jurisdiction. Deferred tax assets are reduced by a valuation allowance when, based upon management’s estimates, it is more likely than not that a portion of the deferred tax assets will not be realized in a future period. In addition, we accrue for income tax contingencies, or uncertain tax positions, that we believe are more likely than not exposures. See Note 7 for further discussion.
PROPERTy ANd EqUiPmENT
Property and equipment are recorded at historical cost. Interest costs related to property under construction are capitalized as a component of construction costs. Interest capitalized during fiscal years 2011, 2010 and 2009 was $8.2 million, $3.9 million and $8.8 million, respectively.
Once rigs and related equipment are placed in service, they are depreciated on the straight-line method over their estimated useful lives, with depreciation discontinued only during the period when a drilling unit is out of service while undergoing a significant upgrade that extends its useful life. Our estimated useful lives of our various classifications of assets are as follows:
Years
Drilling vessels and related equipment 5–35Drill pipe 3Furniture and other 3–10
Effective July 1, 2010, we extended the remaining depreciable life of the Atwood Southern Cross from one year to five years, based upon completion of a life enhancing upgrade, as the rig is technically capable of working over this revised period.
Effective October 1, 2008, we extended the remaining depreciable life of the Seahawk from one year to five years based upon the length of its then current contract commitment coupled with the fact that the rig is technically capable of working over this revised period.
Maintenance, repairs and minor replacements are charged against income as incurred. Major replacements and upgrades are capitalized and depreciated over the remaining useful life of the asset, as determined upon completion of the work. The cost and related accumulated depreciation of assets sold, retired or otherwise disposed are removed from the accounts at the time of disposition, and any resulting gain or loss is reflected in the Consolidated Statements of Operations for the applicable periods.
ATwOOd OcEANics, iNc.32
imPAiRmENT OF PROPERTy ANd EqUiPmENT
We periodically evaluate our property and equipment to determine whether their net carrying value is in excess of their net realizable value. These evaluations are performed when we have sustained significant declines in utilization and day rates, and recovery is not contemplated in the near future. We consider a number of factors such as estimated future cash flows, appraisals and current market value analysis in determining an asset’s fair value. Assets are written down to their fair value if the carrying amount of the asset is not recoverable and exceeds its fair value.
We recorded an impairment charge of $5.0 million during fiscal year 2011 related to certain idled equipment.
dEFERREd dRydOckiNg cOsTs
We defer the costs of scheduled drydocking and charge such costs to contract drilling expense over the period to the next scheduled drydocking (normally 30 months). At September 30, 2011, and 2010, deferred drydocking costs totaling $2.2 million and $1.5 million, respectively, were included in Deferred Costs and Other Assets in the accompanying Consolidated Balance Sheets.
REvENUE REcOgNiTiON
We account for contract drilling revenue in accordance with the terms of the underlying drilling contract. These contracts generally provide that revenue is earned and recognized on a daily rate (i.e., “day rate”) basis, and day rates are typically earned for a particular level of service over the life of a contract. Day rate contracts can be performed for a specified period of time or the time required to drill a specified well or number of wells. Revenues from day rate drilling operations, which are classified under contract drilling services, are recognized on a per day basis as services are performed assuming collectability is reasonably assured.
dEFERREd FEEs ANd cOsTs
Fees received prior to the commencement of the drilling contract as compensation for the cost of relocating drilling rigs from one major operating area to another, equipment and upgrade costs reimbursed by the customer, as well as receipt of advance billings of day rates are recognized as earned on a straight-line method over the expected term of the related drilling contract, as are the day rates associated with such contracts. However, fees received upon termination of a drilling contract are generally recognized as earned during the period termination occurs as the termination fee is usually conditional based on the occurrence of an event as defined in the drilling contract, such as obtaining follow-on work to the contract in progress or relocation beyond a certain distance when the contract is completed. In addition, we defer the mobilization costs relating to moving a drilling rig to a new area which are incurred prior to the commencement of the drilling contract and customer requested equipment purchases that will revert to the customer at the end of the applicable drilling contract. We amortize such costs on a straight-line basis over the life of the applicable drilling contract. Contract revenues and drilling costs are reported in the Consolidated Statements of Operations at their gross amounts.
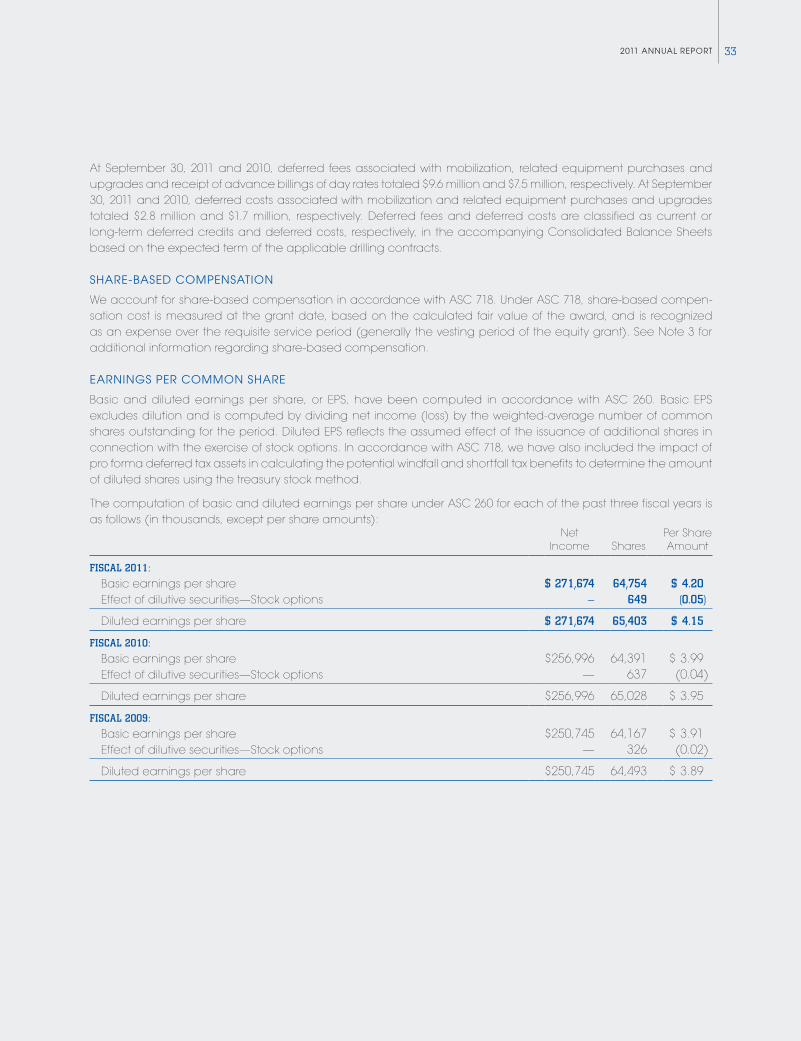
332011 ANNUAL REPORT
At September 30, 2011 and 2010, deferred fees associated with mobilization, related equipment purchases and upgrades and receipt of advance billings of day rates totaled $9.6 million and $7.5 million, respectively. At September 30, 2011 and 2010, deferred costs associated with mobilization and related equipment purchases and upgrades totaled $2.8 million and $1.7 million, respectively. Deferred fees and deferred costs are classified as current or long-term deferred credits and deferred costs, respectively, in the accompanying Consolidated Balance Sheets based on the expected term of the applicable drilling contracts.
ShARE-bASEd cOmPENSATiON
We account for share-based compensation in accordance with ASC 718. Under ASC 718, share-based compen-sation cost is measured at the grant date, based on the calculated fair value of the award, and is recognized as an expense over the requisite service period (generally the vesting period of the equity grant). See Note 3 for additional information regarding share-based compensation.
EARNiNgS PER cOmmON ShARE
Basic and diluted earnings per share, or EPS, have been computed in accordance with ASC 260. Basic EPS excludes dilution and is computed by dividing net income (loss) by the weighted-average number of common shares outstanding for the period. Diluted EPS reflects the assumed effect of the issuance of additional shares in connection with the exercise of stock options. In accordance with ASC 718, we have also included the impact of pro forma deferred tax assets in calculating the potential windfall and shortfall tax benefits to determine the amount of diluted shares using the treasury stock method.
The computation of basic and diluted earnings per share under ASC 260 for each of the past three fiscal years is as follows (in thousands, except per share amounts):
Net Income Shares
Per Share Amount
Fiscal 2011:
Basic earnings per share $ 271,674 64,754 $ 4.20 Effect of dilutive securities—Stock options — 649 (0.05)
Diluted earnings per share $ 271,674 65,403 $ 4.15
Fiscal 2010:
Basic earnings per share $ 256,996 64,391 $ 3.99 Effect of dilutive securities—Stock options — 637 (0.04)
Diluted earnings per share $ 256,996 65,028 $ 3.95
Fiscal 2009:
Basic earnings per share $ 250,745 64,167 $ 3.91 Effect of dilutive securities—Stock options — 326 (0.02)
Diluted earnings per share $ 250,745 64,493 $ 3.89
ATwOOd OcEANics, iNc.34
The calculation of diluted earnings per share for fiscal years 2011, 2010 and 2009 exclude consideration of shares of common stock which may be issued in connection with outstanding stock options of 664,000, 500,000 and 316,000, respectively, because such options were anti-dilutive. These options could potentially dilute basic EPS in the future.
UsE OF EsTimATEs
The preparation of financial statements in conformity with generally accepted accounting principles in the United States (“GAAP”) requires management to make extensive use of estimates and assumptions that affect the reported amounts of assets and liabilities and disclosure of contingent assets and liabilities at the date of the financial statements and the reported amounts of revenues and expenses during the reporting period. Actual results could differ from those estimates.
REcLAssiFicATiONs
Certain reclassifications have been made to the prior period financial statements to conform to the current year presentation. These reclassifications did not affect the Consolidated Financial Statements reported in prior fiscal years.
NOTE 3—SHARE-BASED COMPENSATION
We account for share-based compensation in accordance with ASC 718. Under ASC 718, share-based compen-sation cost is measured at the grant date, based on the calculated fair value of the award, and is recognized as an expense over the requisite service period, which is generally the vesting period of the equity award.
On December 7, 2006, our board of directors adopted, and our stockholders subsequently approved on February 8, 2007, the Atwood Oceanics, Inc. 2007 Long-Term Incentive Plan (as amended, the “2007 Plan”). The effective date of the 2007 Plan was December 7, 2006, and awards may be made under the 2007 Plan through December 7, 2016. Under our 2007 Plan, up to 4,000,000 shares of common stock may be issued to eligible participants in the form of restricted stock awards or upon exercise of stock options granted pursuant to the 2007 Plan. We also maintain two other stock incentive plans approved by our shareholders, the Atwood Oceanics, Inc. Amended and Restated 2001 Stock Incentive Plan (as amended, the “2001 Plan”) and the Atwood Oceanics, Inc. 1996 Incentive Equity Plan (as amended, the “1996 Plan”), under which we have outstanding stock options and restricted stock awards. However, no additional options or restricted stock awards have been awarded under the 2001 or 1996 plans since the implementation of the 2007 Plan. All stock incentive plans currently in effect have been approved by our shareholders.
A summary of shares available for issuance and outstanding stock option and restricted stock awards for our three stock incentive plans as of September 30, 2011 is as follows:
2007 Plan
2001 Plan
1996 Plan
Shares available for future awards or grants 1,895,274 — —Outstanding stock option grants 860,744 594,725 24,000Outstanding unvested restricted stock awards 559,712 — —
Awards of restricted stock and stock options have both been granted under our stock incentive plans as of September 30, 2011. We deliver newly issued shares of common stock for restricted stock awards upon vesting and upon exercise of stock options.
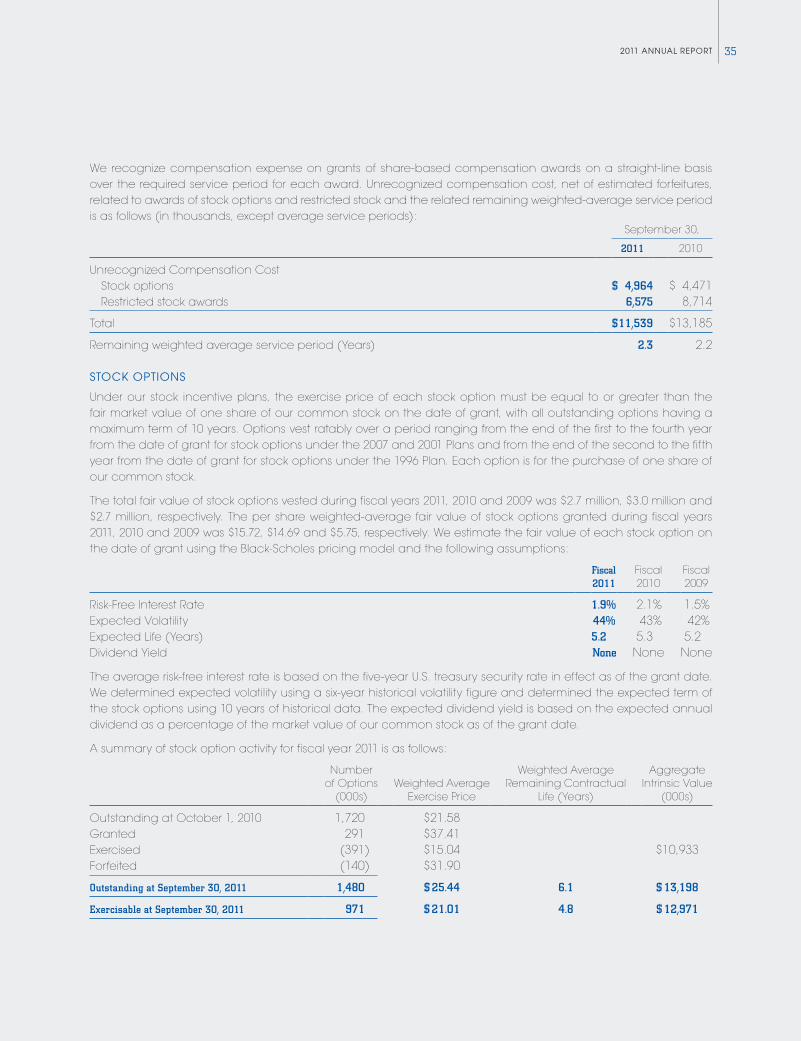
352011 ANNUAL REPORT
We recognize compensation expense on grants of share-based compensation awards on a straight-line basis over the required service period for each award. Unrecognized compensation cost, net of estimated forfeitures, related to awards of stock options and restricted stock and the related remaining weighted-average service period is as follows (in thousands, except average service periods):
September 30,
2011 2010
Unrecognized Compensation Cost Stock options $ 4,964 $ 4,471 Restricted stock awards 6,575 8,714
Total $ 11,539 $ 13,185
Remaining weighted average service period (Years) 2.3 2.2
sTOck OPTiONs
Under our stock incentive plans, the exercise price of each stock option must be equal to or greater than the fair market value of one share of our common stock on the date of grant, with all outstanding options having a maximum term of 10 years. Options vest ratably over a period ranging from the end of the first to the fourth year from the date of grant for stock options under the 2007 and 2001 Plans and from the end of the second to the fifth year from the date of grant for stock options under the 1996 Plan. Each option is for the purchase of one share of our common stock.
The total fair value of stock options vested during fiscal years 2011, 2010 and 2009 was $2.7 million, $3.0 million and $2.7 million, respectively. The per share weighted-average fair value of stock options granted during fiscal years 2011, 2010 and 2009 was $15.72, $14.69 and $5.75, respectively. We estimate the fair value of each stock option on the date of grant using the Black-Scholes pricing model and the following assumptions:
Fiscal 2011
Fiscal 2010
Fiscal 2009
Risk-Free Interest Rate 1.9% 2.1% 1.5%Expected Volatility 44% 43% 42%Expected Life (Years) 5.2 5.3 5.2Dividend Yield None None None
The average risk-free interest rate is based on the five-year U.S. treasury security rate in effect as of the grant date. We determined expected volatility using a six-year historical volatility figure and determined the expected term of the stock options using 10 years of historical data. The expected dividend yield is based on the expected annual dividend as a percentage of the market value of our common stock as of the grant date.
A summary of stock option activity for fiscal year 2011 is as follows:
Number of Options
(000s)Weighted Average
Exercise Price
Weighted Average Remaining Contractual
Life (Years)
Aggregate Intrinsic Value
(000s)
Outstanding at October 1, 2010 1,720 $21.58Granted 291 $37.41Exercised (391) $15.04 $10,933Forfeited (140) $31.90
Outstanding at September 30, 2011 1,480 $ 25.44 6.1 $ 13,198
Exercisable at September 30, 2011 971 $ 21.01 4.8 $ 12,971
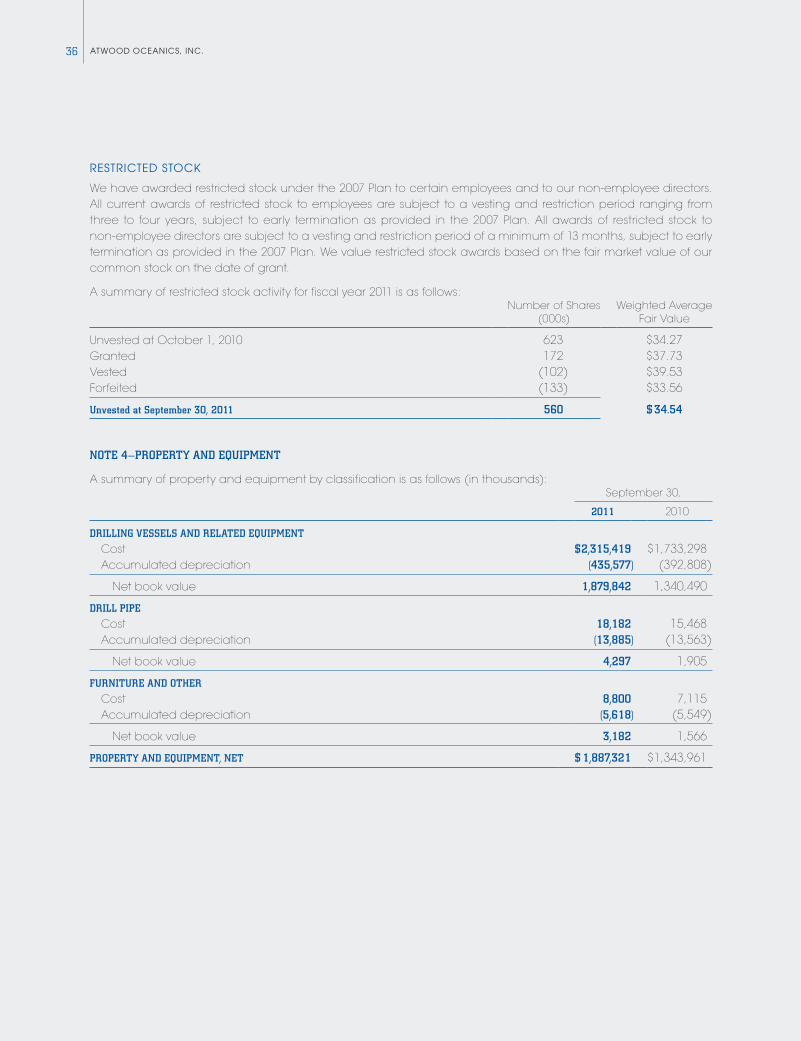
ATwOOd OcEANics, iNc.36
REsTRicTEd sTOck
We have awarded restricted stock under the 2007 Plan to certain employees and to our non-employee directors. All current awards of restricted stock to employees are subject to a vesting and restriction period ranging from three to four years, subject to early termination as provided in the 2007 Plan. All awards of restricted stock to non-employee directors are subject to a vesting and restriction period of a minimum of 13 months, subject to early termination as provided in the 2007 Plan. We value restricted stock awards based on the fair market value of our common stock on the date of grant.
A summary of restricted stock activity for fiscal year 2011 is as follows:Number of Shares
(000s)Weighted Average
Fair Value
Unvested at October 1, 2010 623 $34.27Granted 172 $37.73Vested (102) $39.53Forfeited (133) $33.56
Unvested at September 30, 2011 560 $ 34.54
NOTE 4—PROPERTY AND EQUIPMENT
A summary of property and equipment by classification is as follows (in thousands):September 30,
2011 2010
DRILLINg vESSELS AND RELATED EQUIPMENT
Cost $ 2,315,419 $ 1,733,298 Accumulated depreciation (435,577) (392,808)
Net book value 1,879,842 1,340,490
DRILL PIPE
Cost 18,182 15,468 Accumulated depreciation (13,885) (13,563)
Net book value 4,297 1,905
FURNITURE AND OTHER
Cost 8,800 7,115 Accumulated depreciation (5,618) (5,549)
Net book value 3,182 1,566
PROPERTY AND EQUIPMENT, NET $ 1,887,321 $1,343,961
372011 ANNUAL REPORT
NEw cONsTRUcTiON PROJEcTs
During fiscal year 2008, we entered into construction contracts with Jurong Shipyard Pte. Ltd. to construct two Friede & Goldman ExD Millennium semisubmersible drilling units (the Atwood Osprey and the Atwood Condor). The Atwood Osprey was delivered in April 2011, and the Atwood Condor is scheduled for delivery in the third quarter of fiscal year 2012.
In October 2010, we entered into turnkey construction agreements with PPL Shipyard PTE LTD in Singapore (“PPL”) to construct two Pacific Class 400 jack-up drilling units (the Atwood Mako and the Atwood Manta). The Atwood Mako and the Atwood Manta are scheduled for delivery in the fourth quarter of fiscal year 2012 and the first quarter of fiscal year 2013, respectively.
In January 2011, we exercised the first of three option agreements and entered into a turnkey construction agreement with PPL to construct a third Pacific Class 400 jack-up drilling unit (the Atwood Orca). The Atwood Orca is scheduled for delivery in the third quarter of fiscal year 2013.
In January 2011, we entered into a turnkey construction contract with Daewoo Shipbuilding and Marine Engineering Co., Ltd (“DSME”) to construct an ultra-deepwater drillship, the Atwood Advantage, at the DSME yard in South Korea. The Atwood Advantage is scheduled for delivery in the fourth quarter of fiscal year 2013.
As of September 30, 2011, we had expended approximately $650 million towards the construction of our five drilling units under construction. Total remaining firm commitments for our five drilling units under construction were approximately $1.2 billion at September 30, 2011.
On October 15, 2011, we entered into a turnkey construction contract with DSME to construct an ultra-deepwater drillship, the Atwood Achiever, at the DSME yard in South Korea. The Atwood Achiever is expected to be delivered by June 30, 2014.
wAREhOUsE FiRE
On October 25, 2008, a fire occurred in a third-party warehouse facility in Houston, Texas that we use to store fleet-wide spare capital equipment. In addition, this third party provides international freight forwarding services, and thus, the location was also used as a staging area for equipment shipments to our international fleet. Although the fire was contained primarily to one area of the facility, we did incur significant damage to our fleet spares and other equipment in-transit. At the time of the incident we had insurance to cover the cost of replacing and repairing damaged equipment in excess of a $1,000 deductible.
As of September 30, 2010, our claim was fully processed and deemed closed by the insurance company. We collected all insurance proceeds equal to our $6.2 million property loss claim and costs incurred to inspect and evaluate damaged equipment.
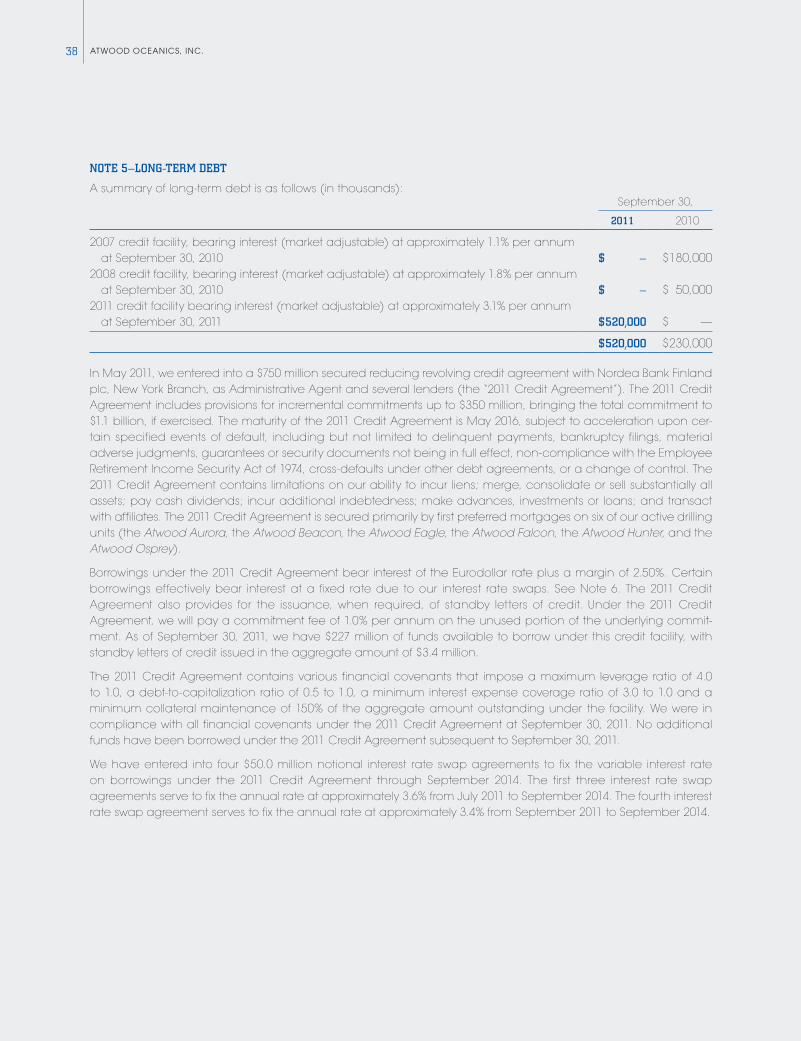
ATwOOd OcEANics, iNc.38
NOTE 5—LONg-TERM DEBT
A summary of long-term debt is as follows (in thousands):September 30,
2011 2010
2007 credit facility, bearing interest (market adjustable) at approximately 1.1% per annum at September 30, 2010 $ — $ 180,0002008 credit facility, bearing interest (market adjustable) at approximately 1.8% per annum at September 30, 2010 $ — $ 50,0002011 credit facility bearing interest (market adjustable) at approximately 3.1% per annum at September 30, 2011 $ 520,000 $ —
$ 520,000 $ 230,000
In May 2011, we entered into a $750 million secured reducing revolving credit agreement with Nordea Bank Finland plc, New York Branch, as Administrative Agent and several lenders (the “2011 Credit Agreement”). The 2011 Credit Agreement includes provisions for incremental commitments up to $350 million, bringing the total commitment to $1.1 billion, if exercised. The maturity of the 2011 Credit Agreement is May 2016, subject to acceleration upon cer-tain specified events of default, including but not limited to delinquent payments, bankruptcy filings, material adverse judgments, guarantees or security documents not being in full effect, non-compliance with the Employee Retirement Income Security Act of 1974, cross-defaults under other debt agreements, or a change of control. The 2011 Credit Agreement contains limitations on our ability to incur liens; merge, consolidate or sell substantially all assets; pay cash dividends; incur additional indebtedness; make advances, investments or loans; and transact with affiliates. The 2011 Credit Agreement is secured primarily by first preferred mortgages on six of our active drilling units (the Atwood Aurora, the Atwood Beacon, the Atwood Eagle, the Atwood Falcon, the Atwood Hunter, and the Atwood Osprey).
Borrowings under the 2011 Credit Agreement bear interest of the Eurodollar rate plus a margin of 2.50%. Certain borrowings effectively bear interest at a fixed rate due to our interest rate swaps. See Note 6. The 2011 Credit Agreement also provides for the issuance, when required, of standby letters of credit. Under the 2011 Credit Agreement, we will pay a commitment fee of 1.0% per annum on the unused portion of the underlying commit-ment. As of September 30, 2011, we have $227 million of funds available to borrow under this credit facility, with standby letters of credit issued in the aggregate amount of $3.4 million.
The 2011 Credit Agreement contains various financial covenants that impose a maximum leverage ratio of 4.0 to 1.0, a debt-to-capitalization ratio of 0.5 to 1.0, a minimum interest expense coverage ratio of 3.0 to 1.0 and a minimum collateral maintenance of 150% of the aggregate amount outstanding under the facility. We were in compliance with all financial covenants under the 2011 Credit Agreement at September 30, 2011. No additional funds have been borrowed under the 2011 Credit Agreement subsequent to September 30, 2011.
We have entered into four $50.0 million notional interest rate swap agreements to fix the variable interest rate on borrowings under the 2011 Credit Agreement through September 2014. The first three interest rate swap agreements serve to fix the annual rate at approximately 3.6% from July 2011 to September 2014. The fourth interest rate swap agreement serves to fix the annual rate at approximately 3.4% from September 2011 to September 2014.
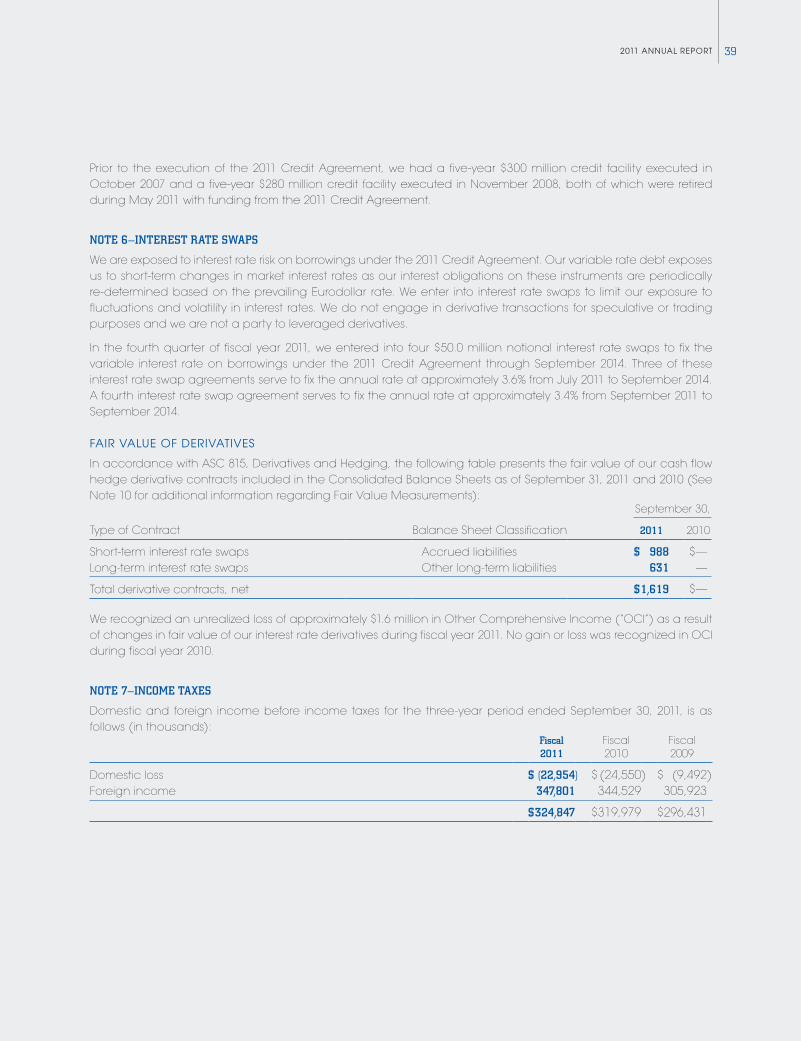
392011 ANNUAL REPORT
Prior to the execution of the 2011 Credit Agreement, we had a five-year $300 million credit facility executed in October 2007 and a five-year $280 million credit facility executed in November 2008, both of which were retired during May 2011 with funding from the 2011 Credit Agreement.
NOTE 6—INTEREST RATE SWAPS
We are exposed to interest rate risk on borrowings under the 2011 Credit Agreement. Our variable rate debt exposes us to short-term changes in market interest rates as our interest obligations on these instruments are periodically re-determined based on the prevailing Eurodollar rate. We enter into interest rate swaps to limit our exposure to fluctuations and volatility in interest rates. We do not engage in derivative transactions for speculative or trading purposes and we are not a party to leveraged derivatives.
In the fourth quarter of fiscal year 2011, we entered into four $50.0 million notional interest rate swaps to fix the variable interest rate on borrowings under the 2011 Credit Agreement through September 2014. Three of these interest rate swap agreements serve to fix the annual rate at approximately 3.6% from July 2011 to September 2014. A fourth interest rate swap agreement serves to fix the annual rate at approximately 3.4% from September 2011 to September 2014.
FAiR vALUE OF dERivATivEs
In accordance with ASC 815, Derivatives and Hedging, the following table presents the fair value of our cash flow hedge derivative contracts included in the Consolidated Balance Sheets as of September 31, 2011 and 2010 (See Note 10 for additional information regarding Fair Value Measurements):
September 30,
Type of Contract Balance Sheet Classification 2011 2010
Short-term interest rate swaps Accrued liabilities $ 988 $—Long-term interest rate swaps Other long-term liabilities 631 —
Total derivative contracts, net $ 1,619 $—
We recognized an unrealized loss of approximately $1.6 million in Other Comprehensive Income (“OCI”) as a result of changes in fair value of our interest rate derivatives during fiscal year 2011. No gain or loss was recognized in OCI during fiscal year 2010.
NOTE 7—INCOME TAXES
Domestic and foreign income before income taxes for the three-year period ended September 30, 2011, is as follows (in thousands):
Fiscal 2011
Fiscal 2010
Fiscal 2009
Domestic loss $ (22,954) $ (24,550) $ (9,492)Foreign income 347,801 344,529 305,923
$ 324,847 $ 319,979 $ 296,431
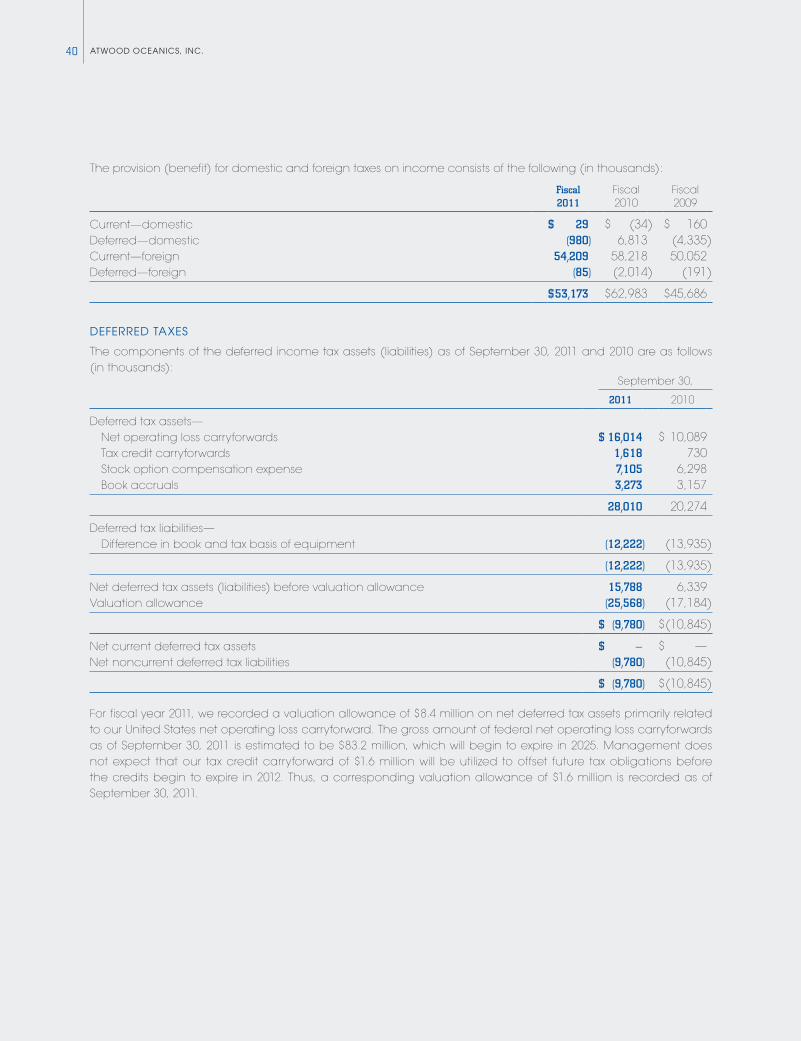
ATwOOd OcEANics, iNc.40
The provision (benefit) for domestic and foreign taxes on income consists of the following (in thousands):
Fiscal 2011
Fiscal 2010
Fiscal 2009
Current—domestic $ 29 $ (34) $ 160Deferred—domestic (980) 6,813 (4,335)Current—foreign 54,209 58,218 50,052Deferred—foreign (85) (2,014) (191)
$ 53,173 $ 62,983 $ 45,686
dEFERREd TAxEs
The components of the deferred income tax assets (liabilities) as of September 30, 2011 and 2010 are as follows (in thousands):
September 30,
2011 2010
Deferred tax assets— Net operating loss carryforwards $ 16,014 $ 10,089 Tax credit carryforwards 1,618 730 Stock option compensation expense 7,105 6,298 Book accruals 3,273 3,157
28,010 20,274
Deferred tax liabilities— Difference in book and tax basis of equipment (12,222) (13,935)
(12,222) (13,935)
Net deferred tax assets (liabilities) before valuation allowance 15,788 6,339Valuation allowance (25,568) (17,184)
$ (9,780) $ (10,845)
Net current deferred tax assets $ — $ —Net noncurrent deferred tax liabilities (9,780) (10,845)
$ (9,780) $ (10,845)
For fiscal year 2011, we recorded a valuation allowance of $8.4 million on net deferred tax assets primarily related to our United States net operating loss carryforward. The gross amount of federal net operating loss carryforwards as of September 30, 2011 is estimated to be $83.2 million, which will begin to expire in 2025. Management does not expect that our tax credit carryforward of $1.6 million will be utilized to offset future tax obligations before the credits begin to expire in 2012. Thus, a corresponding valuation allowance of $1.6 million is recorded as of September 30, 2011.
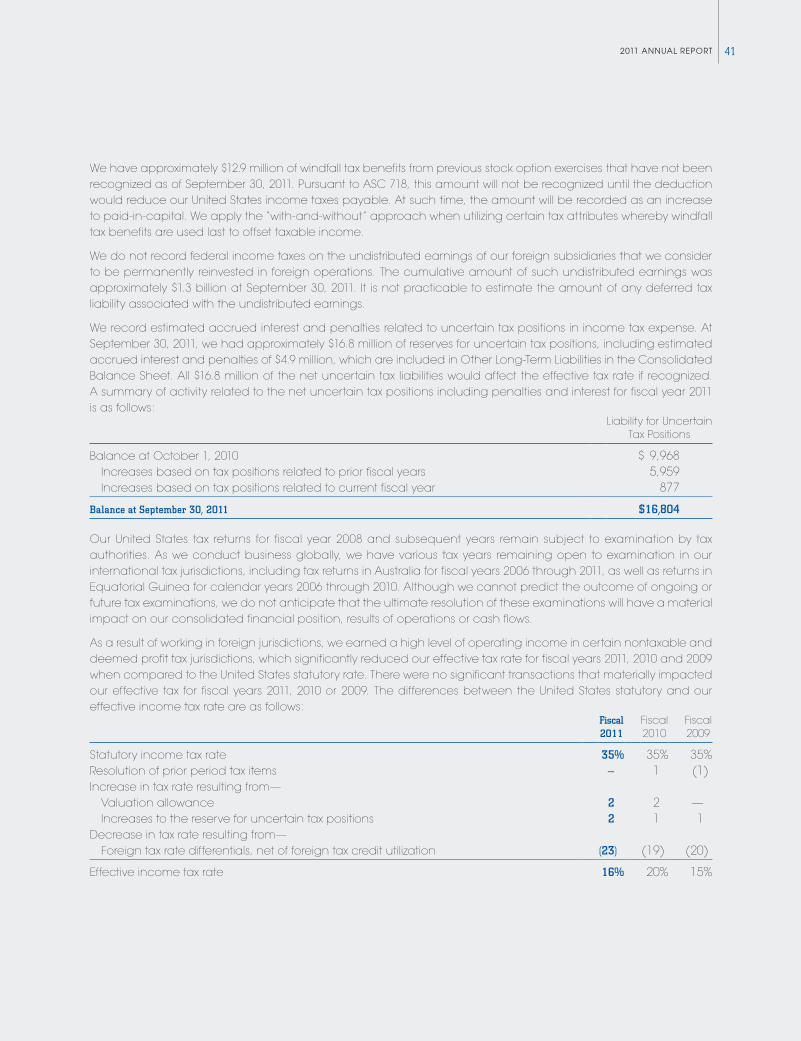
412011 ANNUAL REPORT
We have approximately $12.9 million of windfall tax benefits from previous stock option exercises that have not been recognized as of September 30, 2011. Pursuant to ASC 718, this amount will not be recognized until the deduction would reduce our United States income taxes payable. At such time, the amount will be recorded as an increase to paid-in-capital. We apply the “with-and-without” approach when utilizing certain tax attributes whereby windfall tax benefits are used last to offset taxable income.
We do not record federal income taxes on the undistributed earnings of our foreign subsidiaries that we consider to be permanently reinvested in foreign operations. The cumulative amount of such undistributed earnings was approximately $1.3 billion at September 30, 2011. It is not practicable to estimate the amount of any deferred tax liability associated with the undistributed earnings.
We record estimated accrued interest and penalties related to uncertain tax positions in income tax expense. At September 30, 2011, we had approximately $16.8 million of reserves for uncertain tax positions, including estimated accrued interest and penalties of $4.9 million, which are included in Other Long-Term Liabilities in the Consolidated Balance Sheet. All $16.8 million of the net uncertain tax liabilities would affect the effective tax rate if recognized. A summary of activity related to the net uncertain tax positions including penalties and interest for fiscal year 2011 is as follows:
Liability for Uncertain Tax Positions
Balance at October 1, 2010 $ 9,968 Increases based on tax positions related to prior fiscal years 5,959 Increases based on tax positions related to current fiscal year 877
Balance at September 30, 2011 $16,804
Our United States tax returns for fiscal year 2008 and subsequent years remain subject to examination by tax authorities. As we conduct business globally, we have various tax years remaining open to examination in our international tax jurisdictions, including tax returns in Australia for fiscal years 2006 through 2011, as well as returns in Equatorial Guinea for calendar years 2006 through 2010. Although we cannot predict the outcome of ongoing or future tax examinations, we do not anticipate that the ultimate resolution of these examinations will have a material impact on our consolidated financial position, results of operations or cash flows.
As a result of working in foreign jurisdictions, we earned a high level of operating income in certain nontaxable and deemed profit tax jurisdictions, which significantly reduced our effective tax rate for fiscal years 2011, 2010 and 2009 when compared to the United States statutory rate. There were no significant transactions that materially impacted our effective tax for fiscal years 2011, 2010 or 2009. The differences between the United States statutory and our effective income tax rate are as follows:
Fiscal 2011
Fiscal 2010
Fiscal 2009
Statutory income tax rate 35% 35% 35%Resolution of prior period tax items — 1 (1)Increase in tax rate resulting from— Valuation allowance 2 2 — Increases to the reserve for uncertain tax positions 2 1 1Decrease in tax rate resulting from— Foreign tax rate differentials, net of foreign tax credit utilization (23) (19) (20)
Effective income tax rate 16% 20% 15%
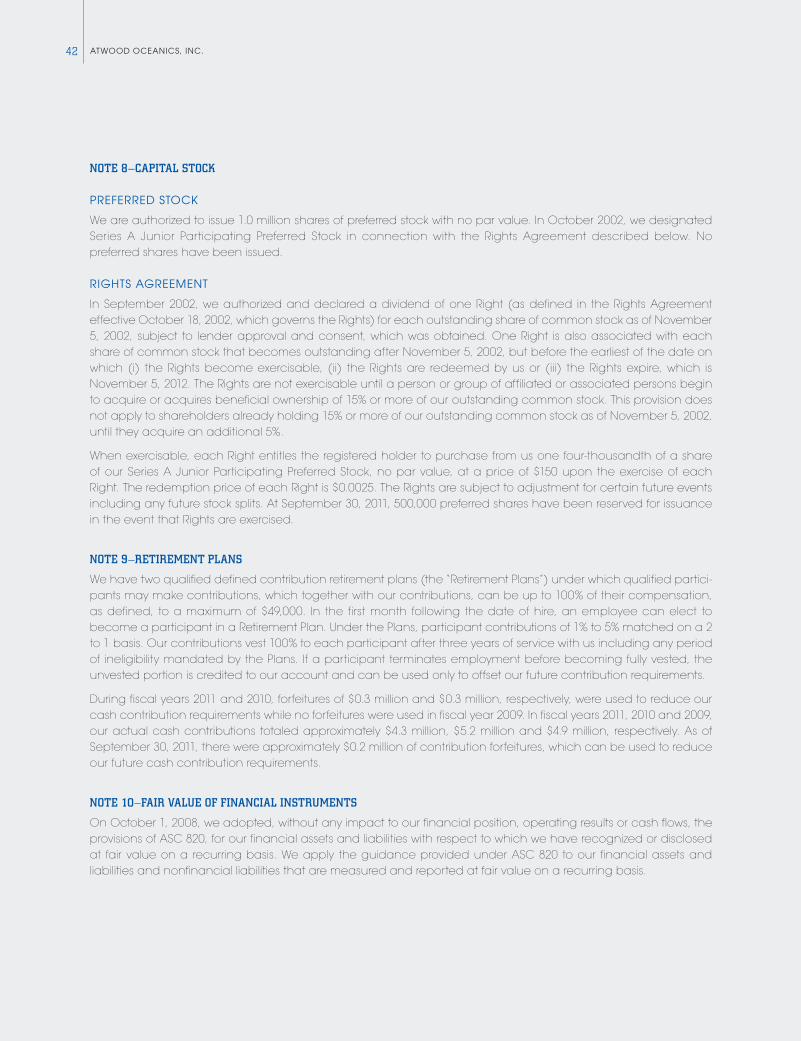
ATwOOd OcEANics, iNc.42
NOTE 8—CAPITAL STOCK
PREFERREd sTOck
We are authorized to issue 1.0 million shares of preferred stock with no par value. In October 2002, we designated Series A Junior Participating Preferred Stock in connection with the Rights Agreement described below. No preferred shares have been issued.
RighTs AgREEmENT
In September 2002, we authorized and declared a dividend of one Right (as defined in the Rights Agreement effective October 18, 2002, which governs the Rights) for each outstanding share of common stock as of November 5, 2002, subject to lender approval and consent, which was obtained. One Right is also associated with each share of common stock that becomes outstanding after November 5, 2002, but before the earliest of the date on which (i) the Rights become exercisable, (ii) the Rights are redeemed by us or (iii) the Rights expire, which is November 5, 2012. The Rights are not exercisable until a person or group of affiliated or associated persons begin to acquire or acquires beneficial ownership of 15% or more of our outstanding common stock. This provision does not apply to shareholders already holding 15% or more of our outstanding common stock as of November 5, 2002, until they acquire an additional 5%.
When exercisable, each Right entitles the registered holder to purchase from us one four-thousandth of a share of our Series A Junior Participating Preferred Stock, no par value, at a price of $150 upon the exercise of each Right. The redemption price of each Right is $0.0025. The Rights are subject to adjustment for certain future events including any future stock splits. At September 30, 2011, 500,000 preferred shares have been reserved for issuance in the event that Rights are exercised.
NOTE 9—RETIREMENT PLANS
We have two qualified defined contribution retirement plans (the “Retirement Plans”) under which qualified partici-pants may make contributions, which together with our contributions, can be up to 100% of their compensation, as defined, to a maximum of $49,000. In the first month following the date of hire, an employee can elect to become a participant in a Retirement Plan. Under the Plans, participant contributions of 1% to 5% matched on a 2 to 1 basis. Our contributions vest 100% to each participant after three years of service with us including any period of ineligibility mandated by the Plans. If a participant terminates employment before becoming fully vested, the unvested portion is credited to our account and can be used only to offset our future contribution requirements.
During fiscal years 2011 and 2010, forfeitures of $0.3 million and $0.3 million, respectively, were used to reduce our cash contribution requirements while no forfeitures were used in fiscal year 2009. In fiscal years 2011, 2010 and 2009, our actual cash contributions totaled approximately $4.3 million, $5.2 million and $4.9 million, respectively. As of September 30, 2011, there were approximately $0.2 million of contribution forfeitures, which can be used to reduce our future cash contribution requirements.
NOTE 10—FAIR vALUE OF FINANCIAL INSTRUMENTS
On October 1, 2008, we adopted, without any impact to our financial position, operating results or cash flows, the provisions of ASC 820, for our financial assets and liabilities with respect to which we have recognized or disclosed at fair value on a recurring basis. We apply the guidance provided under ASC 820 to our financial assets and liabilities and nonfinancial liabilities that are measured and reported at fair value on a recurring basis.
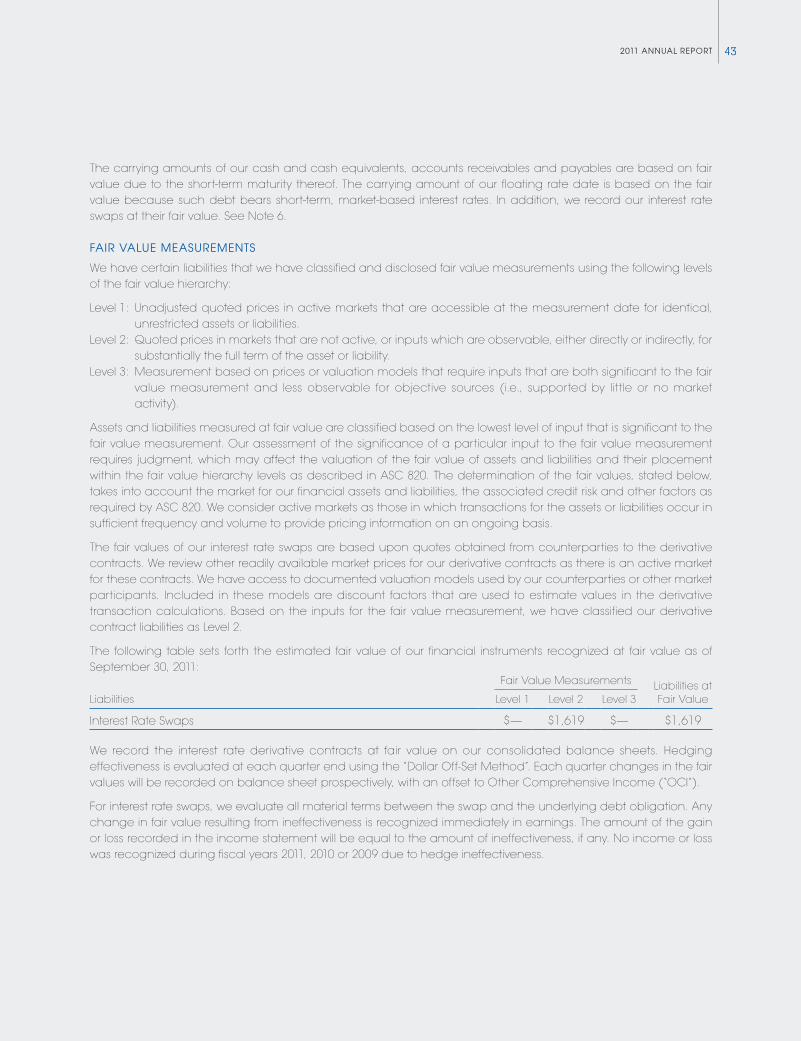
432011 ANNUAL REPORT
The carrying amounts of our cash and cash equivalents, accounts receivables and payables are based on fair value due to the short-term maturity thereof. The carrying amount of our floating rate date is based on the fair value because such debt bears short-term, market-based interest rates. In addition, we record our interest rate swaps at their fair value. See Note 6.
FAiR vALUE mEAsUREmENTs
We have certain liabilities that we have classified and disclosed fair value measurements using the following levels of the fair value hierarchy:
Level 1: Unadjusted quoted prices in active markets that are accessible at the measurement date for identical, unrestricted assets or liabilities.
Level 2: Quoted prices in markets that are not active, or inputs which are observable, either directly or indirectly, for substantially the full term of the asset or liability.
Level 3: Measurement based on prices or valuation models that require inputs that are both significant to the fair value measurement and less observable for objective sources (i.e., supported by little or no market activity).
Assets and liabilities measured at fair value are classified based on the lowest level of input that is significant to the fair value measurement. Our assessment of the significance of a particular input to the fair value measurement requires judgment, which may affect the valuation of the fair value of assets and liabilities and their placement within the fair value hierarchy levels as described in ASC 820. The determination of the fair values, stated below, takes into account the market for our financial assets and liabilities, the associated credit risk and other factors as required by ASC 820. We consider active markets as those in which transactions for the assets or liabilities occur in sufficient frequency and volume to provide pricing information on an ongoing basis.
The fair values of our interest rate swaps are based upon quotes obtained from counterparties to the derivative contracts. We review other readily available market prices for our derivative contracts as there is an active market for these contracts. We have access to documented valuation models used by our counterparties or other market participants. Included in these models are discount factors that are used to estimate values in the derivative transaction calculations. Based on the inputs for the fair value measurement, we have classified our derivative contract liabilities as Level 2.
The following table sets forth the estimated fair value of our financial instruments recognized at fair value as of September 30, 2011:
Fair Value Measurements Liabilities atLiabilities Level 1 Level 2 Level 3 Fair Value
Interest Rate Swaps $— $1,619 $— $1,619
We record the interest rate derivative contracts at fair value on our consolidated balance sheets. Hedging effectiveness is evaluated at each quarter end using the “Dollar Off-Set Method”. Each quarter changes in the fair values will be recorded on balance sheet prospectively, with an offset to Other Comprehensive Income (“OCI”).
For interest rate swaps, we evaluate all material terms between the swap and the underlying debt obligation. Any change in fair value resulting from ineffectiveness is recognized immediately in earnings. The amount of the gain or loss recorded in the income statement will be equal to the amount of ineffectiveness, if any. No income or loss was recognized during fiscal years 2011, 2010 or 2009 due to hedge ineffectiveness.
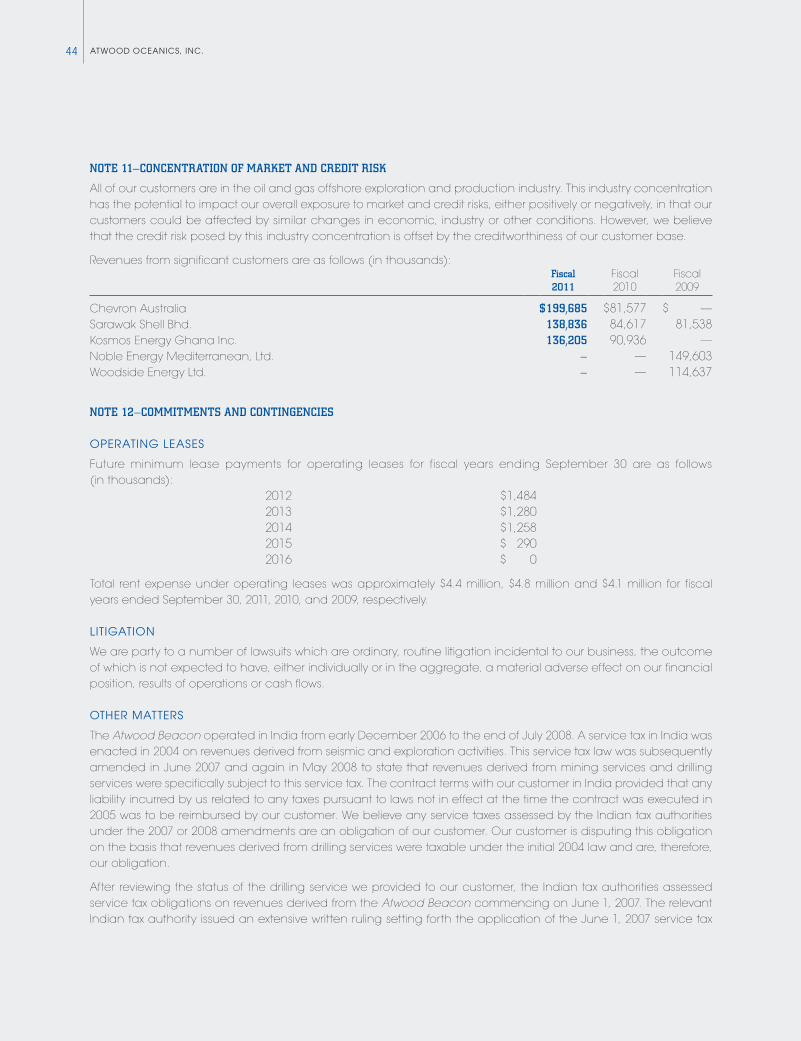
ATwOOd OcEANics, iNc.44
NOTE 11—CONCENTRATION OF MARKET AND CREDIT RISK
All of our customers are in the oil and gas offshore exploration and production industry. This industry concentration has the potential to impact our overall exposure to market and credit risks, either positively or negatively, in that our customers could be affected by similar changes in economic, industry or other conditions. However, we believe that the credit risk posed by this industry concentration is offset by the creditworthiness of our customer base.
Revenues from significant customers are as follows (in thousands):Fiscal 2011
Fiscal 2010
Fiscal 2009
Chevron Australia $ 199,685 $ 81,577 $ —Sarawak Shell Bhd. 138,836 84,617 81,538Kosmos Energy Ghana Inc. 136,205 90,936 —Noble Energy Mediterranean, Ltd. — — 149,603Woodside Energy Ltd. — — 114,637
NOTE 12—COMMITMENTS AND CONTINgENCIES
OPERATiNg LEAsEs
Future minimum lease payments for operating leases for fiscal years ending September 30 are as follows (in thousands):
2012 $1,4842013 $1,2802014 $1,2582015 $ 2902016 $ 0
Total rent expense under operating leases was approximately $4.4 million, $4.8 million and $4.1 million for fiscal years ended September 30, 2011, 2010, and 2009, respectively.
LiTigATiON
We are party to a number of lawsuits which are ordinary, routine litigation incidental to our business, the outcome of which is not expected to have, either individually or in the aggregate, a material adverse effect on our financial position, results of operations or cash flows.
OThER mATTERs
The Atwood Beacon operated in India from early December 2006 to the end of July 2008. A service tax in India was enacted in 2004 on revenues derived from seismic and exploration activities. This service tax law was subsequently amended in June 2007 and again in May 2008 to state that revenues derived from mining services and drilling services were specifically subject to this service tax. The contract terms with our customer in India provided that any liability incurred by us related to any taxes pursuant to laws not in effect at the time the contract was executed in 2005 was to be reimbursed by our customer. We believe any service taxes assessed by the Indian tax authorities under the 2007 or 2008 amendments are an obligation of our customer. Our customer is disputing this obligation on the basis that revenues derived from drilling services were taxable under the initial 2004 law and are, therefore, our obligation.
After reviewing the status of the drilling service we provided to our customer, the Indian tax authorities assessed service tax obligations on revenues derived from the Atwood Beacon commencing on June 1, 2007. The relevant Indian tax authority issued an extensive written ruling setting forth the application of the June 1, 2007 service tax
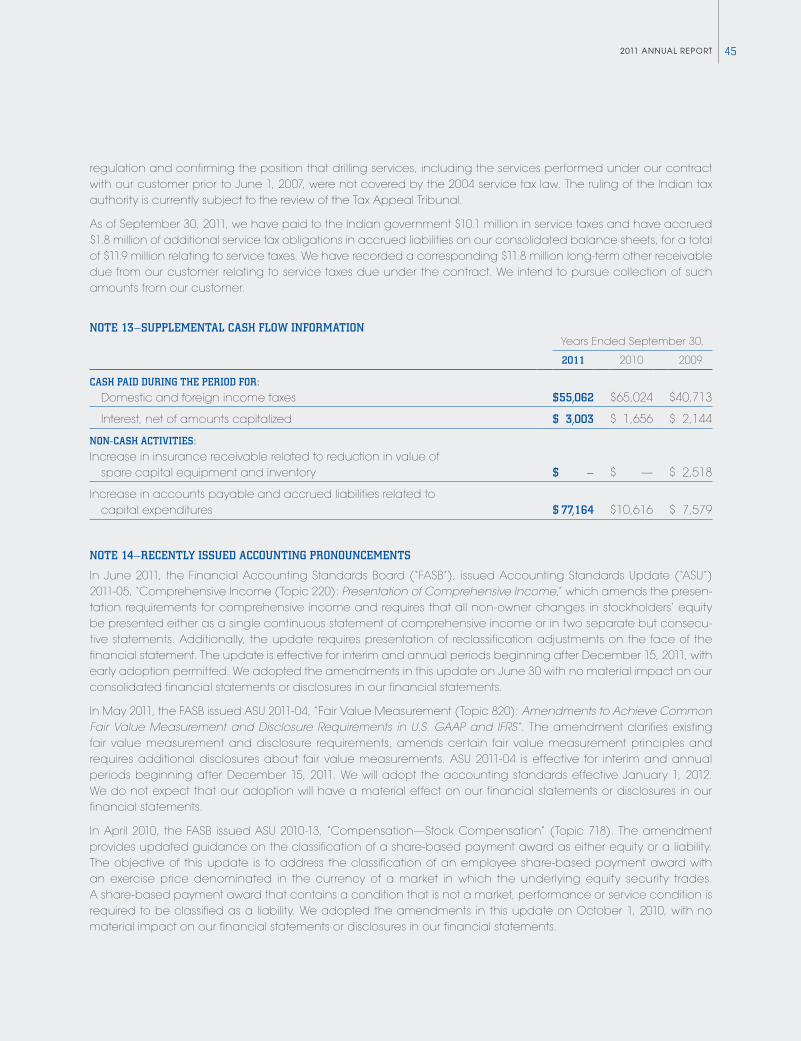
452011 ANNUAL REPORT
regulation and confirming the position that drilling services, including the services performed under our contract with our customer prior to June 1, 2007, were not covered by the 2004 service tax law. The ruling of the Indian tax authority is currently subject to the review of the Tax Appeal Tribunal.
As of September 30, 2011, we have paid to the Indian government $10.1 million in service taxes and have accrued $1.8 million of additional service tax obligations in accrued liabilities on our consolidated balance sheets, for a total of $11.9 million relating to service taxes. We have recorded a corresponding $11.8 million long-term other receivable due from our customer relating to service taxes due under the contract. We intend to pursue collection of such amounts from our customer.
NOTE 13—SUPPLEMENTAL CASH FLOW INFORMATIONYears Ended September 30,
2011 2010 2009
CASH PAID DURINg THE PERIOD FOR:
Domestic and foreign income taxes $ 55,062 $ 65,024 $ 40,713
Interest, net of amounts capitalized $ 3,003 $ 1,656 $ 2,144
NON-CASH ACTIvITIES:
Increase in insurance receivable related to reduction in value of spare capital equipment and inventory $ — $ — $ 2,518
Increase in accounts payable and accrued liabilities related to capital expenditures $ 77,164 $ 10,616 $ 7,579
NOTE 14—RECENTLY ISSUED ACCOUNTINg PRONOUNCEMENTS
In June 2011, the Financial Accounting Standards Board (“FASB”), issued Accounting Standards Update (“ASU”) 2011-05, “Comprehensive Income (Topic 220): Presentation of Comprehensive Income,” which amends the presen-tation requirements for comprehensive income and requires that all non-owner changes in stockholders’ equity be presented either as a single continuous statement of comprehensive income or in two separate but consecu-tive statements. Additionally, the update requires presentation of reclassification adjustments on the face of the financial statement. The update is effective for interim and annual periods beginning after December 15, 2011, with early adoption permitted. We adopted the amendments in this update on June 30 with no material impact on our consolidated financial statements or disclosures in our financial statements.
In May 2011, the FASB issued ASU 2011-04, “Fair Value Measurement (Topic 820): Amendments to Achieve Common Fair Value Measurement and Disclosure Requirements in U.S. GAAP and IFRS”. The amendment clarifies existing fair value measurement and disclosure requirements, amends certain fair value measurement principles and requires additional disclosures about fair value measurements. ASU 2011-04 is effective for interim and annual periods beginning after December 15, 2011. We will adopt the accounting standards effective January 1, 2012. We do not expect that our adoption will have a material effect on our financial statements or disclosures in our financial statements.
In April 2010, the FASB issued ASU 2010-13, “Compensation—Stock Compensation” (Topic 718). The amendment provides updated guidance on the classification of a share-based payment award as either equity or a liability. The objective of this update is to address the classification of an employee share-based payment award with an exercise price denominated in the currency of a market in which the underlying equity security trades. A share-based payment award that contains a condition that is not a market, performance or service condition is required to be classified as a liability. We adopted the amendments in this update on October 1, 2010, with no material impact on our financial statements or disclosures in our financial statements.
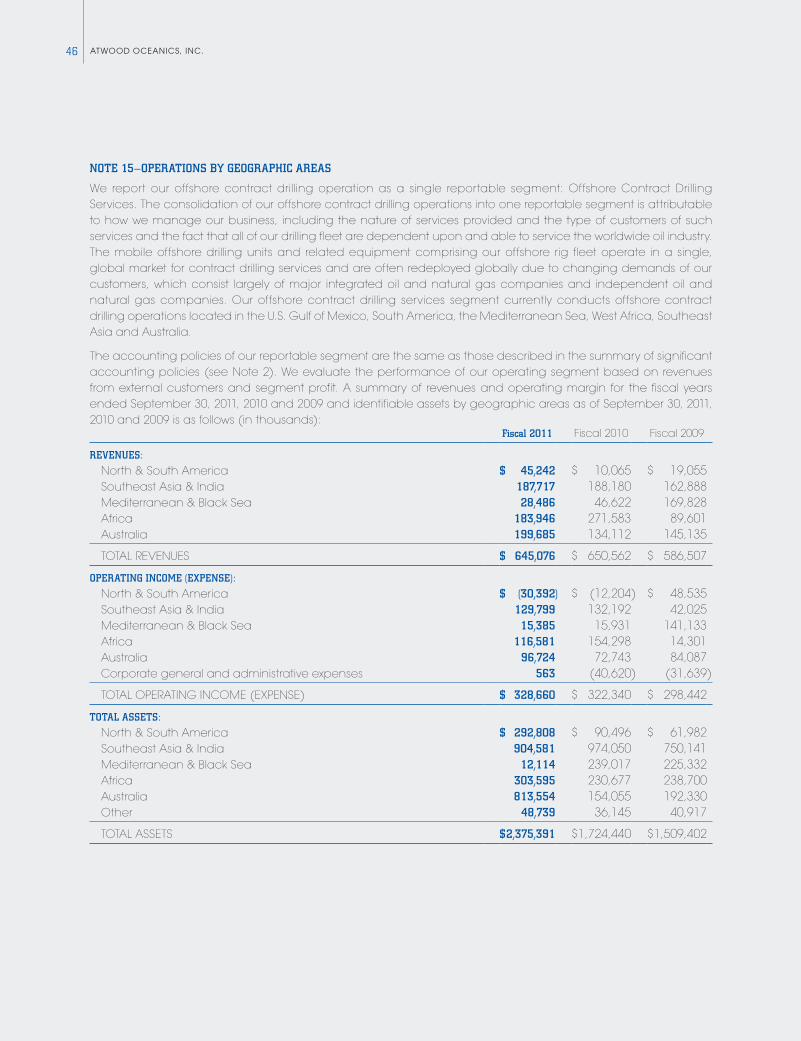
ATwOOd OcEANics, iNc.46
NOTE 15—OPERATIONS BY gEOgRAPHIC AREAS
We report our offshore contract drilling operation as a single reportable segment: Offshore Contract Drilling Services. The consolidation of our offshore contract drilling operations into one reportable segment is attributable to how we manage our business, including the nature of services provided and the type of customers of such services and the fact that all of our drilling fleet are dependent upon and able to service the worldwide oil industry. The mobile offshore drilling units and related equipment comprising our offshore rig fleet operate in a single, global market for contract drilling services and are often redeployed globally due to changing demands of our customers, which consist largely of major integrated oil and natural gas companies and independent oil and natural gas companies. Our offshore contract drilling services segment currently conducts offshore contract drilling operations located in the U.S. Gulf of Mexico, South America, the Mediterranean Sea, West Africa, Southeast Asia and Australia.
The accounting policies of our reportable segment are the same as those described in the summary of significant accounting policies (see Note 2). We evaluate the performance of our operating segment based on revenues from external customers and segment profit. A summary of revenues and operating margin for the fiscal years ended September 30, 2011, 2010 and 2009 and identifiable assets by geographic areas as of September 30, 2011, 2010 and 2009 is as follows (in thousands):
Fiscal 2011 Fiscal 2010 Fiscal 2009
REvENUES:
North & South America $ 45,242 $ 10,065 $ 19,055 Southeast Asia & India 187,717 188,180 162,888 Mediterranean & Black Sea 28,486 46,622 169,828 Africa 183,946 271,583 89,601 Australia 199,685 134,112 145,135
TOTAL REVENUES $ 645,076 $ 650,562 $ 586,507
OPERATINg INCOME (EXPENSE):
North & South America $ (30,392) $ (12,204) $ 48,535 Southeast Asia & India 129,799 132,192 42,025 Mediterranean & Black Sea 15,385 15,931 141,133 Africa 116,581 154,298 14,301 Australia 96,724 72,743 84,087 Corporate general and administrative expenses 563 (40,620) (31,639)
TOTAL OPERATING INCOME (ExPENSE) $ 328,660 $ 322,340 $ 298,442
TOTAL ASSETS:
North & South America $ 292,808 $ 90,496 $ 61,982 Southeast Asia & India 904,581 974,050 750,141 Mediterranean & Black Sea 12,114 239,017 225,332 Africa 303,595 230,677 238,700 Australia 813,554 154,055 192,330 Other 48,739 36,145 40,917
TOTAL ASSETS $ 2,375,391 $ 1,724,440 $ 1,509,402
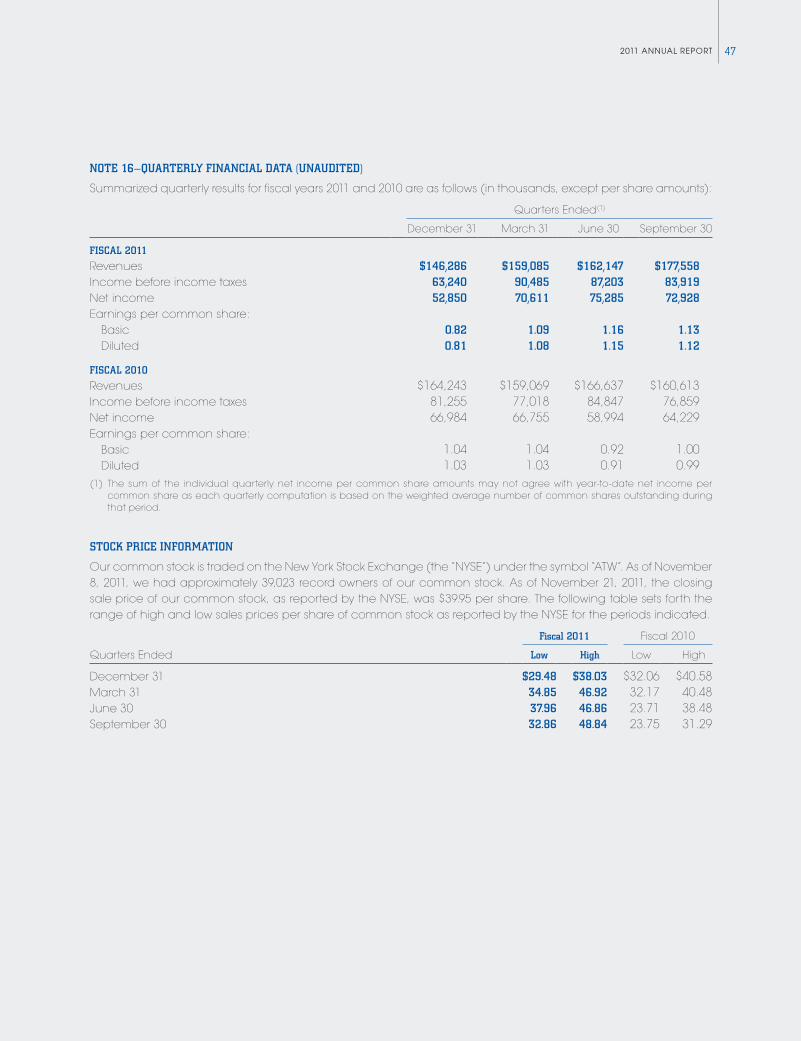
472011 ANNUAL REPORT
NOTE 16—QUARTERLY FINANCIAL DATA (UNAUDITED)
Summarized quarterly results for fiscal years 2011 and 2010 are as follows (in thousands, except per share amounts):
Quarters Ended(1)
December 31 March 31 June 30 September 30
FIsCAL 2011
Revenues $146,286 $159,085 $162,147 $177,558Income before income taxes 63,240 90,485 87,203 83,919Net income 52,850 70,611 75,285 72,928Earnings per common share: Basic 0.82 1.09 1.16 1.13 Diluted 0.81 1.08 1.15 1.12
FIsCAL 2010
Revenues $164,243 $159,069 $166,637 $160,613Income before income taxes 81,255 77,018 84,847 76,859Net income 66,984 66,755 58,994 64,229Earnings per common share: Basic 1.04 1.04 0.92 1.00 Diluted 1.03 1.03 0.91 0.99(1) The sum of the individual quarterly net income per common share amounts may not agree with year-to-date net income per
common share as each quarterly computation is based on the weighted average number of common shares outstanding during that period.
sTOCK PRICE INFORMATION
Our common stock is traded on the New York Stock Exchange (the “NYSE”) under the symbol “ATW”. As of November 8, 2011, we had approximately 39,023 record owners of our common stock. As of November 21, 2011, the closing sale price of our common stock, as reported by the NYSE, was $39.95 per share. The following table sets forth the range of high and low sales prices per share of common stock as reported by the NYSE for the periods indicated.
Fiscal 2011 Fiscal 2010
Quarters Ended Low High Low High
December 31 $29.48 $38.03 $32.06 $40.58March 31 34.85 46.92 32.17 40.48June 30 37.96 46.86 23.71 38.48September 30 32.86 48.84 23.75 31.29
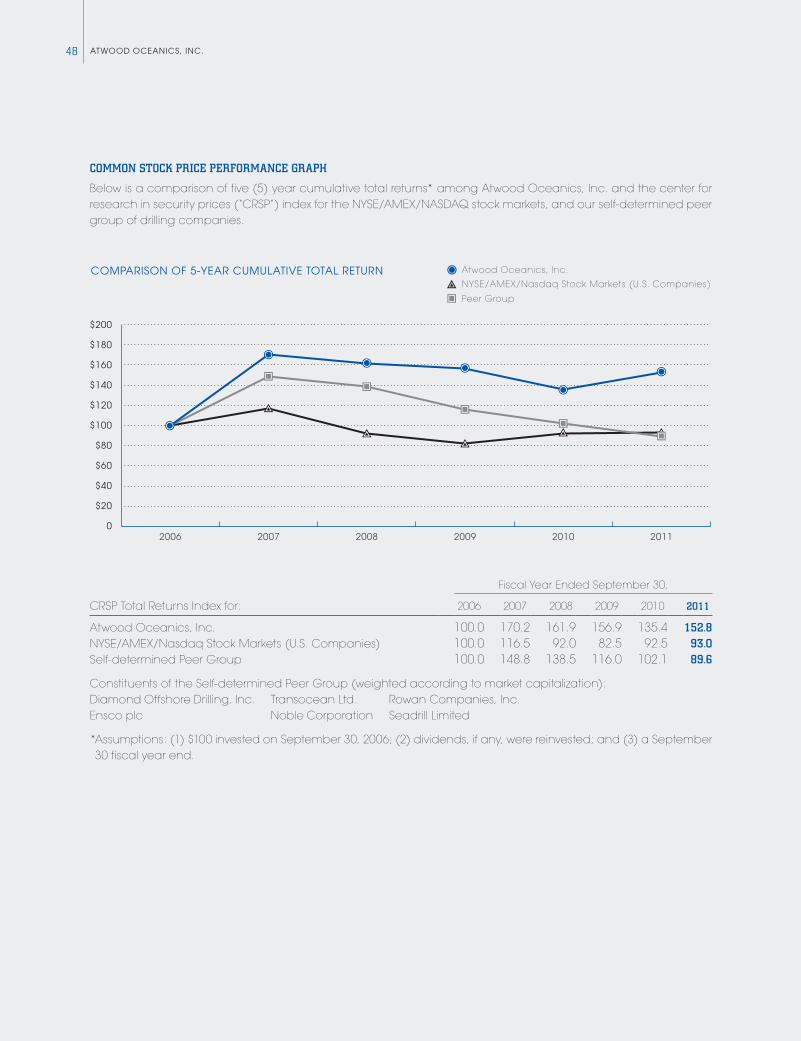
ATwOOd OcEANics, iNc.48
COMMON STOCK PRICE PERFORMANCE gRAPH
Below is a comparison of five (5) year cumulative total returns* among Atwood Oceanics, Inc. and the center for research in security prices (“CRSP”) index for the NYSE/AMEx/NASDAQ stock markets, and our self-determined peer group of drilling companies.
Fiscal Year Ended September 30,
CRSP Total Returns Index for: 2006 2007 2008 2009 2010 2011
Atwood Oceanics, Inc. 100.0 170.2 161.9 156.9 135.4 152.8NYSE/AMEx/Nasdaq Stock Markets (U.S. Companies) 100.0 116.5 92.0 82.5 92.5 93.0Self-determined Peer Group 100.0 148.8 138.5 116.0 102.1 89.6
Constituents of the Self-determined Peer Group (weighted according to market capitalization):Diamond Offshore Drilling, Inc. Transocean Ltd. Rowan Companies, Inc.Ensco plc Noble Corporation Seadrill Limited
* Assumptions: (1) $100 invested on September 30, 2006; (2) dividends, if any, were reinvested; and (3) a September 30 fiscal year end.
COMPARISON OF 5-YEAR CUMULATIVE TOTAL RETURN
201120102009200820072006
$200
$180
$140
$160
$120
$100
$80
$60
$40
$20
0
NYSE/AMEX/Nasdaq Stock Markets (U.S. Companies)
Atwood Oceanics, Inc.
Peer Group
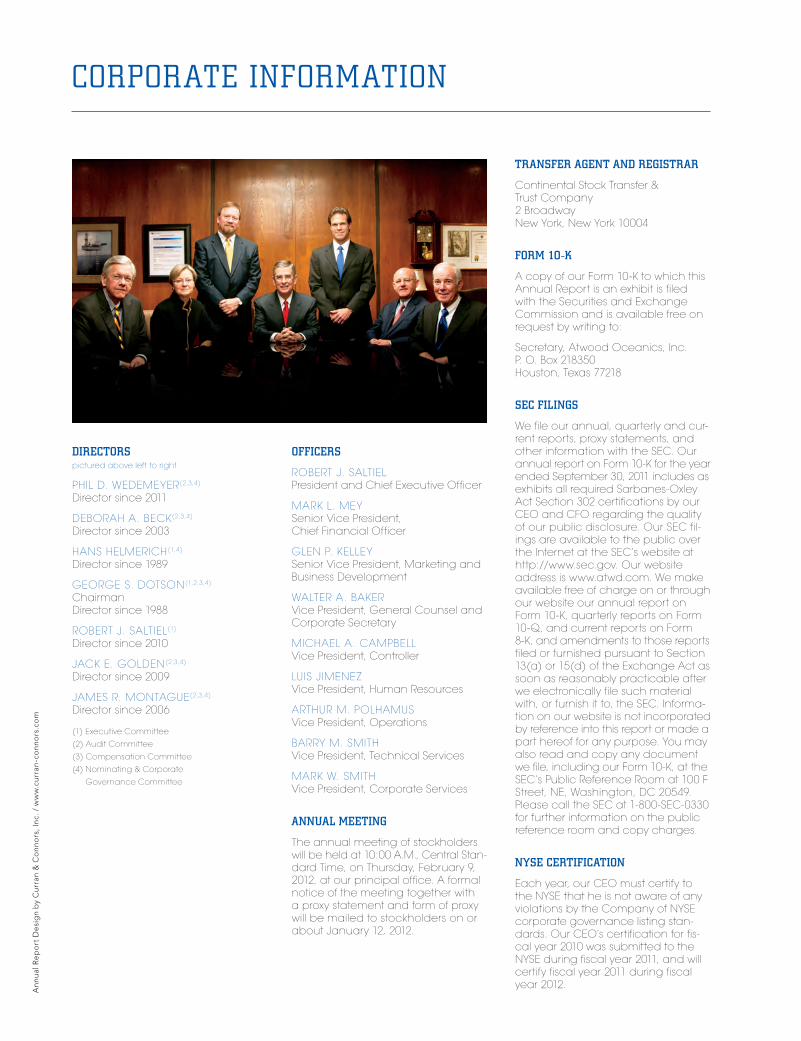
DIRECTORSpictured above left to right
PhiL D. WEDEMEyER(2,3,4)
Director since 2011
DEBORAh A. BECK(2,3,4)
Director since 2003
hANS hELMERiCh(1,4)
Director since 1989
gEORgE S. DOTSON(1,2,3,4)
ChairmanDirector since 1988
ROBERT j. SALTiEL(1)
Director since 2010
jACK E. gOLDEN(2,3,4)
Director since 2009
jAMES R. MONTAgUE(2,3,4)
Director since 2006
(1) Executive Committee
(2) Audit Committee
(3) Compensation Committee
(4) Nominating & Corporate
governance Committee
OFFICERS
ROBERT j. SALTiELPresident and Chief Executive Officer
MARK L. MEySenior vice President, Chief Financial Officer
gLEN P. KELLEySenior vice President, Marketing and Business Development
WALTER A. BAKERvice President, general Counsel and Corporate Secretary
MiChAEL A. CAMPBELLvice President, Controller
LUiS jiMENEZvice President, human Resources
ARThUR M. POLhAMUSvice President, Operations
BARRy M. SMiThvice President, Technical Services
MARK W. SMiThvice President, Corporate Services
ANNUAL MEETING
The annual meeting of stockholders will be held at 10:00 A.M., Central Standard Time, on Thursday, February 9, 2012, at our principal office. A formal notice of the meeting together with a proxy statement and form of proxy will be mailed to stockholders on or about january 12, 2012.
TRANSFER AGENT AND REGISTRAR
Continental Stock Transfer & Trust Company2 BroadwayNew york, New york 10004
FORM 10-K
A copy of our Form 10K to which this Annual Report is an exhibit is filed with the Securities and Exchange Commission and is available free on request by writing to:
Secretary, Atwood Oceanics, inc. P. O. Box 218350 houston, Texas 77218
SEC FILINGS
We file our annual, quarterly and current reports, proxy statements, and other information with the SEC. Our annual report on Form 10K for the year ended September 30, 2011 includes as exhibits all required SarbanesOxley Act Section 302 certifications by our CEO and CFO regarding the quality of our public disclosure. Our SEC filings are available to the public over the internet at the SEC’s website at http://www.sec.gov. Our website address is www.atwd.com. We make available free of charge on or through our website our annual report on Form 10K, quarterly reports on Form 10Q, and current reports on Form 8K, and amendments to those reports filed or furnished pursuant to Section 13(a) or 15(d) of the Exchange Act as soon as reasonably practicable after we electronically file such material with, or furnish it to, the SEC. information on our website is not incorporated by reference into this report or made a part hereof for any purpose. you may also read and copy any document we file, including our Form 10K, at the SEC’s Public Reference Room at 100 F Street, NE, Washington, DC 20549. Please call the SEC at 1800SEC0330 for further information on the public reference room and copy charges.
NYSE CERTIFICATION
Each year, our CEO must certify to the NySE that he is not aware of any violations by the Company of NySE corporate governance listing standards. Our CEO’s certification for fiscal year 2010 was submitted to the NySE during fiscal year 2011, and will certify fiscal year 2011 during fiscal year 2012.
Ann
ual R
ep
ort
De
sig
n b
y C
urra
n &
Co
nno
rs, I
nc. /
ww
w.c
urra
n-c
onn
ors
.co
m
corporAtE INFormAtIoN

ATWOOD OCEANICS
15835 Park Ten Place Drive (77084)P.O. Box 218350 (77218)Houston, Texas USA
ATWOOD OCEA
NICS, IN
C. 2
011 A
nn
UA
l ReP
OR
T