Embed Size (px)
Citation preview
This document is part of a project that has received funding from the European Union’s Horizon 2020 research and innovation programme under grant agreement No 732541. It is the property of the PhasmaFOOD consortium and shall not be distributed or reproduced without the formal approval of the PhasmaFOOD Management Committee.
Project Acronym: PhasmaFOOD
Grant Agreement number: 732541 (H2020-ICT-2016-1 - RIA)
Project Full Title: Portable photonic miniaturised smart system for on-the-spot food
quality sensing
DELIVERABLE
Deliverable Number D3.2 Deliverable Name Feasibility results and use case
benchmarking-v2 Dissemination level Public
Type of Document Report
Contractual date of delivery 30th June 2018
Deliverable Leader AUA
Status & version V4.0
WP / Task responsible WP3 / T3.1, 3.2 and 3.3 - AUA
Keywords: alcoholic beverages, fish, fraud, fruits, grains, image analysis,
meat, milk, mycotoxins, nuts, oil, spectrum analysis, spoilage,
vegetables
Abstract (few lines): The PhasmaFOOD project aims to develop a miniaturized, multi-
parameter and programmable sensing node for (i) detection of
mycotoxins, (ii) detection of food spoilage and prediction of
shelf-life; and (iii) detection of food fraud. In this report, an
updated feasibility assessment of the above mentioned (sub-)
use cases is displayed. D3.2 is the second report of results on
real-life samples in a series of successive reports (D3.1 - M9,
D3.2 - M18 and D3.7 - M27) leading to a final feasibility
assessment of the proposed use cases. In order to do so, this
deliverable describes the standard operating procedures for the
PhasmaFOOD sensors, sampling strategies, data assessment and
conclusions until M18 of the project. For the mycotoxin use case
Project Title: PhasmaFOOD Contract No. 732541 Project Coordinator: INTRASOFT International S.A.
Page | 2
D3.2 – Feasibility results and use case benchmarking-v2, Version: v4 – Final version, Date 28/06/2018
(in particular aflatoxin B1), first results on the sub-use cases of
maize flour and almonds are reported. For the spoilage use
case, extensive experimental data have been produced which, in
addition to fish (presented, in part, in D3.1), refer to minced
pork, rocket, baby spinach and pineapple. Finally, for the third
use case on food fraud, initial feasibility assessment of the usage
of the PhasmaFOOD sensors in detecting skimmed milk powders
(SMP) is reported, and experiments on minced meat
adulteration are described.
Deliverable Leader: George-John E. Nychas (AUA)
Contributors: AUA, CNR, DLO, IPMS, UTOV
Reviewers: IPMS, WINGS
Approved by: INTRA
Project Title: PhasmaFOOD Contract No. 732541 Project Coordinator: INTRASOFT International S.A.
Page | 3
D3.2 – Feasibility results and use case benchmarking-v2, Version: v4 – Final version, Date 28/06/2018
Document History
Version Date Contributor(s) Description
0.1 05/04/2018 AUA, CNR, DLO,
IPMS
Early version-Request for partners’
contribution
1.0 27/05/2018 AUA, CNR, DLO,
IPMS, UTOV
First draft version for review/update by
contributors
2.0 06/06/2018 AUA, CNR, DLO,
IPMS, UTOV
Second draft version for consortium
review
3.0 18/06/2018 AUA, CNR, DLO,
IPMS, UTOV
Third (final) draft version for internal
review
4.0 28/06/2018 AUA, CNR, DLO,
IPMS, UTOV Final version
Project Title: PhasmaFOOD Contract No. 732541 Project Coordinator: INTRASOFT International S.A.
Page | 4
D3.2 – Feasibility results and use case benchmarking-v2, Version: v4 – Final version, Date 28/06/2018
Table of Contents Definitions, Acronyms and Abbreviations 8
1 Executive summary 10
2 Introduction 11
2.1 State of the art 11
2.1.1 Use case 1: detection of mycotoxins in food products 11
2.1.2 Use case 2: detection of early sign of spoilage, spoilage and shelf-life estimation in
meat, fish, fruit and vegetables. 13
2.1.3 Use case 3: food fraud 14
2.2 Description of micro-sensors 15
2.2.1 NIR microspectrometer 15
2.2.2 VIS spectrometer 17
2.2.3 CMOS camera 17
2.3 WP3 and D3.2 scope, strategy and planning 18
3 Materials and methods 20
3.1 SOPs for micro-sensor operation 20
3.1.1 NIR spectrometer 20
3.1.2 VIS spectrometer 23
3.1.3 CMOS camera 25
3.2 Detection of mycotoxins 25
3.2.1 Maize flour 33
3.2.1.1 Materials 33
3.2.1.2 Experimental design 35
3.2.1.3 Implementation of sensors (food science laboratory) 35
3.2.1.4 Other experimental procedures 35
3.2.2 Milk powder 36
3.2.3 Paprika powder 36
3.2.4 Tree nuts 36
3.2.4.1 Materials 36
3.2.4.2 Experimental design 37
3.2.4.3 Implementation of sensors (food science laboratory) 38
Project Title: PhasmaFOOD Contract No. 732541 Project Coordinator: INTRASOFT International S.A.
Page | 5
D3.2 – Feasibility results and use case benchmarking-v2, Version: v4 – Final version, Date 28/06/2018
3.2.4.4 Other experimental procedures 39
3.3 Detection of food spoilage and shelf-life prediction 39
3.3.1 Meat 39
3.3.1.1 Experimental design 39
3.3.1.2 Implementation of sensors (food science laboratory) 41
3.3.1.3 Other experimental procedures 41
3.3.2 Fish 42
3.3.2.1 Experimental design 42
3.3.2.2 Implementation of sensors (food science laboratory) 43
3.3.2.3 Other experimental procedures 43
3.3.3 Fruit and vegetables 44
3.3.3.1 Experimental design 44
3.3.3.2 Implementation of sensors (food science laboratory) 45
3.3.3.3 Other experimental procedures 45
3.3.3.4 Pilot measurements 45
3.4 Detection of food fraud 46
3.4.1 Milk powder 46
3.4.1.1 Experimental design 46
3.4.1.2 Implementation of sensors (food science laboratory) 47
3.4.1.3 Other experimental procedures 47
3.4.2 Meat 48
3.4.2.1 Experimental design 48
3.4.2.2 Implementation of sensors (food science laboratory) 49
3.4.2.3 Other experimental procedures 49
3.4.3 Alcoholic beverages 49
3.4.3.1 Experimental design 49
3.4.3.2 Implementation of sensors (food science laboratory) 49
3.4.3.3 Other experimental procedures 49
3.4.4 Edible oils 50
4 Data analysis 51
4.1 Mycotoxin detection 51
Project Title: PhasmaFOOD Contract No. 732541 Project Coordinator: INTRASOFT International S.A.
Page | 6
D3.2 – Feasibility results and use case benchmarking-v2, Version: v4 – Final version, Date 28/06/2018
4.1.1 Maize flour 52
4.1.2 Tree nuts 53
4.2 Food spoilage detection and shelf-life prediction 53
4.2.1 Meat 53
4.2.2 Fish 53
4.2.3 Fruit and vegetables 54
4.3 Food fraud detection 54
4.3.1 Milk powder 53
4.3.2 Meat 53
4.3.3 Alcoholic beverages 53
4.3.4 Edible oils 53
5 Results and discussion 56
5.1 Feasibility of micro-sensor application for detection of mycotoxins 56
5.1.1 Maize flour 56
5.1.2 Milk powder 59
5.1.3 Paprika powder 59
5.1.4 Tree nuts 59
5.2 Feasibility of micro-sensor application for detection of spoilage 65
5.2.1 Meat 65
5.2.1.1 Microbiological data 65
5.2.1.2 Multispectral imaging (MSI) sensor (VideometerLab system) 66
5.2.1.3 FTIR spectroscopy 67
5.2.2 Fish 68
5.2.3 Fruit and vegetables 69
5.2.3.1 Microbiological data 69
5.2.3.2 Spectral data 70
5.3 Feasibility of micro-sensor application for detection of fraud 73
5.3.1 General food test 73
5.3.2 Milk powder 73
5.3.3 Meat 75
5.3.4 Alcoholic beverages 75
Project Title: PhasmaFOOD Contract No. 732541 Project Coordinator: INTRASOFT International S.A.
Page | 7
D3.2 – Feasibility results and use case benchmarking-v2, Version: v4 – Final version, Date 28/06/2018
5.3.5 Edible oils 75
6 Conclusions and outlook 76
References 77
Project Title: PhasmaFOOD Contract No. 732541 Project Coordinator: INTRASOFT International S.A.
Page | 8
D3.2 – Feasibility results and use case benchmarking-v2, Version: v4 – Final version, Date 28/06/2018
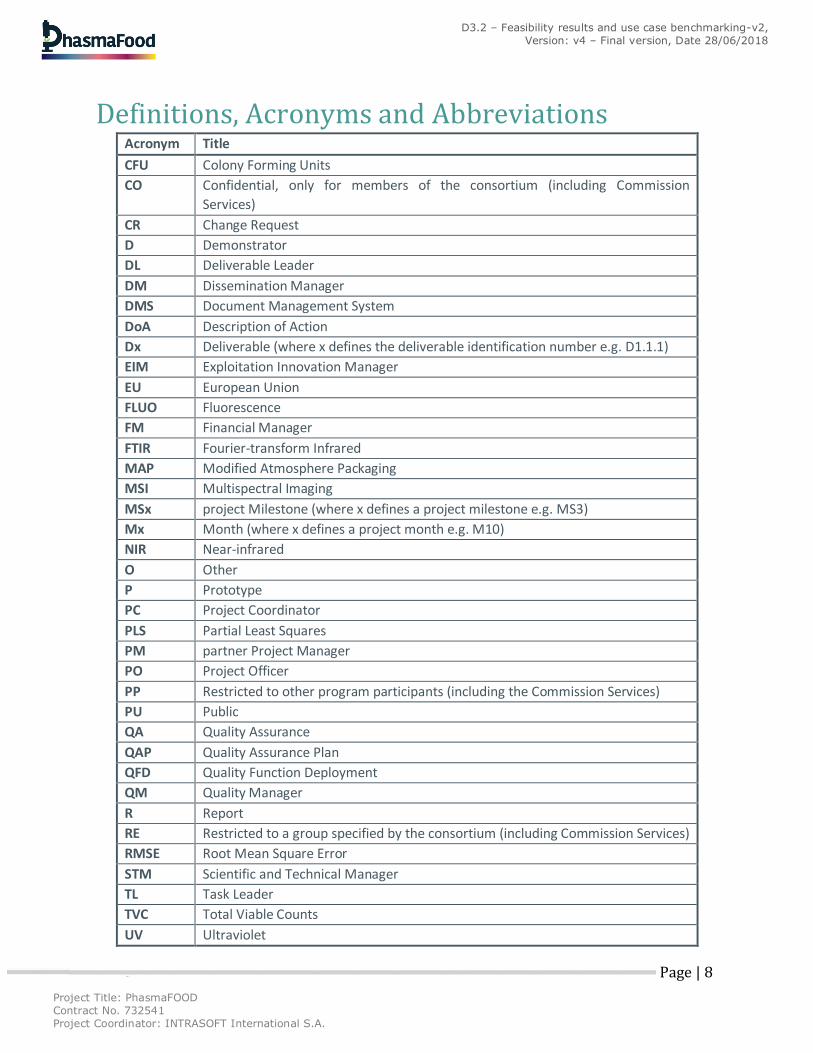
Definitions, Acronyms and Abbreviations Acronym Title
CFU Colony Forming Units
CO Confidential, only for members of the consortium (including Commission
Services)
CR Change Request
D Demonstrator
DL Deliverable Leader
DM Dissemination Manager
DMS Document Management System
DoA Description of Action
Dx Deliverable (where x defines the deliverable identification number e.g. D1.1.1)
EIM Exploitation Innovation Manager
EU European Union
FLUO Fluorescence
FM Financial Manager
FTIR Fourier-transform Infrared
MAP Modified Atmosphere Packaging
MSI Multispectral Imaging
MSx project Milestone (where x defines a project milestone e.g. MS3)
Mx Month (where x defines a project month e.g. M10)
NIR Near-infrared
O Other
P Prototype
PC Project Coordinator
PLS Partial Least Squares
PM partner Project Manager
PO Project Officer
PP Restricted to other program participants (including the Commission Services)
PU Public
QA Quality Assurance
QAP Quality Assurance Plan
QFD Quality Function Deployment
QM Quality Manager
R Report
RE Restricted to a group specified by the consortium (including Commission Services)
RMSE Root Mean Square Error
STM Scientific and Technical Manager
TL Task Leader
TVC Total Viable Counts
UV Ultraviolet

Project Title: PhasmaFOOD Contract No. 732541 Project Coordinator: INTRASOFT International S.A.
Page | 9
D3.2 – Feasibility results and use case benchmarking-v2, Version: v4 – Final version, Date 28/06/2018
VIS Visible
WP Work Package
WPL Work Package Leader
WPS Work Package Structure
Project Title: PhasmaFOOD Contract No. 732541 Project Coordinator: INTRASOFT International S.A.
Page | 10
D3.2 – Feasibility results and use case benchmarking-v2, Version: v4 – Final version, Date 28/06/2018
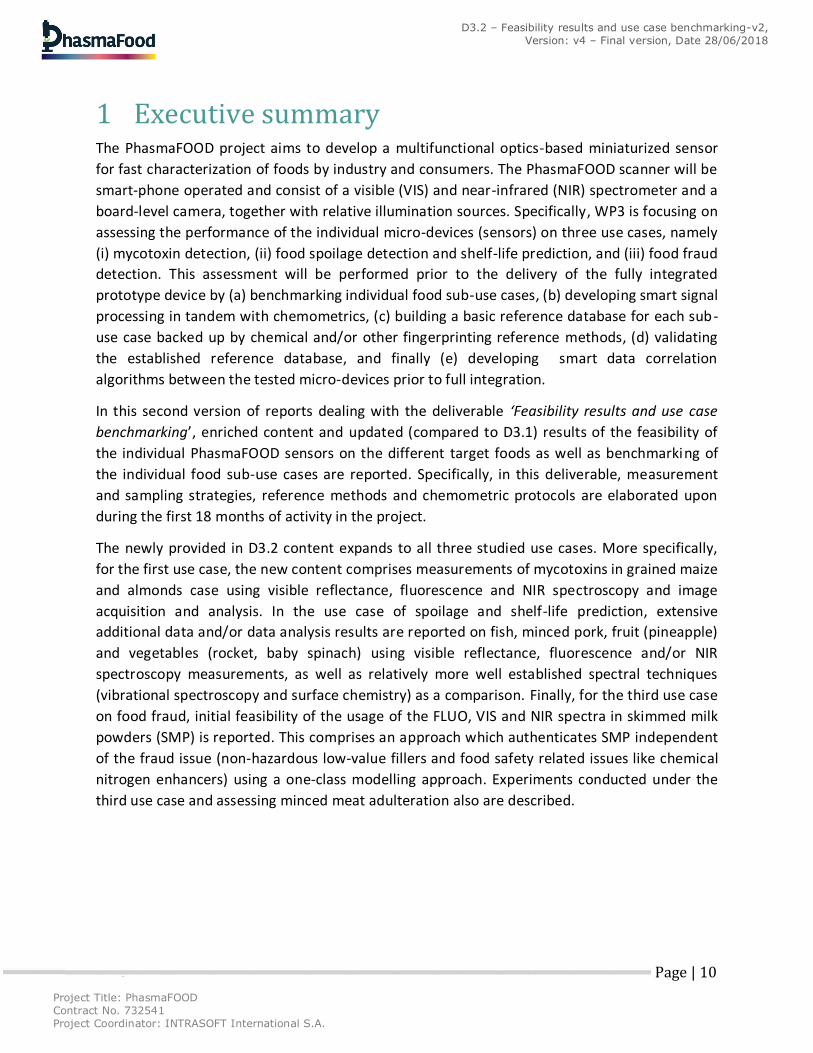
1 Executive summary The PhasmaFOOD project aims to develop a multifunctional optics-based miniaturized sensor
for fast characterization of foods by industry and consumers. The PhasmaFOOD scanner will be
smart-phone operated and consist of a visible (VIS) and near-infrared (NIR) spectrometer and a
board-level camera, together with relative illumination sources. Specifically, WP3 is focusing on
assessing the performance of the individual micro-devices (sensors) on three use cases, namely
(i) mycotoxin detection, (ii) food spoilage detection and shelf-life prediction, and (iii) food fraud
detection. This assessment will be performed prior to the delivery of the fully integrated
prototype device by (a) benchmarking individual food sub-use cases, (b) developing smart signal
processing in tandem with chemometrics, (c) building a basic reference database for each sub-
use case backed up by chemical and/or other fingerprinting reference methods, (d) validating
the established reference database, and finally (e) developing smart data correlation
algorithms between the tested micro-devices prior to full integration.
In this second version of reports dealing with the deliverable ‘Feasibility results and use case
benchmarking’, enriched content and updated (compared to D3.1) results of the feasibility of
the individual PhasmaFOOD sensors on the different target foods as well as benchmarking of
the individual food sub-use cases are reported. Specifically, in this deliverable, measurement
and sampling strategies, reference methods and chemometric protocols are elaborated upon
during the first 18 months of activity in the project.
The newly provided in D3.2 content expands to all three studied use cases. More specifically,
for the first use case, the new content comprises measurements of mycotoxins in grained maize
and almonds case using visible reflectance, fluorescence and NIR spectroscopy and image
acquisition and analysis. In the use case of spoilage and shelf-life prediction, extensive
additional data and/or data analysis results are reported on fish, minced pork, fruit (pineapple)
and vegetables (rocket, baby spinach) using visible reflectance, fluorescence and/or NIR
spectroscopy measurements, as well as relatively more well established spectral techniques
(vibrational spectroscopy and surface chemistry) as a comparison. Finally, for the third use case
on food fraud, initial feasibility of the usage of the FLUO, VIS and NIR spectra in skimmed milk
powders (SMP) is reported. This comprises an approach which authenticates SMP independent
of the fraud issue (non-hazardous low-value fillers and food safety related issues like chemical
nitrogen enhancers) using a one-class modelling approach. Experiments conducted under the
third use case and assessing minced meat adulteration also are described.
Project Title: PhasmaFOOD Contract No. 732541 Project Coordinator: INTRASOFT International S.A.
Page | 11
D3.2 – Feasibility results and use case benchmarking-v2, Version: v4 – Final version, Date 28/06/2018
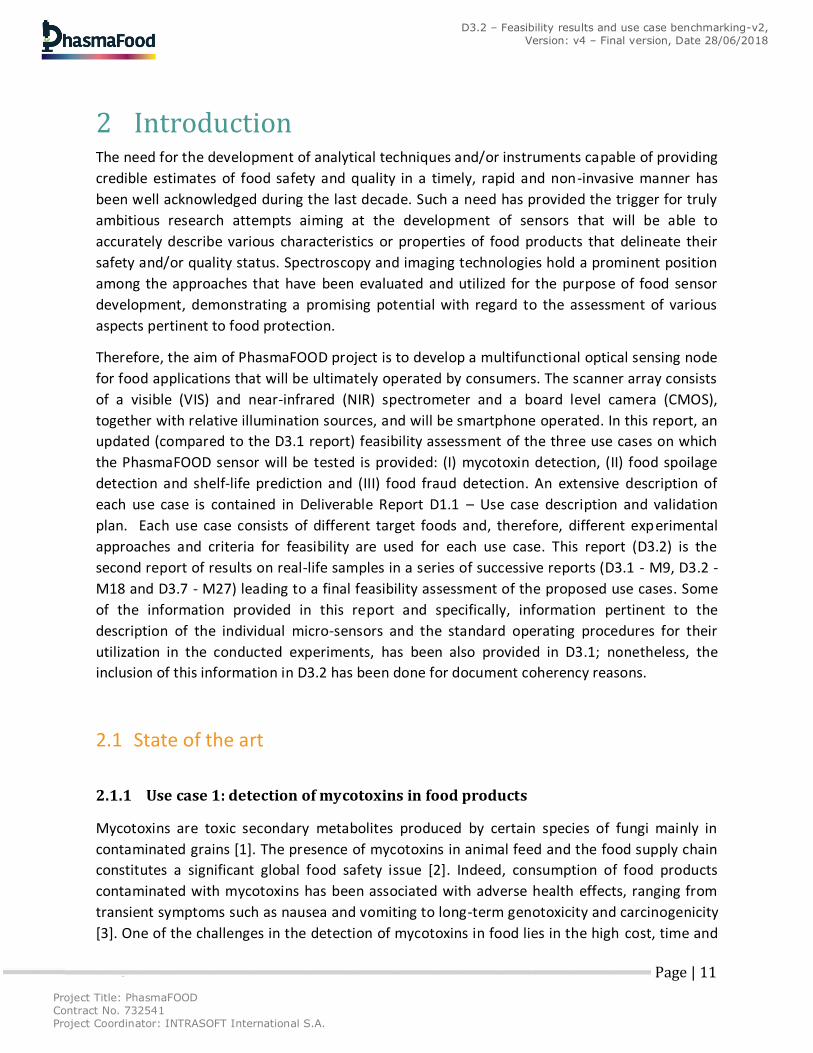
2 Introduction The need for the development of analytical techniques and/or instruments capable of providing
credible estimates of food safety and quality in a timely, rapid and non-invasive manner has
been well acknowledged during the last decade. Such a need has provided the trigger for truly
ambitious research attempts aiming at the development of sensors that will be able to
accurately describe various characteristics or properties of food products that delineate their
safety and/or quality status. Spectroscopy and imaging technologies hold a prominent position
among the approaches that have been evaluated and utilized for the purpose of food sensor
development, demonstrating a promising potential with regard to the assessment of various
aspects pertinent to food protection.
Therefore, the aim of PhasmaFOOD project is to develop a multifunctional optical sensing node
for food applications that will be ultimately operated by consumers. The scanner array consists
of a visible (VIS) and near-infrared (NIR) spectrometer and a board level camera (CMOS),
together with relative illumination sources, and will be smartphone operated. In this report, an
updated (compared to the D3.1 report) feasibility assessment of the three use cases on which
the PhasmaFOOD sensor will be tested is provided: (I) mycotoxin detection, (II) food spoilage
detection and shelf-life prediction and (III) food fraud detection. An extensive description of
each use case is contained in Deliverable Report D1.1 – Use case description and validation
plan. Each use case consists of different target foods and, therefore, different experimental
approaches and criteria for feasibility are used for each use case. This report (D3.2) is the
second report of results on real-life samples in a series of successive reports (D3.1 - M9, D3.2 -
M18 and D3.7 - M27) leading to a final feasibility assessment of the proposed use cases. Some
of the information provided in this report and specifically, information pertinent to the
description of the individual micro-sensors and the standard operating procedures for their
utilization in the conducted experiments, has been also provided in D3.1; nonetheless, the
inclusion of this information in D3.2 has been done for document coherency reasons.
2.1 State of the art
2.1.1 Use case 1: detection of mycotoxins in food products
Mycotoxins are toxic secondary metabolites produced by certain species of fungi mainly in
contaminated grains [1]. The presence of mycotoxins in animal feed and the food supply chain
constitutes a significant global food safety issue [2]. Indeed, consumption of food products
contaminated with mycotoxins has been associated with adverse health effects, ranging from
transient symptoms such as nausea and vomiting to long-term genotoxicity and carcinogenicity
[3]. One of the challenges in the detection of mycotoxins in food lies in the high cost, time and
Project Title: PhasmaFOOD Contract No. 732541 Project Coordinator: INTRASOFT International S.A.
Page | 12
D3.2 – Feasibility results and use case benchmarking-v2, Version: v4 – Final version, Date 28/06/2018
labor requirements of well-established analytical methods such as thin layer chromatography
and liquid chromatography mass spectrometry [4].
Various alternative approaches have been recently assessed for their potential utilization in
mycotoxins’ detection, including the use of biosensors, electrochemical-based sensing
platforms, Fourier transform infrared (FTIR) spectroscopy, hyperspectral imaging and
complementary metal–oxide semiconductor (CMOS) sensor [5-11]. Nonetheless, given that
most of the analytical spectroscopic techniques that have been individually evaluated only
allow for the detection of rather high concentrations of mycotoxins, the conjunctional approach
of the PhasmaFOOD project is anticipated to result in more robust data, potentially allowing for
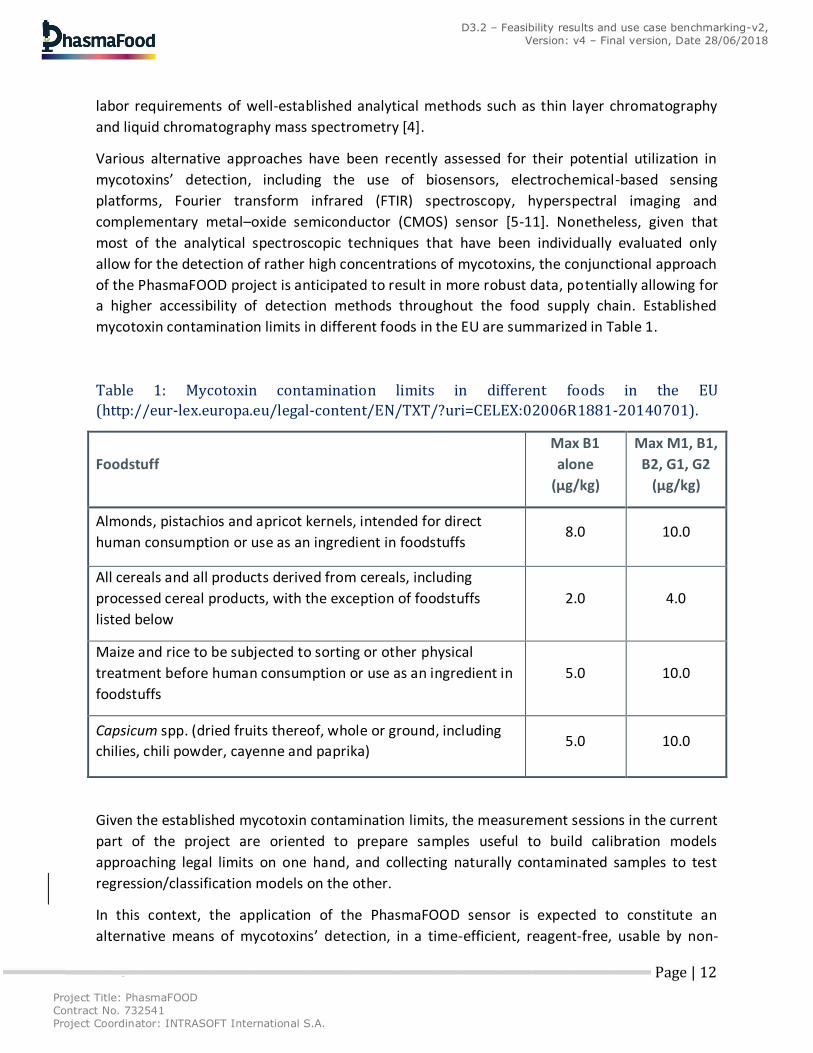
a higher accessibility of detection methods throughout the food supply chain. Established
mycotoxin contamination limits in different foods in the EU are summarized in Table 1.
Table 1: Mycotoxin contamination limits in different foods in the EU
(http://eur-lex.europa.eu/legal-content/EN/TXT/?uri=CELEX:02006R1881-20140701).
Foodstuff
Max B1
alone
(μg/kg)
Max M1, B1,
B2, G1, G2
(μg/kg)
Almonds, pistachios and apricot kernels, intended for direct
human consumption or use as an ingredient in foodstuffs 8.0 10.0
All cereals and all products derived from cereals, including
processed cereal products, with the exception of foodstuffs
listed below
2.0 4.0
Maize and rice to be subjected to sorting or other physical
treatment before human consumption or use as an ingredient in
foodstuffs
5.0 10.0
Capsicum spp. (dried fruits thereof, whole or ground, including
chilies, chili powder, cayenne and paprika) 5.0 10.0
Given the established mycotoxin contamination limits, the measurement sessions in the current
part of the project are oriented to prepare samples useful to build calibration models
approaching legal limits on one hand, and collecting naturally contaminated samples to test
regression/classification models on the other.
In this context, the application of the PhasmaFOOD sensor is expected to constitute an
alternative means of mycotoxins’ detection, in a time-efficient, reagent-free, usable by non-
Project Title: PhasmaFOOD Contract No. 732541 Project Coordinator: INTRASOFT International S.A.
Page | 13
D3.2 – Feasibility results and use case benchmarking-v2, Version: v4 – Final version, Date 28/06/2018
expert personnel and non-destructive to food samples manner. The different sub-use cases
considered in the PhasmaFOOD project are:
1. Maize (grained/flour): AF B1, total AFs and DON
2. Milk powder: AF M1 and M2
3. Paprika powder: AF B1 and total AFs
4. Tree nuts (homogenized, grained or whole nuts): AF B1 and total AFs
2.1.2 Use case 2: detection of early sign of spoilage, spoilage and shelf-life
estimation in meat, fish, fruit and vegetables.
Food quality, a central theme in food science research, has been considered as a term not easily
definable scientifically and that it comprises many different aspects, with the latter being
subject to constant changes. It has been opined that “food quality represents the sum of all
properties and assessable attributes of a food item”, and that this is accomplished through
three categories of quality: sensory value, suitability value and health value [12]. In the context
of a holistic assessment of food quality, several additional (to the aforementioned) categories
of quality have been also taken into account, including notional, cultural, political and ecological
values of food [12]. Indeed, it is widely accepted that the consumers’ perception regarding food
quality is a very important parameter when assessing food spoilage and shelf-life. Food
spoilage, a complex ecological phenomenon which is underlain mainly by the biochemical
activity of microorganisms, is related mainly to the sensoric and suitability values of food
quality. The food quality changes composing spoilage are related to the metabolic activity of
certain groups of microorganisms, referred to as “specific spoilage organisms”, and the type
and availability of the required energy substrates in foods [13, 14]. Although numerous
methods (organoleptic, microbiological or physico-chemical) have been developed for the
purpose of food quality assessment [15, 16], the majority of them are time-consuming, labor-
intensive, destructive, and provide retrospective information. Hence, various novel analytical
approaches have been recently evaluated and proposed for the non-destructive and rapid
assessment of food spoilage.
Examples of such promising approaches include enzymatic reactor systems, sensor arrays (e.g.
electronic noses), spectroscopy methods (e.g. vibrational, NMR or mass spectroscopy
techniques), as well as imaging technology approaches [17-20]. By means of combining visible
reflectance, fluorescence and NIR spectroscopy (and potentially CMOS images), the
PhasmaFOOD sensor is expected to be effective in estimating spoilage and shelf-life of a fresh
product. Still, since food spoilage is a rather complex ecological phenomenon, it should be kept
in mind that spoilage prediction can be a fairly difficult task, also in the PhasmaFOOD project.
One has to take into account biochemical activity of specific groups of microorganisms (strongly
associated with the shelf-life of various food products), the evolution of these specific groups of
microorganisms evaluated in conjunction with the physical and sensory changes of the food
Project Title: PhasmaFOOD Contract No. 732541 Project Coordinator: INTRASOFT International S.A.
Page | 14
D3.2 – Feasibility results and use case benchmarking-v2, Version: v4 – Final version, Date 28/06/2018
product (e.g., color, appearance, odor) etc. The different sub-use cases considered in the
PhasmaFOOD project are “fresh” products which are highly perishable and may pose a high risk
towards consumers for foodborne infection or intoxication:
1. Meat
2. Fish
3. Fruit and vegetables
With regard to the microbial levels being associated with a spoilage status delineating the end
of a food product’s shelf-life, these depend on the product itself as well as on the applied
storage conditions (i.e. temperature and atmosphere inside the packaging). In order for the
effect of the environmental parameters to be also taken into account, the experiments
conducted under this use case, and for the different sub-use cases being studied, were
designed so as to include product storage under different temperatures (both isothermal and
dynamic) and, wherever applicable, under different packaging conditions (i.e. aerobic and
modified atmosphere packaging). Overall, based on existent hygienic regulations and/or
research data available in the scientific literature, total mesophilic microbial populations
exceeding 107 CFU/g (or 7 log CFU/g) have been associated with unacceptable spoilage, and
thus shelf-life termination, for all the aforementioned food categories (i.e. sub-use cases) [18,
21, 22].
2.1.3 Use case 3: food fraud
Food fraud is a collective term referring to the “deliberate substitution, addition, tampering or
misrepresentation of food, food ingredients or packaging, or false or misleading statements
made about a product for economic gain”, as defined by the United States Pharmacopeia
Convention [23]. In Europe, consumers are protected by EC Regulation No. 178/2002,
underpinning the concept of informed consumer choice in the purchase of food. Unfortunately,
the number of food adulteration and fraud cases being unraveled in several EU member states
is rising. Since the conventional laboratory analysis methods for detecting fraud/adulteration
are laborious and expensive, the need for a smart non-invasive, rapid and, ideally, hand-held
device is eminent. In this framework, various analytical technologies have been recently
assessed for their efficacy in detecting food fraud/adulteration and, thus, for their potential
value in food authentication. Such analytical technologies include visible/near-infrared
spectroscopy, UV-VIS spectroscopy, use of compact digital camera as well as image analysis
approaches, while examples of food authentication applications being evaluated include edible
oil composition monitoring, detection of minced meat adulteration and fresh/frozen-thawed
fish discrimination [24-28].
Overall, the smart sensor-based system which is planned to be developed within the
PhasmaFOOD project, is anticipated to allow for the accurate assessment of all the
aforementioned food protection aspects through the utilization of relevant spectral and/or
Project Title: PhasmaFOOD Contract No. 732541 Project Coordinator: INTRASOFT International S.A.
Page | 15
D3.2 – Feasibility results and use case benchmarking-v2, Version: v4 – Final version, Date 28/06/2018
imaging data, and as such to be of great value for practical application throughout the food
supply chain (food manufacturers, retailers, food service, consumers). The different sub-use
cases being considered are:
1. Milk powder
2. Meat
3. Alcoholic beverages
4. Edible oils
2.2 Description of micro-sensors
2.2.1 NIR microspectrometer
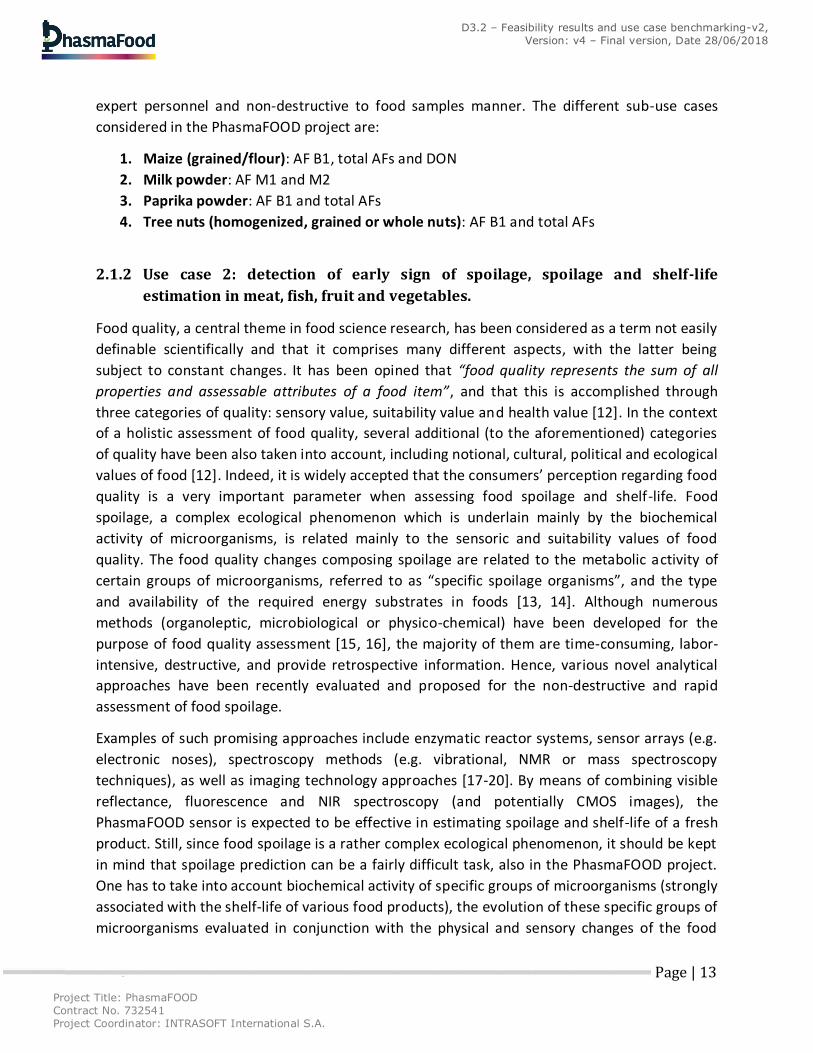
The PhasmaFOOD smart sensing system integrates a miniaturised NIR spectrometer to cover
the wavelength range from 1000 to 1900 nm (Fig. 1). The device was developed by partner
IPMS, with a size of the sensor head of 16 × 17 × 12 mm. The central active component inside
this device is a miniature optical grating, which oscillates resonantly at a frequency of ~ 100 Hz,
driven by electrostatic forces from a comb-like structure. This micro-electromechanical (MEMS)
component was fabricated in the IPMS clean room [29]. The assembly of the spectrometer also
took place at IPMS. IPMS provides this spectrometer as a demonstrator kit complete with read-
out electronics but without housing, as this is part of the integration work of WPs 2 and 5. Once
the PhasmaFOOD device is finished in WP6/ month 18, the miniaturized NIR spectrometer will
be available for testing in WP3. Further technical details are elaborated in deliverable report
D6.1.
Figure 1: MEMS, miniaturized version of the NIR spectrometer developed at IPMS.
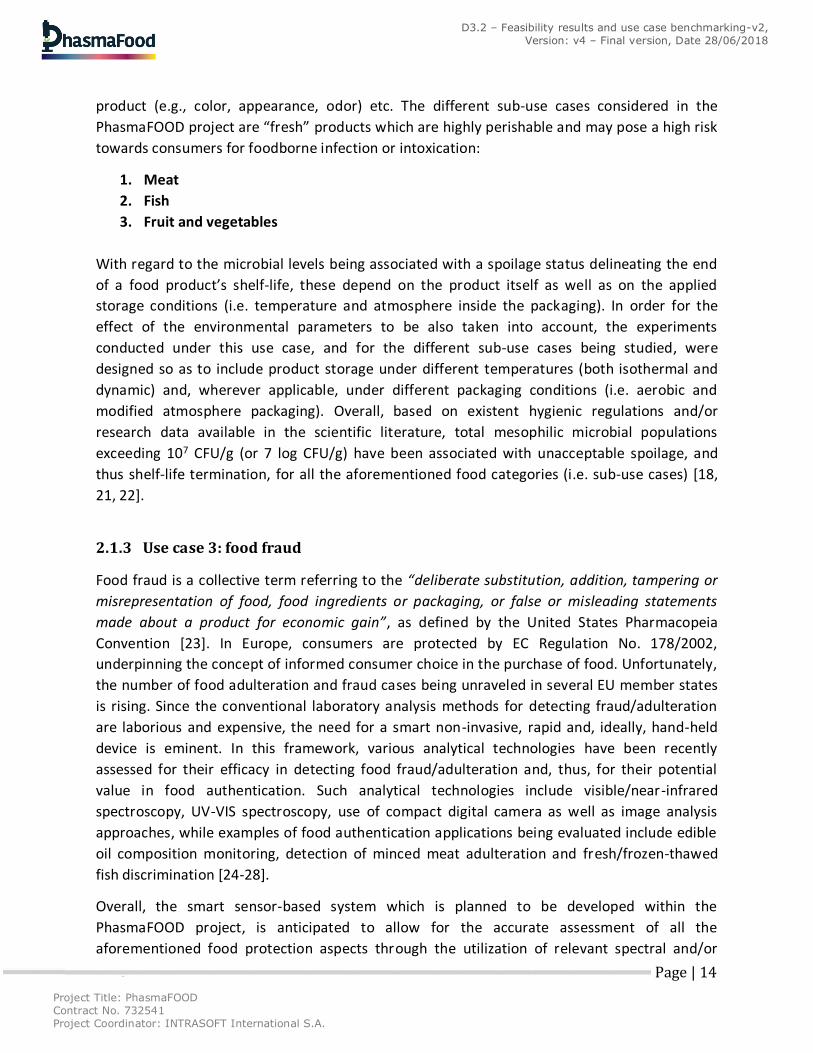
In the meantime, for laboratory testing in the early stages of WP3, a more robust solution was
found, namely the NIR spectrometer SGS1900 (Fig. 2). This device incorporates the same
technology and measuring principle as the above miniaturized version and is commercially
available from Hiperscan GmbH, a spin-off of IPMS. For the purposes of WP3, in order to test
the general applicability of the sensing method for the three PhasmaFOOD use-cases, an
SGS1900 instrument was provided by IPMS as a free loan to PhasmaFOOD partners.
Project Title: PhasmaFOOD Contract No. 732541 Project Coordinator: INTRASOFT International S.A.
Page | 16
D3.2 – Feasibility results and use case benchmarking-v2, Version: v4 – Final version, Date 28/06/2018
Figure 2: The NIR spectrometer SGS1900 used for testing of the general applicability of the sensing method for the PhasmaFOOD use cases.
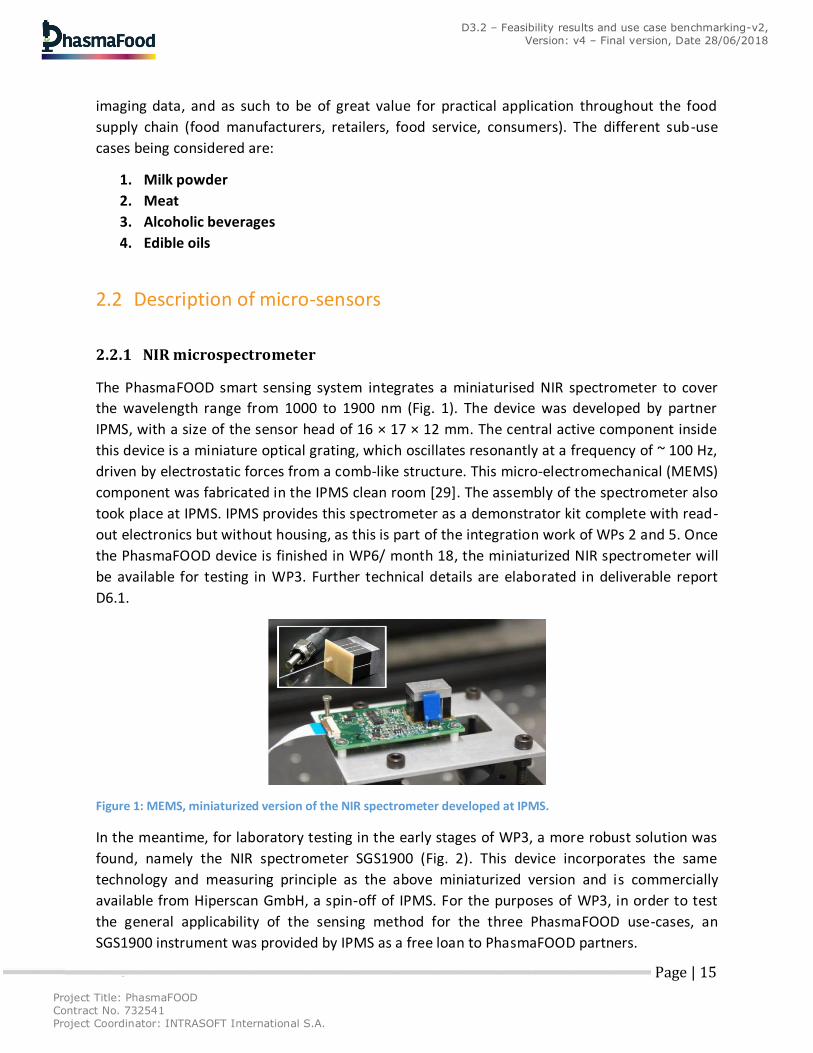
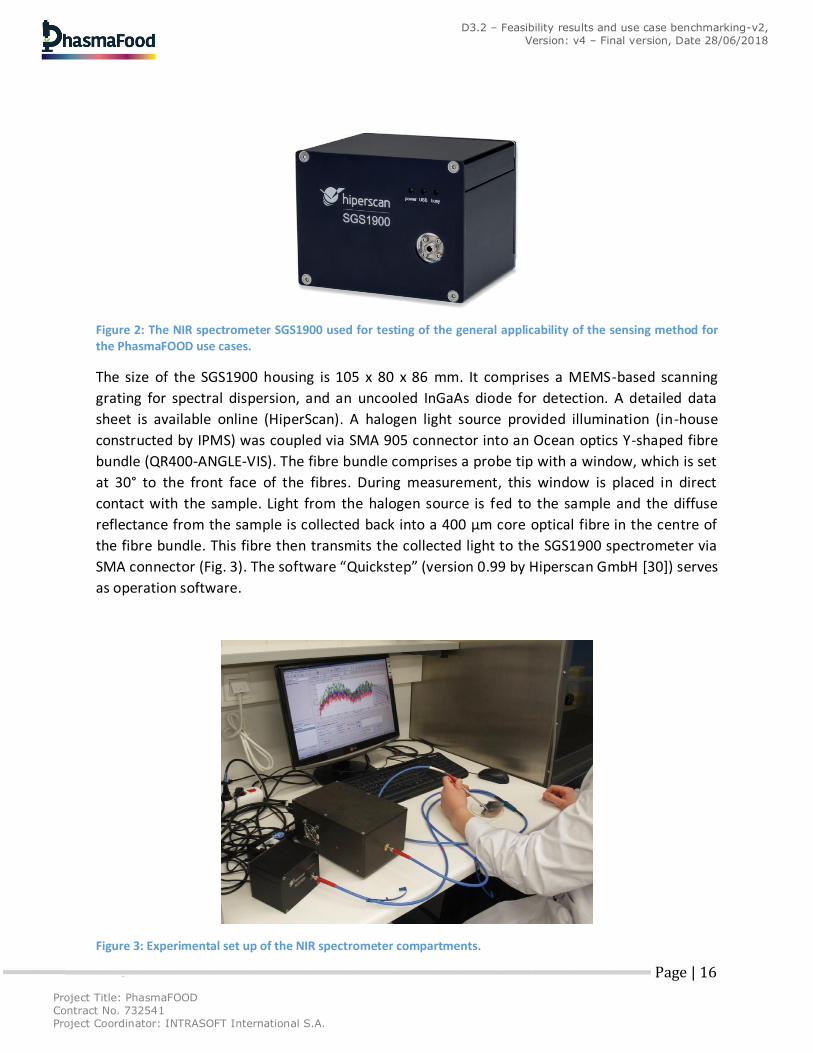
The size of the SGS1900 housing is 105 x 80 x 86 mm. It comprises a MEMS-based scanning
grating for spectral dispersion, and an uncooled InGaAs diode for detection. A detailed data
sheet is available online (HiperScan). A halogen light source provided illumination (in-house
constructed by IPMS) was coupled via SMA 905 connector into an Ocean optics Y-shaped fibre
bundle (QR400-ANGLE-VIS). The fibre bundle comprises a probe tip with a window, which is set
at 30° to the front face of the fibres. During measurement, this window is placed in direct
contact with the sample. Light from the halogen source is fed to the sample and the diffuse
reflectance from the sample is collected back into a 400 µm core optical fibre in the centre of
the fibre bundle. This fibre then transmits the collected light to the SGS1900 spectrometer via
SMA connector (Fig. 3). The software “Quickstep” (version 0.99 by Hiperscan GmbH [30]) serves
as operation software.
Figure 3: Experimental set up of the NIR spectrometer compartments.
Project Title: PhasmaFOOD Contract No. 732541 Project Coordinator: INTRASOFT International S.A.
Page | 17
D3.2 – Feasibility results and use case benchmarking-v2, Version: v4 – Final version, Date 28/06/2018
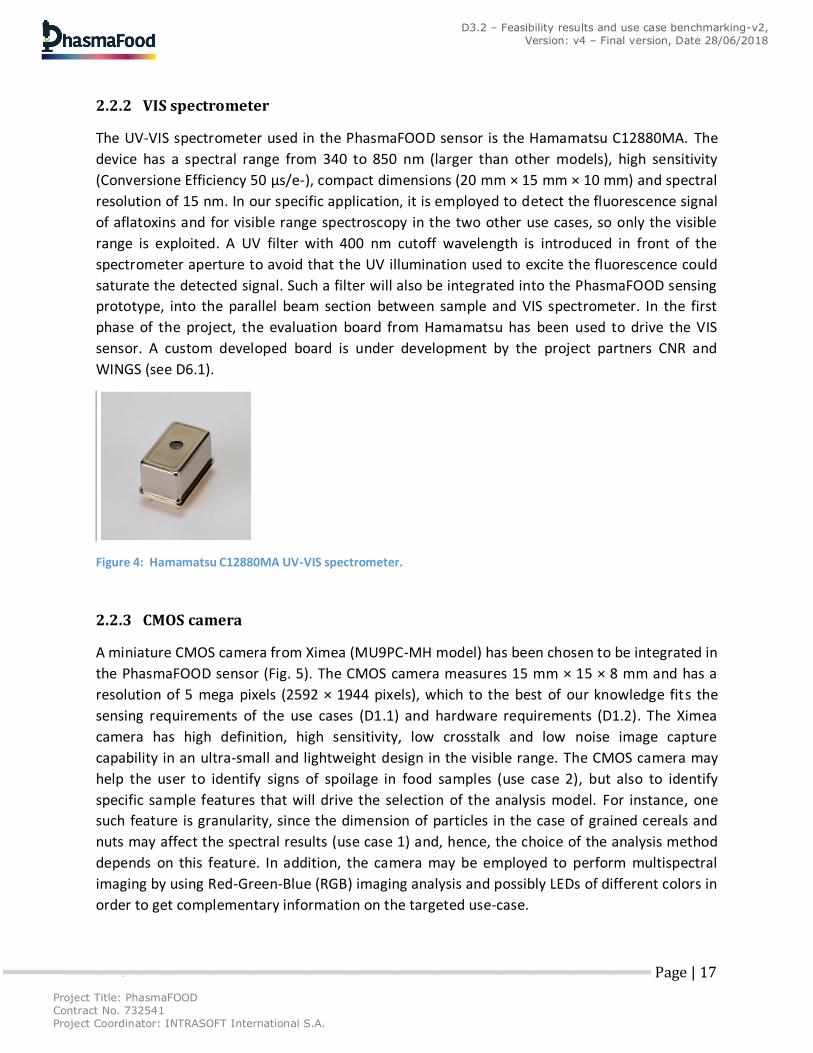
2.2.2 VIS spectrometer
The UV-VIS spectrometer used in the PhasmaFOOD sensor is the Hamamatsu C12880MA. The
device has a spectral range from 340 to 850 nm (larger than other models), high sensitivity
(Conversione Efficiency 50 μs/e-), compact dimensions (20 mm × 15 mm × 10 mm) and spectral
resolution of 15 nm. In our specific application, it is employed to detect the fluorescence signal
of aflatoxins and for visible range spectroscopy in the two other use cases, so only the visible
range is exploited. A UV filter with 400 nm cutoff wavelength is introduced in front of the
spectrometer aperture to avoid that the UV illumination used to excite the fluorescence could
saturate the detected signal. Such a filter will also be integrated into the PhasmaFOOD sensing
prototype, into the parallel beam section between sample and VIS spectrometer. In the first
phase of the project, the evaluation board from Hamamatsu has been used to drive the VIS
sensor. A custom developed board is under development by the project partners CNR and
WINGS (see D6.1).
Figure 4: Hamamatsu C12880MA UV-VIS spectrometer.
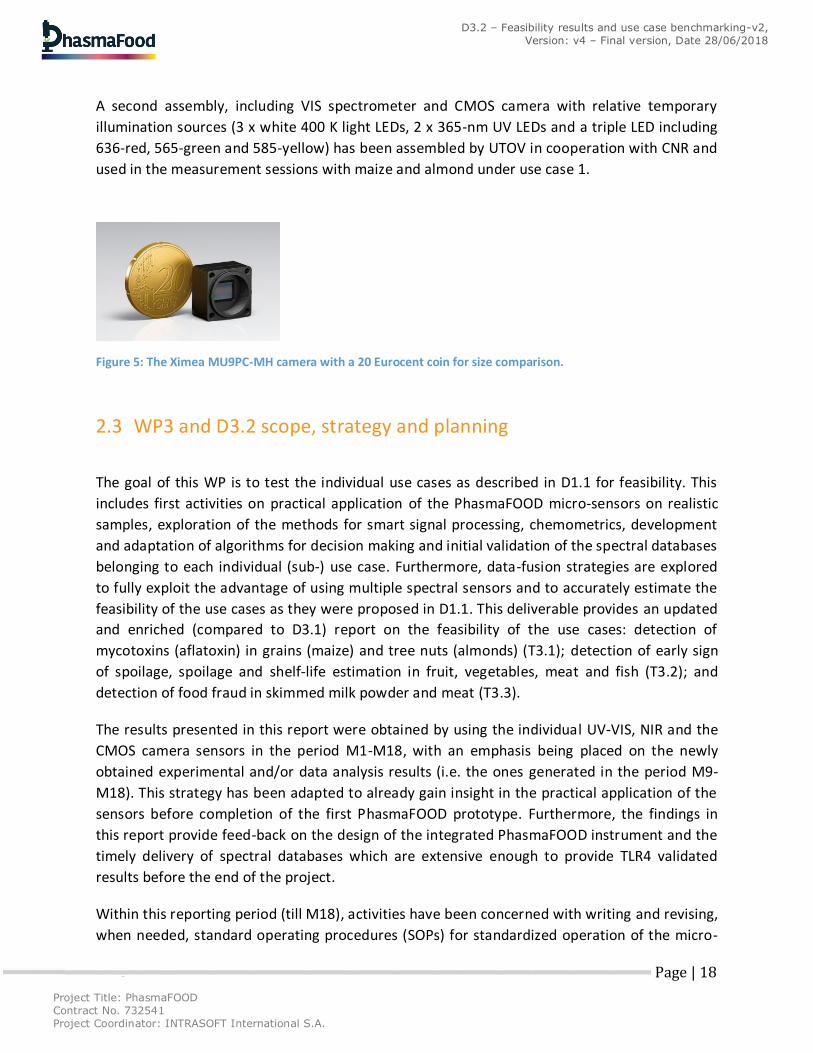
2.2.3 CMOS camera
A miniature CMOS camera from Ximea (MU9PC-MH model) has been chosen to be integrated in
the PhasmaFOOD sensor (Fig. 5). The CMOS camera measures 15 mm × 15 × 8 mm and has a
resolution of 5 mega pixels (2592 × 1944 pixels), which to the best of our knowledge fits the
sensing requirements of the use cases (D1.1) and hardware requirements (D1.2). The Ximea
camera has high definition, high sensitivity, low crosstalk and low noise image capture
capability in an ultra-small and lightweight design in the visible range. The CMOS camera may
help the user to identify signs of spoilage in food samples (use case 2), but also to identify
specific sample features that will drive the selection of the analysis model. For instance, one
such feature is granularity, since the dimension of particles in the case of grained cereals and
nuts may affect the spectral results (use case 1) and, hence, the choice of the analysis method
depends on this feature. In addition, the camera may be employed to perform multispectral
imaging by using Red-Green-Blue (RGB) imaging analysis and possibly LEDs of different colors in
order to get complementary information on the targeted use-case.
Project Title: PhasmaFOOD Contract No. 732541 Project Coordinator: INTRASOFT International S.A.
Page | 18
D3.2 – Feasibility results and use case benchmarking-v2, Version: v4 – Final version, Date 28/06/2018
A second assembly, including VIS spectrometer and CMOS camera with relative temporary
illumination sources (3 x white 400 K light LEDs, 2 x 365-nm UV LEDs and a triple LED including
636-red, 565-green and 585-yellow) has been assembled by UTOV in cooperation with CNR and
used in the measurement sessions with maize and almond under use case 1.
Figure 5: The Ximea MU9PC-MH camera with a 20 Eurocent coin for size comparison.
2.3 WP3 and D3.2 scope, strategy and planning
The goal of this WP is to test the individual use cases as described in D1.1 for feasibility. This
includes first activities on practical application of the PhasmaFOOD micro-sensors on realistic
samples, exploration of the methods for smart signal processing, chemometrics, development
and adaptation of algorithms for decision making and initial validation of the spectral databases
belonging to each individual (sub-) use case. Furthermore, data-fusion strategies are explored
to fully exploit the advantage of using multiple spectral sensors and to accurately estimate the
feasibility of the use cases as they were proposed in D1.1. This deliverable provides an updated
and enriched (compared to D3.1) report on the feasibility of the use cases: detection of
mycotoxins (aflatoxin) in grains (maize) and tree nuts (almonds) (T3.1); detection of early sign
of spoilage, spoilage and shelf-life estimation in fruit, vegetables, meat and fish (T3.2); and
detection of food fraud in skimmed milk powder and meat (T3.3).
The results presented in this report were obtained by using the individual UV-VIS, NIR and the
CMOS camera sensors in the period M1-M18, with an emphasis being placed on the newly
obtained experimental and/or data analysis results (i.e. the ones generated in the period M9-
M18). This strategy has been adapted to already gain insight in the practical application of the
sensors before completion of the first PhasmaFOOD prototype. Furthermore, the findings in
this report provide feed-back on the design of the integrated PhasmaFOOD instrument and the
timely delivery of spectral databases which are extensive enough to provide TLR4 validated
results before the end of the project.
Within this reporting period (till M18), activities have been concerned with writing and revising,
when needed, standard operating procedures (SOPs) for standardized operation of the micro-
Project Title: PhasmaFOOD Contract No. 732541 Project Coordinator: INTRASOFT International S.A.
Page | 19
D3.2 – Feasibility results and use case benchmarking-v2, Version: v4 – Final version, Date 28/06/2018
sensors in each laboratory where feasibility testing is performed (CNR, AUA and DLO).
Furthermore, for the period M9-M18, an additional planning has been produced for the
circulation of the micro-sensors between the involved laboratories, taking into consideration
the time required to perform measurements for feasibility estimation. Sensor time in the first
six months of Year 2 has been mainly allocated for studies under T3.2 (ca. M13-M15), due to
the lengthy duration of spoilage experiments, whilst for T3.1 (M15) and T3.3 (M15 and further
in Year 2) most samples can be acquired and stored until sensors are available. Therefore, in
this deliverable, first results on mycotoxins (maize flour and almonds, both naturally and
artificially contaminated) are reported, while for T3.2 additional (to those described in D3.1)
extensive data on spoilage of meat (minced pork), fruit (pineapple) and vegetable (rocket, baby
spinach) products are available. With regard to T3.3, initial feasibility of the usage of the
PhasmaFOOD sensors on skimmed milk powders is reported, while the experimental
procedures embraced for the purpose of assessing meat adulteration also are described.
Project Title: PhasmaFOOD Contract No. 732541 Project Coordinator: INTRASOFT International S.A.
Page | 20
D3.2 – Feasibility results and use case benchmarking-v2, Version: v4 – Final version, Date 28/06/2018
3 Materials and methods
3.1 SOPs for micro-sensor operation
3.1.1 NIR spectrometer
In this section, the operation procedure for the Hiperscan SGS1900 NIR spectrometer (Serial
Number W1141 157) is described. The NIR micro-spectrometer will follow a similar operation
procedure albeit details like the software structure may differ (see D6.1). The steps for
operating the SGS1900 spectrometer include:
1. Prior to operation: Install the NIR acquisition software on your lab computer. In order to
run it, you require the MONO version 2.6.4 (or older). IPMS provides access to both
programs through a content server during the period of the PhasmaFOOD project.
2. Setting up: Connect the SGS1900 spectrometer to grid power (220 V) via the included
power adapter. The power status light of the SGS1900 should light up green. Connect
the SGS1900 spectrometer to your laboratory computer via the included micro-USB-to-
USB cable. Switch on your lab computer. Start the NIR acquisition software. The USB
status light of the SGS1900 should pulse in green during data transfers while the
instrument is being initialized. Once the instrument is properly initialized, you will see its
registration number in the “Device” window.
Inspect the two ends of the fiber bundle – one end comprises six fibers in a ring, the
other end comprises a single central fiber. Connect the single- fiber end to the SGS1900
spectrometer by plugging it into the SMA connector and fixing the screw. Connect the
six-fiber end to the halogen light source in the same way. Connect the light source to
grid power and switch it on by pressing the black switch at the back of the housing.
Looking into the angled window of the fiber probe, you should now see a ring of six
fibers lighting up. Wait for 5 minutes for the lamp to warm up.
3. Set number of averages: In the NIR acquisition software (“Properties” window), select
the number of averages. If this window does not show upon starting the software, you
can open it by choosing the “View” tab in the menu bar, then “Window layout” and then
selecting “Property editor”. A high number of averages results in longer measurement
times and in reduced data noise. A typical number is 1000 averages. Above 2000
averages, no further reduction of noise is expected. You may change the number of
averages by typing a number into the “Averages” window and pressing “Apply”. The
software will send a reminder message to renew the dark and background references
once the number of averages has changed.
4. Dark intensity reference (after each change of acquisition parameters): Make sure that
the SGS1900 spectrometer does not receive light by disconnecting the fiber from the
Project Title: PhasmaFOOD Contract No. 732541 Project Coordinator: INTRASOFT International S.A.
Page | 21
D3.2 – Feasibility results and use case benchmarking-v2, Version: v4 – Final version, Date 28/06/2018
SGS1900 or by pointing the fiber probe towards dark empty space. In the software,
press the red button next to “Dark intensity”. Once the measurement is done, confirm
the setting by pressing “Apply”. The dark intensity measurement is required to correct
for the baseline noise of each measurement. Data can later be exported in a format that
has this baseline correction automatically included.
5. White background reference (after each change of acquisition parameters): Connect the
fiber bundle to SGS1900 spectrometer and halogen lamp as described above. Make sure
that the fiber probe is clean and dry. Leave the light on, hold the fiber probe so that it
touches a surface suitable as a white reference (a PTFE target or any other white
reference target suitable for NIR). In the software, press the red button next to
“Background”. The spectrometer should now record the spectrum of the halogen lamp
which is scattered back from the reference target. This measurement is saved internally
in the NIR acquisition software. Once the measurement is done, confirm the setting by
pressing “Apply”. The white background reference measurement is required to correct
for the lamp spectrum and calculate extinction/absorbance from the raw data.
Note: Dark intensity and background lamp spectrum may change slightly over time.
Therefore, each time the spectrometer is switched on, these references must be
recorded again. After that, press “Apply” and you’re ready to start measuring. If you are
measuring in long sessions, it is advisable to record new references approx. every 2
hours.
6. Measurement – setup: Measurements with the y-shaped fiber bundle are done in direct
contact with the sample. The tip of the fiber probe is cut at an angle of 30° in order to
avoid direct reflexes from the sample. Only diffuse scattered light is collected, which
contains information about the NIR absorption spectrum of the sample. Hold the fiber
probe so that the window at the tip of the probe and the sample surface are in full
contact, i.e. parallel.
Note: This measurement geometry is suitable for samples that absorb or scatter light in the NIR
spectral range. Transparent samples cannot be investigated this way. Intermediate
cases may arise when samples are physically thin such that the NIR lamp light is partly
transmitted through them. In these cases, please fold the sample over or stack several
samples to increase the thickness. A sufficient thickness is reached when no NIR lamp
light is observed through the back of the sample. If this precaution is not followed, the
physical background of the sample will influence the measurement.
7. Measurement – data acquisition: In the software, press the red button to acquire a
spectrum. Hold the fiber tip still during acquisition. Several spectra may be acquired in
sequence, e.g. to observe the variation across a single sample. For a quick overview of
the measured data, the acquisition software opens a tab with the spectrum diagram. Via
the “View” tab in the main menu, the “Plot type” view mode in this window can be
changed between intensity/absorbance/SNV and other modes. Under “Plot type” you
can select your preferred option. Default is an intensity plot corrected for the dark
intensity. For evaluation, Absorbance is preferred.
Project Title: PhasmaFOOD Contract No. 732541 Project Coordinator: INTRASOFT International S.A.
Page | 22
D3.2 – Feasibility results and use case benchmarking-v2, Version: v4 – Final version, Date 28/06/2018
8. Saving data:
Option 1: Select the “File” tab in the main menu, then select “Export”. The acquisition
software will export all data from the currently viewed window in the currently used
View option into a single *.csv file. Caution: Please select Intensity mode before
exporting data. The acquisition software has a known bug in the export of absorbance
values. The dark counts offset is automatically subtracted in the saved intensity values.
The white reference spectrum required to calculate absorbance is not saved
automatically but is only stored in the software while running the spectrometer. In
order to calculate absorbance later during data analysis, the white lamp spectrum must
be recorded like a regular spectrum in the same diagram window. Tip: Measurements
can be grouped into sets by opening new diagram tabs, e.g. a new tab for each sample
or session.
Option 2: Select the “Extensions” tab in the main menu, then, “Acquisition”, then select
“Save after acquisition”. You will be asked for the file name. Please use a file name in
this format: “<sampleinfo>_01”. The software will then save all spectra in the currently
viewed diagram window in subsequently numbered (02, 03, etc. …) individual *.csv files.
These files contain a header with meta information like instrument settings and dark
counts, one column for x-axis (wavelength in nm), one column for intensity values (raw,
dark counts NOT subtracted), a third column for absorbance values (dark counts
subtracted and white reference spectrum taken into account). No bugs are known for
this absorbance calculation, i.e. the absorbance spectra can be trusted and directly used
in analysis.
It is recommended to use Option 2 for saving data as all meta-information and raw data
are automatically kept.
9. Shutting down: Close the acquisition software. Switch off the lamp. Disconnect all
electrical and optical connections of the lamp and SGS1900 spectrometer. Clean the
fiber probe window and put the plastic caps on the fiber ends/connectors of the
spectrometer, lamp and probe.
10. Cleaning: If necessary, in order to avoid contamination between measurements or
samples, the front window of the fiber probe can be cleaned by wiping with a simple
tissue containing ethanol, isopropanol or DI water. Please do not use any other solvent
(especially no acetone) or anything abrasive for cleaning. Please also do not dip the fiber
probe into any solvent for a longer time to avoid solvent entering the housing. Dipping
into liquids for a short time (minutes) is allowed, as long as the rim of the probe stays
above the liquid. The probe window should be cleaned and dried directly after the end
of the measurements, before the instrument is put away for the night. Simple optical
inspection by eye can tell whether the probe window needs cleaning between
measurements.
Project Title: PhasmaFOOD Contract No. 732541 Project Coordinator: INTRASOFT International S.A.
Page | 23
D3.2 – Feasibility results and use case benchmarking-v2, Version: v4 – Final version, Date 28/06/2018
3.1.2 VIS spectrometer
The list of the possible steps for the operating procedure of the VIS spectrometer is described
below. Please note again that the spectrometer is protected with a UV excitation filter during
measurements. Therefore, strictly only VIS spectra will be obtained throughout the
PhasmaFOOD project. This does not affect the measuring procedure as it simply leads to zero
signal over the blocking range of the UV filter. Measured spectral data are considered valid in
the visible spectral range of the Hamamatsu spectrometer, i.e. between 400 nm and 850 nm.
Please note, that this restriction does not apply to the light sources, which will illuminate in
both, UV and VIS spectral ranges as the UV light is required to excite VIS fluorescence from the
sample. The following measuring procedure is based on the first integrated design of UV-VIS
spectrometer and lighting system (UV and white LEDs).
1. Power on the device (lights OFF).
2. Launch acquisition software.
3. From acquisition software, tool -> set parameters (integration time= for acquisition in
white light reflectance mode, according to use case, usually hundreds of microseconds,
number of average counts usually 10; for acquisition in fluorescence mode, integration
time in the range of hundreds of milliseconds and 3 average counts).
4. Dark calibration
a. While the lights are off, orientate the instrument toward a dark surface (the
optical spot) and keeping the device under a darkening hood start dark mode to
perform dark measurement and automatic storage.
5. White light reflectance mode (at the beginning of a new session or every day)
a. turn VIS light ON
b. Wait 15-20 minutes (this step depends on the white LED characteristics)
c. Point the acquisition window toward a white reference
d. Start Reference mode and perform acquisition of the white reference.
e. Put the acquisition window in front of the sample.
6. Measurement mode (performed for each single sample measurement)
a. Measurement mode and perform acquisition on the sample (different areas, and
different samples). Of course, acquisition parameters must be kept constant
throughout the measurement session.
Project Title: PhasmaFOOD Contract No. 732541 Project Coordinator: INTRASOFT International S.A.
Page | 24
D3.2 – Feasibility results and use case benchmarking-v2, Version: v4 – Final version, Date 28/06/2018
b. The software for each measurement will give 3 files (*.csv format) as output:
sample1.dark, sample1.reference, sample1 (if not changed during the
measurement session, dark and reference file will be the same for all samples).
c. Data normalization and classification will be performed using the developed data
analysis models (that could be different for each case study) considering also the
dark and reference measurements.
7. 7. At the end of measurement session, perform measurement of the reference (using
measurement mode).
8. Close measurement software
a. Switch off illumination
b. Switch off device
For the Fluorescence mode
1-to 3 as above
4. Dark calibration
a. Direct the instrument toward a dark surface (the optical spot) and keeping
the device under a darkening hood and Start dark mode (UV lights off) to
perform dark measurement and automatic storage.
5. Reference acquisition
a. Turn UV light ON
b. Point the acquisition window toward a non-fluorescent reflective reference
standard
c. Start Reference mode and perform acquisition.
6. Start Measurement mode and perform acquisition on the sample (different areas, 5 spots
for each sample and different samples). Of course, acquisition parameters must be kept
constant throughout the measurement session. As already indicated, the software for each
measurement will give 3 files (*.csv format) as output: sample1.dark, sample1.reference,
sample1 (if not changed during the measurement session, dark and reference file will be the
same for all samples).
7. At the end of measurement session, perform measurement of the reference (using
measurement mode).
8. Close measurement software
a. Switch off illumination
Project Title: PhasmaFOOD Contract No. 732541 Project Coordinator: INTRASOFT International S.A.
Page | 25
D3.2 – Feasibility results and use case benchmarking-v2, Version: v4 – Final version, Date 28/06/2018
b. Switch off device
The acquisition of both VIS and FLUO spectra from the same samples must be repeated in
different days during the same measurement session.
3.1.3 CMOS camera
Complete operating procedures for calibration and image analysis will be defined according to
use cases and upon completion of feasibility tests. In this phase of the project, the camera
inserted in the assembly together with the VIS spectrometer has been used in two modalities:
- white light modality (to extract sample morphological features like granularity) mainly
for use case 1 applications
- multi-color imaging using an array of monochromatic LEDs (UV, red, green, yellow) to
test the potentialities of multi-color imaging, possibly for use case 2 applications.
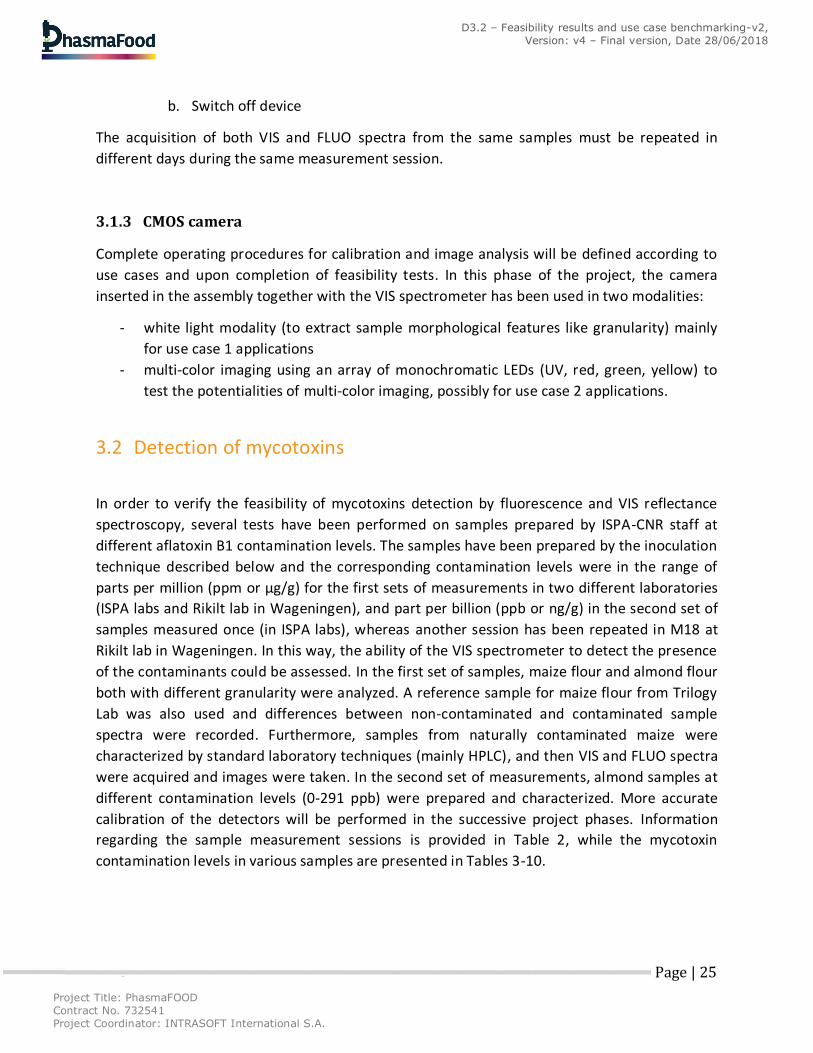
3.2 Detection of mycotoxins
In order to verify the feasibility of mycotoxins detection by fluorescence and VIS reflectance
spectroscopy, several tests have been performed on samples prepared by ISPA-CNR staff at
different aflatoxin B1 contamination levels. The samples have been prepared by the inoculation
technique described below and the corresponding contamination levels were in the range of
parts per million (ppm or μg/g) for the first sets of measurements in two different laboratories
(ISPA labs and Rikilt lab in Wageningen), and part per billion (ppb or ng/g) in the second set of
samples measured once (in ISPA labs), whereas another session has been repeated in M18 at
Rikilt lab in Wageningen. In this way, the ability of the VIS spectrometer to detect the presence
of the contaminants could be assessed. In the first set of samples, maize flour and almond flour
both with different granularity were analyzed. A reference sample for maize flour from Trilogy
Lab was also used and differences between non-contaminated and contaminated sample
spectra were recorded. Furthermore, samples from naturally contaminated maize were
characterized by standard laboratory techniques (mainly HPLC), and then VIS and FLUO spectra
were acquired and images were taken. In the second set of measurements, almond samples at
different contamination levels (0-291 ppb) were prepared and characterized. More accurate
calibration of the detectors will be performed in the successive project phases. Information
regarding the sample measurement sessions is provided in Table 2, while the mycotoxin
contamination levels in various samples are presented in Tables 3-10.
Project Title: PhasmaFOOD Contract No. 732541 Project Coordinator: INTRASOFT International S.A.
Page | 26
D3.2 – Feasibility results and use case benchmarking-v2, Version: v4 – Final version, Date 28/06/2018
Table 2: Information regarding the sample measurement sessions.
Laboratory
location Samples
Contamination
range
Contamination
type Techniques Time
ISPA (Bari, IT) Maize,
Almond μg/g, ng/g (Trilogy)
Artificially, naturally (Trilogy)
VIS, FLUO M7
Rikilt (Wageningen, NL)
Maize, Almond
μg/g, ng/g (Trilogy)
Artificially, naturally
(Trilogy, Rikilt collected Maize, wheat, peanuts)
VIS, FLUO, NIR, Camera (not integrated
with VIS spectrometer)
M11
IFN (Rome, IT) Maize Absence of
contamination -
VIS, FLUO, Camera
(integrated) M15
ISPA (Bari, IT) Almond,
Maize ng/g
Artificially (Almond), naturally (maize)
VIS, FLUO, Camera
(integrated) M16
Rikilt (Wageningen, NL)
Almond, Maize
ng/g
Artificially (Almond), naturally (maize)
VIS, FLUO M18
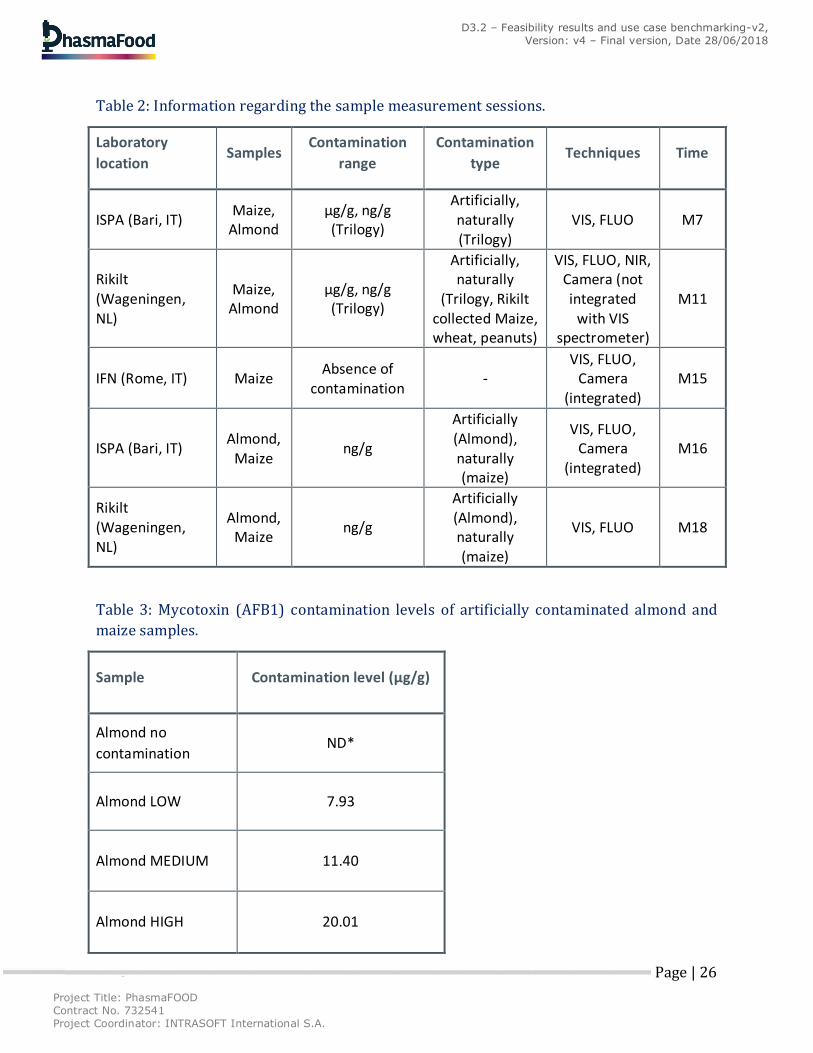
Table 3: Mycotoxin (AFB1) contamination levels of artificially contaminated almond and
maize samples.
Sample Contamination level (μg/g)
Almond no
contamination ND*
Almond LOW 7.93
Almond MEDIUM 11.40
Almond HIGH 20.01
Project Title: PhasmaFOOD Contract No. 732541 Project Coordinator: INTRASOFT International S.A.
Page | 27
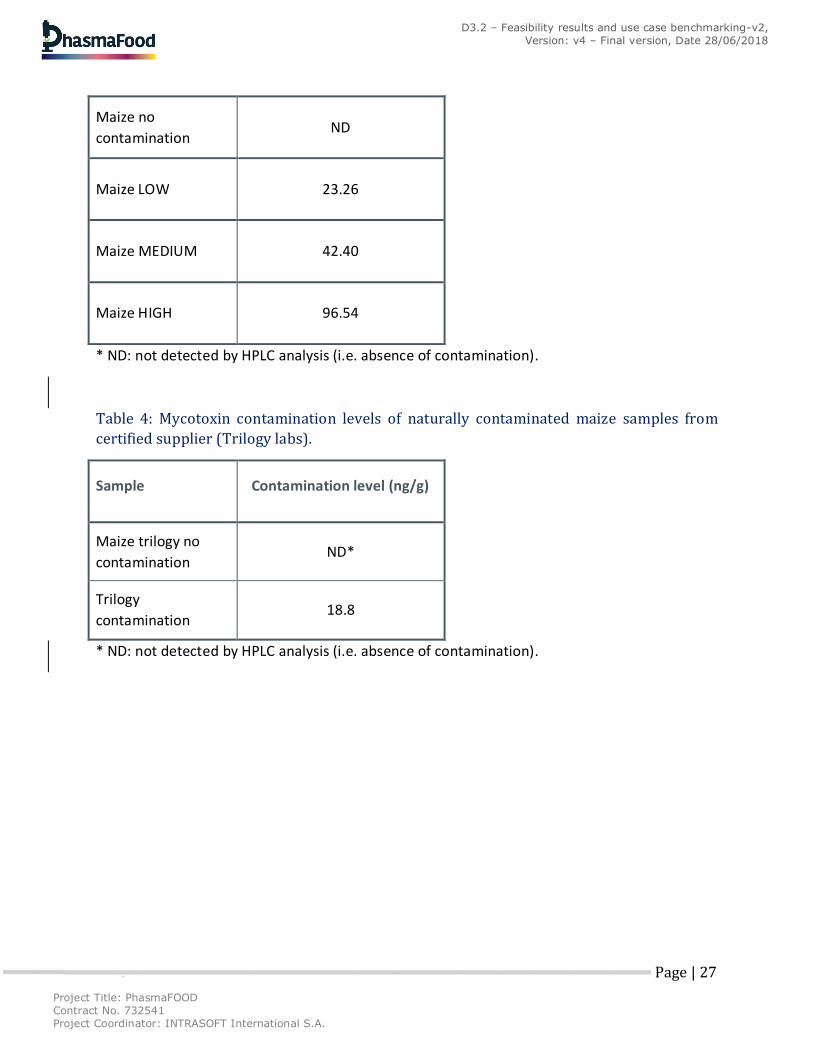
D3.2 – Feasibility results and use case benchmarking-v2, Version: v4 – Final version, Date 28/06/2018
Maize no
contamination ND
Maize LOW 23.26
Maize MEDIUM 42.40
Maize HIGH 96.54
* ND: not detected by HPLC analysis (i.e. absence of contamination).
Table 4: Mycotoxin contamination levels of naturally contaminated maize samples from
certified supplier (Trilogy labs).
Sample Contamination level (ng/g)
Maize trilogy no
contamination ND*
Trilogy
contamination 18.8
* ND: not detected by HPLC analysis (i.e. absence of contamination).
Project Title: PhasmaFOOD Contract No. 732541 Project Coordinator: INTRASOFT International S.A.
Page | 28
D3.2 – Feasibility results and use case benchmarking-v2, Version: v4 – Final version, Date 28/06/2018
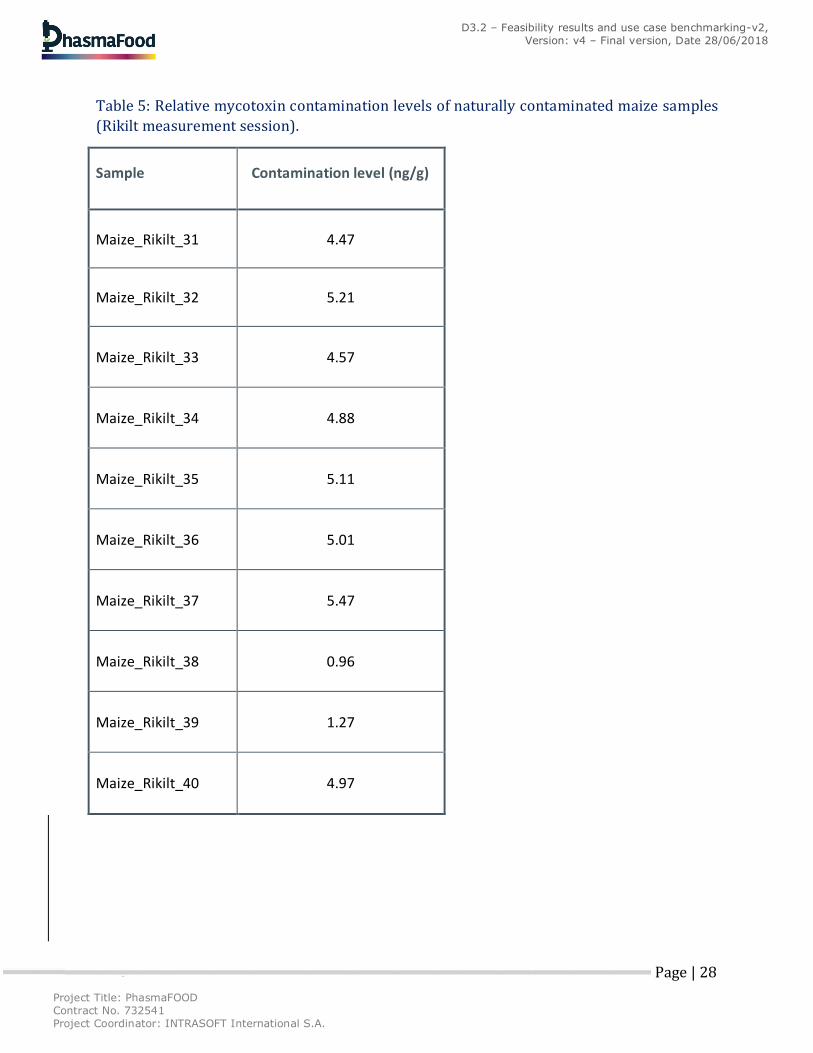
Table 5: Relative mycotoxin contamination levels of naturally contaminated maize samples
(Rikilt measurement session).
Sample Contamination level (ng/g)
Maize_Rikilt_31 4.47
Maize_Rikilt_32 5.21
Maize_Rikilt_33 4.57
Maize_Rikilt_34 4.88
Maize_Rikilt_35 5.11
Maize_Rikilt_36 5.01
Maize_Rikilt_37 5.47
Maize_Rikilt_38 0.96
Maize_Rikilt_39 1.27
Maize_Rikilt_40 4.97
Project Title: PhasmaFOOD Contract No. 732541 Project Coordinator: INTRASOFT International S.A.
Page | 29
D3.2 – Feasibility results and use case benchmarking-v2, Version: v4 – Final version, Date 28/06/2018
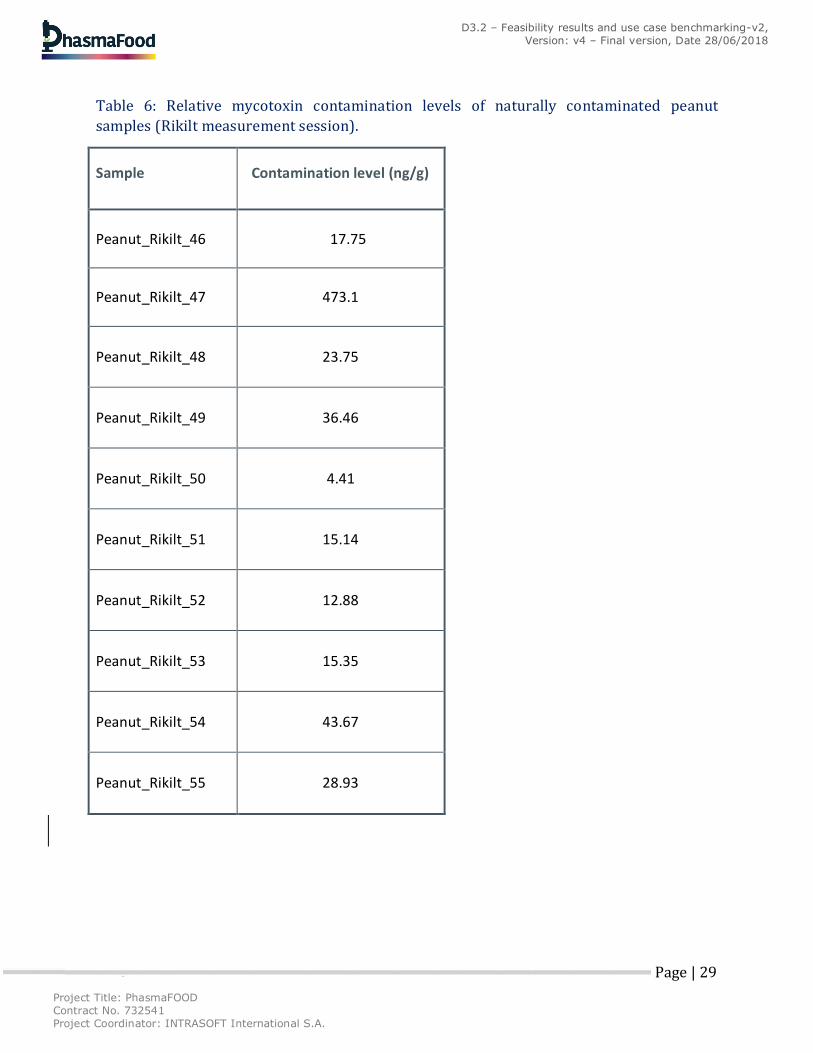
Table 6: Relative mycotoxin contamination levels of naturally contaminated peanut
samples (Rikilt measurement session).
Sample Contamination level (ng/g)
Peanut_Rikilt_46 17.75
Peanut_Rikilt_47 473.1
Peanut_Rikilt_48 23.75
Peanut_Rikilt_49 36.46
Peanut_Rikilt_50 4.41
Peanut_Rikilt_51 15.14
Peanut_Rikilt_52 12.88
Peanut_Rikilt_53 15.35
Peanut_Rikilt_54 43.67
Peanut_Rikilt_55 28.93
Project Title: PhasmaFOOD Contract No. 732541 Project Coordinator: INTRASOFT International S.A.
Page | 30
D3.2 – Feasibility results and use case benchmarking-v2, Version: v4 – Final version, Date 28/06/2018
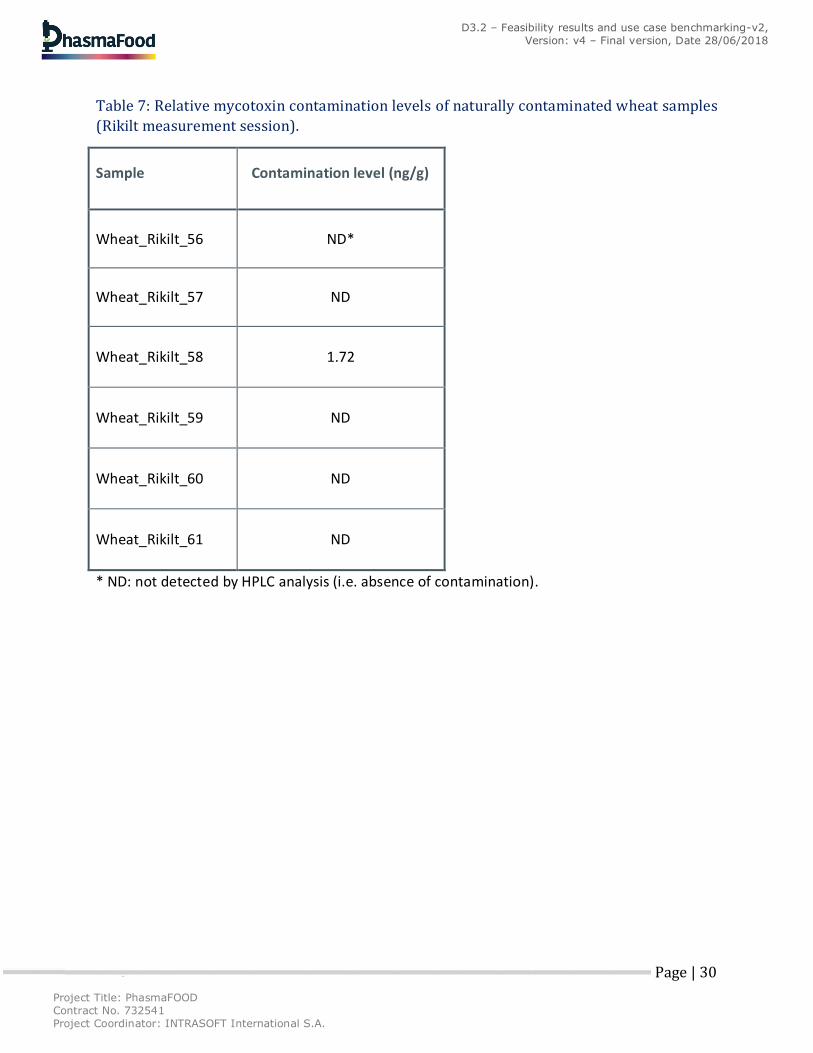
Table 7: Relative mycotoxin contamination levels of naturally contaminated wheat samples
(Rikilt measurement session).
Sample Contamination level (ng/g)
Wheat_Rikilt_56 ND*
Wheat_Rikilt_57 ND
Wheat_Rikilt_58 1.72
Wheat_Rikilt_59 ND
Wheat_Rikilt_60 ND
Wheat_Rikilt_61 ND
* ND: not detected by HPLC analysis (i.e. absence of contamination).
Project Title: PhasmaFOOD Contract No. 732541 Project Coordinator: INTRASOFT International S.A.
Page | 31
D3.2 – Feasibility results and use case benchmarking-v2, Version: v4 – Final version, Date 28/06/2018
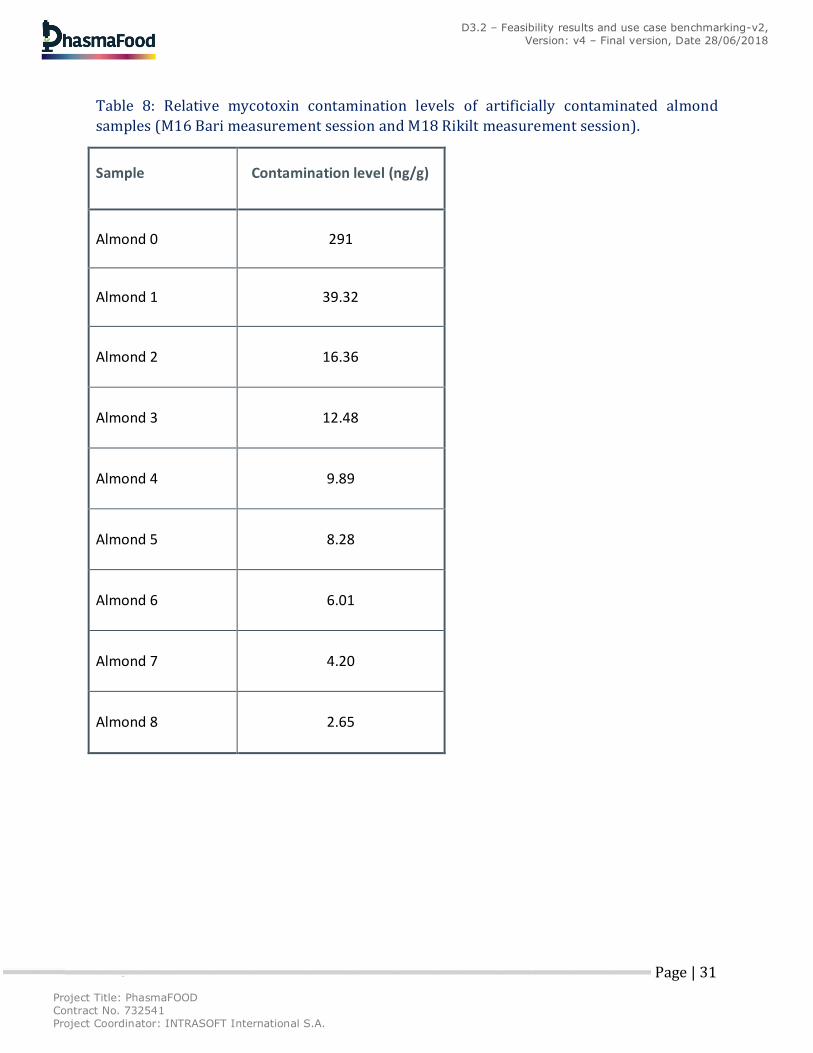
Table 8: Relative mycotoxin contamination levels of artificially contaminated almond
samples (M16 Bari measurement session and M18 Rikilt measurement session).
Sample Contamination level (ng/g)
Almond 0 291
Almond 1 39.32
Almond 2 16.36
Almond 3 12.48
Almond 4 9.89
Almond 5 8.28
Almond 6 6.01
Almond 7 4.20
Almond 8 2.65
Project Title: PhasmaFOOD Contract No. 732541 Project Coordinator: INTRASOFT International S.A.
Page | 32
D3.2 – Feasibility results and use case benchmarking-v2, Version: v4 – Final version, Date 28/06/2018
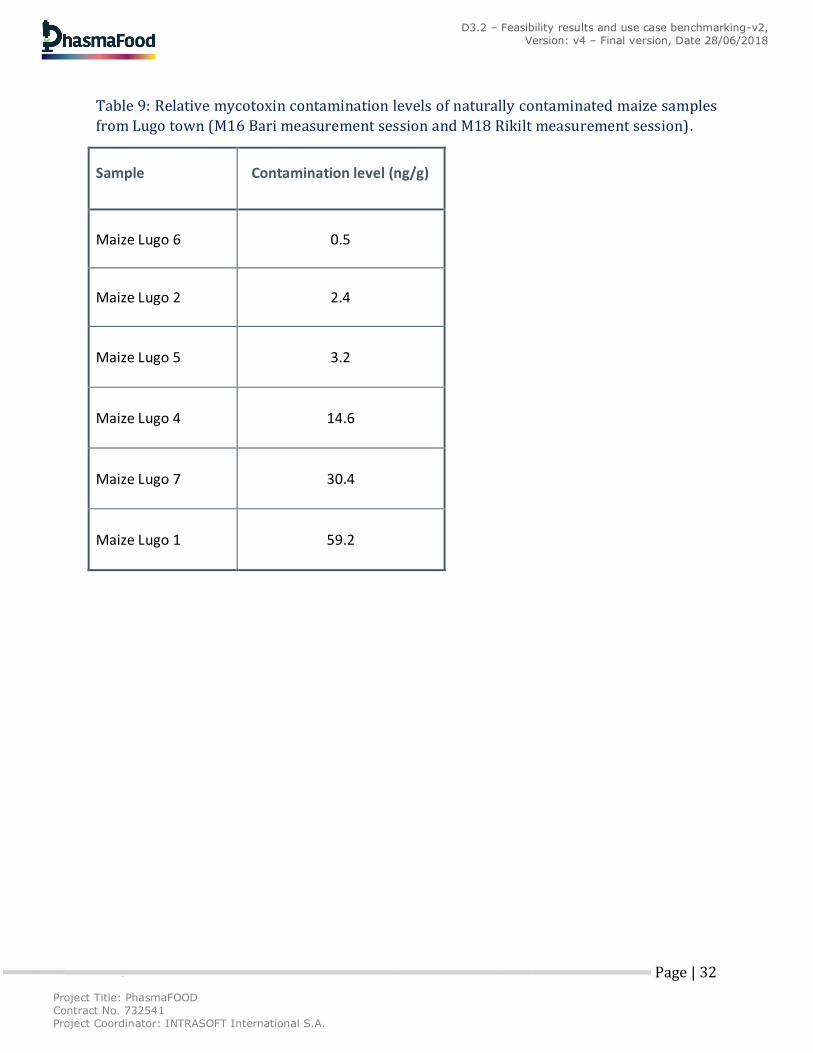
Table 9: Relative mycotoxin contamination levels of naturally contaminated maize samples
from Lugo town (M16 Bari measurement session and M18 Rikilt measurement session).
Sample Contamination level (ng/g)
Maize Lugo 6 0.5
Maize Lugo 2 2.4
Maize Lugo 5 3.2
Maize Lugo 4 14.6
Maize Lugo 7 30.4
Maize Lugo 1 59.2
Project Title: PhasmaFOOD Contract No. 732541 Project Coordinator: INTRASOFT International S.A.
Page | 33
D3.2 – Feasibility results and use case benchmarking-v2, Version: v4 – Final version, Date 28/06/2018
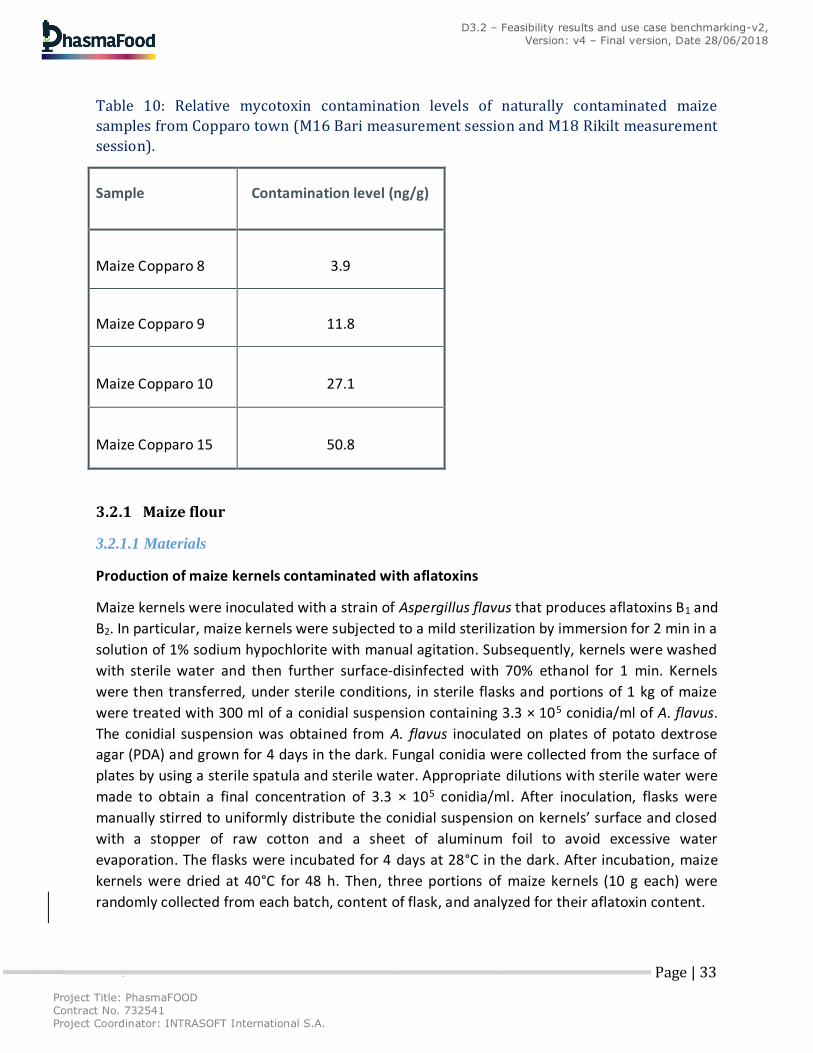
Table 10: Relative mycotoxin contamination levels of naturally contaminated maize
samples from Copparo town (M16 Bari measurement session and M18 Rikilt measurement
session).
Sample Contamination level (ng/g)
Maize Copparo 8 3.9
Maize Copparo 9 11.8
Maize Copparo 10 27.1
Maize Copparo 15 50.8
3.2.1 Maize flour
3.2.1.1 Materials
Production of maize kernels contaminated with aflatoxins
Maize kernels were inoculated with a strain of Aspergillus flavus that produces aflatoxins B1 and
B2. In particular, maize kernels were subjected to a mild sterilization by immersion for 2 min in a
solution of 1% sodium hypochlorite with manual agitation. Subsequently, kernels were washed
with sterile water and then further surface-disinfected with 70% ethanol for 1 min. Kernels
were then transferred, under sterile conditions, in sterile flasks and portions of 1 kg of maize
were treated with 300 ml of a conidial suspension containing 3.3 × 10⁵ conidia/ml of A. flavus.
The conidial suspension was obtained from A. flavus inoculated on plates of potato dextrose
agar (PDA) and grown for 4 days in the dark. Fungal conidia were collected from the surface of
plates by using a sterile spatula and sterile water. Appropriate dilutions with sterile water were
made to obtain a final concentration of 3.3 × 10⁵ conidia/ml. After inoculation, flasks were
manually stirred to uniformly distribute the conidial suspension on kernels’ surface and closed
with a stopper of raw cotton and a sheet of aluminum foil to avoid excessive water
evaporation. The flasks were incubated for 4 days at 28°C in the dark. After incubation, maize
kernels were dried at 40°C for 48 h. Then, three portions of maize kernels (10 g each) were
randomly collected from each batch, content of flask, and analyzed for their aflatoxin content.
Project Title: PhasmaFOOD Contract No. 732541 Project Coordinator: INTRASOFT International S.A.
Page | 34
D3.2 – Feasibility results and use case benchmarking-v2, Version: v4 – Final version, Date 28/06/2018
Determination of AFB1 and AFB2
Five grams of dry ground sample were extracted with 50 ml of extraction mixture of
acetone/water (85:15 v/v) by sonication for 30 min. The extract was filtered through a filter
paper and 0.1 ml was diluted with 6 ml of MeCN/H2O (30:70 v/v), stirred, filtered through a
0.45 μm PTFE and 0.1 ml was injected into the HPLC system (corresponding to 0.17 mg sample).
HPLC-FLD equipment and conditions
The HPLC-FLD analyses were performed with an Agilent 1260 consisting of a binary pump, an
autosampler with a 100 μl loop, a fluorescence detector fixed at 365 nm λex and 435 nm λem
and a thermostatic oven set at 30 °C. The column used was a 150 mm × 4.6 mm i.d., 3 μm, Luna
PFP (2) (pentafluorophenyl-propyl) with a 3 mm i.d., 0.45 μm pore size guard. The
chromatographic separation was performed in the isocratic condition using a mixture of
MeCN/H2O (30:70 v/v) at flow rate of 0.8 mL/min. A photochemical postcolumn derivatization
UVE was used to enhance the fluorescence of AFB1 and AFB2.
Granularity separation
When the separation was introduced, maize particles of different granularity dimensions
different granularities were separated with a sieve including different meshes (2 mm / 1 mm /
500 μm and 300 μm) and then considered for measurements separately. In subsequent
analysis, the spectra related to samples with different dimensions were analyzed separately. In
our notation, 1 mm refers to grained particles with dimensions > 500 μm but <1000 μm.
Certified reference material
Naturally contaminated (aflatoxin B1 18.8 µg/kg aflatoxin B2 0.9 µg/kg aflatoxin G1 2.4 µg/kg
aflatoxin G2 ND (µg/kg) deossinivalenol 2.6 mg/kg ochratoxin A 4.0 µg/kg T-2 Toxin 263.7
µg/kg HT-2 Toxin 523.3 µg/kg zearalenon 352.0 µg/kg fumonisin B1 28.3 mg/kg fumonisin B2
7.1 mg/kg fumonisin B3 1.7 mg/kg) and non-contaminated control maize flour samples
purchased from Trilogy Analytical laboratory were also used for feasibility tests.
Naturally contaminated maize
Naturally contaminated maize was received from different suppliers and at different
contamination levels (ranging from 0.5 to 87.3 ng/g), the contamination was quantified and the
maize was grained for spectral acquisition (see Tables 9 and 10).
Project Title: PhasmaFOOD Contract No. 732541 Project Coordinator: INTRASOFT International S.A.
Page | 35
D3.2 – Feasibility results and use case benchmarking-v2, Version: v4 – Final version, Date 28/06/2018
3.2.1.2 Experimental design
The maize flour sample measurement set-up consists of a 100 mm or 60 mm diameter Petri
dish in which the maize flour is poured. Measurements at five different spatial positions over
the sample have been performed, and in each position five replicates have been acquired and
averaged. A preprocessing procedure including averaging and normalization steps was applied
during data processing. VIS spectrometer is positioned on top of the Petri dish and light is
shielded by a dark cover. Fluorescence measurements and VIS spectroscopy measurements
have been performed with this setting.
For the first set of measurements, the analyzed maize flour samples consisted of three different
levels of Aflatoxin B1 contamination (No cont= no aflatoxin contamination, Low cont= 23.3 μg/g,
High cont=96.5 μg/g) obtained by inoculation with the fungi A. flavus. Preliminary
measurements have also been performed on maize flour reference material from Trilogy Lab
contained in the Petri dish (18.8 μg/kg B1 aflatoxin). Also in this case, measurements at
different positions have been acquired. Together with these artificially contaminated samples,
measurements on naturally contaminated samples have been performed both in Rikilt lab
measurement session and in Bari (see Tables 3-10 for sample names and contamination levels).
During the measurement session in M11 at Rikilt, images have been acquired for all the
samples measured in that session. Also, during the measurement session in M16 in Bari, images
have been acquired by the camera for each measured sample.
3.2.1.3 Implementation of sensors (food science laboratory)
Fluorescence measurements and VIS spectroscopy measurements have been performed
according to the SOP described in section 3.1.2. With regard to the fluorescence
measurements, the integration time has been set at 100 or 200 ms, while a plastic black
reference has been used as a reference. In the case of VIS spectroscopy, the integration time
has been set at 250 μs, whereas a white paper has been used as white reference material.
Images have been acquired by using the Ximea Camera, according to the SOP described in
section 3.1.3, for all the measured samples.
3.2.1.4 Other experimental procedures
In our preliminary experiments, samples have been also characterized with standard techniques
like high-performance liquid chromatography (HPLC) for validation purposes.
Project Title: PhasmaFOOD Contract No. 732541 Project Coordinator: INTRASOFT International S.A.
Page | 36
D3.2 – Feasibility results and use case benchmarking-v2, Version: v4 – Final version, Date 28/06/2018
3.2.2 Milk powder
Preliminary tests have not been yet performed but will be performed in the course of WP3. The
expected measurement setup will be similar to the ones used in maize and almond flour.
3.2.3 Paprika powder
Preliminary tests have not been yet performed but will be performed in the course of WP3. The
expected measurement setup will be similar to the ones used in maize and almond flour.
3.2.4 Tree nuts
3.2.4.1 Materials
Production of almonds contaminated with aflatoxins - First set: highly contaminated samples
(μg/g, i.e. ppm)
Shelled almonds (cs. Genco) were inoculated with a strain of Aspergillus flavus that produces
aflatoxins B1 and B2. In particular the almonds were subjected to a mild sterilization by
immersion for 2 min in a solution of 1% sodium hypochlorite with manual agitation.
Subsequently, almonds were washed with sterile water and then further surface-disinfected
with 70% ethanol for 1 min. Almonds were then transferred, under sterile conditions, in sterile
flasks and aliquots of 1 kg of almonds was treated with 300 ml of a conidial suspension
containing 3.3 × 10⁵ conidia/mL of A. flavus. The conidial suspension was obtained from A.
flavus inoculated on plates of potato dextrose agar (PDA) and grown for 4 days in the dark.
Fungal conidia were collected from the surface of plates by using a sterile spatula and sterile
water. Appropriate dilutions with sterile water were made to obtain a final concentration of 3.3
× 105 conidia/ml. After inoculation, flasks were manually stirred to uniformly distribute the
conidial suspension on almond’s surface and closed with a stopper of raw cotton and a sheet of
aluminum foil to avoid excessive water evaporation. The flasks were incubated for 4 days at 28
°C in the dark. After incubation, almonds were dried at 40 °C for 48 h. Then three aliquots of
almonds (10 g each) were randomly collected from each batch, content of flask, and analyzed
for their aflatoxin content (see maize preparation).
Production of artificially contaminated almond samples - Second set: low contaminated
samples (ng/g, i.e. ppb)
For the second set of samples, contaminated sample #0 (291 ng / g, see Table 8) was prepared by mixing a culture of almonds contaminated with AFB1 (see paragraph above for preparation) and white almonds.
Project Title: PhasmaFOOD Contract No. 732541 Project Coordinator: INTRASOFT International S.A.
Page | 37
D3.2 – Feasibility results and use case benchmarking-v2, Version: v4 – Final version, Date 28/06/2018
In particular, 3.12 g of minced almonds contaminated with AFB1 at a level of 35.5 μg / g were added to 496.87 g of ground white almonds. The almonds were homogenized by making slurry i.e. homogenizing the solid sample with water with a 1: 2 ratio (solid: liquid). In particular, one liter of water was added to 500 g of solid sample (3.12 g of contaminated almonds + 496.87 g of white almonds). The sample was homogenized with a T 25 digital ULTRA-TURRAX® for 5 min. Subsequently, the sample was frozen, lyophilized and analyzed using HPLC.
Samples # 1, # 2, # 3, # 4, # 5, # 6, # 7 and # 8 were prepared by making slurry by adding appropriate amounts of sample #0 to appropriate amounts of white almonds, exactly like sample #0 preparation. In particular, 80 ml of water were added to 80 g of each sample. The sample was homogenized as described previously, and was then frozen, lyophilized and analyzed using HPLC.
The levels of AFB1 contamination of samples # 1 through # 8 are presented in Table 8.
3.2.4.2 Experimental design
The experimental design for tree nuts is similar as for the maize flour with some minor
modifications. For almond, in the first set of measurements, four different levels of
contamination have been considered: no contamination, low contamination, medium
contamination and high contamination corresponding to 0, 20, 11, 4 and 7.9 μg/g, respectively.
In this case, contamination has also been obtained by inoculation with A. flavus. Grained
almond flour has been separated according to particles’ dimensions with the help of
mechanical sieves with sizes >2 mm / 2 mm / 1 mm and 500 μm. Depending on contamination
level, not all dimensions are available (contamination caused damage in the texture of the
sample matrix).
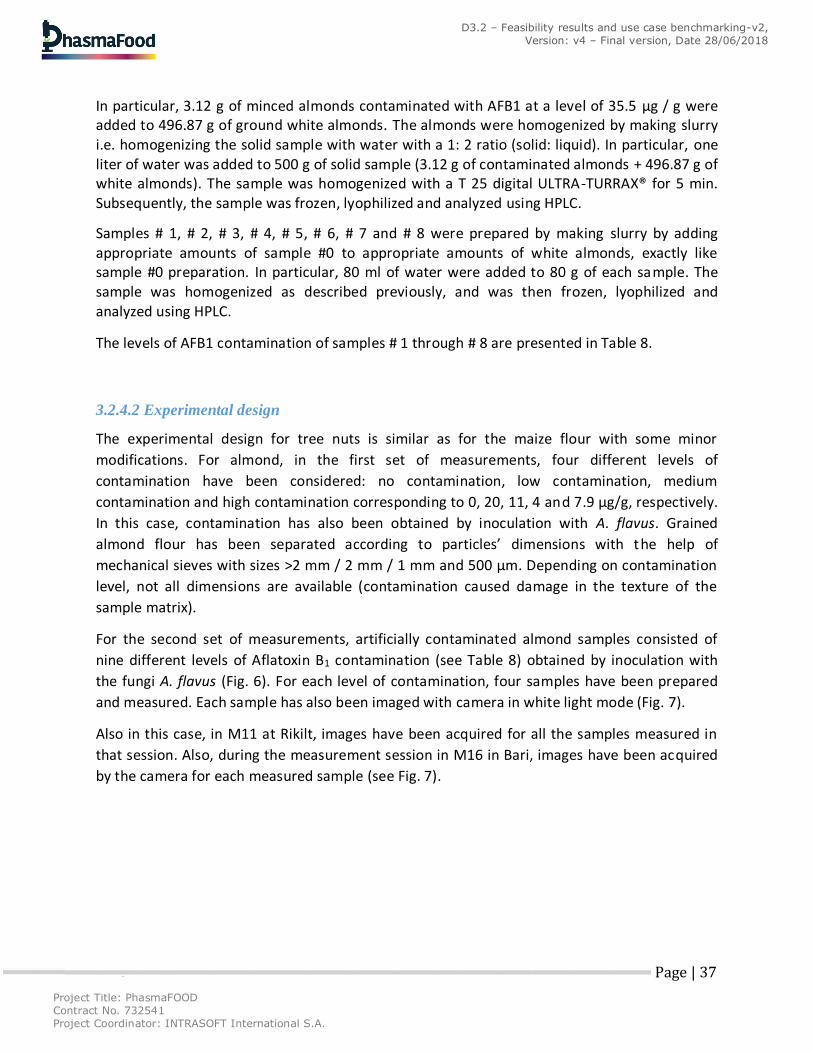
For the second set of measurements, artificially contaminated almond samples consisted of
nine different levels of Aflatoxin B1 contamination (see Table 8) obtained by inoculation with
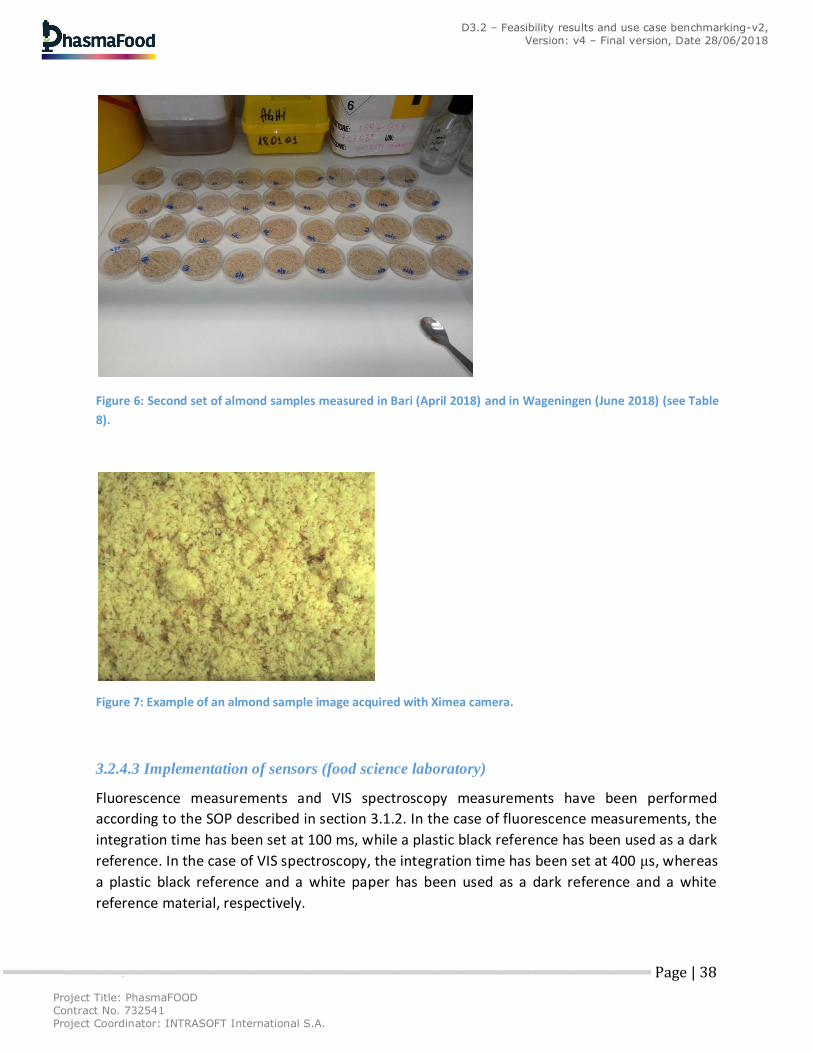
the fungi A. flavus (Fig. 6). For each level of contamination, four samples have been prepared
and measured. Each sample has also been imaged with camera in white light mode (Fig. 7).
Also in this case, in M11 at Rikilt, images have been acquired for all the samples measured in
that session. Also, during the measurement session in M16 in Bari, images have been acquired
by the camera for each measured sample (see Fig. 7).
Project Title: PhasmaFOOD Contract No. 732541 Project Coordinator: INTRASOFT International S.A.
Page | 38
D3.2 – Feasibility results and use case benchmarking-v2, Version: v4 – Final version, Date 28/06/2018
Figure 6: Second set of almond samples measured in Bari (April 2018) and in Wageningen (June 2018) (see Table
8).
Figure 7: Example of an almond sample image acquired with Ximea camera.
3.2.4.3 Implementation of sensors (food science laboratory)
Fluorescence measurements and VIS spectroscopy measurements have been performed
according to the SOP described in section 3.1.2. In the case of fluorescence measurements, the
integration time has been set at 100 ms, while a plastic black reference has been used as a dark
reference. In the case of VIS spectroscopy, the integration time has been set at 400 μs, whereas
a plastic black reference and a white paper has been used as a dark reference and a white
reference material, respectively.
Project Title: PhasmaFOOD Contract No. 732541 Project Coordinator: INTRASOFT International S.A.
Page | 39
D3.2 – Feasibility results and use case benchmarking-v2, Version: v4 – Final version, Date 28/06/2018
3.2.4.4 Other experimental procedures
Determination of AFB1 and AFB2
Five grams of dry ground sample were extracted with 50 ml of extraction mixture of
acetone/water (85:15 v/v) by sonication for 30 min. The extract was filtered through a filter
paper and 0.1 ml was diluted with 6 ml of MeCN/H2O (30:70 v/v), stirred, filtered through a
0.45 μm PTFE and 0.1 ml was injected into the HPLC system (corresponding to 0.17 mg sample).
HPLC-FLD equipment and conditions
The HPLC-FLD analyses were performed with an Agilent 1260 consisting of a binary pump, an
autosampler with a 100 μl loop, a fluorescence detector fixed at 365 nm λex and 435 nm λem
and a thermostatic oven set at 30 °C. The column used was a 150 mm × 4.6 mm i.d., 3 μm, Luna
PFP (2) (pentafluorophenyl-propyl) with a 3 mm i.d., 0.45 μm pore size guard. The
chromatographic separation was performed in the isocratic condition using a mixture of
MeCN/H2O (30:70 v/v) at flow rate of 0.8 mL/min. A photochemical postcolumn derivatization
UVE was used to enhance the fluorescence of AFB1 and AFB2.
3.3 Detection of food spoilage and shelf-life prediction
3.3.1 Meat
3.3.1.1 Experimental design
The meat product evaluated under this sub-use case was minced pork, stored aerobically or in
modified atmosphere packaging (MAP) and at different temperatures. More specifically,
portions (100 g) of minced pork were stored under isothermal (4, 8 and 12°C) and dynamic
temperature (periodic temperature changes from 4 to 12°C) conditions, aerobically or under
MAP (80% O2-20% CO2) conditions for a maximum time period of 14 and 15 days, respectively.
The 100-g minced pork portions were shaped in patties, and duplicate patties were placed in
Styrofoam trays prior to storage under the aforementioned conditions in high-precision
(±0.5°C) programmable incubators (MIR-153, Sanyo Electric Co., Osaka, Japan). At regular time
intervals during storage, depending on the applied storage conditions (i.e. temperature and
atmosphere), duplicate minced pork patties were subjected to the following
analyses/measurements:
o Microbiological analyses, pH measurements and sensory evaluation (all samples)
o Multispectral image (MSI) acquisition (all samples)
o Fourier transform infrared (FTIR) spectroscopy measurements (all samples)
Project Title: PhasmaFOOD Contract No. 732541 Project Coordinator: INTRASOFT International S.A.
Page | 40
D3.2 – Feasibility results and use case benchmarking-v2, Version: v4 – Final version, Date 28/06/2018
o NIR spectroscopy measurements (NIR spectrometer developed by IPMS)
(samples stored under MAP)
o VIS (all samples) and FLUO (samples stored under MAP) spectroscopy
measurements (VIS spectrometer developed by CNR)
o Image acquisition using the CMOS camera (samples stored under MAP)
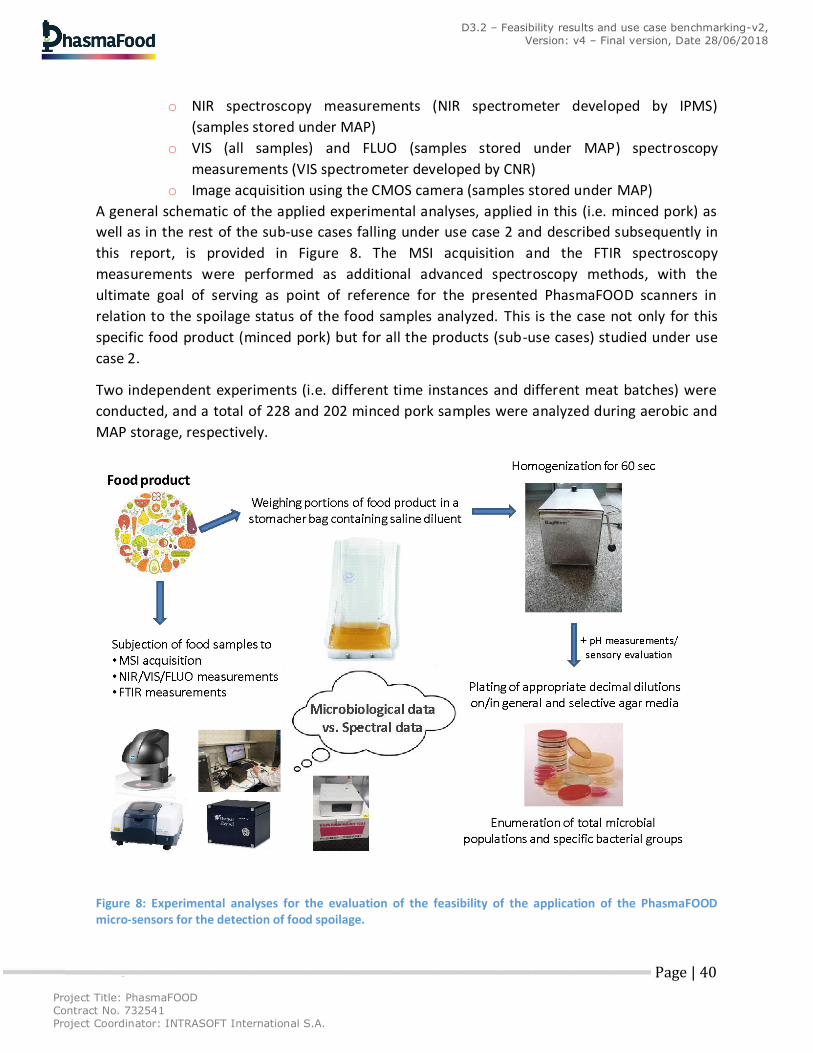
A general schematic of the applied experimental analyses, applied in this (i.e. minced pork) as
well as in the rest of the sub-use cases falling under use case 2 and described subsequently in
this report, is provided in Figure 8. The MSI acquisition and the FTIR spectroscopy
measurements were performed as additional advanced spectroscopy methods, with the
ultimate goal of serving as point of reference for the presented PhasmaFOOD scanners in
relation to the spoilage status of the food samples analyzed. This is the case not only for this
specific food product (minced pork) but for all the products (sub-use cases) studied under use
case 2.
Two independent experiments (i.e. different time instances and different meat batches) were
conducted, and a total of 228 and 202 minced pork samples were analyzed during aerobic and
MAP storage, respectively.
Figure 8: Experimental analyses for the evaluation of the feasibility of the application of the PhasmaFOOD micro-sensors for the detection of food spoilage.
Project Title: PhasmaFOOD Contract No. 732541 Project Coordinator: INTRASOFT International S.A.
Page | 41
D3.2 – Feasibility results and use case benchmarking-v2, Version: v4 – Final version, Date 28/06/2018
3.3.1.2 Implementation of sensors (food science laboratory)
The NIR and VIS spectrometers evaluated in the PhasmaFOOD project were used in the minced
meat spoilage experiments following the standard operating procedure (SOP) described in
D3.1. The acquired NIR measurements were saved using Option 2 as described in section 3.1.1.
With reference to the VIS spectrometer and its use in the fluorescence modality, if saturation in
fluorescence signal is observed, then reduction of integration time to 100000 μs may be
required.
3.3.1.3 Other experimental procedures
Microbiological analyses
Twenty five grams from each minced pork patty were transferred aseptically to a 400-ml sterile
stomacher bag (Seward Medical, London, United Kingdom) containing 225 ml of sterilized
Ringer’s solution (Lab M Limited, Lancashire, UK), and were homogenized for 60 sec (Lab
Blender 400, Seward Medical). For the enumeration of total mesophiles, appropriate serial
decimal dilutions in Ringer’s solution were surface plated on tryptic glucose yeast agar (Biolife,
Milan, Italy), and colonies were counted after incubation of plates at 25°C for 72 h.
Furthermore, at some of the sampling intervals, the meat samples also were tested for the
determination of the populations of Pseudomonas spp., Brochothrix thermosphacta, lactic acid
bacteria (LAB), bacteria of the family Enterobacteriaceae and molds and yeasts. Pseudomonas
spp. were enumerated by surface plating on Pseudomonas agar base supplemented with CFC
(Cephalothin, Fucidin, Cetrimide) Selective Supplement (Lab M Limited) after incubation of
plates at 25°C for 48 h. Br. thermosphacta was enumerated by surface plating on streptomycin-
thallous acetate-actidione (STAA) agar (Biolife) after incubation of plates at 25°C for 48 h. LAB
were enumerated by pour plating in de Man Rogosa and Sharpe (MRS) agar (Biolife) after
incubation of plates at 30°C for 72 h. Bacteria belonging to the Enterobacteriaceae family were
enumerated by pour plating in violet red bile glucose (VRBG) agar (Biolife) after incubation of
plates 37°C for 24 h. Finally, molds and yeasts were enumerated by surface plating on Rose
Bengal Chloramphenicol (RBC) agar (Lab M Limited) after incubation of plates at 25°C for a total
of 5 days. The obtained microbiological data were converted to log (colony forming units) per
gram of minced meat (log CFU/g). Upon completion of the microbiological analyses, the pH
values of the meat samples also were measured using a digital pH meter (RL150, Russell pH,
Cork, Ireland) with a glass electrode (Metrohm AG, Herisau, Switzerland). Finally, each meat
sample was evaluated with regard to its sensory attributes of appearance and odor. Specifically,
each attribute was scored on a three-point hedonic scale where: 1=fresh; 2=marginal; and
3=unacceptable. A score of 1.5 was used to characterize a sample as semi-fresh and was
regarded as the first indication of change from that of typical fresh meat. Scores above 2
rendered the product spoiled and were regarded as indicative of the end of the product’s shelf-
life.
Project Title: PhasmaFOOD Contract No. 732541 Project Coordinator: INTRASOFT International S.A.
Page | 42
D3.2 – Feasibility results and use case benchmarking-v2, Version: v4 – Final version, Date 28/06/2018
Multispectral image (MSI) acquisition
Images from each minced meat sample were acquired using the VideometerLab system,
originally developed by the Technical University of Denmark [31] and commercialized by
“Videometer A/S” (http://www.videometer.com). This instrument, which has been described in
detail elsewhere [26, 32], acquires multispectral images in 18 different, non-uniformly
distributed wavelengths ranging from UV (405 nm) to short wave NIR (970 nm). Prior to image
acquisition, the system was subjected to a light set up procedure known as “autolight” and
calibrated radiometrically and geometrically as previously described [26]. Portions from each
minced meat sample were placed in a Petri dish which was then was placed (without the plate’s
lid) inside an Ulbricht sphere in which the camera is top-mounted, and the corresponding
multispectral image of the product’s surface was taken.
FTIR spectroscopy
FTIR spectral data were collected using a ZnSe 45° HATR (Horizontal Attenuated Total
Reflectance) crystal (PIKE Technologies, Madison, Wisconsin, United States), and an FT/IR-6200
JASCO spectrometer (Jasco Corp., Tokyo, Japan) equipped with a standard sample chamber, a
TGS detector and a Ge/KBr beamsplitter. A small portion from each minced meat sample was
transferred in the crystal plate and covered with a small piece of aluminum foil, and then
pressed with a gripper in order for the best possible contact with the crystal to be achieved.
The crystal used has a refractive index of 2.4 and a depth of penetration of 2.0 μm at 1000 cm-1.
Using the Spectra Manager™ CFR software version 2 (Jasco Corp.), spectra were collected over
the wavenumber range of 4000 to 400 cm-1, by accumulating 100 scans with a resolution of 4
cm-1 and a total integration time of 2 min. Prior to the measurements of the tested samples,
reference spectra were acquired using the cleaned blank (no added food sample) crystal. After
each measurement, the crystal’s surface was cleaned, first with detergent and distilled water
and then with analytical grade acetone, and dried using lint-free tissue. The FTIR spectra that
were ultimately used in further analyses were in the approximate wavenumber range of 3100
to 2700 and 1800 to 900 cm-1.
3.3.2 Fish
3.3.2.1 Experimental design
The experimental procedure designed and performed under this section aimed at the
monitoring and evaluation of the spoilage of gilthead sea bream (Sparus aurata) during aerobic
or MAP (30% O2, 40% CO2, 30% N2) storage under different isothermal conditions. For this
purpose, aquacultured whole ungutted fish, within two days from harvest, were packaged in
Styrofoam trays wrapped by cling film (aerobic storage) or placed in plastic bags (MAP storage)
Project Title: PhasmaFOOD Contract No. 732541 Project Coordinator: INTRASOFT International S.A.
Page | 43
D3.2 – Feasibility results and use case benchmarking-v2, Version: v4 – Final version, Date 28/06/2018
and stored at 0, 4 and 8°C in high-precision (±0.5°C) programmable incubators (MIR-153, Sanyo
Electric Co.) for a maximum time period of 11 and 19 days, respectively. At regular time
intervals during storage, depending on the applied storage conditions (i.e. temperature and
atmosphere), duplicate fish samples (originating from different fish) were subjected to the
following analyses/measurements:
o Microbiological analyses, pH measurements and sensory evaluation (all samples)
o MSI acquisition (all samples)
o FTIR spectroscopy measurements (all samples)
o NIR spectroscopy measurements (all samples)
o VIS and FLUO spectroscopy measurements (samples stored under MAP)
The applied experimental analyses were performed according to the general schematic
illustrated in Figure 8. After analysis of spectral data acquired on both the skin and the flesh
sides of the fish samples (as described in detail in D3.1 for aerobic storage of fish), it was
decided that data corresponding only to fish skin will be evaluated during subsequent
experiments under MAP, since only this side of the samples appears to have considerable
correlation with the microbiological spoilage of whole ungutted fish.
Two independent experiments (i.e. different time instances and different fish batches) for each
storage condition were conducted, and a total of 158 and 183 fish were analyzed during aerobic
and MAP storage, respectively.
3.3.2.2 Implementation of sensors (food science laboratory)
The NIR and VIS spectrometers evaluated in the PhasmaFOOD project were used in the fish
spoilage experiments following the SOPs described in D3.1. The acquired NIR measurements
were saved using Option 2 as described in section 3.1.1. With particular reference to the VIS
spectrometer and the measurements acquired in fluorescence mode, in order to avoid to the
greatest possible extent signal saturation issues, the integration time used was 100000 μs.
3.3.2.3 Other experimental procedures
Microbiological analyses
Ten grams from each fish were transferred aseptically to a 400-ml sterile stomacher bag
(Seward Medical) containing 90 ml of sterilized peptone saline diluent (0.1% w/v peptone,
0.85% w/v sodium chloride), and were homogenized for 60 sec. For the enumeration of total
mesophiles, appropriate serial decimal dilutions in peptone saline diluent were surface plated
on tryptic glucose yeast agar, and colonies were counted after incubation of plates at 30°C for
72 h. Furthermore, at some of the sampling intervals, the fish samples also were tested for the
Project Title: PhasmaFOOD Contract No. 732541 Project Coordinator: INTRASOFT International S.A.
Page | 44
D3.2 – Feasibility results and use case benchmarking-v2, Version: v4 – Final version, Date 28/06/2018
determination of the populations of Pseudomonas spp., Br. thermosphacta, LAB, bacteria of the
family Enterobacteriaceae and molds and yeasts. Pseudomonas spp. were enumerated by
surface plating on Pseudomonas agar base supplemented with CFC Selective Supplement after
incubation of plates at 25°C for 48 h. Br. thermosphacta was enumerated by surface plating on
STAA agar after incubation of plates at 25°C 48 h. LAB were enumerated by pour plating in MRS
agar after incubation of plates at 30°C for 5 days. Bacteria of the family Enterobacteriaceae
were enumerated by pour plating in VRBG agar after incubation of plates at 37°C for 24 h.
Finally, molds and yeasts were enumerated by surface plating on RBC agar after incubation of
plates at 25°C for 5 days. The obtained microbiological data were converted to log CFU/g. Upon
completion of the microbiological analyses, the pH values of the fish samples also were
measured using a digital pH meter with a glass electrode. Finally, each fish sample was
evaluated with regard to its sensory attributes of appearance and odor. Specifically, each
attribute was scored on a three-point hedonic scale where: 1=fresh; 2=marginal; and
3=unacceptable. A score of 1.5 was used to characterize a sample as semi-fresh and was
regarded as the first indication of change from that of typical fresh fish (i.e. clear eyes, odor
slightly changed, but still acceptable by the consumer). Scores above 2 rendered the product
spoiled and were regarded as indicative of the end of the product’s shelf-life.
Multispectral image (MSI) acquisition and FTIR spectroscopy
Multispectral imaging and FTIR spectral data from each fish sample were collected by using a
cut fish portion, according to the procedures described previously (section 3.3.1.3).
3.3.3 Fruit and vegetables
3.3.3.1 Experimental design
The experimental procedures designed and conducted under this section aimed at the
monitoring and evaluation of the spoilage of (i) rocket salad (Eruca sativa), (ii) baby spinach
(Spinacea oleracea) and (iii) fresh-cut pineapple (Ananas comosus) during aerobic storage
under different temperature conditions. All these three food products were washed and ready-
to-eat fresh produce commodities provided by a local manufacturer within one day from
production, and were used in the experiments in their original commercial packaging (i.e.
plastic bags for rocket/spinach and plastic cups with lid for pineapple). The aforementioned
fruit and vegetables were stored under isothermal conditions (i.e. 4, 8 and 12°C), as well as at
dynamic storage conditions with periodic temperature changes ranging from 4 to 12°C (i.e. 8 h
at 4°C, 8 h at 8°C and 8 h at 12°C). At regular time intervals during storage, depending on the
storage temperature, duplicate samples (originating from different packages) were subjected to
the following analyses/measurements:
Project Title: PhasmaFOOD Contract No. 732541 Project Coordinator: INTRASOFT International S.A.
Page | 45
D3.2 – Feasibility results and use case benchmarking-v2, Version: v4 – Final version, Date 28/06/2018
o Microbiological analyses, pH measurements and sensory evaluation (all samples)
o MSI acquisition (all samples)
o FTIR spectroscopy measurements (all samples)
o VIS (all samples) and FLUO (pineapple samples) spectroscopy measurements
o NIR spectroscopy measurements (all vegetable samples and some pineapple
samples)
o Image acquisition using the CMOS camera (baby spinach samples)
The applied experimental analyses were performed according to the general schematic
illustrated in Figure 8. As mentioned previously for the sub-use cases of meat and fish,
measurements taken with a vibrational spectroscopy instrument (i.e. FTIR spectrometer) and
surface chemistry (e.g., MSI) data acquisition were performed as additional advanced
metabolomics/fingerprinting methods, with the ultimate goal of serving as point of reference
for the presented PhasmaFOOD scanners in relation to the spoilage status of the food samples
analyzed. Two and three independent experiments (i.e. different time instances and different
product batches) were conducted for the vegetable (rocket, spinach) and fruit (pineapple)
products, respectively. A total of 232 rocket samples, 224 baby spinach samples and 318
pineapple samples were analyzed in the context of the abovementioned experiments.
3.3.3.2 Implementation of sensors (food science laboratory)
The NIR and VIS spectrometers evaluated in the PhasmaFOOD project were used in the fruit
and vegetables spoilage experiments following the procedures described in D3.1. With
particular reference to the VIS spectrometer and the measurements acquired in fluorescence
mode (i.e. in the case of pineapple samples), in order to avoid to the greatest possible extent
signal saturation issues that arose at some instances, the integration time used in the third
experimental replicate was 100000 μs.
3.3.3.3 Other experimental procedures
Microbiological analyses
Twenty-five grams from each produce commodity sample (i.e. commercial package of fruit or
vegetables) were transferred aseptically to a 400-ml sterile stomacher bag containing 225 ml of
saline diluent, and were homogenized for 60 sec. For the enumeration of total mesophiles,
appropriate serial decimal dilutions in saline diluent were surface plated on tryptic glucose
yeast agar, and colonies were counted after incubation of plates at 25°C for 72 h. In addition,
Pseudomonas spp. populations and total populations of molds and yeasts throughout storage,
as well as populations of LAB and Enterobacteriaceae at selected time intervals during storage,
were determined according to the procedures described in detail in the sections 3.3.1.3 and
3.3.2.3. The obtained microbiological data were converted to log CFU/g. Upon completion of
Project Title: PhasmaFOOD Contract No. 732541 Project Coordinator: INTRASOFT International S.A.
Page | 46
D3.2 – Feasibility results and use case benchmarking-v2, Version: v4 – Final version, Date 28/06/2018
the microbiological analyses, the pH values of the fruit and vegetable samples also were
measured using a digital pH meter with a glass electrode. Finally, each produce commodity’s
sample was evaluated with regard to its sensory attributes of appearance (color) and odor,
using the procedures described previously (sections 3.3.1.3 and 3.3.2.3).
Multispectral image (MSI) acquisition and FTIR spectroscopy
Multispectral imaging and FTIR spectral data were collected for the vegetable salad samples by
using an appropriate amount of whole and cut leaves, respectively, according to the procedures
described previously (section 3.3.1.3). With regard to the tested fruit (i.e. pineapple) samples,
portions of pineapple slices and small cut portions of the fruit were used for the purpose of
image acquisition and FTIR spectra collection, respectively.
3.3.3.4 Pilot experiments
The available NIR spectrometer was furthermore tested on a wider range of fruit, with two
purposes: 1) these measurements served to assess the amount of light required for the
PhasmaFOOD sensing system. They were carried out alongside sensor development; 2) the fruit
tested included avocado, mango, papaya, banana, strawberries and other fruit that are
considered sensitive from the point of food quality deterioration, e.g. where the state of
“perfect ripeness” occurs only within a very short time window or where ripeness reacts very
sensitive to storage conditions. These measurements are not fully evaluated yet and therefore,
not shown. They can be used to assess whether it is worthwhile to run a full trial on a certain
type of fruit, in addition to pineapple.
3.4 Detection of food fraud
3.4.1 Milk powder
3.4.1.1 Experimental design
Thirty-two skimmed milk powders (SMP) were obtained from routine controls (residue
samples) which had passed the routine controls as described in EC regulation 273/2008 on
public intervention for butter and SMP [33]. Milk powder adulteration experiments were
divided in two groups: (I) safety related experiments using nitrogen enhancers and (II) non-
hazardous low-value fillers.
For the safety related issues, the following nitrogen enhancers were considered: melamine,
ammonium chloride, ammonium nitrate and urea. All chemicals were purchased in pure or
Project Title: PhasmaFOOD Contract No. 732541 Project Coordinator: INTRASOFT International S.A.
Page | 47
D3.2 – Feasibility results and use case benchmarking-v2, Version: v4 – Final version, Date 28/06/2018
technical grades of purity. Nitrogen enhancers were dry blended1 in a full factorial design in
concentrations of 0.1 to 5.0 % (w/w), which results in an apparent raise of protein
concentration of approximately 0.1 to 2.0 % (w/w). For each nitrogen enhancer, nine blends
were prepared in the indicated concentration range. In total, 36 blends were prepared. For
each blend, a SMP was used from a different batch.
For the non-hazardous fillers, whey protein isolates (WPI, 6 commercial brands), plant protein
isolates (PaPI, 5 commercial brands), pea protein isolates (PePI, 4 commercial brands), soy
protein isolates (SPI, 3 commercial brands), buttermilk powder (BP, reference standard), starch
(S), maltodextrin (MD), glucose (G), lactose (L) and fructose (F) were considered. All sugars were
of laboratory synthesis grade. Again, dry blending was applied in a similar design as for the
safety related nitrogen enhancer, but now at concentrations of either 50 SMP / 50 filler or 25
SMP / 25 filler (% w/w) leading to a total of 36 blends.
3.4.1.2 Implementation of sensors (food science laboratory)
The FLUO and VIS measurements were performed according to the SOP in section 3.1. SMPs
were deposited in plastic Petri dishes (diameter 9.0 cm) and measurements were performed by
placing the sensor casing on the outer rims of the Petri dishes. The measuring setup and
samples were shielded for environmental light by applying a black plastic bag around the setup.
The NIR measurements were performed according to the SOP in section 3.1 using the solids
probe which was connected to the device by an optical fiber. The probe was applied directly in
the sample flask which contained approximately 5 - 7 cm SMP powder.
3.4.1.3 Other experimental procedures
All SMPs were analyzed for dry matter, fat content, protein content, acid whey content,
buttermilk content and carbohydrate content according to the accompanying ISO methods
stated in EC regulation 273/2008 [33, 34].
1 It is imperative to realize that SMP can be measured in dry form or in reconstituted form. Karunathilaka et al.
(2017) utilized Raman spectroscopy to classify non-adulterated milk powder and melamine adulterated milk powders, made using dry or wet blending methods. Utilizing PCA to analyze their spectra, the authors noted that dry blended adulterated samples were more difficult to differentiate from authentic samples, and that replicates were not tightly clustered [35]. Possible differences arising from the use of dry blending versus wet blending have also previously been mentioned by Capuano et al. (2015) [36]. In this sub-use case, dry blending was used for reasons of practicality in sample preparation.
Project Title: PhasmaFOOD Contract No. 732541 Project Coordinator: INTRASOFT International S.A.
Page | 48
D3.2 – Feasibility results and use case benchmarking-v2, Version: v4 – Final version, Date 28/06/2018
3.4.2 Meat
3.4.2.1 Experimental design
The fraud incident studied under this section, covering part of the activities outlined in T3.3 of
WP3, is minced meat adulteration. More specifically, aiming at evaluating the efficacy of the
PhasmaFOOD sensors in detecting the fraudulent substitution of a specific type of raw minced
meat with other, two scenarios of minced meat adulteration were studied:
(I) Adulteration of chicken and pork
(II) Adulteration of beef and offal
In the first series of adulteration experiments, the objective was to assess the potential of the
PhasmaFOOD sensors, supported by advanced statistical approaches, for the detection of
minced chicken intentionally adulterated with minced pork and vice versa. For this purpose,
fresh pork cuts (leg) and chicken breast were obtained from different butcher shops and were
ground separately one at a time, using a domestic meat-mincing machine in the Laboratory of
Microbiology and Biotechnology of Foods (Department of Food Science and Human Nutrition,
AUA). In the second series of adulteration experiments, aiming at evaluating the potential of
the PhasmaFOOD sensors for the detection of fraudulent adulteration of minced beef with
offal, similar procedures were followed for the preparation of minced meat derived from fresh
beef cuts (leg) and bovine hearts. In both series of experiments (adulteration scenarios I and II),
different levels of adulteration, ranging from 25 to 75%, were achieved by mixing the
appropriate amount of each type of meat under conditions simulating industrial processing. A
total of five different levels of adulteration were considered for each adulteration scenario,
consisting of three categories of mixed meat and two categories of pure meat. From each level
of adulteration, six different portions (ca. 70 g) were placed in Petri dishes and the following
measurements were taken:
o MSI acquisition (i.e. snapshots using the VideometerLab system)
o NIR spectroscopy measurements
o VIS and FLUO spectroscopy measurements
For each type of minced meat adulteration (adulteration scenario: chicken/pork, beef/offal)
and for each adulteration level within a type, each Petri dish was considered as a replicate in
the experiment (i.e. 5 adulteration levels × 6 samples in total per experiment). Each
experimental procedure was repeated four times (i.e. four independent experiments
corresponding to distinct meat batches), resulting in 120 meat samples being studied in total
for each one of the two aforementioned adulteration scenarios.
Project Title: PhasmaFOOD Contract No. 732541 Project Coordinator: INTRASOFT International S.A.
Page | 49
D3.2 – Feasibility results and use case benchmarking-v2, Version: v4 – Final version, Date 28/06/2018
3.4.2.2 Implementation of sensors (food science laboratory)
NIR, VIS and FLUO spectroscopy measurements were performed according to the procedures
described previously (section 3.3.1.2).
3.4.2.3 Other experimental procedures
Similarly to what was the case for the use case 2 experiments, MSI data acquisition served as
point of reference for the presented PhasmaFOOD scanners in relation to meat adulteration
[26, 28].
3.4.3 Alcoholic beverages
3.4.3.1 Experimental design
Approximately fifty distilled spirit samples are obtained from various liquor shops in The
Netherlands from various categories: bourbon, Dutch gin (light, young and old), gin, grain wine,
grappa, whiskey and vodka. This sub-use case is divided in assessing (I) dilution (i.e. prediction
of ethanol content), (II) presence of technical alcohols (i.e. methanol) and (III) counterfeit
products. During this first feasibility test the PhasmaFOOD sensors will be tested for dilution
(range 15 – 50 % alcohol by volume (abv)) and presence of methanol (range 1 – 20 % abv), in a
factorial sampling design. The production of counterfeit samples for ‘white’ spirits like vodka,
(Dutch) gin by water/ethanol mixtures will be attempted when acceptable results for dilution
and technical alcohols are obtained.
3.4.3.2 Implementation of sensors (food science laboratory)
Preliminary tests have been performed using the NIR sensor according to the SOP described in
section 3.1. Tests were performed in the transmission modus (cuvette holder and
complementary fiber optics), using a 1-cm plastic standard issue cuvette. The FLUO and VIS
measurements were not performed as the device was not suitable for performing
measurements on liquids.
3.4.3.3 Other experimental procedures
The alcoholic strength and determination of methanol will be executed accor ding to EC
regulation 2870/2000 [37] on the reference methods for the analysis of spirit drinks.
Project Title: PhasmaFOOD Contract No. 732541 Project Coordinator: INTRASOFT International S.A.
Page | 50
D3.2 – Feasibility results and use case benchmarking-v2, Version: v4 – Final version, Date 28/06/2018
3.4.4 Edible oils
Pilot experimental results using the NIR spectrometer and mixtures of extra virgin olive oil and
sunflower oil were reported in D3.1. Feasibility will be further assessed and reported in the
further course of WP3, in D3.7.
Project Title: PhasmaFOOD Contract No. 732541 Project Coordinator: INTRASOFT International S.A.
Page | 51
D3.2 – Feasibility results and use case benchmarking-v2, Version: v4 – Final version, Date 28/06/2018
4 Data analysis
The data processing could be divided in two main parts. The first part is related to the
acquisition of the measurements from different sensor systems (NIR spectrometer, VIS
spectrometer and CMOS camera) while the second is mainly composed of the following steps:
1. Data Preprocessing: data compression (for the sensor required, noise removal, data
normalization for de-correlation and to have the same range of values for each of the sensors
(this can guarantee stable convergence of the downstream developed models).
2. Feature selection: identification for each case study (exploiting the information that we
have obtained from the preliminary measurements) of the most significant features for each
sensor device. In this way, it is not necessary to declare a priori which kind of sensors will be
used for the specific case study.
3. Classification/identification/regression: In this step, using the most significant features
as input for ad hoc use case model will be applied to the data in order to have as output a
sample prediction.
Since D3.3, which coincides in time in the course of the project with D3.2, is particularly
devoted to the description of detection algorithms, detailed description of the chemometric
algorithms and data fusion strategies (pertinent to the smart data correlation activities outlined
in T3.4 of WP3) is provided in the former deliverable’s report. In this context, only a brief
presentation of the data analysis procedures is provided in this report.
4.1 Mycotoxin detection
At the present stage of tests, detection of mycotoxins (particularly aflatoxin B1) has relied
mainly on fluorescence emission spectra. Visible reflectance data have been recorded and will
be considered in multivariate analysis. The data analysis is mainly based on the three steps
previously cited. In the preprocessing, a normalization procedure has been applied to each
single spectrum. In particular, the normalization with dark and reference samples is applied for
VIS spectra while only the dark normalization is considered for FLUO spectra. After that, the
processed spectra are arranged in a matrix and used as input for partial least squares regression
for a regression task aimed at predicting mycotoxins content and for Linear Discriminant
Analysis for the classification task aimed at discriminating contaminated and non-contaminated
samples. The validation procedure has been performed by means of k-fold cross validation
procedure.
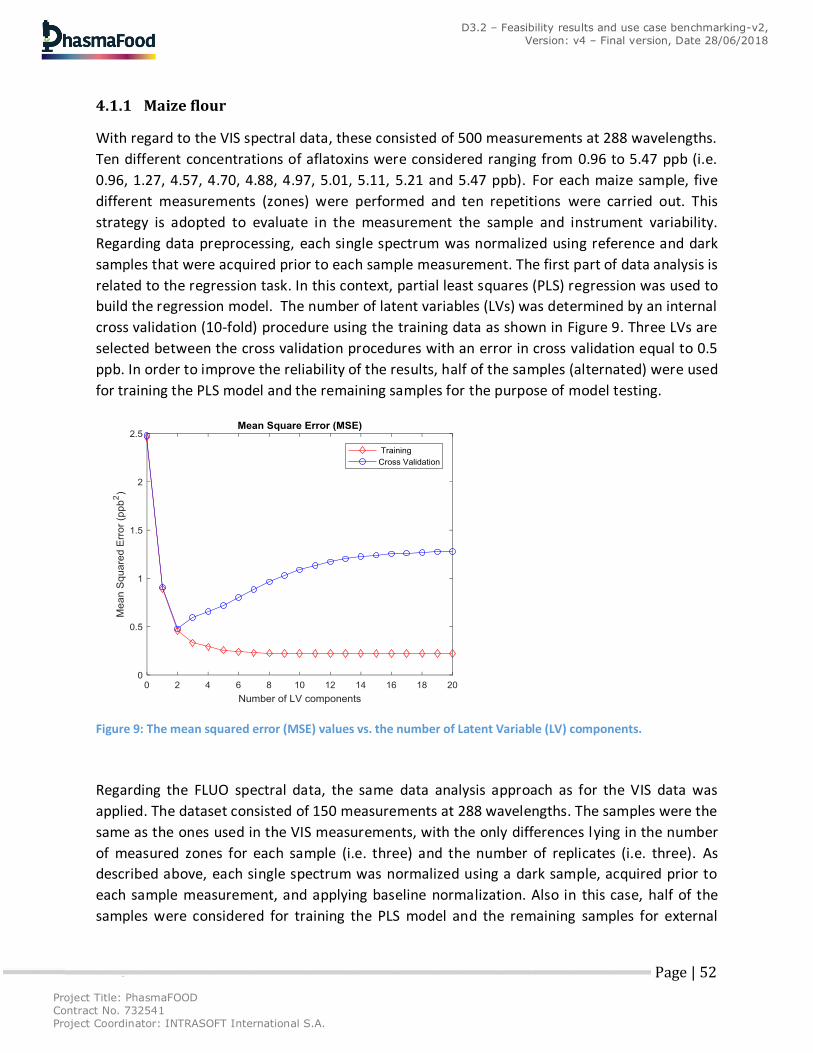
Project Title: PhasmaFOOD Contract No. 732541 Project Coordinator: INTRASOFT International S.A.
Page | 52
D3.2 – Feasibility results and use case benchmarking-v2, Version: v4 – Final version, Date 28/06/2018
4.1.1 Maize flour
With regard to the VIS spectral data, these consisted of 500 measurements at 288 wavelengths.
Ten different concentrations of aflatoxins were considered ranging from 0.96 to 5.47 ppb (i.e.
0.96, 1.27, 4.57, 4.70, 4.88, 4.97, 5.01, 5.11, 5.21 and 5.47 ppb). For each maize sample, five
different measurements (zones) were performed and ten repetitions were carried out. This
strategy is adopted to evaluate in the measurement the sample and instrument variability.
Regarding data preprocessing, each single spectrum was normalized using reference and dark
samples that were acquired prior to each sample measurement. The first part of data analysis is
related to the regression task. In this context, partial least squares (PLS) regression was used to
build the regression model. The number of latent variables (LVs) was determined by an internal
cross validation (10-fold) procedure using the training data as shown in Figure 9. Three LVs are
selected between the cross validation procedures with an error in cross validation equal to 0.5
ppb. In order to improve the reliability of the results, half of the samples (alternated) were used
for training the PLS model and the remaining samples for the purpose of model testing.
Figure 9: The mean squared error (MSE) values vs. the number of Latent Variable (LV) components.
Regarding the FLUO spectral data, the same data analysis approach as for the VIS data was
applied. The dataset consisted of 150 measurements at 288 wavelengths. The samples were the
same as the ones used in the VIS measurements, with the only differences lying in the number
of measured zones for each sample (i.e. three) and the number of replicates (i.e. three). As
described above, each single spectrum was normalized using a dark sample, acquired prior to
each sample measurement, and applying baseline normalization. Also in this case, half of the
samples were considered for training the PLS model and the remaining samples for external
Project Title: PhasmaFOOD Contract No. 732541 Project Coordinator: INTRASOFT International S.A.
Page | 53
D3.2 – Feasibility results and use case benchmarking-v2, Version: v4 – Final version, Date 28/06/2018
validation purposes. The number of LVs was determined by an internal cross validation (10-
fold) procedure using the training data, as previously described.
The analyses of the data acquired during the last two measurement campaigns (M16 and M18)
are in progress and will be reported in further course of WP3.
4.1.2 Tree nuts
A data analysis strategy, similar to the one applied to the maize samples, has been performed
on the almond spectral dataset. The preliminary results of the data described in Table 8 and
measured in Bari at M16 are reported subsequently in the document of the present report (see
section 5.1.4).
4.2 Food spoilage detection and shelf-life prediction
4.2.1 Meat
The analysis of data derived from the minced meat spoilage experiments is in progress and will
be reported in full in the further course of WP3. The only data analyzed up to this point are the
ones corresponding to aerobic storage of minced pork and generated from the MSI and FTIR
spectroscopy sensors. In brief, the collected MSI and FTIR data were subjected to pre-
processing, i.e. smoothing based on SNV transformation and the Savitzky Golay algorithm,
respectively. Partial least squares (PLS) regression was used to establish the correlation
between imaging/spectral data and microbial counts, with the former constituting the input
and the latter the output variables in the PLS regression models. The models were calibrated
and validated with the data collected from the studied isothermal (170 samples) and dynamic
temperature (58 samples) conditions, respectively.
4.2.2 Fish
The collected data and data analysis procedures corresponding to the first fish fillets
experiment under aerobic storage conditions (pilot data acquisition), for all available, at the
time, sensors have been presented in the report of D3.1. The analysis of data corresponding to
the subsequent (i.e. after M9) fish spoilage experiments (i.e. under modified atmosphere
packaging (MAP) conditions), and involving both NIR and VIS spectral measurements, is in
progress and will be reported in the further course of WP3.
Project Title: PhasmaFOOD Contract No. 732541 Project Coordinator: INTRASOFT International S.A.
Page | 54
D3.2 – Feasibility results and use case benchmarking-v2, Version: v4 – Final version, Date 28/06/2018
4.2.3 Fruit and vegetables
In the case of the data derived from the experiments on rocket salad, the processing pipeline
consisted of feature selection (specific wavelengths) on the basis of random forest (RF)
regression ensemble [38] followed by PLS regression for microbial contamination and shelf-life
estimation using the features (wavelengths/wavenumbers) selected by the RF ensemble. The
data analysis workflow, which is common more or less for all tested sensors, is described in
detail in D3.3.
The analysis of the data derived from the experiments on the spoilage of baby spinach and
pineapple is in progress and will be reported in the further course of WP3.
4.3 Food fraud detection
4.3.1 Milk powder
The data analysis of SMPs was performed on FLUO, VIS and NIR data. Due to time constraints,
the authentic SMP samples were measured in triplicate, but the adulterated blends were
measured only once, and need to be repeated as soon as the sensors become available again.
For data analysis, a chemometric classification strategy was used which will enable the
PhasmaFOOD sensor to detect a broad range of adulterants, even for compounds that the
model was not trained for. This technique is called one-class classification (OCC), where models
are trained to recognize the normal (spectral) variation for an authentic product, and flag
samples as (potentially) adulterated when observed spectra are outside this normal variation.
Data fusion was performed by applying SIMCA on the 1152 (one-) class distances resulting from
the OCC calculation. A detailed description of this strategy is given in D3.3.
4.3.2 Meat
The analysis of the data derived from the experiments on minced meat adulteration is in
progress and will be reported in the further course of WP3.
4.3.3 Alcoholic beverages
This dataset is not complete yet, due to the configuration of the FLUO and VIS sensor.
Feasibility of this sensor using OCC will be assessed in the final version of this deliverable, in the
report of D3.7.
Project Title: PhasmaFOOD Contract No. 732541 Project Coordinator: INTRASOFT International S.A.
Page | 55
D3.2 – Feasibility results and use case benchmarking-v2, Version: v4 – Final version, Date 28/06/2018
4.3.4 Edible oils
This dataset is not complete yet, due to the configuration of the FLUO and VIS sensor.
Feasibility of this sensor using OCC will be assessed in the final version of this deliverable, in the
report of D3.7.
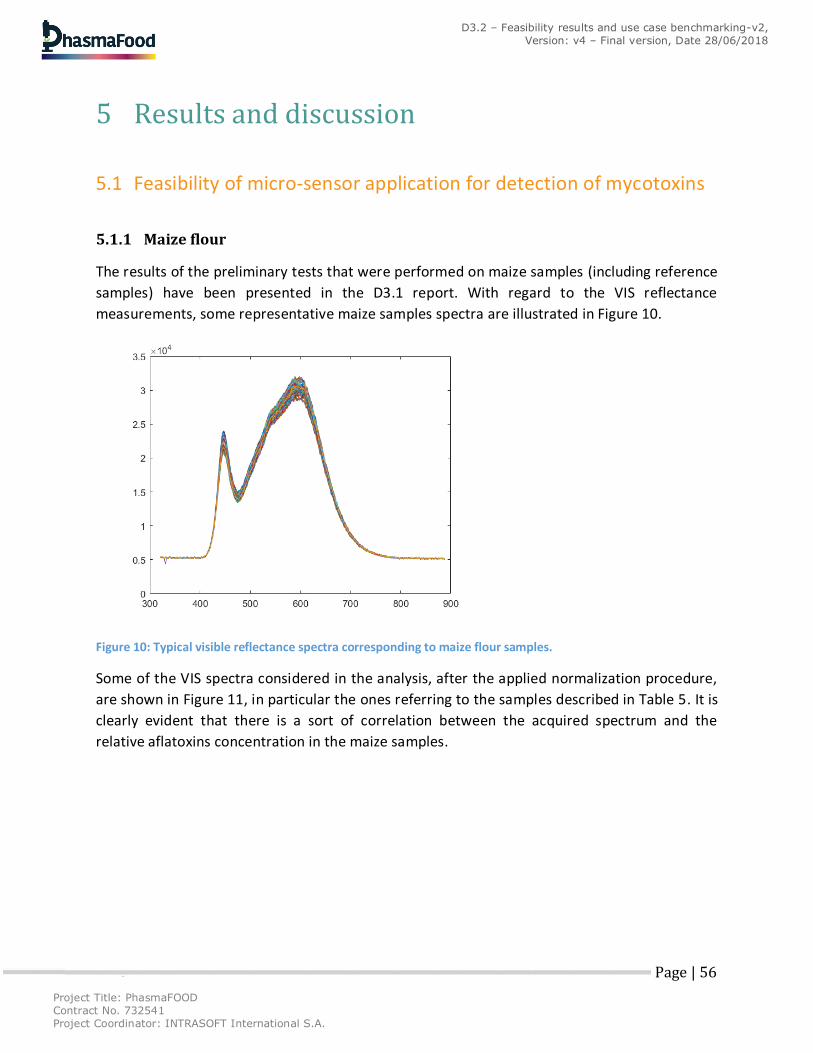
Project Title: PhasmaFOOD Contract No. 732541 Project Coordinator: INTRASOFT International S.A.
Page | 56
D3.2 – Feasibility results and use case benchmarking-v2, Version: v4 – Final version, Date 28/06/2018
5 Results and discussion
5.1 Feasibility of micro-sensor application for detection of mycotoxins
5.1.1 Maize flour
The results of the preliminary tests that were performed on maize samples (including reference
samples) have been presented in the D3.1 report. With regard to the VIS reflectance
measurements, some representative maize samples spectra are illustrated in Figure 10.
Figure 10: Typical visible reflectance spectra corresponding to maize flour samples.
Some of the VIS spectra considered in the analysis, after the applied normalization procedure,
are shown in Figure 11, in particular the ones referring to the samples described in Table 5. It is
clearly evident that there is a sort of correlation between the acquired spectrum and the
relative aflatoxins concentration in the maize samples.
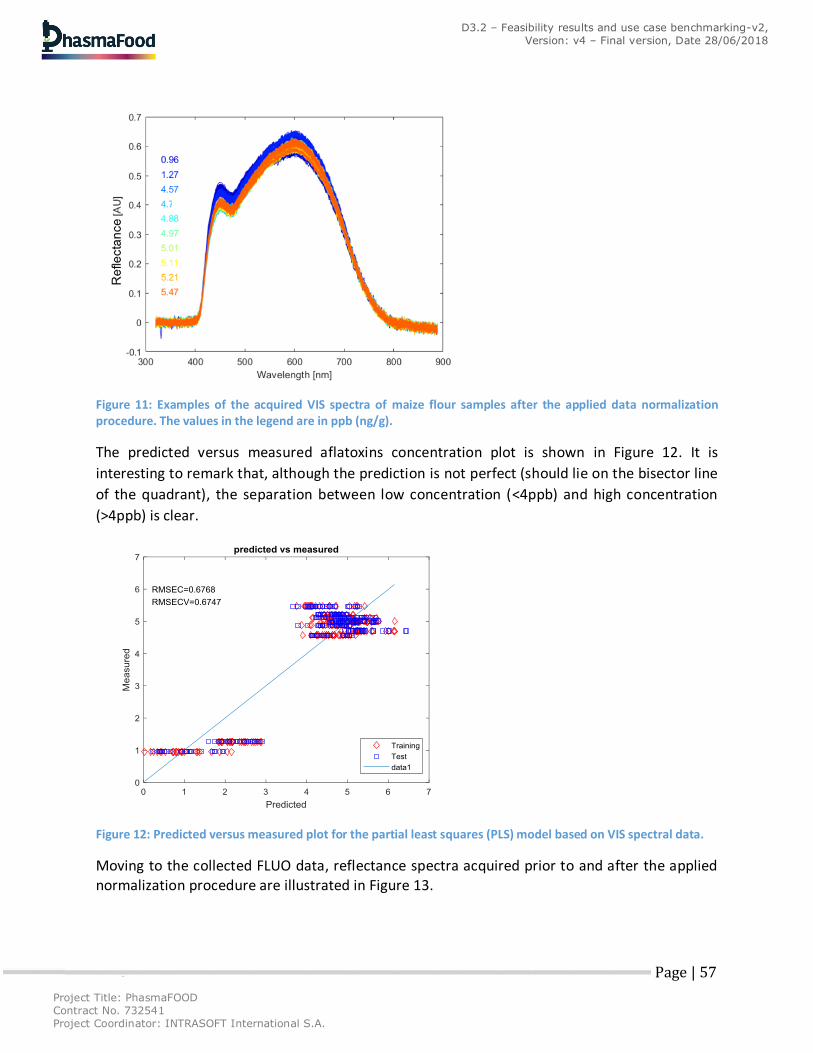
Project Title: PhasmaFOOD Contract No. 732541 Project Coordinator: INTRASOFT International S.A.
Page | 57
D3.2 – Feasibility results and use case benchmarking-v2, Version: v4 – Final version, Date 28/06/2018
Figure 11: Examples of the acquired VIS spectra of maize flour samples after the applied data normalization procedure. The values in the legend are in ppb (ng/g).
The predicted versus measured aflatoxins concentration plot is shown in Figure 12. It is
interesting to remark that, although the prediction is not perfect (should lie on the bisector line
of the quadrant), the separation between low concentration (<4ppb) and high concentration
(>4ppb) is clear.
Figure 12: Predicted versus measured plot for the partial least squares (PLS) model based on VIS spectral data.
Moving to the collected FLUO data, reflectance spectra acquired prior to and after the applied normalization procedure are illustrated in Figure 13.
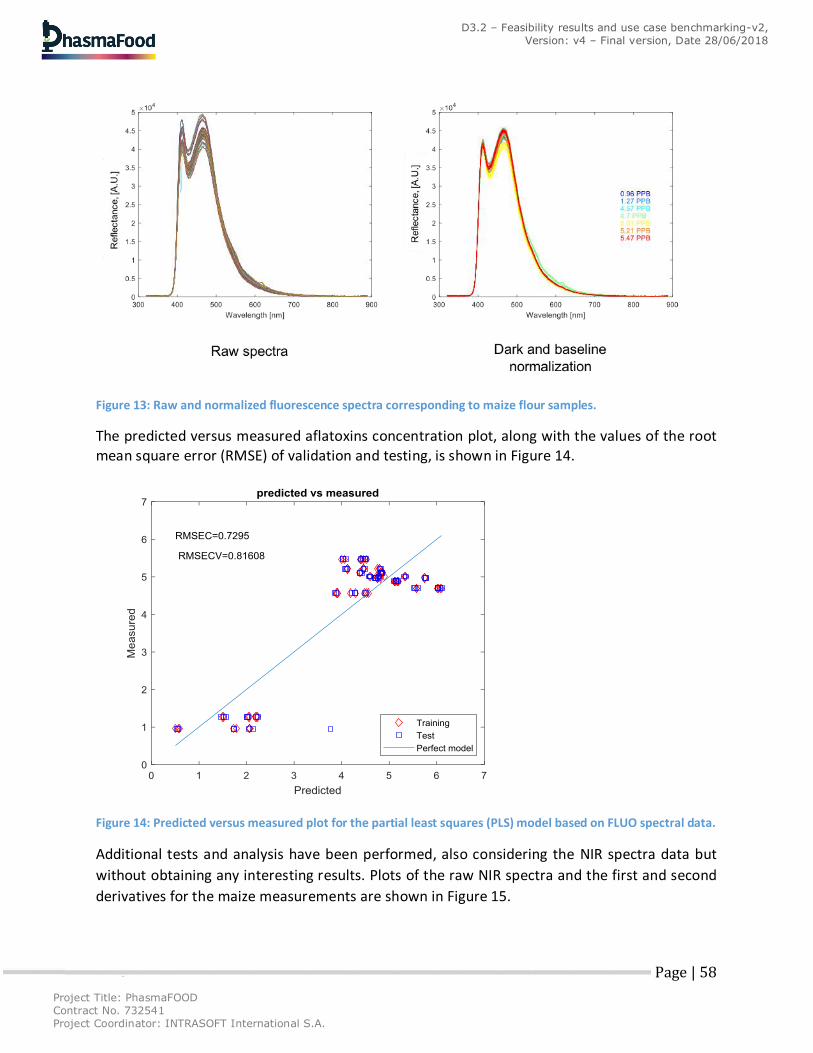
Project Title: PhasmaFOOD Contract No. 732541 Project Coordinator: INTRASOFT International S.A.
Page | 58
D3.2 – Feasibility results and use case benchmarking-v2, Version: v4 – Final version, Date 28/06/2018
Figure 13: Raw and normalized fluorescence spectra corresponding to maize flour samples.
The predicted versus measured aflatoxins concentration plot, along with the values of the root mean square error (RMSE) of validation and testing, is shown in Figure 14.
Figure 14: Predicted versus measured plot for the partial least squares (PLS) model based on FLUO spectral data.
Additional tests and analysis have been performed, also considering the NIR spectra data but
without obtaining any interesting results. Plots of the raw NIR spectra and the first and second
derivatives for the maize measurements are shown in Figure 15.
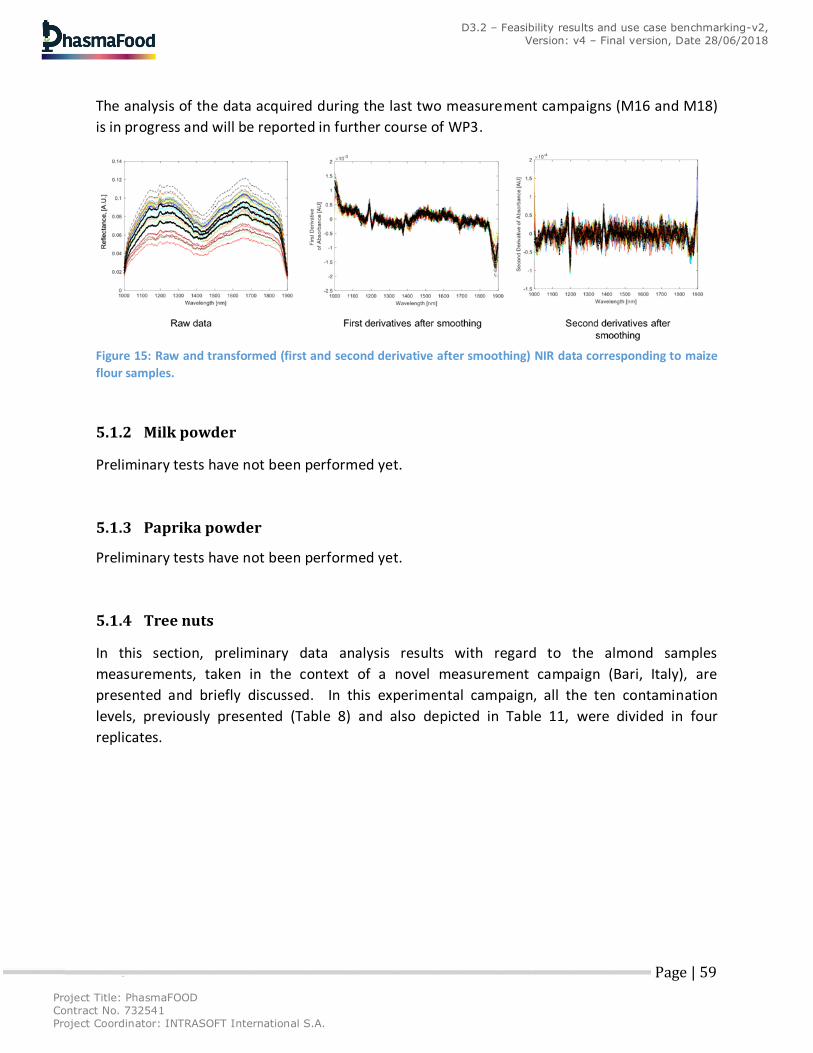
Project Title: PhasmaFOOD Contract No. 732541 Project Coordinator: INTRASOFT International S.A.
Page | 59
D3.2 – Feasibility results and use case benchmarking-v2, Version: v4 – Final version, Date 28/06/2018
The analysis of the data acquired during the last two measurement campaigns (M16 and M18)
is in progress and will be reported in further course of WP3.
Figure 15: Raw and transformed (first and second derivative after smoothing) NIR data corresponding to maize
flour samples.
5.1.2 Milk powder
Preliminary tests have not been performed yet.
5.1.3 Paprika powder
Preliminary tests have not been performed yet.
5.1.4 Tree nuts
In this section, preliminary data analysis results with regard to the almond samples
measurements, taken in the context of a novel measurement campaign (Bari, Italy), are
presented and briefly discussed. In this experimental campaign, all the ten contamination
levels, previously presented (Table 8) and also depicted in Table 11, were divided in four
replicates.
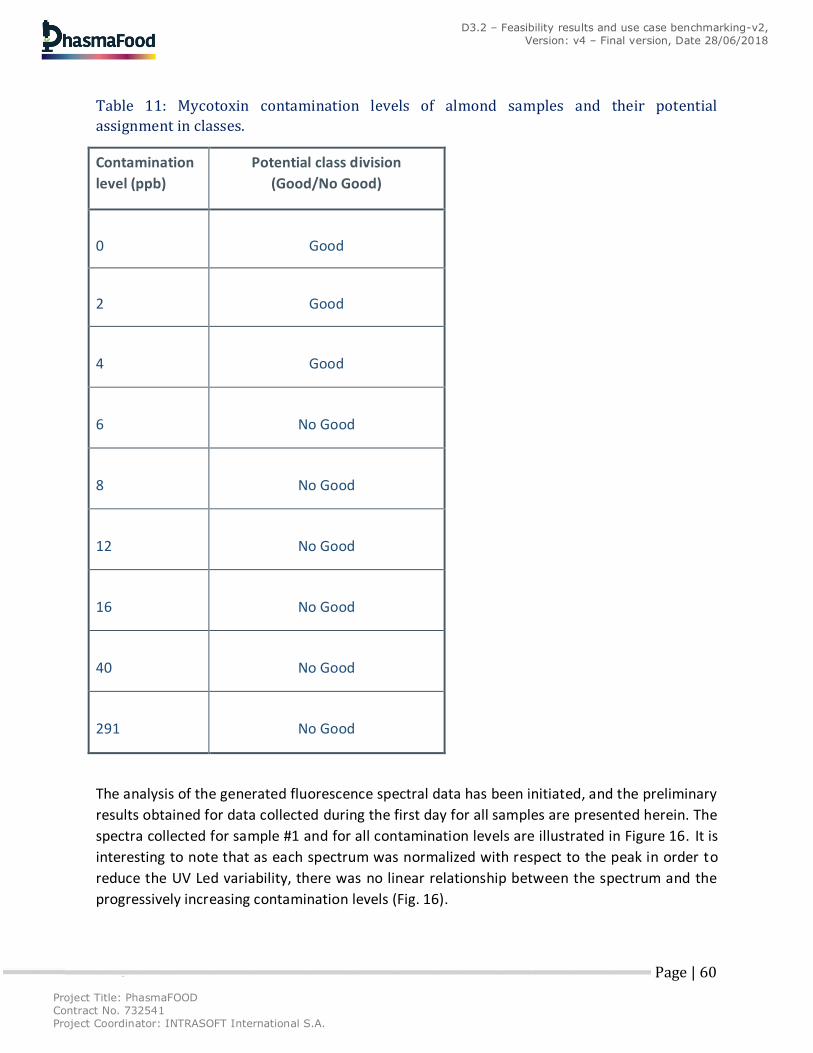
Project Title: PhasmaFOOD Contract No. 732541 Project Coordinator: INTRASOFT International S.A.
Page | 60
D3.2 – Feasibility results and use case benchmarking-v2, Version: v4 – Final version, Date 28/06/2018
Table 11: Mycotoxin contamination levels of almond samples and their potential
assignment in classes.
Contamination
level (ppb)
Potential class division
(Good/No Good)
0 Good
2 Good
4 Good
6 No Good
8 No Good
12 No Good
16 No Good
40 No Good
291 No Good
The analysis of the generated fluorescence spectral data has been initiated, and the preliminary
results obtained for data collected during the first day for all samples are presented herein. The
spectra collected for sample #1 and for all contamination levels are illustrated in Figure 16. It is
interesting to note that as each spectrum was normalized with respect to the peak in order to
reduce the UV Led variability, there was no linear relationship between the spectrum and the
progressively increasing contamination levels (Fig. 16).
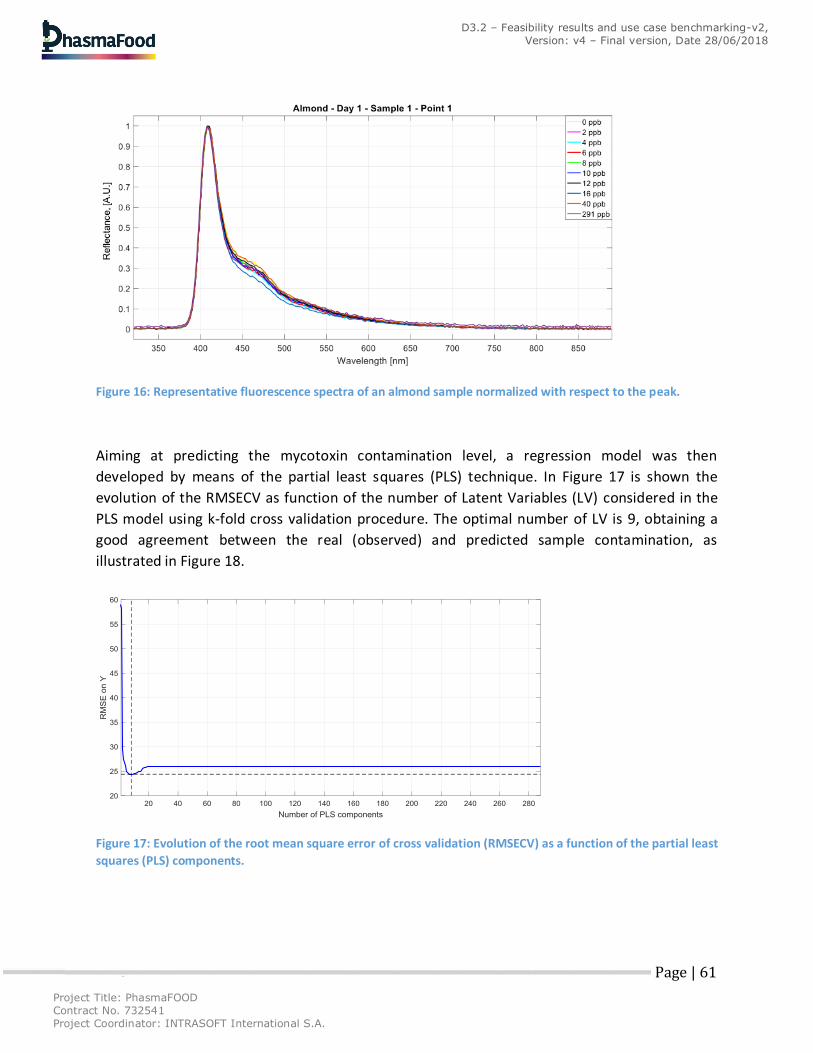
Project Title: PhasmaFOOD Contract No. 732541 Project Coordinator: INTRASOFT International S.A.
Page | 61
D3.2 – Feasibility results and use case benchmarking-v2, Version: v4 – Final version, Date 28/06/2018
Figure 16: Representative fluorescence spectra of an almond sample normalized with respect to the peak.
Aiming at predicting the mycotoxin contamination level, a regression model was then
developed by means of the partial least squares (PLS) technique. In Figure 17 is shown the
evolution of the RMSECV as function of the number of Latent Variables (LV) considered in the
PLS model using k-fold cross validation procedure. The optimal number of LV is 9, obtaining a
good agreement between the real (observed) and predicted sample contamination, as
illustrated in Figure 18.
Figure 17: Evolution of the root mean square error of cross validation (RMSECV) as a function of the partial least
squares (PLS) components.
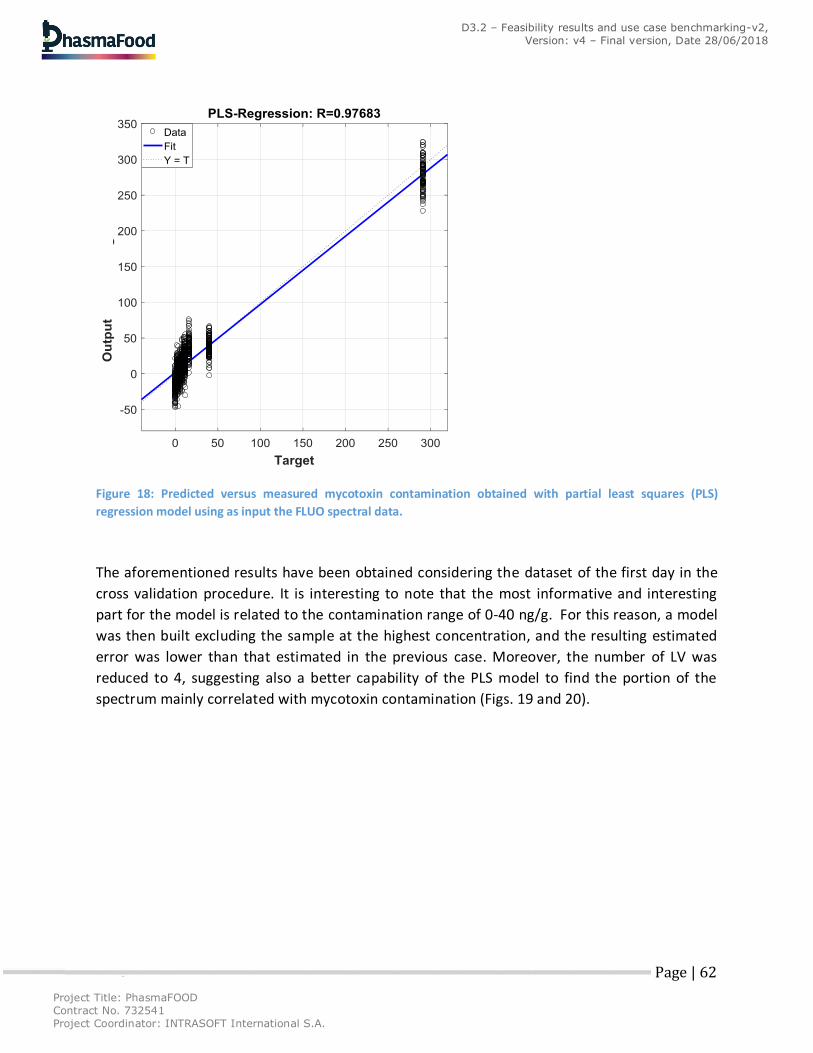
Project Title: PhasmaFOOD Contract No. 732541 Project Coordinator: INTRASOFT International S.A.
Page | 62
D3.2 – Feasibility results and use case benchmarking-v2, Version: v4 – Final version, Date 28/06/2018
Figure 18: Predicted versus measured mycotoxin contamination obtained with partial least squares (PLS)
regression model using as input the FLUO spectral data.
The aforementioned results have been obtained considering the dataset of the first day in the
cross validation procedure. It is interesting to note that the most informative and interesting
part for the model is related to the contamination range of 0-40 ng/g. For this reason, a model
was then built excluding the sample at the highest concentration, and the resulting estimated
error was lower than that estimated in the previous case. Moreover, the number of LV was
reduced to 4, suggesting also a better capability of the PLS model to find the portion of the
spectrum mainly correlated with mycotoxin contamination (Figs. 19 and 20).
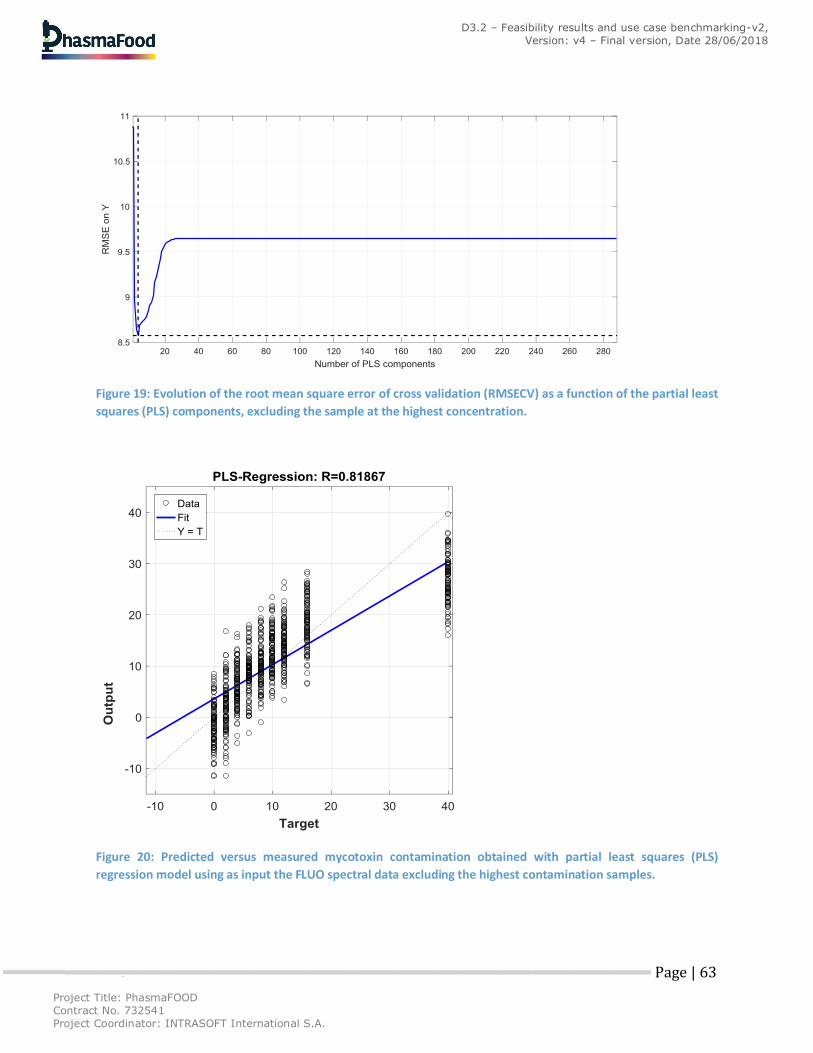
Project Title: PhasmaFOOD Contract No. 732541 Project Coordinator: INTRASOFT International S.A.
Page | 63
D3.2 – Feasibility results and use case benchmarking-v2, Version: v4 – Final version, Date 28/06/2018
Figure 19: Evolution of the root mean square error of cross validation (RMSECV) as a function of the partial least
squares (PLS) components, excluding the sample at the highest concentration.
Figure 20: Predicted versus measured mycotoxin contamination obtained with partial least squares (PLS)
regression model using as input the FLUO spectral data excluding the highest contamination samples.
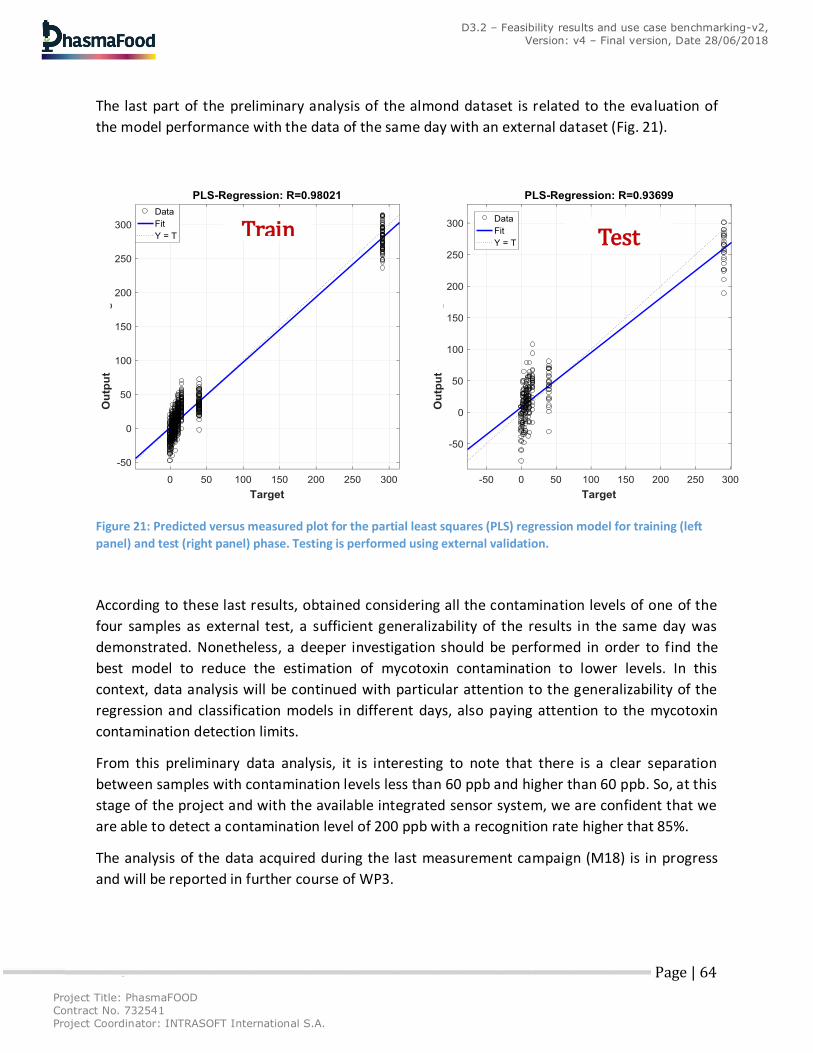
Project Title: PhasmaFOOD Contract No. 732541 Project Coordinator: INTRASOFT International S.A.
Page | 64
D3.2 – Feasibility results and use case benchmarking-v2, Version: v4 – Final version, Date 28/06/2018
The last part of the preliminary analysis of the almond dataset is related to the evaluation of
the model performance with the data of the same day with an external dataset (Fig. 21).
Figure 21: Predicted versus measured plot for the partial least squares (PLS) regression model for training (left
panel) and test (right panel) phase. Testing is performed using external validation.
According to these last results, obtained considering all the contamination levels of one of the
four samples as external test, a sufficient generalizability of the results in the same day was
demonstrated. Nonetheless, a deeper investigation should be performed in order to find the
best model to reduce the estimation of mycotoxin contamination to lower levels. In this
context, data analysis will be continued with particular attention to the generalizability of the
regression and classification models in different days, also paying attention to the mycotoxin
contamination detection limits.
From this preliminary data analysis, it is interesting to note that there is a clear separation
between samples with contamination levels less than 60 ppb and higher than 60 ppb. So, at this
stage of the project and with the available integrated sensor system, we are confident that we
are able to detect a contamination level of 200 ppb with a recognition rate higher that 85%.
The analysis of the data acquired during the last measurement campaign (M18) is in progress
and will be reported in further course of WP3.
Train Test
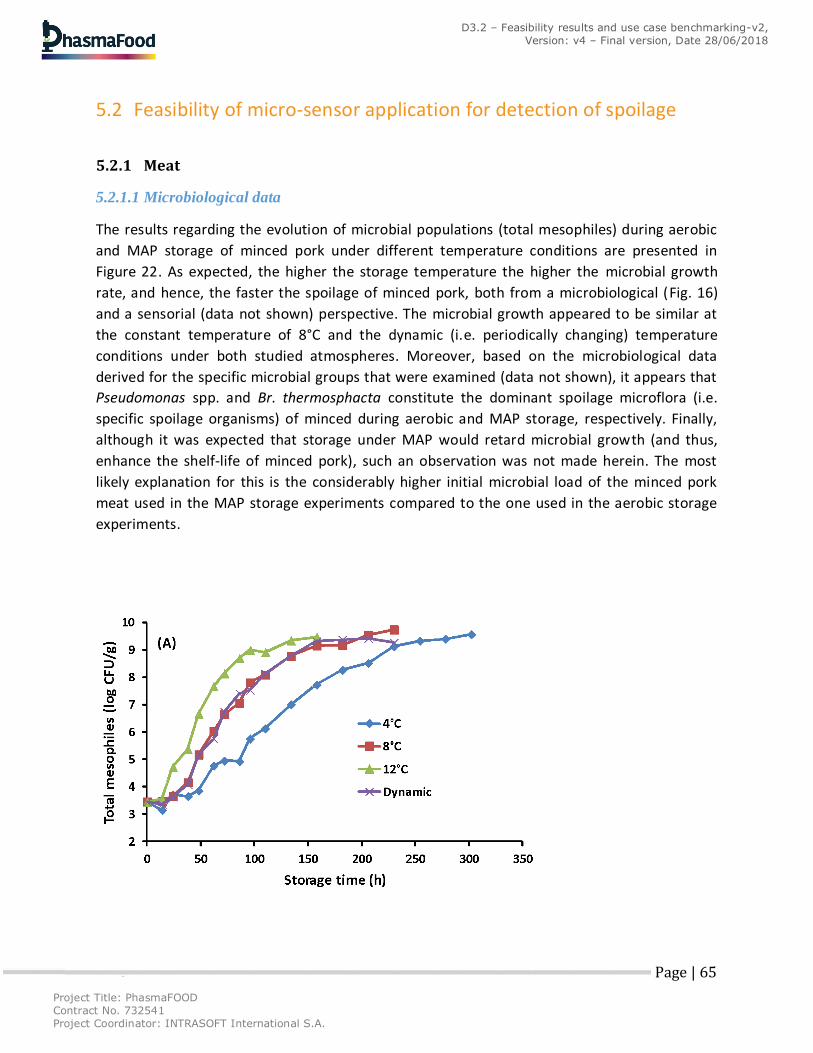
Project Title: PhasmaFOOD Contract No. 732541 Project Coordinator: INTRASOFT International S.A.
Page | 65
D3.2 – Feasibility results and use case benchmarking-v2, Version: v4 – Final version, Date 28/06/2018
5.2 Feasibility of micro-sensor application for detection of spoilage
5.2.1 Meat
5.2.1.1 Microbiological data
The results regarding the evolution of microbial populations (total mesophiles) during aerobic
and MAP storage of minced pork under different temperature conditions are presented in
Figure 22. As expected, the higher the storage temperature the higher the microbial growth
rate, and hence, the faster the spoilage of minced pork, both from a microbiological (Fig. 16)
and a sensorial (data not shown) perspective. The microbial growth appeared to be similar at
the constant temperature of 8°C and the dynamic (i.e. periodically changing) temperature
conditions under both studied atmospheres. Moreover, based on the microbiological data
derived for the specific microbial groups that were examined (data not shown), it appears that
Pseudomonas spp. and Br. thermosphacta constitute the dominant spoilage microflora (i.e.
specific spoilage organisms) of minced during aerobic and MAP storage, respectively. Finally,
although it was expected that storage under MAP would retard microbial growth (and thus,
enhance the shelf-life of minced pork), such an observation was not made herein. The most
likely explanation for this is the considerably higher initial microbial load of the minced pork
meat used in the MAP storage experiments compared to the one used in the aerobic storage
experiments.
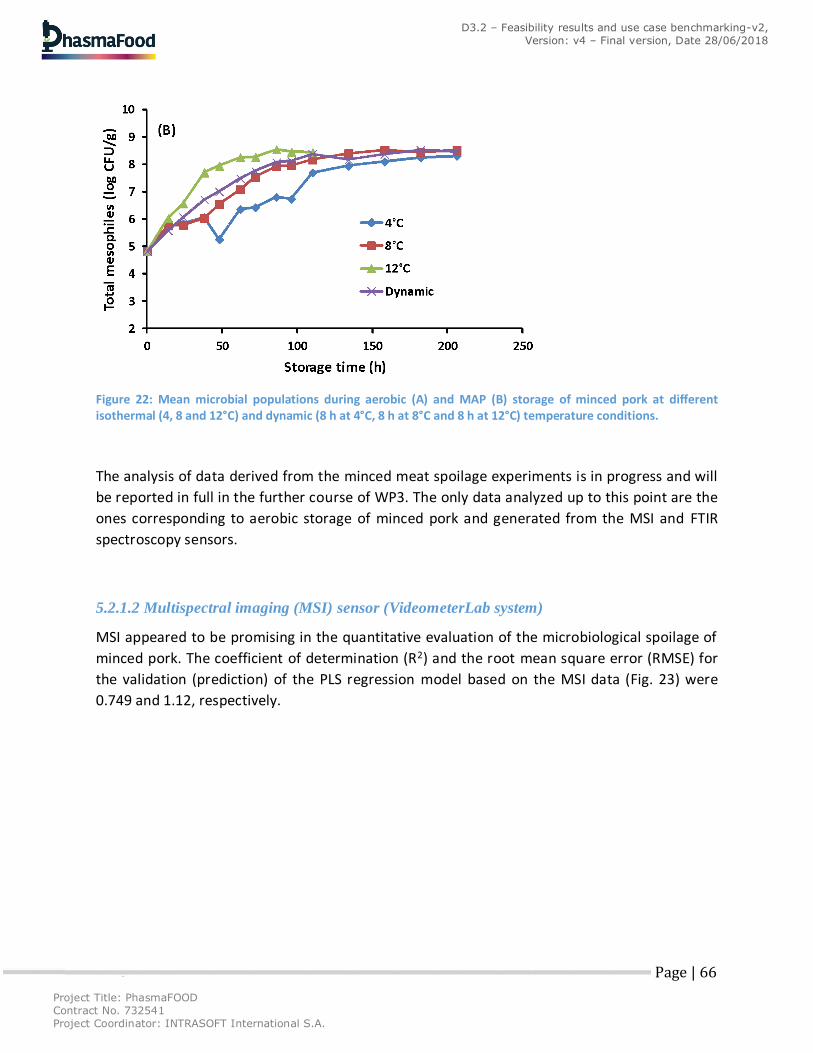
Project Title: PhasmaFOOD Contract No. 732541 Project Coordinator: INTRASOFT International S.A.
Page | 66
D3.2 – Feasibility results and use case benchmarking-v2, Version: v4 – Final version, Date 28/06/2018
Figure 22: Mean microbial populations during aerobic (A) and MAP (B) storage of minced pork at different isothermal (4, 8 and 12°C) and dynamic (8 h at 4°C, 8 h at 8°C and 8 h at 12°C) temperature conditions.
The analysis of data derived from the minced meat spoilage experiments is in progress and will
be reported in full in the further course of WP3. The only data analyzed up to this point are the
ones corresponding to aerobic storage of minced pork and generated from the MSI and FTIR
spectroscopy sensors.
5.2.1.2 Multispectral imaging (MSI) sensor (VideometerLab system)
MSI appeared to be promising in the quantitative evaluation of the microbiological spoilage of
minced pork. The coefficient of determination (R2) and the root mean square error (RMSE) for
the validation (prediction) of the PLS regression model based on the MSI data (Fig. 23) were
0.749 and 1.12, respectively.
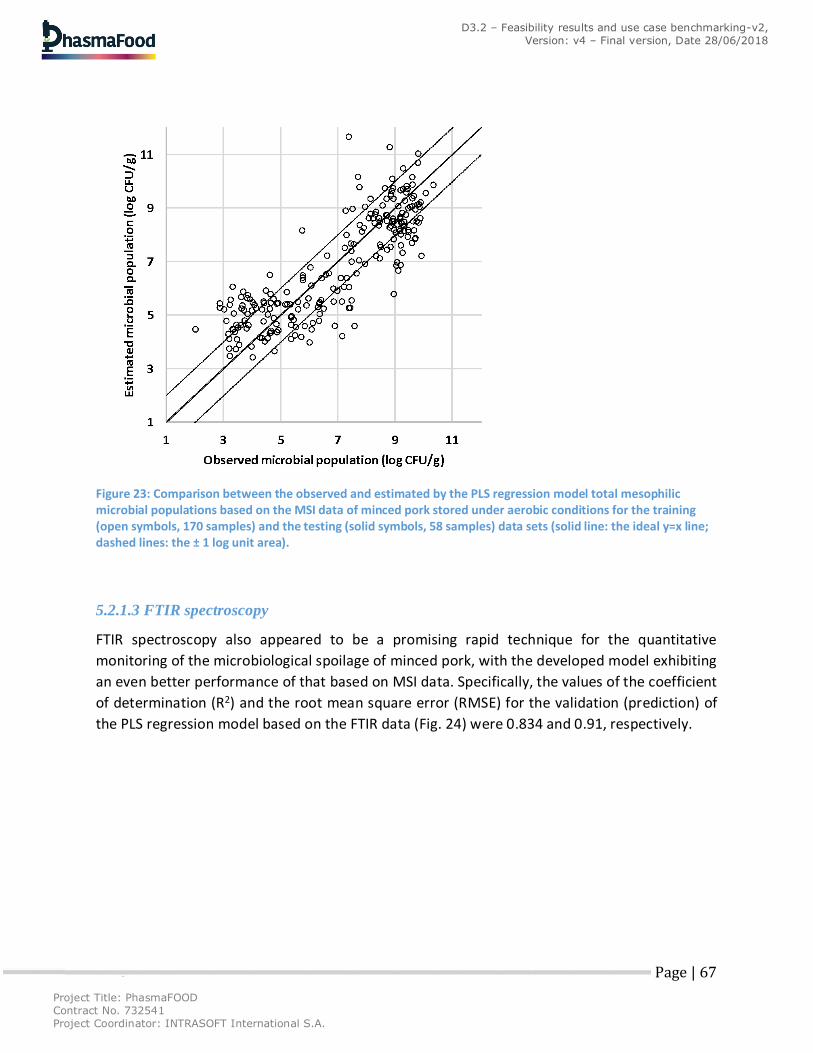
Project Title: PhasmaFOOD Contract No. 732541 Project Coordinator: INTRASOFT International S.A.
Page | 67
D3.2 – Feasibility results and use case benchmarking-v2, Version: v4 – Final version, Date 28/06/2018
Figure 23: Comparison between the observed and estimated by the PLS regression model total mesophilic microbial populations based on the MSI data of minced pork stored under aerobic conditions for the training (open symbols, 170 samples) and the testing (solid symbols, 58 samples) data sets (solid line: the ideal y=x line; dashed lines: the ± 1 log unit area).
5.2.1.3 FTIR spectroscopy
FTIR spectroscopy also appeared to be a promising rapid technique for the quantitative
monitoring of the microbiological spoilage of minced pork, with the developed model exhibiting
an even better performance of that based on MSI data. Specifically, the values of the coefficient
of determination (R2) and the root mean square error (RMSE) for the validation (prediction) of
the PLS regression model based on the FTIR data (Fig. 24) were 0.834 and 0.91, respectively.
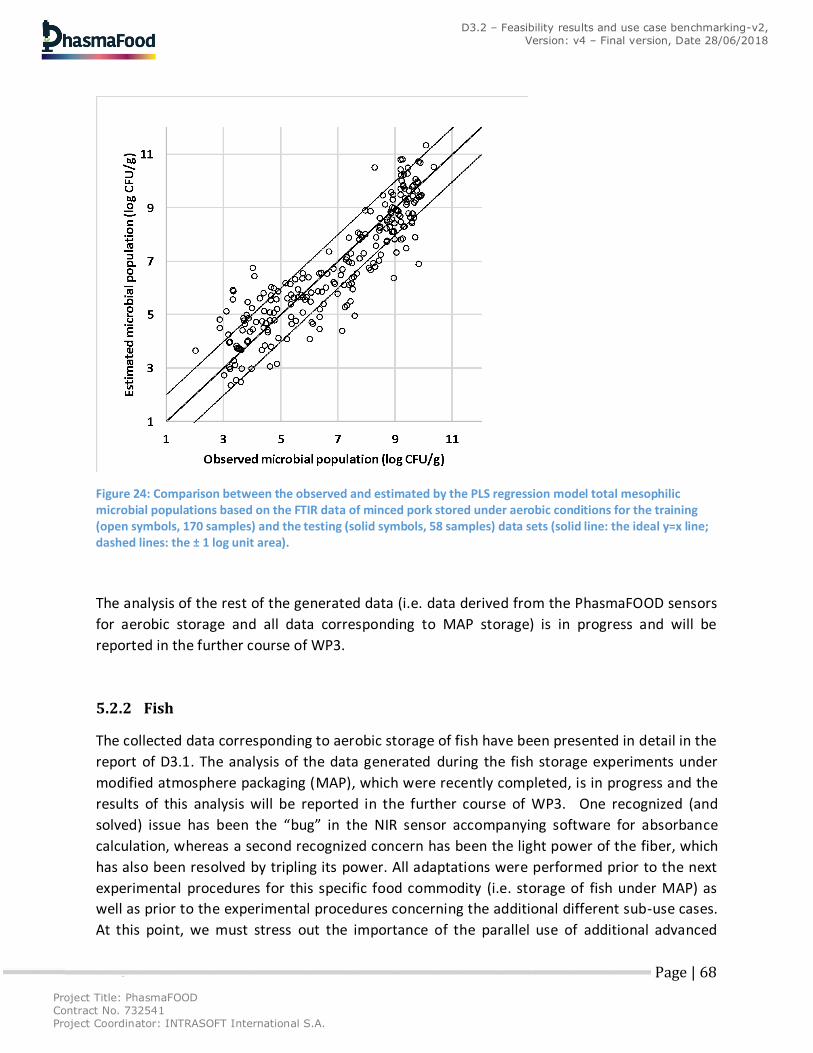
Project Title: PhasmaFOOD Contract No. 732541 Project Coordinator: INTRASOFT International S.A.
Page | 68
D3.2 – Feasibility results and use case benchmarking-v2, Version: v4 – Final version, Date 28/06/2018
Figure 24: Comparison between the observed and estimated by the PLS regression model total mesophilic microbial populations based on the FTIR data of minced pork stored under aerobic conditions for the training (open symbols, 170 samples) and the testing (solid symbols, 58 samples) data sets (solid line: the ideal y=x line; dashed lines: the ± 1 log unit area).
The analysis of the rest of the generated data (i.e. data derived from the PhasmaFOOD sensors
for aerobic storage and all data corresponding to MAP storage) is in progress and will be
reported in the further course of WP3.
5.2.2 Fish
The collected data corresponding to aerobic storage of fish have been presented in detail in the
report of D3.1. The analysis of the data generated during the fish storage experiments under
modified atmosphere packaging (MAP), which were recently completed, is in progress and the
results of this analysis will be reported in the further course of WP3. One recognized (and
solved) issue has been the “bug” in the NIR sensor accompanying software for absorbance
calculation, whereas a second recognized concern has been the light power of the fiber, which
has also been resolved by tripling its power. All adaptations were performed prior to the next
experimental procedures for this specific food commodity (i.e. storage of fish under MAP) as
well as prior to the experimental procedures concerning the additional different sub-use cases.
At this point, we must stress out the importance of the parallel use of additional advanced
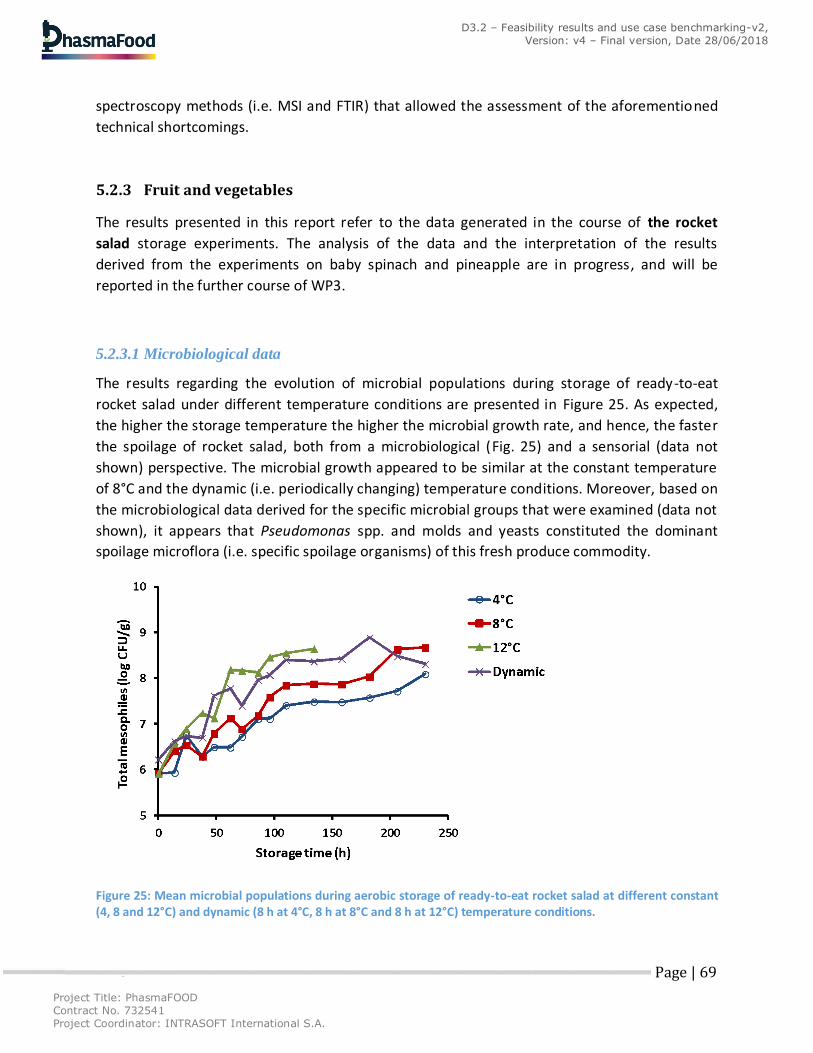
Project Title: PhasmaFOOD Contract No. 732541 Project Coordinator: INTRASOFT International S.A.
Page | 69
D3.2 – Feasibility results and use case benchmarking-v2, Version: v4 – Final version, Date 28/06/2018
spectroscopy methods (i.e. MSI and FTIR) that allowed the assessment of the aforementioned
technical shortcomings.
5.2.3 Fruit and vegetables
The results presented in this report refer to the data generated in the course of the rocket
salad storage experiments. The analysis of the data and the interpretation of the results
derived from the experiments on baby spinach and pineapple are in progress, and will be
reported in the further course of WP3.
5.2.3.1 Microbiological data
The results regarding the evolution of microbial populations during storage of ready-to-eat
rocket salad under different temperature conditions are presented in Figure 25. As expected,
the higher the storage temperature the higher the microbial growth rate, and hence, the faster
the spoilage of rocket salad, both from a microbiological (Fig. 25) and a sensorial (data not
shown) perspective. The microbial growth appeared to be similar at the constant temperature
of 8°C and the dynamic (i.e. periodically changing) temperature conditions. Moreover, based on
the microbiological data derived for the specific microbial groups that were examined (data not
shown), it appears that Pseudomonas spp. and molds and yeasts constituted the dominant
spoilage microflora (i.e. specific spoilage organisms) of this fresh produce commodity.
Figure 25: Mean microbial populations during aerobic storage of ready-to-eat rocket salad at different constant (4, 8 and 12°C) and dynamic (8 h at 4°C, 8 h at 8°C and 8 h at 12°C) temperature conditions.
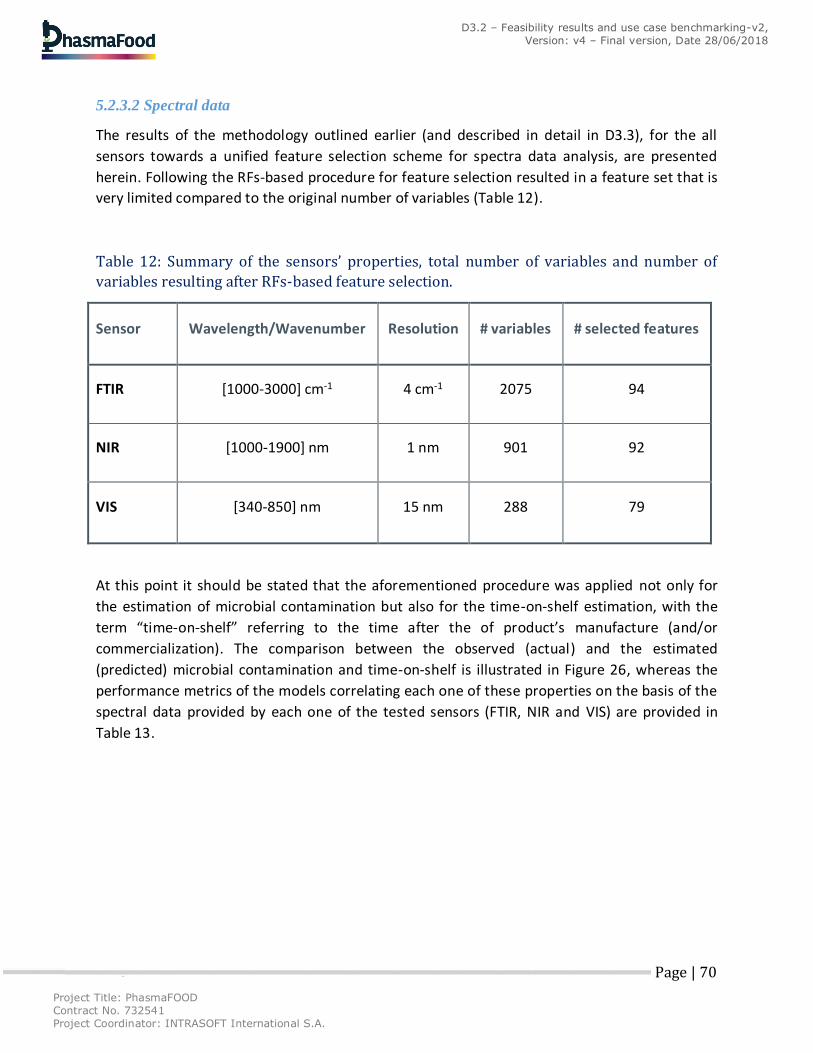
Project Title: PhasmaFOOD Contract No. 732541 Project Coordinator: INTRASOFT International S.A.
Page | 70
D3.2 – Feasibility results and use case benchmarking-v2, Version: v4 – Final version, Date 28/06/2018
5.2.3.2 Spectral data
The results of the methodology outlined earlier (and described in detail in D3.3), for the all
sensors towards a unified feature selection scheme for spectra data analysis, are presented
herein. Following the RFs-based procedure for feature selection resulted in a feature set that is
very limited compared to the original number of variables (Table 12).
Table 12: Summary of the sensors’ properties, total number of variables and number of
variables resulting after RFs-based feature selection.
Sensor Wavelength/Wavenumber Resolution # variables # selected features
FTIR [1000-3000] cm-1 4 cm-1 2075 94
NIR [1000-1900] nm 1 nm 901 92
VIS [340-850] nm 15 nm 288 79
At this point it should be stated that the aforementioned procedure was applied not only for
the estimation of microbial contamination but also for the time-on-shelf estimation, with the
term “time-on-shelf” referring to the time after the of product’s manufacture (and/or
commercialization). The comparison between the observed (actual) and the estimated
(predicted) microbial contamination and time-on-shelf is illustrated in Figure 26, whereas the
performance metrics of the models correlating each one of these properties on the basis of the
spectral data provided by each one of the tested sensors (FTIR, NIR and VIS) are provided in
Table 13.
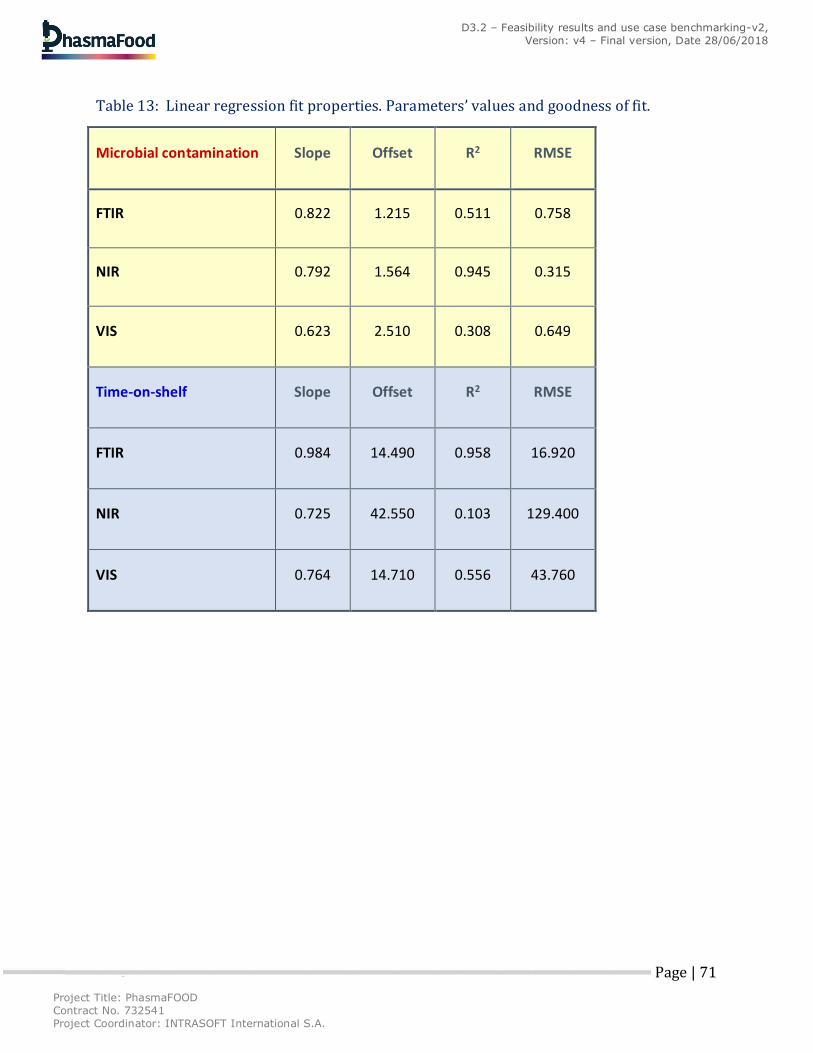
Project Title: PhasmaFOOD Contract No. 732541 Project Coordinator: INTRASOFT International S.A.
Page | 71
D3.2 – Feasibility results and use case benchmarking-v2, Version: v4 – Final version, Date 28/06/2018
Table 13: Linear regression fit properties. Parameters’ values and goodness of fit.
Microbial contamination Slope Offset R2 RMSE
FTIR 0.822 1.215 0.511 0.758
NIR 0.792 1.564 0.945 0.315
VIS 0.623 2.510 0.308 0.649
Time-on-shelf Slope Offset R2 RMSE
FTIR 0.984 14.490 0.958 16.920
NIR 0.725 42.550 0.103 129.400
VIS 0.764 14.710 0.556 43.760
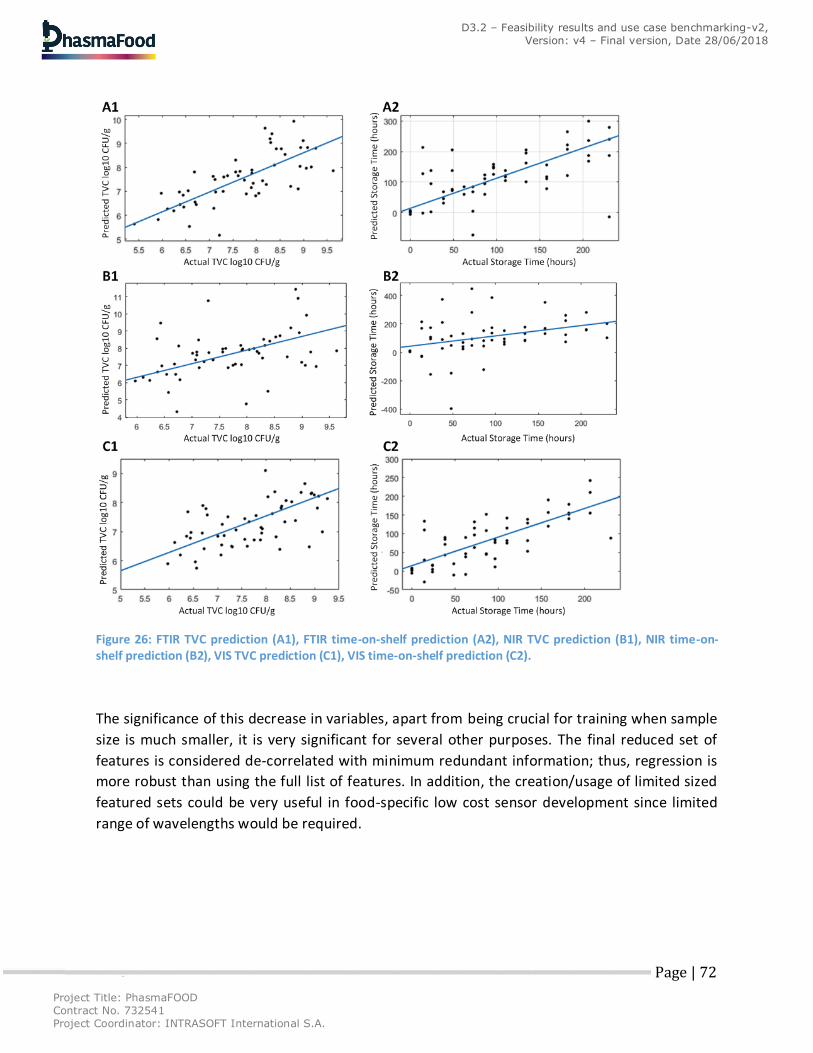
Project Title: PhasmaFOOD Contract No. 732541 Project Coordinator: INTRASOFT International S.A.
Page | 72
D3.2 – Feasibility results and use case benchmarking-v2, Version: v4 – Final version, Date 28/06/2018
Figure 26: FTIR TVC prediction (A1), FTIR time-on-shelf prediction (A2), NIR TVC prediction (B1), NIR time-on-shelf prediction (B2), VIS TVC prediction (C1), VIS time-on-shelf prediction (C2).
The significance of this decrease in variables, apart from being crucial for training when sample
size is much smaller, it is very significant for several other purposes. The final reduced set of
features is considered de-correlated with minimum redundant information; thus, regression is
more robust than using the full list of features. In addition, the creation/usage of limited sized
featured sets could be very useful in food-specific low cost sensor development since limited
range of wavelengths would be required.

Project Title: PhasmaFOOD Contract No. 732541 Project Coordinator: INTRASOFT International S.A.
Page | 73
D3.2 – Feasibility results and use case benchmarking-v2, Version: v4 – Final version, Date 28/06/2018
5.3 Feasibility of micro-sensor application for detection of fraud
5.3.1 General food test
In order to make the other partners familiar with the capabilities of the NIR spectrometer, IPMS
had previously carried out some trial measurements to demonstrate the NIR signals of several
different foods measured in transflection geometry. These measurements were done to
illustrate the properties, potential and pitfalls of NIR measurements as well as to demonstrate
typical NIR spectra obtained with the SGS1900 NIR spectrometer. The results of this trial, which
was mainly related to use case 3 but was also instructive to the other use cases, were reported
in detail in D3.1.
5.3.2 Milk powder
Prior to OCC, SMP triplicates were evaluated for consistency per sensor (FLUO, VIS and NIR). In
Figure 27 an example is displayed on a sample outlier (red tetragon) and a faulty triplicate
(yellow tetragons). In order to assess the feasibility of this sub-use case, it is imperative that
divergent measurements are identified and (for the moment) are omitted for OCC. For the in
total 96 spectra per sensor (total amount of spectra: 288), 12 spectra were assigned as outliers
for the FLUO and VIS sensor, and 8 for the NIR sensor. Approximately 8 - 12 % of the
measurements were assigned as outliers. This amount of outliers is too high for a good
application in practice for the PhasmaFOOD sensor. The main reason for this high amount of
outliers is most probable the many degrees of freedom the individual pilot sensors have, i.e. it
is hard for the user of the pilot sensors to acquire replicates of good quality. With the
PhasmaFOOD sensor, this problem should be resolved as the device is optimized for measuring
food stuffs.
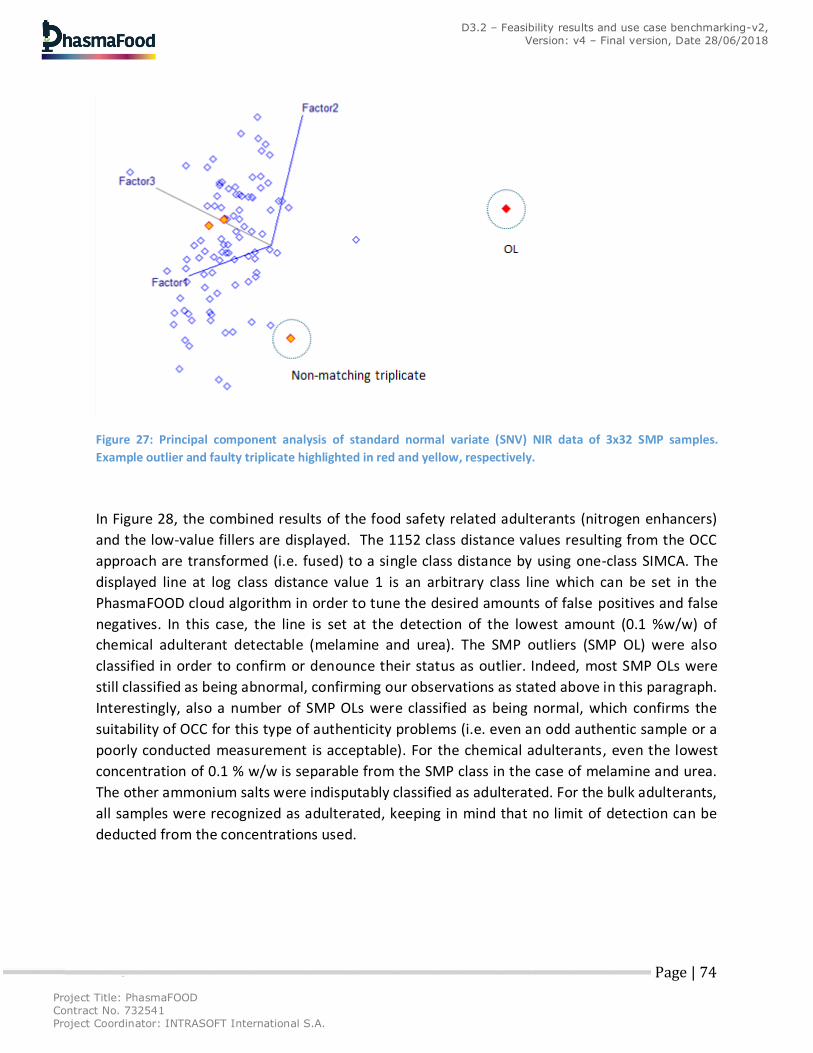
Project Title: PhasmaFOOD Contract No. 732541 Project Coordinator: INTRASOFT International S.A.
Page | 74
D3.2 – Feasibility results and use case benchmarking-v2, Version: v4 – Final version, Date 28/06/2018
Figure 27: Principal component analysis of standard normal variate (SNV) NIR data of 3x32 SMP samples.
Example outlier and faulty triplicate highlighted in red and yellow, respectively.
In Figure 28, the combined results of the food safety related adulterants (nitrogen enhancers)
and the low-value fillers are displayed. The 1152 class distance values resulting from the OCC
approach are transformed (i.e. fused) to a single class distance by using one-class SIMCA. The
displayed line at log class distance value 1 is an arbitrary class line which can be set in the
PhasmaFOOD cloud algorithm in order to tune the desired amounts of false positives and false
negatives. In this case, the line is set at the detection of the lowest amount (0.1 %w/w) of
chemical adulterant detectable (melamine and urea). The SMP outliers (SMP OL) were also
classified in order to confirm or denounce their status as outlier. Indeed, most SMP OLs were
still classified as being abnormal, confirming our observations as stated above in this paragraph.
Interestingly, also a number of SMP OLs were classified as being normal, which confirms the
suitability of OCC for this type of authenticity problems (i.e. even an odd authentic sample or a
poorly conducted measurement is acceptable). For the chemical adulterants, even the lowest
concentration of 0.1 % w/w is separable from the SMP class in the case of melamine and urea.
The other ammonium salts were indisputably classified as adulterated. For the bulk adulterants,
all samples were recognized as adulterated, keeping in mind that no limit of detection can be
deducted from the concentrations used.
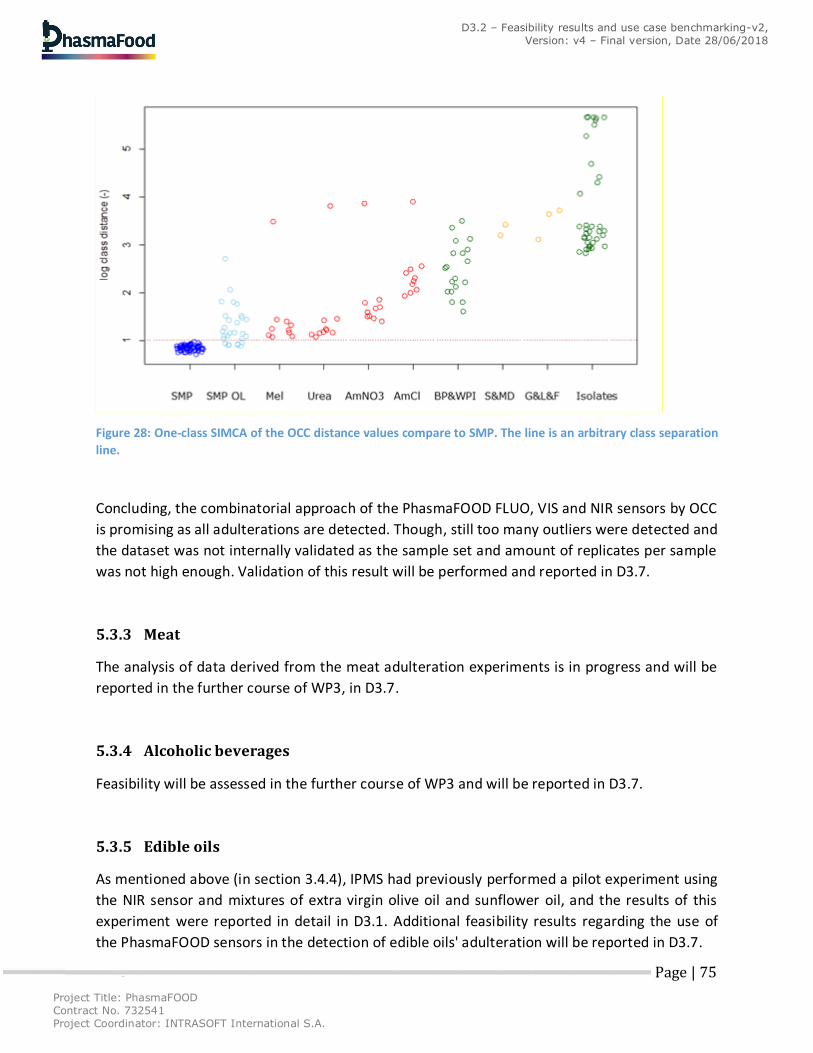
Project Title: PhasmaFOOD Contract No. 732541 Project Coordinator: INTRASOFT International S.A.
Page | 75
D3.2 – Feasibility results and use case benchmarking-v2, Version: v4 – Final version, Date 28/06/2018
Figure 28: One-class SIMCA of the OCC distance values compare to SMP. The line is an arbitrary class separation
line.
Concluding, the combinatorial approach of the PhasmaFOOD FLUO, VIS and NIR sensors by OCC
is promising as all adulterations are detected. Though, still too many outliers were detected and
the dataset was not internally validated as the sample set and amount of replicates per sample
was not high enough. Validation of this result will be performed and reported in D3.7.
5.3.3 Meat
The analysis of data derived from the meat adulteration experiments is in progress and will be
reported in the further course of WP3, in D3.7.
5.3.4 Alcoholic beverages
Feasibility will be assessed in the further course of WP3 and will be reported in D3.7.
5.3.5 Edible oils
As mentioned above (in section 3.4.4), IPMS had previously performed a pilot experiment using
the NIR sensor and mixtures of extra virgin olive oil and sunflower oil, and the results of this
experiment were reported in detail in D3.1. Additional feasibility results regarding the use of
the PhasmaFOOD sensors in the detection of edible oils' adulteration will be reported in D3.7.
Project Title: PhasmaFOOD Contract No. 732541 Project Coordinator: INTRASOFT International S.A.
Page | 76
D3.2 – Feasibility results and use case benchmarking-v2, Version: v4 – Final version, Date 28/06/2018
6 Conclusions and outlook The present D3.2 report, being the second in a series of successive reports, is a compilation of
all additional collected information and experimental data until M18 of the PhasmaFOOD
project, allowing for an updated (compared to that provided in D3.1 report) feasibility
assessment of the proposed use cases (i.e., detection of mycotoxins, spoilage and fraud).
Overall, in the framework of D3.2, elaboration upon planning, sampling and measurement
strategies, standard operating procedures of the VIS and NIR sensors, as well as reference
methods and chemometric protocols has been provided. More specifically, the newly obtained
information presented in this deliverable is pertinent to (i) updated results on mycotoxins'
detection in the sub-use case of maize flour and preliminary results with reference to tree nuts
(almonds) using the VIS sensor; (ii) extensive experimental data reporting along with data
analysis approaches on detection of spoilage of the sub-use cases of fish, meat, fruit (i.e.
pineapple) and vegetables (i.e. rocket salad and baby spinach) using mainly the NIR and VIS
sensors (both visible reflectance and fluorescence measurements); and (iii) experiments
assessing the applicability of the PhasmaFOOD sensors to food fraud detection concerning skim
milk powder and minced meat.
The forthcoming research goals that, in the context of WP3, are anticipated to be completed
and reported in the final deliverable report (D3.7 – M27), involve the continuation and
evolution of data analysis for the already collected data, as well as the initiation and completion
of experiments for the rest of the sub-use cases that have not been investigated yet. With
reference to use case 1 (detection of mycotoxins), tests in the sub-use cases of milk powder and
paprika powder, with the expected measurement set-up being similar to the one used in grain
(i.e. maize) and almond flour, are planned to be conducted. Regarding use case 2 (detection of
spoilage and prediction of shelf-life), next objectives include analysis of data derived from the
fish/minced pork/pineapple/baby spinach experiments (described in the present deliverable
report), as well as conductance of new experiments using the first PhasmaFOOD prototype in
representative sub-use cases. Finally, with regard to use case 3 (detection of food fraud), in
addition to the pilot measurements in edible oils provided in D3.1 report and the already
conducted measurements in skimmed milk powder and minced meat, forthcoming goals
include (i) analysis of collected data on meat adulteration; and (ii) acquisition of additional
experimental data (and corresponding data analysis) on skim milk powder, alcoholic beverages
and edible oils.
Project Title: PhasmaFOOD Contract No. 732541 Project Coordinator: INTRASOFT International S.A.
Page | 77
D3.2 – Feasibility results and use case benchmarking-v2, Version: v4 – Final version, Date 28/06/2018
References [1] Nemme, K, & Mohammed, A (2017). Mycotoxin occurrence in grains and the role of
postharvest management as a mitigation strategy. A review. Food Control, 78, 412-425.
[2] Zachariasova, M, Dzuman, Z, Veprikova, Z, Hajkova, K, Jiru, M, Vaclavikova, M, Zachariasova,
A, Pospichalova, M, Florian, M, & Hajslova, J (2014). Occurrence of multiple mycotoxins in
European feedingstuffs, assessment of dietary intake by farm animals. Animal Feed Science and
Technology, 193, 124-140.
[3] Borchers, AT, Chang, C, & Gershwin, ME (2017). Mold and human health: a reality check.
Clinical Reviews in Allergy & Immunology, 52, 305-322.
[4] Miedaner, T, Han, S, Kessel, B, Ouzunova, M, Schrag, T, Utz, FH, & Melchinger, AE (2015).
Prediction of deoxynivalenol and zearalenone concentrations in Fusarium graminearum
inoculated backcross populations of maize by symptom rating and near-infrared spectroscopy.
Plant Breeding, 134, 529-534.
[5] Chauhan, R, Singh, J, Sachdev, T, Basu, T, & Malhotra, BD (2016). Recent advances in
mycotoxins detection. Biosensors and Bioelectronics, 81, 532-545.
[6] Hernández, DB, Mishra, RK, Muñoz, R, & Marty, JM (2017). Low cost optical device for
detection of fluorescence from Ochratoxin A using a CMOS sensor. Sensors and Actuators B,
246, 606-614.
[7] Kos, G, Sieger, M, McMullin, D, Zahradnik, C, Sulyok, M, Öner, T, Mizaikoff, B, & Krska, R
(2016). A novel chemometric classification for FTIR spectra of mycotoxin-contaminated maize
and peanuts at regulatory limits. Food Additives & Contaminants: Part, 33, 1596-1607.
[8] Orlov, AV, Burenin, AG, Massarskaya, NG, Betin, AV, Nikitin, MP, & Nikitin, PI (2017). Highly
reproducible and sensitive detection of mycotoxins by label-free biosensors. Sensors and
Actuators B, 246, 1080-1084.
[9] Sharma A, Goud, KY, Hayat, A, Bhand, S, & Marty, JL (2017). Recent advances in
electrochemical-based sensing platforms for aflatoxins detection. Chemosensors, 5, 1;
doi:10.3390/chemosensors5010001.
[10] Toro, PCD, Arévalo, FJ, Fumero, MV, Zon, MA, & Fernández, H. (2016). Very sensitive
electrochemical sensor for moniliformin detection in maize samples. Sensors and Actuators B,
225, 384-390.
[11] Wang, W, Ni, X, Lawrence, KC, Yoon, S-C, Heitschmidt, GW, & Feldner, P (2015). Feasibility
of detecting Aflatoxin B1 in single maize kernels using hyperspectral imaging. Journal of Food
Engineering, 166, 182-192.
Project Title: PhasmaFOOD Contract No. 732541 Project Coordinator: INTRASOFT International S.A.
Page | 78
D3.2 – Feasibility results and use case benchmarking-v2, Version: v4 – Final version, Date 28/06/2018
[12] Leitzmann, C (1993). Food quality-definition and holistic view. In H. Sommer, B. Petersen, &
P. v. Wittke (Eds.), Safeguarding Food Quality (pp. 3-15). Berlin, Heidelberg: Springer-Verlag.
[13] Hamad, SH (2012). Factors affecting the growth of microorganisms in food. In R. Bhat, A.
Karim Alias, & G. Paliyath (Eds.), Progress in food preservation (pp. 405-427). Oxford: Wiley-
Blackwell.
[14] Koutsoumanis, K, & Nychas, G-JE (2000). Application of a systematic experimental
procedure to develop a microbial model for rapid fish shelf-life predictions. International
Journal of Food Microbiology, 60, 171-184.
[15] Ellis, DI, & Goodacre, R (2001). Rapid and quantitative detection of the microbial spoilage
of muscle foods: current status and future trends. Trends in Food Science and Technology, 12,
414-424.
[16] Karoui, R, & De Baerdemaeker, J (2007). A review of the analytical methods coupled with
chemometric tools for the determination of the quality and identity of dairy products. Food
Chemistry, 102, 621-640.
[17] Dufour, E (2011). Recent advances in the analysis of dairy product quality using methods
based on the interactions of light with matter. International Journal of Dairy Technology, 64,
153-165.
[18] Papadopoulou, OS, Panagou, EZ, Mohareb, F, & Nychas, G.-J. E. (2013). Sensory and
microbiological quality assessment of beef fillets using a portable electronic nose in tandem
with support vector machine analysis. Food Research International, 50, 241–249.
[19] Porep, JU, Kammerer, DR, & Carle, R (2015). On-line application of near infrared (NIR)
spectroscopy in food production. Trends in Food Science and Technology, 46, 211-230.
[20] Xiong, Z, Xie, A, Sun, D-W, Zeng, X-A, & Liu, D (2015). Applications of hyperspectral imaging
in chicken meat safety and quality detection and evaluation: A review. Critical Reviews in Food
Science and Nutrition, 55, 1287-1301.
[21] ICMSF (International Commission on Microbiological Specifications for Foods) (1986).
Sampling plans for fish and shellfish, in: Microorganisms in Foods 2. Sampling for
microbiological analysis: Principles and specific applications, 2nd ed. Blackwell Scientific,
Oxford, pp. 181–196.
[22] Ministére de l’Economie des Finances et du Budget (1988). Marché consummation,
produits vegetaux prêts á l’emploi dits de la “IVemme gamme”: guide de bonnes pratique
hygiéniques. J. Off République Française, 1621, 1-29.
[23] USP Pharmacopeia Convention Food Fraud Database. https://www.foodfraud.org/.
Project Title: PhasmaFOOD Contract No. 732541 Project Coordinator: INTRASOFT International S.A.
Page | 79
D3.2 – Feasibility results and use case benchmarking-v2, Version: v4 – Final version, Date 28/06/2018
[24] Fernandes, JK, Umebara, T, Lenzi, MK, & Alves, ETD (2013). Image analysis for composition
monitoring. Commercial blends of olive and soybean oil. Acta Scientarum-Technology, 35, 317-
324.
[25] Ottavian, M, Fasolato, L, Serva, L, Facco, P, Massimiliano, B (2014). Food and Bioprocess
Technology, 7, 1025-1036.
[26] Ropodi, AI, Pavlidis, DE, Mohareb, F, Panagou, EZ, & Nychas, G-JE (2015). Multispectral
image analysis approach to detect adulteration of beef and pork in raw meats. Food Research
International, 67, 12–18.
[27] Ropodi, AI, Panagou, EZ, & Nychas, G-JE (2016). Data mining derived from food analyses
using non-invasive/non-destructive analytical techniques; determination of food authenticity,
quality & safety in tandem with computer science disciplines. Trends in Food Science and
Technology, 50, 11-25.
[28] Ropodi, AI, Panagou, EZ, & Nychas, G-JE (2017). Multispectral imaging (MSI): A promising
method for the detection of minced beef adulteration with horsemeat. Food Control, 73, 57-63.
[29] Pügner, T., Knobbe, J., & Grüger, H. (2016). Near infrared grating spectrometer for mobile
phone applications. Applied Spectroscopy, 70, 734-745.
[30] Hiperscan GmbH, https://www.hiperscan.com/de/sgs1900
[31] Carstensen, JM, & Hansen, JF (2003). An apparatus and a method of recording an image of
an object. Patent family EP1051660.
[32] Panagou, EZ, Papadopoulou, O, Carstensen, JM, & Nychas, G-JE (2014). Potential of
multispectral imaging technology for rapid and non-destructive determination of the
microbiological quality of beef filets during aerobic storage. International Journal of Food
Microbiology, 174, 1-11.
[33] ISO 12966-4:2015(en) Animal and vegetable fats and oils — Gas chromatography of fatty
acid methyl esters — Part 4: Determination by capillary gas chromatography.
[34] COMMISSION REGULATION (EC) No 273/2008 of 5 March 2008 laying down detailed rules
for the application of Council Regulation (EC) No 1255/1999 as regards methods for the analysis
and quality evaluation of milk and milk products.
[35] Karunathilaka, SR, Farris, S, Mossoba, MM, Moore, JC, & Yakes, BJ (2017). Non-targeted
detection of milk powder adulteration using Raman spectroscopy and chemometrics: melamine
case study. Food additives & contaminants. Part A, Chemistry, analysis, control, exposure & risk
assessment, 34, 170-182.
Project Title: PhasmaFOOD Contract No. 732541 Project Coordinator: INTRASOFT International S.A.
Page | 80
D3.2 – Feasibility results and use case benchmarking-v2, Version: v4 – Final version, Date 28/06/2018
[36] Capuano, E, Boerrigter-Eenling, R, Koot, A, van Ruth, SM (2015). Targeted and untargeted
detection of skim milk powder adulteration by near-infrared spectroscopy. Food Analytical
Methods, 8, 2125-2134.
[37] COMMISSION REGULATION (EC) No 2870/2000 of 19 December 2000 laying down
Community reference methods for the analysis of spirits drinks.
[38] Breiman, L (2001). Random Forests. Machine Learning, 45, 5-32. doi:
10.1023/A:1010933404324.


![Mid-infrared photonic crystal cavities · Mid-infrared photonic devices could be used to create miniaturised sensitive detectors for these gases[3]. High-power nonlinear optics devices](https://img.pdfslide.us/doc/110x75/5fa726d81269b625b8019fc5/mid-infrared-photonic-crystal-cavities-mid-infrared-photonic-devices-could-be-used.jpg)


![Novel Design for Photonic Crystal Ring Resonators Based ...jopn.miau.ac.ir/article_3046_01eb01affabdaa909e9328069782f311.pdf · employing photonic crystals [4]. In recent years, photonic](https://img.pdfslide.us/doc/110x75/5e7ed386707cf3599e6c8522/novel-design-for-photonic-crystal-ring-resonators-based-jopnmiauacirarticle304601eb01affabd.jpg)