Embed Size (px)
Citation preview
Delft University of Technology
Experimental evidence of liquid feeding during solidification of a steel
Agarwal, G.; Amirthalingam, M.; Moon, S. C.; Dippenaar, R. J.; Richardson, I. M.; Hermans, M. J.M.
DOI10.1016/j.scriptamat.2017.11.003Publication date2018Document VersionAccepted author manuscriptPublished inScripta Materialia
Citation (APA)Agarwal, G., Amirthalingam, M., Moon, S. C., Dippenaar, R. J., Richardson, I. M., & Hermans, M. J. M.(2018). Experimental evidence of liquid feeding during solidification of a steel. Scripta Materialia, 146, 105-109. https://doi.org/10.1016/j.scriptamat.2017.11.003
Important noteTo cite this publication, please use the final published version (if applicable).Please check the document version above.
CopyrightOther than for strictly personal use, it is not permitted to download, forward or distribute the text or part of it, without the consentof the author(s) and/or copyright holder(s), unless the work is under an open content license such as Creative Commons.
Takedown policyPlease contact us and provide details if you believe this document breaches copyrights.We will remove access to the work immediately and investigate your claim.
This work is downloaded from Delft University of Technology.For technical reasons the number of authors shown on this cover page is limited to a maximum of 10.
Experimental evidence of liquid feeding during solidification of asteel
G. Agarwala,∗, M. Amirthalingamb, S.C. Moonc, R.J. Dippenaarc, I.M. Richardsona,M.J.M. Hermansa
aDepartment of Materials Science and Engineering, Faculty of 3mE, Delft University of Technology, Mekelweg 2,2628CD, Delft, The Netherlands
bDepartment of Metallurgical and Materials Engineering, Indian Institute of Technology Madras, Chennai, 600036,India
cSchool of Mechanical, Materials and Mechatronic Engineering, Faculty of Engineering and Information Sciences,University of Wollongong, Wollongong, Australia
AbstractSufficient liquid feeding under constrained solidification conditions like, those experienced inwelding and casting, is vital to avoid solidification cracking. We present the results of uniquein-situ experimental observations of liquid feeding in a solidifying steel melt pool. Liquid feedingwas observed in the inter-cellular regions during the terminal stage of solidification. An averageliquid flow speed of 450-500 µm s−1 was found. A pressure difference of the order of 104 Pa iscalculated to cause the liquid flow. The rate of solidification shrinkage and the rate of deformationwere found to be less than the rate of liquid feeding.
Keywords: Solidification, Steel, Solidification cracking, Hot tearing, In-situ
Some alloys are susceptible to cracking during solidification [1]. Solidification cracking during1
welding (similar to hot tearing during casting) has been studied for several decades [2, 3, 4, 5, 6].2
Presently, it is accepted that a complex interplay between two fundamental factors; solidifying3
microstructure and restraint, leads to solidification cracking [7]. Upon cooling, a solidifying melt4
contracts due to both solidification shrinkage and thermal contraction. As the dendritic network5
becomes coherent, thermal strains are induced. If the remaining liquid is not able to compensate6
this deformation, cracking occurs. Eskin et al. [8] reviewed various hot tearing models for casting,7
including critical stress, strain and strain rate based criteria that lead to cracking. Nevertheless, a8
unified model involving the dominant physical factors is still lacking. This is partly due to the9
fact that solidification cracking occurs close to the solidus temperature (1673 K and above for10
low carbon steels) involving solid and liquid phases (mushy zone), limiting the scope of direct11
experimental based investigations. As a result, the various theories and models are rather difficult12
to verify.13
Metallurgical factors that affect the cracking susceptibility include solidification temperature14
range, dendrite coherency, surface tension of the interdendritic liquid, viscosity, liquid feeding15
∗Corresponding authorEmail address: [email protected] (G. Agarwal)
Preprint submitted to Elsevier November 3, 2017
© 2017 Manuscript version made available under CC-BY-NC-ND 4.0 license https://creativecommons.org/licenses/by-nc-nd/4.0/
tendency, grain size and shape, solute segregation in the final stages of solidification etc. Liquid16
feeding is one of the most important factors that helps to avoid solidification cracking and likewise,17
is included in most of the models [1, 9, 10]. The early work of Feurer [9] was based on rate18
of feeding and rate of shrinkage effects on hot cracking phenomena. Cracking occurs if during19
solidification, the rate of feeding of the liquid in the inter-dendritic region is less than the rate of20
shrinkage of the solid being formed. The model proposed by Rappaz et al. [10] considered liquid21
feeding due to deformation of the coherent dendritic network and shrinkage. If the liquid feeding22
in the inter-dendritic region of the mushy zone is insufficient to compensate for the shrinkage and23
cumulative deformation of the mushy zone, the pressure drops below a certain cavitation pressure24
and voids form, grow and eventually coalesce to form a crack. Recently, Kou [1] proposed a model25
focussing on similar events occurring at grain boundary level.26
Observing the solidification process in the mushy zone in welding conditions is difficult. In27
the past decade, high energy X-rays sources have facilitated the in-situ study of solidification be-28
haviour in many metallic materials [11, 12, 13, 14]. These studies are mostly focussed on Al-Cu,29
Sn-Pb, Al-Ni and other such systems with relatively low liquidus temperatures [15]. Studies in Fe-30
C systems are in general focussed on solid state phase transformations. Nagira et al. [15] observed31
in-situ deformation in semi-solid carbon steel. They studied the deformation mechanism under di-32
rect shear of the steel with a globular morphology and solid fraction between 55-65 %. Several33
other techniques like directional solidification (Bridgman technique [16]), high speed camera ob-34
servations of the weld pool solidification [17] etc. are also frequently used to study solidification35
phenomena. None of the studies, however, have reported direct observation of liquid flow during36
the terminal stages of solidification.37
In this work, solidification of a dual phase steel was observed in-situ using high temperature38
laser scanning confocal microscopy. This technique is frequently used to study in-situ solidifica-39
tion events like peritectic transformations and solid-state transformations, details of which can be40
found in the literature [18, 19]. In the present work, a circular melt pool was formed at the centre41
of a thin circular disk specimen while the outer rim remained solid. The solid outer rim acted as a42
restraint to the solidifying melt pool, thus allowing the simulation of welding conditions. During43
the terminal stages of solidification, liquid feeding was observed in inter-cellular regions. The44
feeding rate in these regions is calculated and subsequently the pressure that causes liquid feeding45
is estimated.46
A commercial dual phase steel sheet with a composition, C 0.15, Mn 2.3, Cr 0.56, Si 0.1, Al47
0.03, P 0.01 (all in wt. %) was examined in this study. Circular disk specimens with a diameter48
of 10 mm and a thickness between 200 µm - 250 µm were prepared using electro-discharge ma-49
chining. Each specimen was placed in an alumina crucible. To minimise direct contact with the50
alumina crucible, the sample was held by ceramic protrusions at the circumference of the crucible.51
The crucible in turn was held in a platinum holder. A B-type thermocouple wire was welded to the52
platinum holder. Specimens were placed at the upper focal point of a gold plated ellipsoidal cavity53
in an infra-red furnace beneath a quartz view port under an ultra-high purity inert gas atmosphere,54
>99.9999% Ar. A 1.5 kW halogen lamp located at the lower focal point in the cavity heats the55
specimen by radiation. The power input to the halogen lamp is controlled by an Omron ES100P56
digital PID controller, which in turn was connected to the thermocouple at the crucible holder for57
a feedback signal. The temperature measured by the thermocouple incorporated in the crucible58
Cellular growth
1
2
(a) (b)
(c) (d)
100 μm 100 μm
100 μm100 μm
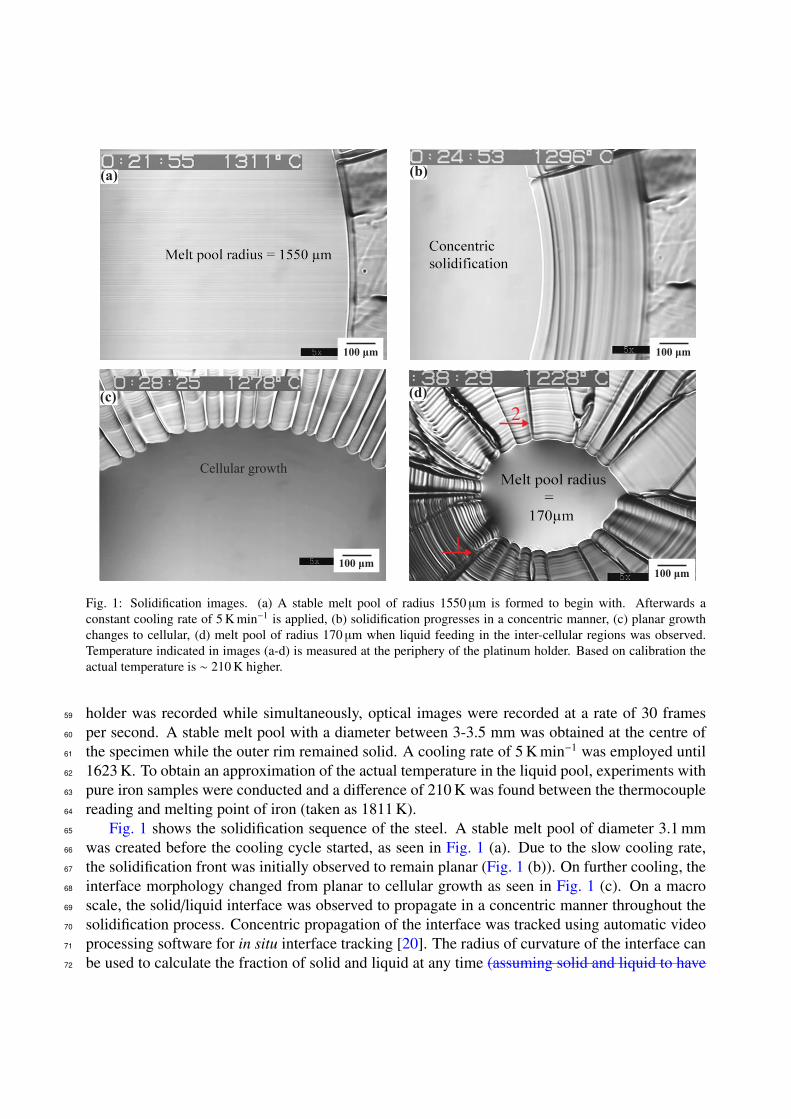
Fig. 1: Solidification images. (a) A stable melt pool of radius 1550 µm is formed to begin with. Afterwards aconstant cooling rate of 5 K min−1 is applied, (b) solidification progresses in a concentric manner, (c) planar growthchanges to cellular, (d) melt pool of radius 170 µm when liquid feeding in the inter-cellular regions was observed.Temperature indicated in images (a-d) is measured at the periphery of the platinum holder. Based on calibration theactual temperature is ∼ 210 K higher.
holder was recorded while simultaneously, optical images were recorded at a rate of 30 frames59
per second. A stable melt pool with a diameter between 3-3.5 mm was obtained at the centre of60
the specimen while the outer rim remained solid. A cooling rate of 5 K min−1 was employed until61
1623 K. To obtain an approximation of the actual temperature in the liquid pool, experiments with62
pure iron samples were conducted and a difference of 210 K was found between the thermocouple63
reading and melting point of iron (taken as 1811 K).64
Fig. 1 shows the solidification sequence of the steel. A stable melt pool of diameter 3.1 mm65
was created before the cooling cycle started, as seen in Fig. 1 (a). Due to the slow cooling rate,66
the solidification front was initially observed to remain planar (Fig. 1 (b)). On further cooling, the67
interface morphology changed from planar to cellular growth as seen in Fig. 1 (c). On a macro68
scale, the solid/liquid interface was observed to propagate in a concentric manner throughout the69
solidification process. Concentric propagation of the interface was tracked using automatic video70
processing software for in situ interface tracking [20]. The radius of curvature of the interface can71
be used to calculate the fraction of solid and liquid at any time (assuming solid and liquid to have72
equal density). Fig. 1 (d) shows the terminal stage of the solidification during which the liquid73
feeding was observed in the inter-cellular regions. The fraction of liquid remaining was ≈ 1.2 %74
when compared to the original melt pool size. Two regions where liquid feeding was observed are75
marked in Fig. 1 (d) and further shown in Fig. 2 and Fig. 3 respectively. The liquid source for the76
feeding is the liquid remaining during the final stage of solidification in the centre. The process77
was dynamic and occurred in a matter of a few seconds. For better visualisation of the liquid flow,78
the reader can refer to the video file included as a supplement in the online version of this article.79
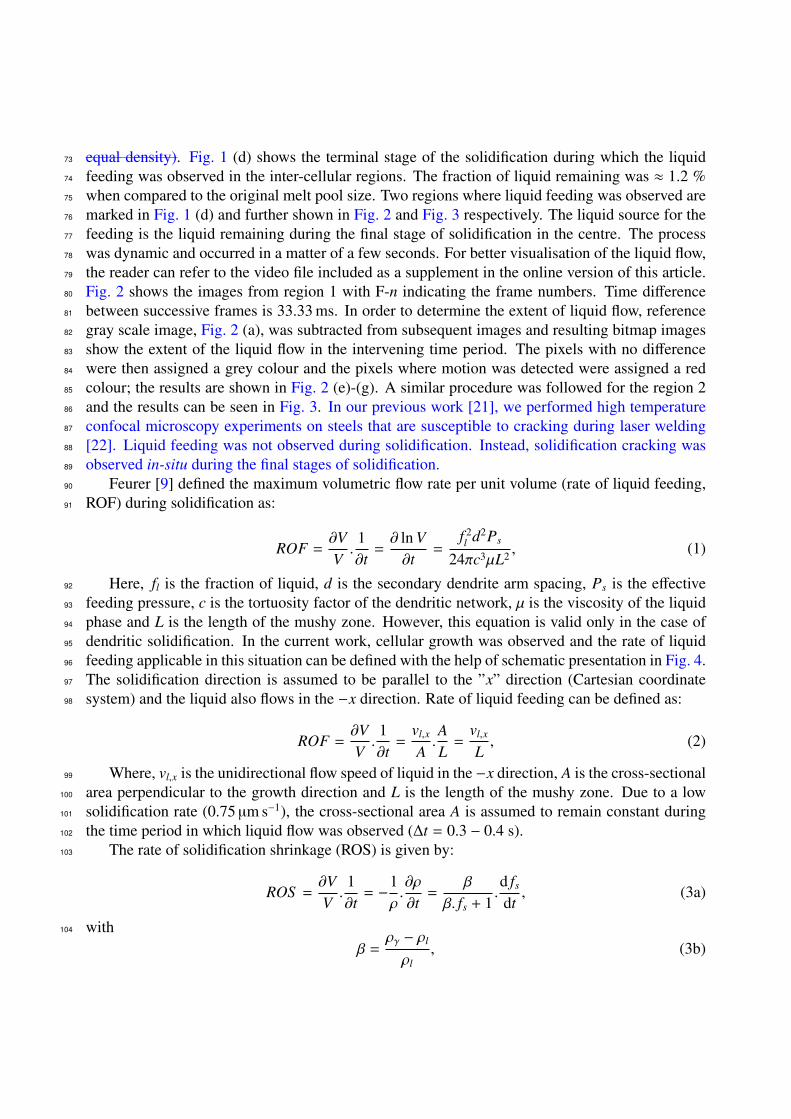
Fig. 2 shows the images from region 1 with F-n indicating the frame numbers. Time difference80
between successive frames is 33.33 ms. In order to determine the extent of liquid flow, reference81
gray scale image, Fig. 2 (a), was subtracted from subsequent images and resulting bitmap images82
show the extent of the liquid flow in the intervening time period. The pixels with no difference83
were then assigned a grey colour and the pixels where motion was detected were assigned a red84
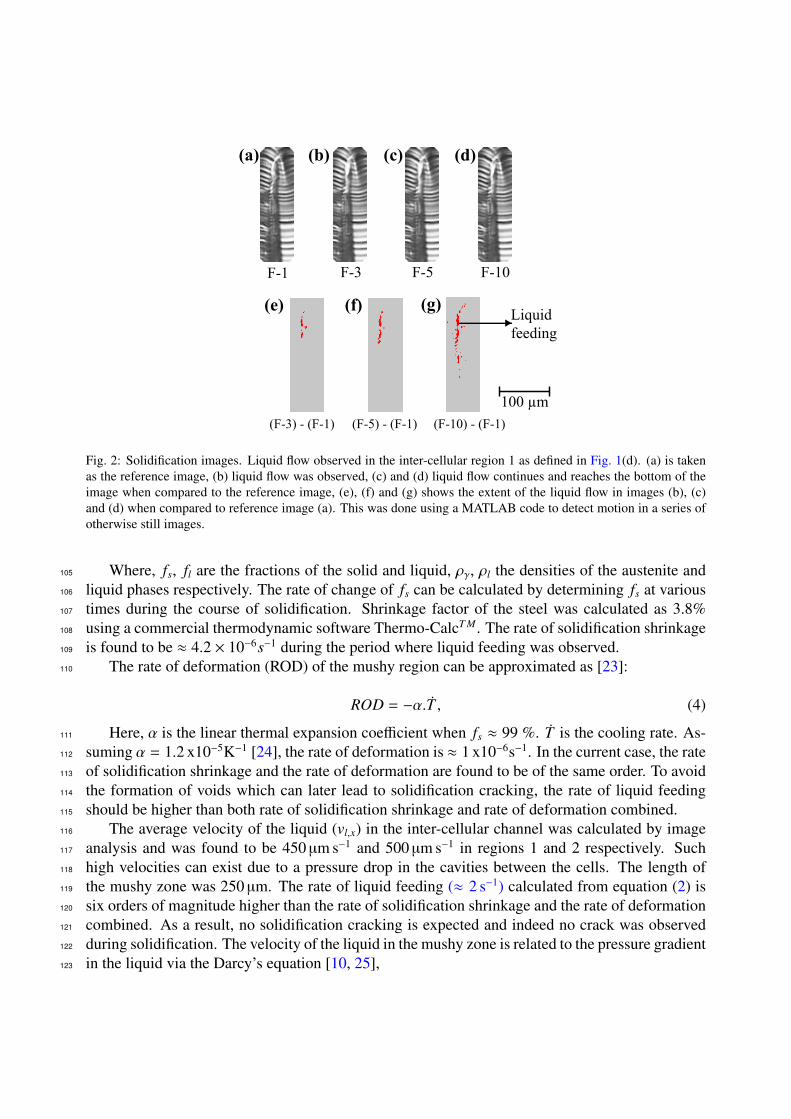
colour; the results are shown in Fig. 2 (e)-(g). A similar procedure was followed for the region 285
and the results can be seen in Fig. 3. In our previous work [21], we performed high temperature86
confocal microscopy experiments on steels that are susceptible to cracking during laser welding87
[22]. Liquid feeding was not observed during solidification. Instead, solidification cracking was88
observed in-situ during the final stages of solidification.89
Feurer [9] defined the maximum volumetric flow rate per unit volume (rate of liquid feeding,90
ROF) during solidification as:91
ROF =∂VV.
1∂t
=∂ ln V∂t
=f 2l d2Ps
24πc3µL2 , (1)
Here, fl is the fraction of liquid, d is the secondary dendrite arm spacing, Ps is the effective92
feeding pressure, c is the tortuosity factor of the dendritic network, µ is the viscosity of the liquid93
phase and L is the length of the mushy zone. However, this equation is valid only in the case of94
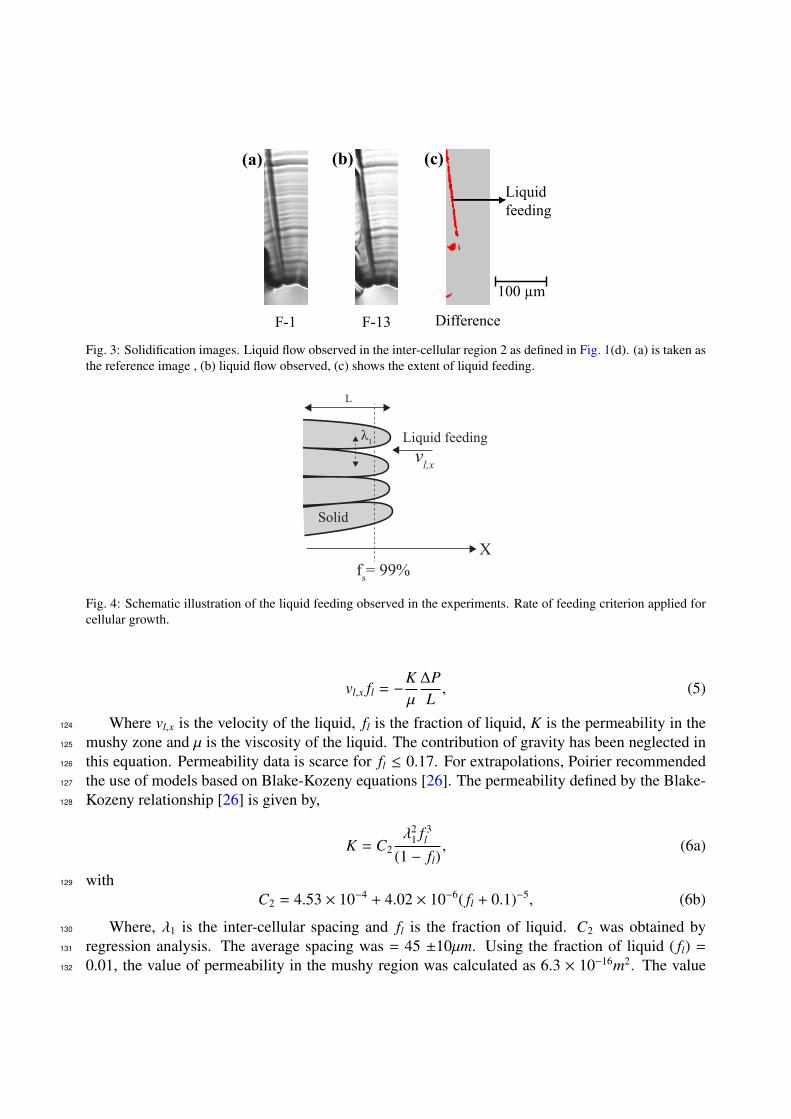
dendritic solidification. In the current work, cellular growth was observed and the rate of liquid95
feeding applicable in this situation can be defined with the help of schematic presentation in Fig. 4.96
The solidification direction is assumed to be parallel to the ”x” direction (Cartesian coordinate97
system) and the liquid also flows in the −x direction. Rate of liquid feeding can be defined as:98
ROF =∂VV.
1∂t
=vl,x
A.AL
=vl,x
L, (2)
Where, vl,x is the unidirectional flow speed of liquid in the −x direction, A is the cross-sectional99
area perpendicular to the growth direction and L is the length of the mushy zone. Due to a low100
solidification rate (0.75 µm s−1), the cross-sectional area A is assumed to remain constant during101
the time period in which liquid flow was observed (∆t = 0.3 − 0.4 s).102
The rate of solidification shrinkage (ROS) is given by:103
ROS =∂VV.
1∂t
= −1ρ.∂ρ
∂t=
β
β. fs + 1.d fs
dt, (3a)
with104
β =ργ − ρl
ρl, (3b)
(a) (b) (c) (d)
(e) (f) (g)
100 µm
F-1 F-3 F-5 F-10
(F-3) - (F-1) (F-5) - (F-1) (F-10) - (F-1)
Liquidfeeding
Fig. 2: Solidification images. Liquid flow observed in the inter-cellular region 1 as defined in Fig. 1(d). (a) is takenas the reference image, (b) liquid flow was observed, (c) and (d) liquid flow continues and reaches the bottom of theimage when compared to the reference image, (e), (f) and (g) shows the extent of the liquid flow in images (b), (c)and (d) when compared to reference image (a). This was done using a MATLAB code to detect motion in a series ofotherwise still images.
Where, fs, fl are the fractions of the solid and liquid, ργ, ρl the densities of the austenite and105
liquid phases respectively. The rate of change of fs can be calculated by determining fs at various106
times during the course of solidification. Shrinkage factor of the steel was calculated as 3.8%107
using a commercial thermodynamic software Thermo-CalcT M. The rate of solidification shrinkage108
is found to be ≈ 4.2 × 10⁻⁶s−1 during the period where liquid feeding was observed.109
The rate of deformation (ROD) of the mushy region can be approximated as [23]:110
ROD = −α.T , (4)
Here, α is the linear thermal expansion coefficient when fs ≈ 99 %. T is the cooling rate. As-111
suming α = 1.2 x10⁻⁵K−1 [24], the rate of deformation is ≈ 1 x10⁻⁶s−1. In the current case, the rate112
of solidification shrinkage and the rate of deformation are found to be of the same order. To avoid113
the formation of voids which can later lead to solidification cracking, the rate of liquid feeding114
should be higher than both rate of solidification shrinkage and rate of deformation combined.115
The average velocity of the liquid (vl,x) in the inter-cellular channel was calculated by image116
analysis and was found to be 450 µm s−1 and 500 µm s−1 in regions 1 and 2 respectively. Such117
high velocities can exist due to a pressure drop in the cavities between the cells. The length of118
the mushy zone was 250 µm. The rate of liquid feeding (≈ 2 s−1) calculated from equation (2) is119
six orders of magnitude higher than the rate of solidification shrinkage and the rate of deformation120
combined. As a result, no solidification cracking is expected and indeed no crack was observed121
during solidification. The velocity of the liquid in the mushy zone is related to the pressure gradient122
in the liquid via the Darcy’s equation [10, 25],123
F-1 F-13 Difference
(a) (b) (c)
Liquidfeeding
100 µm
Fig. 3: Solidification images. Liquid flow observed in the inter-cellular region 2 as defined in Fig. 1(d). (a) is taken asthe reference image , (b) liquid flow observed, (c) shows the extent of liquid feeding.
vl,x
L
λ1 Liquid feeding
Solid
Xfs= 99%
Fig. 4: Schematic illustration of the liquid feeding observed in the experiments. Rate of feeding criterion applied forcellular growth.
vl,x fl = −Kµ
∆PL, (5)
Where vl,x is the velocity of the liquid, fl is the fraction of liquid, K is the permeability in the124
mushy zone and µ is the viscosity of the liquid. The contribution of gravity has been neglected in125
this equation. Permeability data is scarce for fl ≤ 0.17. For extrapolations, Poirier recommended126
the use of models based on Blake-Kozeny equations [26]. The permeability defined by the Blake-127
Kozeny relationship [26] is given by,128
K = C2λ2
1 f 3l
(1 − fl), (6a)
with129
C2 = 4.53 × 10⁻⁴ + 4.02 × 10⁻⁶( fl + 0.1)−5, (6b)
Where, λ1 is the inter-cellular spacing and fl is the fraction of liquid. C2 was obtained by130
regression analysis. The average spacing was = 45 ±10µm. Using the fraction of liquid ( fl) =131
0.01, the value of permeability in the mushy region was calculated as 6.3 × 10⁻¹⁶m2. The value132
is reasonable since for a Pb - 20 wt. % Sn alloy with primary dendrite arm spacing 51 µm and133
higher liquid fration ( fl = 0.19), Streat et al. [27] reported higher permeability values of the order134
of 10−14m2.135
Considering the fluid behaviour to be Newtonian, the dynamic viscosity (µ) was assumed to be136
constant as 4.9 mPa s [28]. Moreover, the temperature change during which the flow occurred was137
found to be negligible (cooling rate ≈ 0.083 K s−1). The pressure difference was then calculated138
from Darcy’s equation (5) and an average pressure difference (in regions 1 and 2) of the order139
of 104 Pa is found. To the best knowledge of authors, this is the first time that an experimentally140
derived feeding pressure has been reported. While mentioning it as an unknown key value, Rappaz141
et al. [10] assumed a cavitation pressure value of 2 kPa for Al - 1.4 wt. Cu % alloy in their study.142
The higher magnitude in this steel compared to Al-alloys can be attributed to higher cracking143
susceptibility of Al-alloys owing to the large solidification shrinkage contribution (solid, liquid144
density difference ∼ 6-8 %) [29]. Furthermore, Eskin et al. [30] reported higher linear thermal145
expansion coefficient of Al - Cu (1 - 5 wt. %) alloys in the range of (2.8 - 3) × 10−5 K−1. No146
hot tearing or solidification cracking occurred during solidification of the steel in the present case,147
therefore the cavitation pressure for this steel must exceed 104 Pa. Higher cavitation pressure is148
required in order to form a cavity due to the lack of liquid feeding.149
In summary, solidification of a dual phase steel was observed in-situ under a high temperature150
laser scanning confocal microscope. Liquid feeding occurred during the terminal stage of solidifi-151
cation in the inter-cellular regions. Liquid flow speed in the inter-cellular regions was derived and152
the pressure difference that causes liquid flow was estimated by means of Darcy’s equation. It was153
also found that rate of liquid feeding was higher than the rate of solidification shrinkage and rate154
of deformation, combined.155
Acknowledgements156
This research was carried out under project number F22.8.13485a in the framework of the157
Partnership Program of the Materials innovation institute M2i (www.m2i.nl) and the Foundation158
for Fundamental Research on Matter (FOM) (www.fom.nl), which is part of the Netherlands Or-159
ganisation for Scientific Research (www.nwo.nl). The authors would like to thank the industrial160
partner in this project ‘Tata Steel Nederland B.V.’ for the financial support. Professor Laurens161
Katgerman is acknowledged for useful discussion.162
[1] S. Kou, Acta Mater. 88 (2015) 366–374.163
[2] L. Aucott, D. Huang, H. Dong, S. Wen, J. Marsden, A. Rack, A. Cocks, Sci. Rep. 7 (2017).164
[3] S. A. David, T. DebRoy, Science 257 (1992) 497–502.165
[4] W. S. Pellini, Foundry 80 (1952) 124–133.166
[5] N. N. Prokhorov, Svar Proiz 6 (1956) 5–11.167
[6] I. Medovar, Avtomatich. Svarka 7 (1954) 12–28.168
[7] C. E. Cross, in: T. Bollinghaus, H. Herold (Eds.), Hot Cracking Phenomena in Welds, Springer Berlin Heidel-169
berg, 2005, pp. 3–18.170
[8] D. G. Eskin, L. Katgerman, Metall. Mater. Trans. A 38 (2007) 1511–1519.171
[9] U. Feurer, Proceedings of the international symposium on engineering alloys, Delft (1977) 131–145.172
[10] M. Rappaz, J.-M. Drezet, M. Gremaud, Metall. Mater. Trans. A 30 (1999) 449–455.173
[11] H. Yasuda, I. Ohnaka, K. Kawasaki, A. Sugiyama, T. Ohmichi, J. Iwane, K. Umetani, J. Cryst. Growth 262174
(2004) 645 – 652.175
[12] N. Iqbal, N. van Dijk, S. Offerman, M. Moret, L. Katgerman, G. Kearley, Acta Mater. 53 (2005) 2875 – 2880.176
[13] P. Schaffer, R. Mathiesen, L. Arnberg, Acta Mater. 57 (2009) 2887 – 2895.177
[14] R. Mathiesen, L. Arnberg, F. Mo, T. Weitkamp, A. Snigirev, Phys. Rev. Lett. 83 (1999) 5062–5065.178
[15] T. Nagira, C. Gourlay, A. Sugiyama, M. Uesugi, Y. Kanzawa, M. Yoshiya, K. Uesugi, K. Umetani, H. Yasuda,179
Scr. Mater. 64 (2011) 1129 – 1132.180
[16] M. Vandyoussefi, H. Kerr, W. Kurz, Acta Mater. 48 (2000) 2297–2306.181
[17] P. von Witzendorff, S. Kaierle, O. Suttmann, L. Overmeyer, Metall. Mater. Trans. A 46 (2015) 1678–1688.182
[18] H. Shibata, Y. Arai, M. Suzuki, T. Emi, Metall. Mater. Trans. B 31 (2000) 981–991.183
[19] M. Reid, D. Phelan, R. Dippenaar, ISIJ Int. 44 (2004) 565–572.184
[20] S. Griesser, R. Pierer, M. Reid, R. Dippenaar, J. Microsc. 248 (2012) 42–48.185
[21] G. Agarwal, M. Amirthalingam, M. J. M. Hermans, I. M. Richardson, S. C. Moon, R. J. Dippenaar, in: The186
International Symposium on Visualization in Joining and Welding Science through Advanced Measurements187
and Simulation, volume 1, Joining and Welding Research Institute, Osaka University, pp. 113–114.188
[22] H. Gao, G. Agarwal, M. Amirthalingam, M. J. M. Hermans, Sci. Technol. Weld. Join. 0 (2017) 1–8.189
[23] M. Drezet, M. S. F. Lima, J. D. Wagniere, M. Rappaz, W. Kurz, in: P. Mayr, G. Posch, H. Cerjak (Eds.), Proc.190
of the International Institute of Welding Conference, pp. 87–94.191
[24] X. Li, L. Wang, L. Yang, J. Wang, K. Li, J. Mater. Process. Technol. 214 (2014) 1844 – 1851.192
[25] K. Kubo, R. D. Pehlke, Metall. Trans. B 16 (1985) 359–366.193
[26] D. R. Poirier, Metall. Trans. B 18 (1987) 245–255.194
[27] N. Streat, F. Weinberg, Metall. Trans. B 7 (1976) 417–423.195
[28] J. H. Hildebrand, R. H. Lamoreaux, Proc. Natl. Acad. Sci. U.S.A. 73 (1976) 988–989.196
[29] D. G. Eskin, Physical Metallurgy of Direct Chill Casting of Aluminum Alloys, CRC Press, 2008.197
[30] D. G. Eskin, L. Katgerman, Suyitno, J. F. Mooney, Metall. Mater. Trans. A 35 (2004) 1325–1335.198