Embed Size (px)
Citation preview
Delaware River Port Authority/
Port Authority Transit Corporation
Title VI Program
Submitted to the Federal Transit Administration
March 2019
Delaware River Port Authority/Port Authority Transit Corporation
_____________________________________________________________________________________
Title VI Program - March 2019
TABLE OF CONTENTS
INTRODUCTION .................................................................................................................................4
Certifications and Assurances ................................................................................................................... 4
Description of DRPA and the PATCO High Speedline ............................................................................... 4
PATCO Route Map .................................................................................................................................... 5
DRPA Organizational Chart ....................................................................................................................... 8
PATCO Organizational Chart ..................................................................................................................... 9
BOARD APPROVAL DOCUMENTATION .............................................................................................. 10
Delaware River Port Authority Board of Commissioners/Port Authority Transit Directors ................... 11
TITLE VI NOTICE TO THE PUBLIC ........................................................................................................ 15
TITLE VI COMPLAINT PROCEDURES ................................................................................................... 16
Title VI Complaint Form .......................................................................................................................... 17
TRANSIT RELATED TITLE VI INVESTIGATIONS, COMPLAINTS & LAWSUITS ........................................... 19
PUBLIC PARTICIPATION PLAN ........................................................................................................... 20
Goals of the Public Participation Plan ..................................................................................................... 20
Guiding Principles of the Public Participation Process ........................................................................... 21
Public Participation Process .................................................................................................................... 22
DRPA/PATCO Mediums (Bi-Lingual) ........................................................................................................ 24
Public Information Dissemination........................................................................................................... 25
Public Outreach Efforts ........................................................................................................................... 25
Limited English Proficiency Assessment ............................................................................................ 27
Four-Factor Analysis ................................................................................................................................ 28
Language Assistance Plan ....................................................................................................................... 39
NON-ELECTED ADVISORY COUNCIL ................................................................................................... 44
Citizens Advisory Committee (CAC) ........................................................................................................ 44
PROVIDING ASSISTANCE TO SUB-RECIPIENTS .................................................................................... 45
DETERMINE SITE OR LOCATION OF FACILITIES ................................................................................... 45
PATCO SERVICE STANDARDS AND POLICIES ...................................................................................... 46
Background ............................................................................................................................................. 46
Quantitative Standards ........................................................................................................................... 46
Vehicle Load ........................................................................................................................................ 46
Delaware River Port Authority/Port Authority Transit Corporation
_____________________________________________________________________________________
Title VI Program - March 2019
Vehicle Headways ............................................................................................................................... 46
On-time Performance ......................................................................................................................... 47
Service Availability .............................................................................................................................. 47
Qualitative Policies .................................................................................................................................. 48
Vehicle Assignment ............................................................................................................................. 48
Transit Amenities ................................................................................................................................ 48
COLLECT & REPORT DEMOGRAPHIC DATA ........................................................................................ 50
Demographic Profile ............................................................................................................................... 50
PATCO Minority Population Distribution Maps: 2017 ACS 5-Year Estimates ......................................... 51
PATCO Hispanic Population Distribution Maps: 2017 ACS 5-Year Estimates ......................................... 52
PATCO Median Household Income Distribution Maps: 2017 ACS 5-Year Estimates .............................. 53
Equity Analysis Map for the Greater Philadelphia Region ...................................................................... 55
2018 PATCO Survey Data Report Summary ............................................................................................ 55
MONITORING TRANSIT SERVICE ....................................................................................................... 57
2016-2018 Monitoring Results ............................................................................................................... 57
EVALUATE FARE AND SERVICE CHANGES .......................................................................................... 58
Disparate Impact and Disproportionate Burden Policy .......................................................................... 58
Fare Increase or Service Reduction/Increase Procedure and Public Comment Policy ........................... 59
APPENDIX A: TITLE VI NOTICE TRANSLATIONS ................................................................................ 62
APPENDIX B: TITLE VI COMPLAINT FORM TRANSLATIONS .............................................................. 68
APPENDIX C: CITIZENS ADVISORY COMMITTEE APPLICATION ......................................................... 79
APPENDIX D: 2018 PATCO SURVEY DATA REPORT .......................................................................... 81
Delaware River Port Authority/Port Authority Transit Corporation
_____________________________________________________________________________________
Title VI Program - March 2019 4
INTRODUCTION
It is the policy of the Delaware River Port Authority (DRPA) and the Port Authority Transit Corporation (PATCO) to comply with the requirements of Title VI of the Civil Rights Act of 1964 and all related nondiscrimination statutes, regulations, and laws (49 CFR part 21). All recipients of federal funds must ensure that they are in full compliance with Title VI and all related regulations and directives in all programs and activities. To that end, no person shall, on the grounds of race, color, or national origin, be excluded from participation in, be denied the benefits of, or be otherwise subjected to discrimination under any of DRPA or PATCO’s programs, policies or activities.
CERTIFICATIONS AND ASSURANCES
The DRPA and PATCO’s Certifications and Assurances are executed annually in FTA’s Transit Award Management System (TrAMS) by the DRPA Chief Executive Officer and the DRPA General Counsel. The Certifications and Assurances for 2019 are not yet available for execution in TrAMS. The 2018 Certifications and Assurances were executed on March 5, 2018.
DESCRIPTION OF DRPA AND THE PATCO HIGH SPEEDLINE
The Delaware Port Authority (DRPA) is a public corporate instrumentality of the Commonwealth of Pennsylvania and the State of New Jersey. DRPA has no stockholders or equity holders and, among other powers, is vested with the control, operation and collection of tolls and revenues of certain bridges spanning the Delaware River. These bridges are the Benjamin Franklin, Walt Whitman, Commodore Barry and Betsy Ross. DRPA has also constructed and operates a high-speed transit facility known as the Port Authority Transit Corporation (PATCO), a wholly owned subsidiary operating between Lindenwold, New Jersey and Philadelphia, Pennsylvania. The PATCO Line, a 14.2-mile high-speed single line, double track, rail transit system, began operations in February 1969. At that time, the system utilized modernized facilities of the previously existing Philadelphia-Camden “Bridge Line” and entirely new fixed facilities constructed on former Pennsylvania-Reading Seashore Lines right-of-way. The project was completed on schedule at a cost of $95 million dollars. There are thirteen (13) passenger stations currently in use on the PATCO Line: four (4) subway stations serving the Philadelphia Central Business District; two (2) subway stations serving the Camden Central Business District; and seven (7) surface-type stations serving various New Jersey communities with a total parking capacity of over 12,500 spaces, 60 percent of which are offered free for ridership parking. One subway station in Philadelphia (Franklin Square, located between the Camden City Hall and the 8th & Market Stations) was closed in September 1979 due to low ridership. Renovations are planned for the Franklin Square Station with an anticipated re-opening of service in 2022.
Delaware River Port Authority/Port Authority Transit Corporation
_____________________________________________________________________________________
Title VI Program - March 2019 5
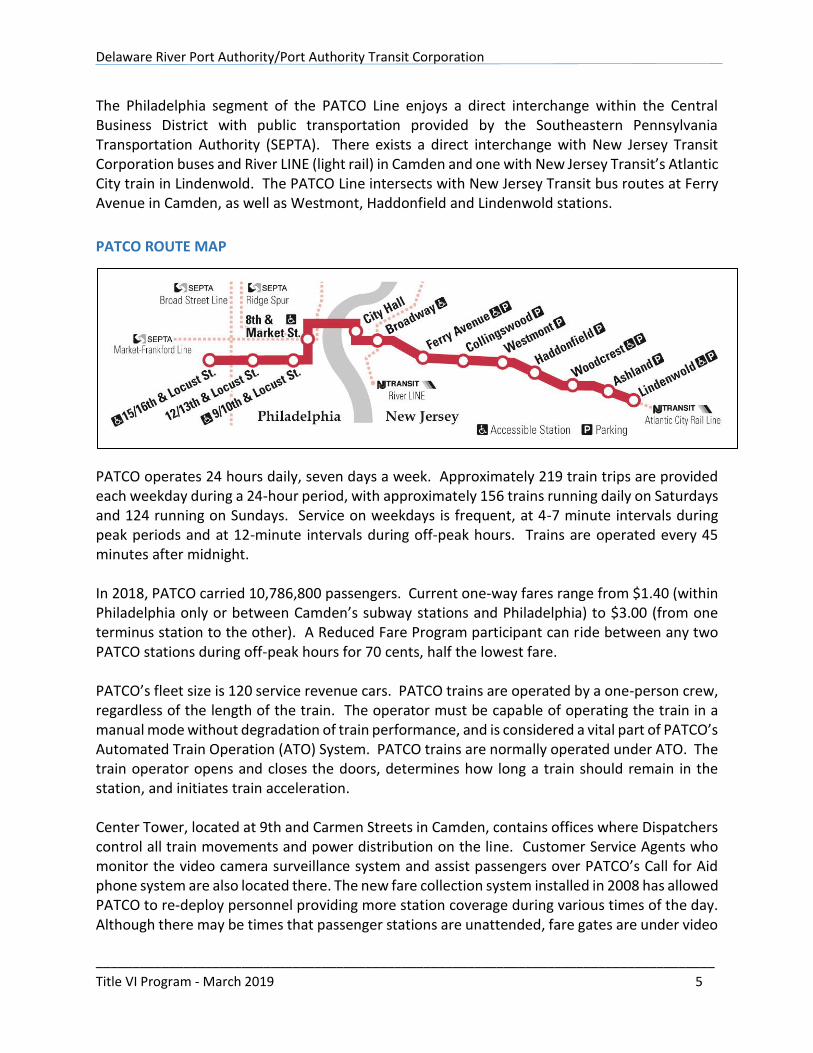
The Philadelphia segment of the PATCO Line enjoys a direct interchange within the Central Business District with public transportation provided by the Southeastern Pennsylvania Transportation Authority (SEPTA). There exists a direct interchange with New Jersey Transit Corporation buses and River LINE (light rail) in Camden and one with New Jersey Transit’s Atlantic City train in Lindenwold. The PATCO Line intersects with New Jersey Transit bus routes at Ferry Avenue in Camden, as well as Westmont, Haddonfield and Lindenwold stations.
PATCO ROUTE MAP
PATCO operates 24 hours daily, seven days a week. Approximately 219 train trips are provided each weekday during a 24-hour period, with approximately 156 trains running daily on Saturdays and 124 running on Sundays. Service on weekdays is frequent, at 4-7 minute intervals during peak periods and at 12-minute intervals during off-peak hours. Trains are operated every 45 minutes after midnight. In 2018, PATCO carried 10,786,800 passengers. Current one-way fares range from $1.40 (within Philadelphia only or between Camden’s subway stations and Philadelphia) to $3.00 (from one terminus station to the other). A Reduced Fare Program participant can ride between any two PATCO stations during off-peak hours for 70 cents, half the lowest fare. PATCO’s fleet size is 120 service revenue cars. PATCO trains are operated by a one-person crew, regardless of the length of the train. The operator must be capable of operating the train in a manual mode without degradation of train performance, and is considered a vital part of PATCO’s Automated Train Operation (ATO) System. PATCO trains are normally operated under ATO. The train operator opens and closes the doors, determines how long a train should remain in the station, and initiates train acceleration. Center Tower, located at 9th and Carmen Streets in Camden, contains offices where Dispatchers control all train movements and power distribution on the line. Customer Service Agents who monitor the video camera surveillance system and assist passengers over PATCO’s Call for Aid phone system are also located there. The new fare collection system installed in 2008 has allowed PATCO to re-deploy personnel providing more station coverage during various times of the day. Although there may be times that passenger stations are unattended, fare gates are under video
Delaware River Port Authority/Port Authority Transit Corporation
_____________________________________________________________________________________
Title VI Program - March 2019 6
camera surveillance to protect against fare evasion and to monitor station conditions. PATCO offices are currently located in Lindenwold and in Camden in the Walter Rand Transportation Center and Center Tower. An office, shop and yard facility is located at the terminus of the line in Lindenwold, New Jersey, where PATCO’s fleet is serviced, washed and stored. The PATCO Administrative Offices and the Maintenance, Equipment and Transit Services Divisions are located there. The Delaware River Port Authority is the sole recipient of Federal Transit Administration
funding and does not pass funds through to sub-recipients. PATCO has never utilized federal
operating subsidies, but does receive capital funding from the Section 5307, Section 5309 and
Section 5337 federal programs operated by FTA. Recent capital funding has included projects
to upgrade track, replace crossties, rehabilitate interlockings, complete the new reverse
signaling system, upgrade SCADA, replace retaining walls, undertake embankment restoration,
undertake communications improvements, and undertake fire safety improvements to the
Philadelphia subways.
Improvements and upgrades to the PATCO Line include: Mid-1980’s: The Camden Broadway Subway Station was rehabilitated and reopened as an integral part of the $21 million Walter Rand Transportation Center. 1999: PATCO completed $13 million of FTA funded accessibility improvements to bring the system into compliance with the Americans for Disabilities Act. Five stations are designated as key stations, including 15-16th & Locust and 8th & Market in Philadelphia, as well as Broadway, Woodcrest and Lindenwold in New Jersey. Elevators were also installed at the 9-10th & Locust Street Station in Philadelphia and at Ferry Avenue Station in New Jersey, making seven (7) of the thirteen (13) stations fully accessible (Lindenwold, Woodcrest, Ferry Avenue, Broadway, 8th & Market, 9-10th & Locust and 15-16th & Locust). 2003-2004: Four subway stations in Philadelphia and one subway station in Camden received FTA capital funding for improvements and upgrades to appearance, noise abatement and enhanced lighting. Stations in New Jersey were upgraded using DRPA funds. 2007-2008: PATCO completed the installation of its automated fare collection system in all of its rail stations. As of 2016, all ticket vending machines now offer instructions in English, Spanish, Chinese, Korean, Vietnamese, and Russian. The fare collection system offers customers the option of a smart card or a paper magnetic stripe one and two-ride tickets. The stored value smart card, called the FREEDOM Card, meets APTA’s Contactless Fare Media Standard, which provides for interoperability between and among other transit systems who adopt this same standard. PATCO’s FREEDOM Card can also be used to access and pay for gated parking. The system includes computer hardware and software, fare gates, and ticket vending machines, and is financed with bond proceeds from the DRPA. With the conversion to the new fare collection
Delaware River Port Authority/Port Authority Transit Corporation
_____________________________________________________________________________________
Title VI Program - March 2019 7
system, all sales occur at the new electronic vending machines, at the new FREEDOM Card Service Center, the satellite FREEDOM Card Office at Woodcrest Station, or on-line. 2014-2015: The DRPA/PATCO completed a $103 million rehabilitation of the tracks that cross the Ben Franklin Bridge between Camden and Philadelphia. 2016-2021: The current Center Tower/Command and Control Center is being relocated from 9th and Carmen Streets in Camden to the Lindenwold shop and yard complex. The Control Center will be built on currently unoccupied space within property already owned by the DRPA/PATCO. The design for the new PATCO dispatch Control Center is complete. The DRPA/PATCO is in the process of selecting a firm to provide a constructability review of the design and construction monitoring services during construction. Construction is expected to begin in late 2019, with a 2-year construction duration, resulting in project completion in late 2021. 2017-2019: $194 million extensive car overhaul program that includes new interiors, better communications, security, and mechanical improvements of all 120 rail cars. The project is the largest rolling stock capital expenditure since PATCO’s inception in 1969 and one of the largest capital improvement projects in the DRPA history. One hundred eighteen cars are complete in and in service and two 2 cars are currently undergoing commission at PATCO. 2017-2022: Installation of elevators at the remaining six stations (Ashland, Haddonfield, Westmont, Collingswood, City Hall and 12-13th & Locust) is underway and will make PATCO fully accessible by 2022. 2019-2022: Currently in design, the reopening of the Franklin Square Station, originally constructed in 1936 and closed in 1979, will include improvements to the station’s civil, structural, mechanical, and electrical systems and will be fully accessible in compliance with the ADA.
Delaware River Port Authority/Port Authority Transit Corporation
_____________________________________________________________________________________
Title VI Program - March 2019 8
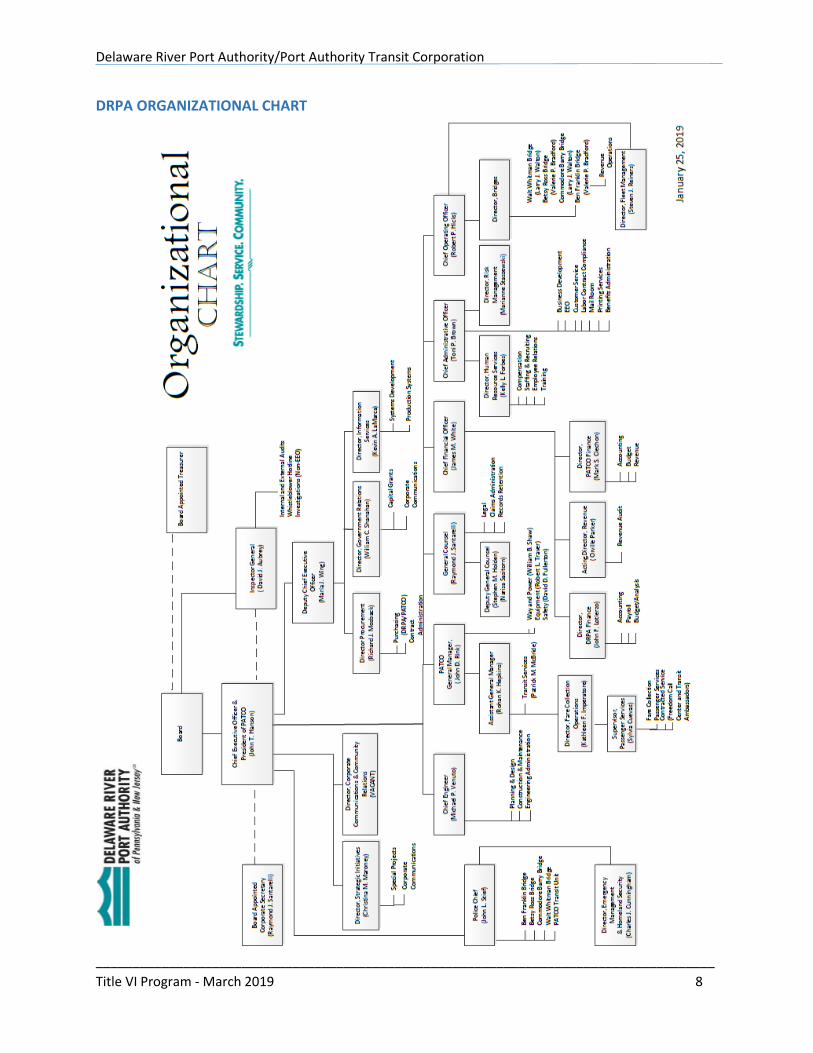
DRPA ORGANIZATIONAL CHART
Delaware River Port Authority/Port Authority Transit Corporation
_____________________________________________________________________________________
Title VI Program - March 2019 9
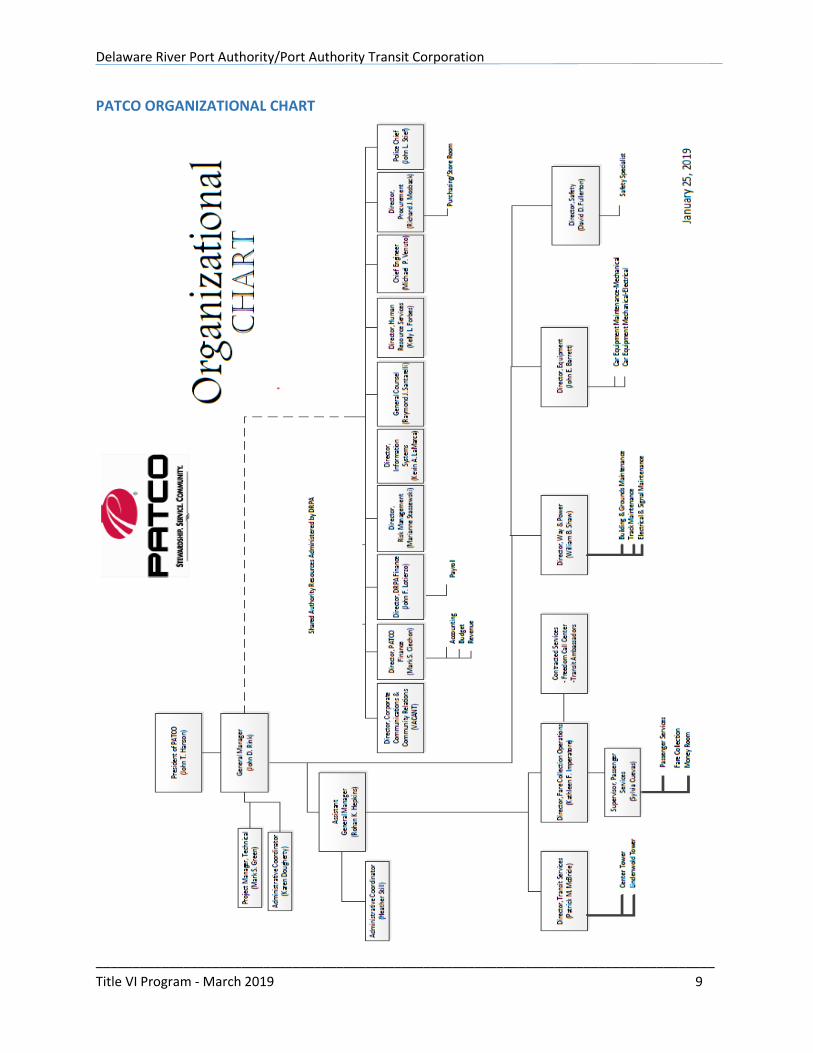
PATCO ORGANIZATIONAL CHART
Delaware River Port Authority/Port Authority Transit Corporation
_____________________________________________________________________________________
Title VI Program - March 2019 10
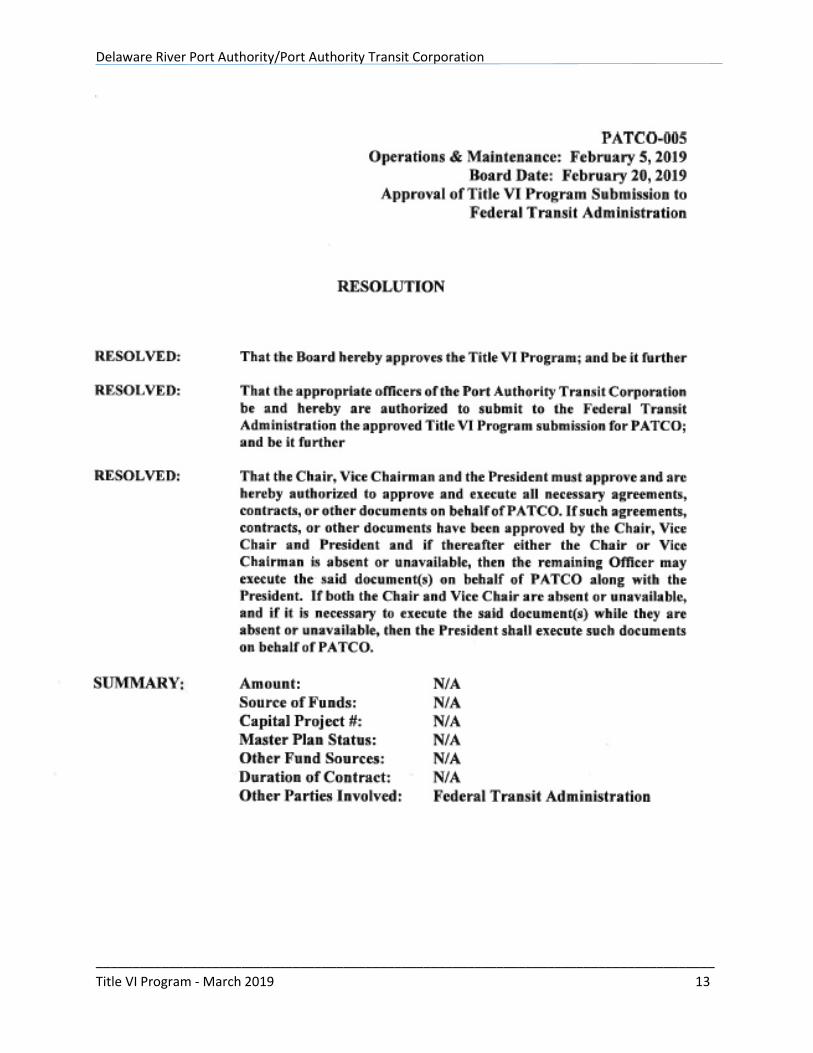
BOARD APPROVAL DOCUMENTATION
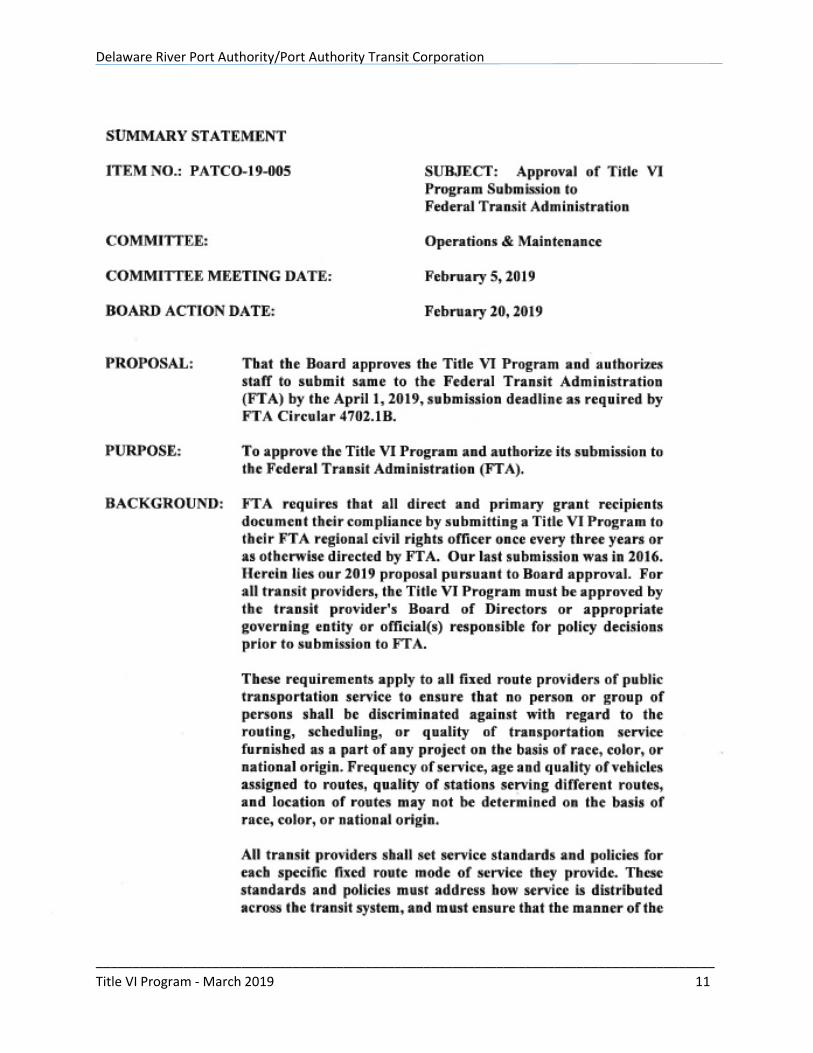
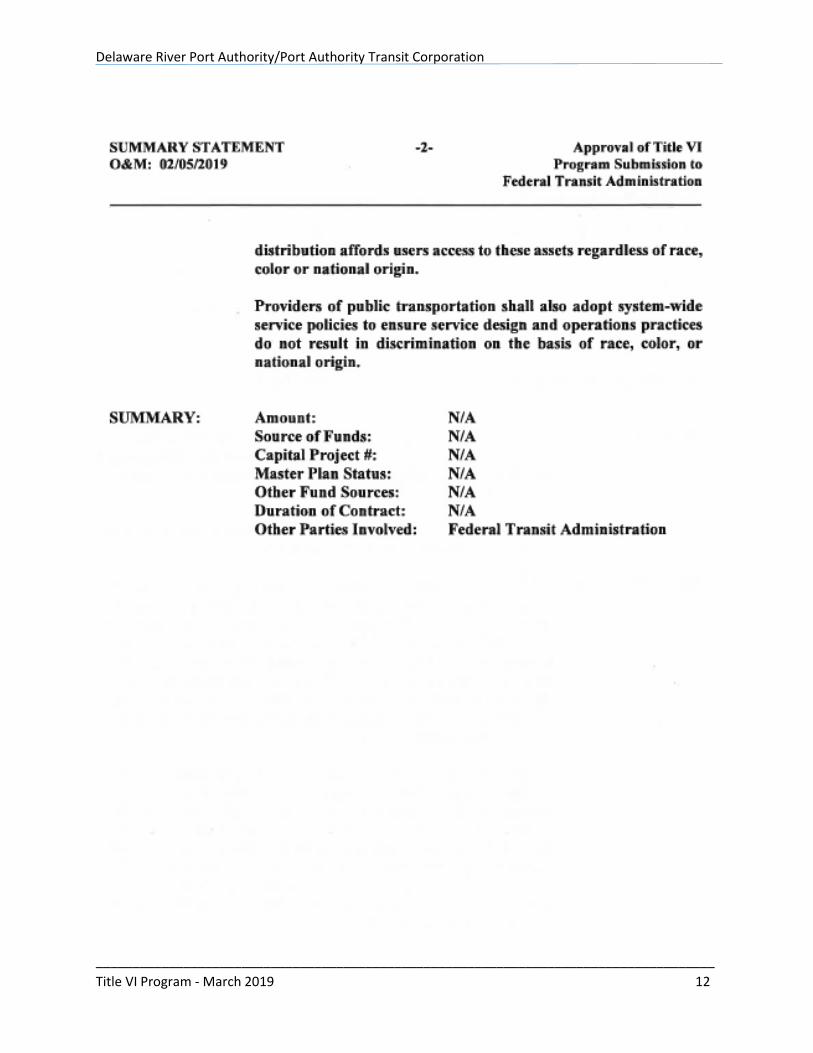
The Title VI Program received Board of Commissioners’ approval at the PATCO Operations and Maintenance Committee Meeting on February 5, 2019 and at the PATCO Board Meeting on February 27, 2019. The required New Jersey Governor’s Office 10-day veto period expired on March 15, 2019. The PATCO Board- adopted Summary Statement and Resolution, PATCO-19-005, Approval of Title VI Program Submission to Federal Transit Administration, is shown on the following page.
Delaware River Port Authority/Port Authority Transit Corporation
_____________________________________________________________________________________
Title VI Program - March 2019 11
Delaware River Port Authority/Port Authority Transit Corporation
_____________________________________________________________________________________
Title VI Program - March 2019 12
Delaware River Port Authority/Port Authority Transit Corporation
_____________________________________________________________________________________
Title VI Program - March 2019 13
Delaware River Port Authority/Port Authority Transit Corporation
_____________________________________________________________________________________
Title VI Program - March 2019 14
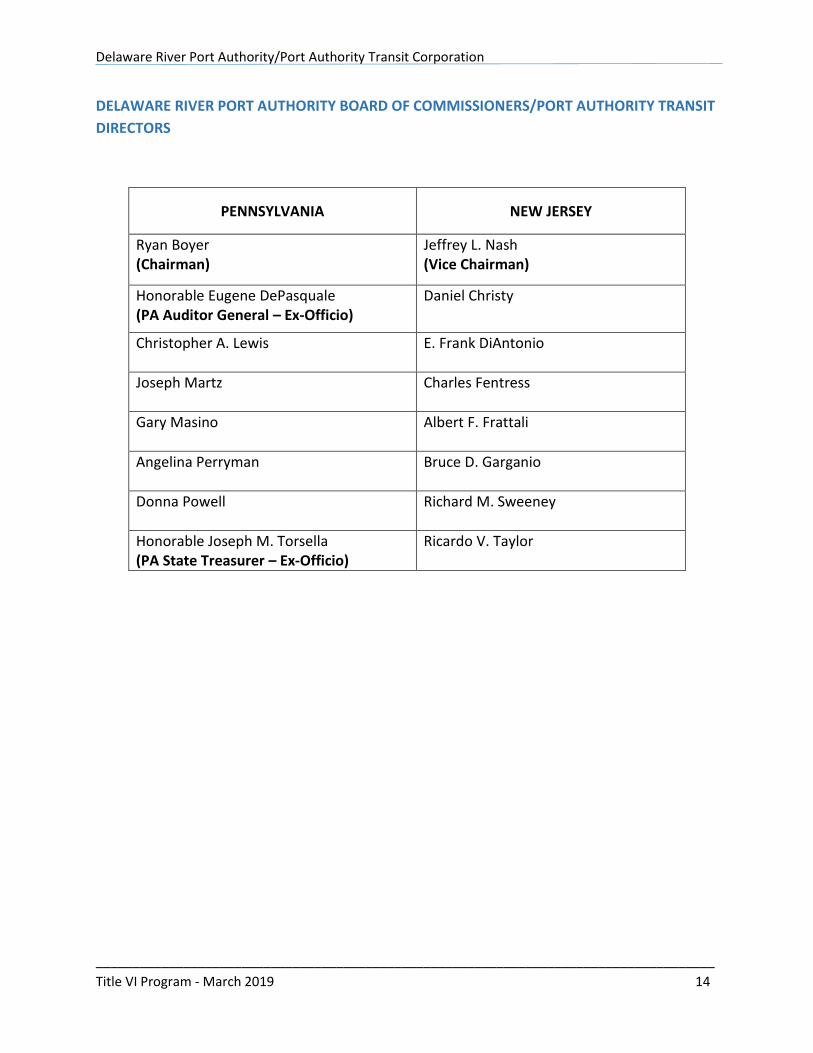
DELAWARE RIVER PORT AUTHORITY BOARD OF COMMISSIONERS/PORT AUTHORITY TRANSIT
DIRECTORS
PENNSYLVANIA NEW JERSEY
Ryan Boyer (Chairman)
Jeffrey L. Nash (Vice Chairman)
Honorable Eugene DePasquale (PA Auditor General – Ex-Officio)
Daniel Christy
Christopher A. Lewis E. Frank DiAntonio
Joseph Martz Charles Fentress
Gary Masino Albert F. Frattali
Angelina Perryman Bruce D. Garganio
Donna Powell Richard M. Sweeney
Honorable Joseph M. Torsella (PA State Treasurer – Ex-Officio)
Ricardo V. Taylor
Delaware River Port Authority/Port Authority Transit Corporation
_____________________________________________________________________________________
Title VI Program - March 2019 15
TITLE VI NOTICE TO THE PUBLIC
The Public Notice of Title VI Rights is posted on DRPA’s website (www.drpa.org), on PATCO’s website (www.ridepatco.org), and on bulletin boards in the public areas of all PATCO stations. PATCO has also posted the public notice on all railcars. The notice is translated into Spanish, Chinese, Korean, Vietnamese and Russian and copies are included in Appendix A.
Public Notice of Title VI Rights
The Delaware River Port Authority (DRPA) and the Port Authority Transit Corporation (PATCO) gives public notice of its policy to uphold and assure full compliance with Title VI of the Civil Rights Act of 1964, the Civil Rights Restoration Act of 1987, and all related statutes. Title VI and related statutes prohibiting discrimination in Federally-assisted programs require that no person in the United States of America shall on the grounds of race, color, or national origin be excluded from the participation in, be denied the benefits of, or be otherwise subjected to discrimination under any program or activity receiving Federal financial assistance.
Any person who desires more information regarding DRPA and PATCO’s Title VI Program can contact its Title VI Co-Coordinators - Chief Administrative Officer and General Counsel – at the addresses noted below.
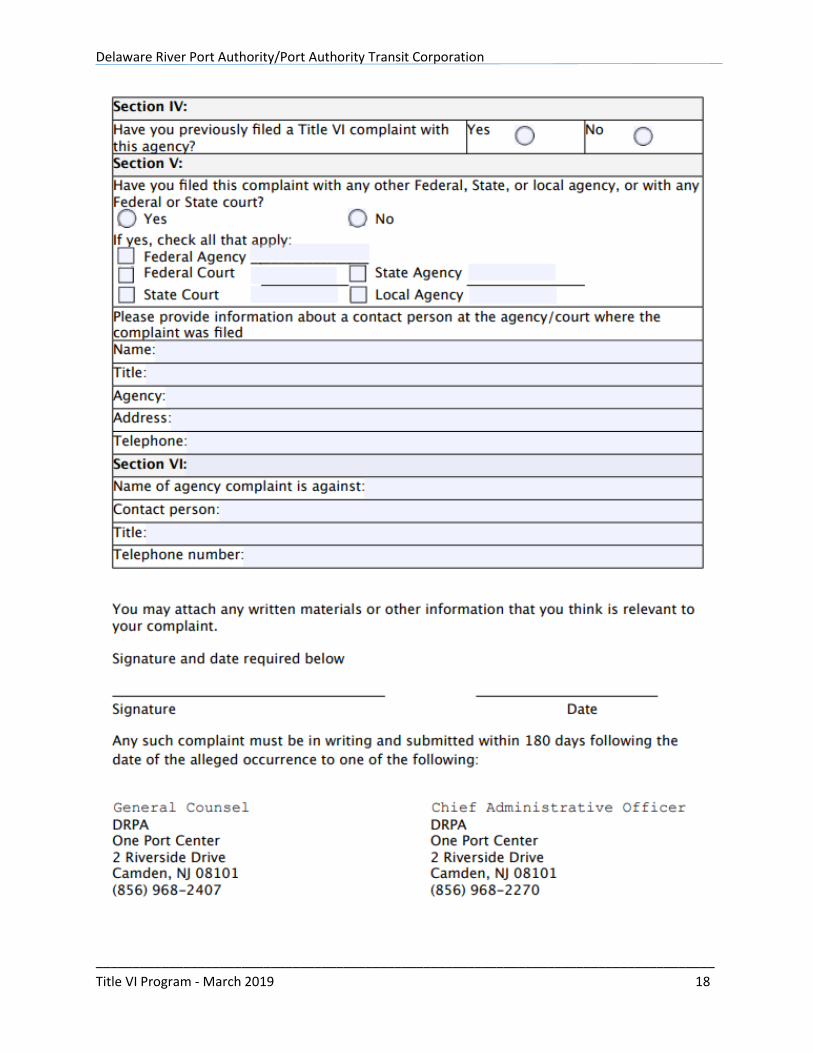
Any person who believes they have been aggrieved by an unlawful discriminatory practice regarding PATCO’s programs has the right to file a formal complaint. Any such complaint must be in writing and submitted within 180 days following the date of the alleged occurrence to either:
Office of General Counsel DRPA PO Box 1949 One Port Center 2 Riverside Drive Camden, NJ 08101 (856) 968-2407
Office of Chief Administrative Officer DRPA PO Box 1949 One Port Center 2 Riverside Drive Camden, NJ 08101 (856) 968-2270
Delaware River Port Authority/Port Authority Transit Corporation
_____________________________________________________________________________________
Title VI Program - March 2019 16
TITLE VI COMPLAINT PROCEDURES
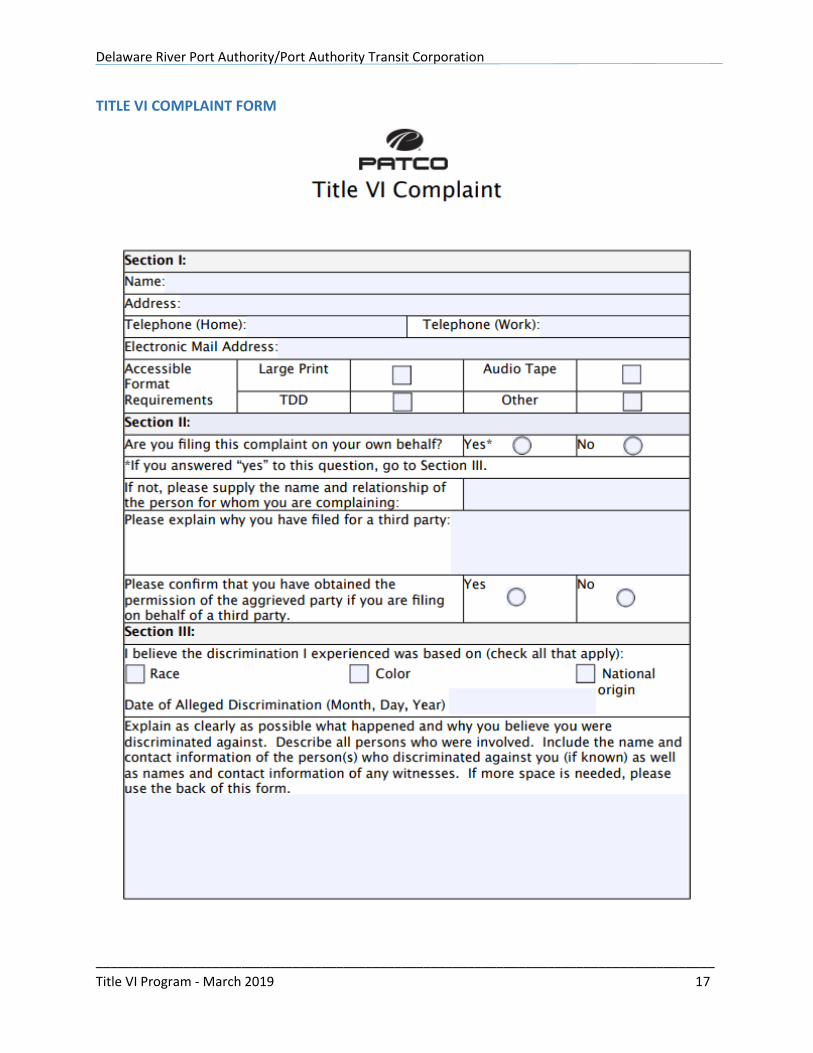
Any person who believes she or he has been discriminated against on the basis of race, color or national origin by the Port Authority Transit Corporation (hereinafter referred to as “PATCO”) may file a Title VI complaint by completing and submitting PATCO’s Title VI Complaint Form. PATCO investigates complaints received no more than 180 days after the alleged incident. PATCO will process complaints that are complete.
Once the complaint is received by either the General Counsel or Chief Administrative Officer, PATCO will review it to determine if our office has jurisdiction. The complainant will receive an acknowledgement letter informing her/him whether the complaint will be investigated by our office.
PATCO has 30 days to investigate the complaint. If more information is needed to resolve the case, PATCO may contact the complainant. The complainant has 10 business days from the date of the letter to send requested information to the investigator assigned to the case. If the investigator is not contacted by the complainant or does not receive the additional information within 15 business days, PATCO can administratively close the case. A case can also be administratively closed if the complainant no longer wishes to pursue their case.
After the investigator reviews the complaint, she/he will issue one of two letters to the complainant: a closure letter or a letter of finding (LOF). A closure letter summarizes the allegations and states that there was not a Title VI violation and that the case will be closed. An LOF summarizes the allegations and the interviews regarding the alleged incident, and explains whether any disciplinary action, additional training of the staff member or other action will occur. If the complainant wishes to appeal the decision, she/he has 30 days after the date of the letter or the LOF to do so.
A person may also file a complaint directly with the Federal Transit Administration, at FTA Office of Civil Rights, 1200 New Jersey Avenue SE, Washington, DC 20590. The Title VI Complaint Procedure and Form are available in English, Spanish, Chinese, Korean, Vietnamese, and Russian on drpa.org and ridepatco.org. Copies of the translated procedures and form are included in Appendix B.
Delaware River Port Authority/Port Authority Transit Corporation
_____________________________________________________________________________________
Title VI Program - March 2019 17
TITLE VI COMPLAINT FORM
Delaware River Port Authority/Port Authority Transit Corporation
_____________________________________________________________________________________
Title VI Program - March 2019 18
Delaware River Port Authority/Port Authority Transit Corporation
_____________________________________________________________________________________
Title VI Program - March 2019 19
TRANSIT RELATED TITLE VI INVESTIGATIONS, COMPLAINTS & LAWSUITS
From January 2016 to the present, the DRPA is not named in any lawsuits or complaints alleging discrimination on the basis of race, color, or national origin with respect to its transit services or transit benefits. The DRPA has not had any compliance reviews or investigations conducted by entities other than the FTA as it relates to Title VI.
Delaware River Port Authority/Port Authority Transit Corporation
_____________________________________________________________________________________
Title VI Program - March 2019 20
PUBLIC PARTICIPATION PLAN
Public participation is based on the belief that people whose lives are affected by transportation planning and investment decisions have a right to be involved in the decision-making process and influence choices that are made. Directly engaging citizens in this process promotes successful problem solving, yields diverse voices and new ideas, and gives the public a sense of ownership of the developed solutions.
In our public participation efforts, DRPA/PATCO will strive to find innovative ways to identify and engage the affected public, provide a wide variety of opportunities for interested parties to become involved, and create a meaningful process that is transparent and ensures effective communication about how public contribution influences decisions. It is also important that a public participation process be continually evaluated and improved to ensure that under-represented communities are given a voice. DRPA/PATCO will do such an ongoing process evaluation.
The Public Participation Plan (PPP) is a guide for DRPA/PATCO’s public participation efforts. The plan ensures that DRPA/PATCO utilizes effective means of providing information and receiving public input on transportation decisions, (i.e., any future fare or major service changes), from low income, minority and Limited English Proficient (LEP) populations, as required by Title VI of the Civil Rights Act of 1964 and its implementing regulations.
Under federal regulations, transit operators must take reasonable steps to ensure that Limited English Proficient (LEP) persons have meaningful access to their programs and activities. This means that public participation opportunities, normally provided in English, should be accessible to persons who have a limited ability to speak, read, write, or understand English.
The goals, guiding principles and public participation process are outlined below.
GOALS OF THE PUBLIC PARTICIPATION PLAN
The goals of the Public Participation Plan include:
Goal 1: Inform and Educate the Public. DRPA/PATCO will provide information to the public that is accurate and understandable and in such a way that the significance and potential effect is understood by participants. Goal 2: Clarity in Potential for Influence. DRPA/PATCO will ensure the process clearly identifies where and how participants can have influence and direct impact on decision-making. Goal 3: Consistent Commitment. DRPA/PATCO will communicate regularly, develop trust with communities and build community capacity to provide public input.
Delaware River Port Authority/Port Authority Transit Corporation
_____________________________________________________________________________________
Title VI Program - March 2019 21
Goal 4: Accessibility. DRPA/PATCO will make every reasonable effort to ensure that opportunities to participate are physically, geographically, linguistically and culturally accessible. Goal 5: Diversity. Participants represent a range of socioeconomic, ethnic and cultural perspectives, with representative participants including residents from low-income neighborhoods, ethnic communities and residents with limited English proficiency. Goal 6: Quality Input and Participation. That comments received by DRPA/PATCO are useful, relevant and constructive, contributing to better plans, projects, strategies and decisions. Goal 7: Participant Satisfaction. People who take the time to participate feel it is worth the effort to join the discussion and provide feedback. Goal 8: Partnerships. DRPA/PATCO will maintain partnerships with communities through the methods described in the Public Participation Plan.
GUIDING PRINCIPLES OF THE PUBLIC PARTICIPATION PROCESS
DRPA/PATCO’s Public Participation Plan (PPP) will provide all members of the public an opportunity to fully participate in DRPA/PATCO’s service and fare planning and decision-making process. Effective public participation will be based on the following principles:
Flexibility – The engagement process will accommodate participation in a variety of ways and be adjusted as needed.
Inclusiveness – DRPA/PATCO will proactively reach out to and engage minority, low-income and LEP populations from our service area so these groups will have an opportunity to participate.
Accessibility – Meetings will be held in locations which are fully accessible and welcoming to
area residents, including but not limited to minority, low-income and LEP members of the public and in locations relevant to the topics being presented and discussed.
Respect – All feedback will be given careful and respectful consideration.
Proactive and Timeliness – Participation methods will allow for early involvement and be
ongoing and proactive so participants can influence DRPA/PATCO’s decisions.
Clear, Focused and Understandable – Participation methods will have a clear purpose and use for the input, and should be described in language that is easy to understand.
Honest and Transparent – Information provided on the results of the public’s input will be
accurate, trustworthy and complete.
Delaware River Port Authority/Port Authority Transit Corporation
_____________________________________________________________________________________
Title VI Program - March 2019 22
Responsiveness – DRPA/PATCO will respond and incorporate appropriate public comments into transparent decisions.
PUBLIC PARTICIPATION PROCESS
The outline below provides the general steps DRPA/PATCO will take to engage riders in the decision making process using a fare or major service change as an example.
1. A service or fare change proposal is developed internally by senior management if
DRPA/PATCO staff determines it is necessary to implement a major service change or fare increase. Staff will prepare an Equity Analysis and a recommendation with appropriate supporting documentation for consideration by the Board of Directors.
2. Senior management provides the service or fare change proposal and Equity Analysis, with a recommendation and appropriate supporting documents, to the appropriate DRPA/PATCO Board Committee for consideration. The Committee would then bring a recommendation to the full Board. The recommendation would include a request for authorization for public hearings on a major service/fare change.
3. DRPA/PATCO Board review of the proposal occurs. Authorization from the DRPA/PATCO Board
to proceed occurs.
4. Senior management reviews the results of the Title VI review with the Board and the Board authorizes a public comment period.
5. Public outreach venues, dates and times are determined with consideration of the proposed
changes and their impacts on specific locations/populations (minority, low-income and LEP) within the DRPA/PATCO service area. In particular, public hearings will be scheduled in the evenings and at times convenient for the public and in locations which are conveniently located and easily accessible via mass transit to minority, low-income and LEP populations in South Jersey and Pennsylvania. Facilities will also be selected based on being accessible to the disabled.
6. Bi-lingual (English and Spanish) public outreach materials and a program will be developed. If
it is determined that materials in languages in addition to Spanish should be produced, and resources are available, consideration will be given to such production.
7. Outreach sufficiently in advance of public information sessions will be released. As previously
noted, DRPA/PATCO will schedule meetings, times and locations convenient and accessible for minority, low-income, LEP communities and the disabled. DRPA/PATCO will coordinate with community-based organizations that will include ethnic cultural centers, churches and faith- based organizations, geographic-specific organizations such as tenant associations, neighborhood and community groups, civic groups, business organizations, elected officials in the region, business organizations, educational facilities, service providers for children, youth
Delaware River Port Authority/Port Authority Transit Corporation
_____________________________________________________________________________________
Title VI Program - March 2019 23
and persons with disabilities, environmental, senior-oriented and veterans organizations to provide public meeting notices. Public meeting notices will request that DRPA/PATCO be notified in advance of special needs or accommodations. A Spanish language interpreter will be present at the meetings. DRPA/PATCO will provide assistance for additional languages if notified in advance of the meetings.
8. A press release informing the public about the public hearings will be disseminated to all
DRPA/PATCO media outlets, including those that serve minority, low-income and LEP populations. Email blasts to community partners, neighborhood associations, elected officials and other business membership lists will be disseminated with information on the public meetings.
9. Comment cards in English and Spanish will be available at the meetings. A designated comment period following the meetings will be available to any member of the public wishing to provide input. If comment cards request that materials be provided in additional languages, DRPA/PATCO will consider the request if it has sufficient resources.
10. Meeting notices in English and Spanish will be placed in all PATCO stations, and will be
provided to riders via seat drops. The notice will list the date, time and venues for the public comment and will explain the proposed service or fare change and invite public comment about same. The notice will also be posted on DRPA and PATCO websites, www.drpa.org and www.ridepatco.org. Meeting notices on the websites will also be able to be translated into other languages using the Google Translate tool located on PATCO’s webpage. The public will be advised that DRPA/PATCO representatives, including those who are bi-lingual and those for the hearing impaired, will be present to take written comments during the hearings. If requested in advance that materials be provided in additional languages, DRPA/PATCO will consider the request if it has sufficient resources.
11. DRPA will arrange and supply staff support, interpreters, meeting materials and equipment
for all of the meetings.
12. Public meetings will be held under the supervision of a Hearing Officer with all comments to be recorded by a court stenographer. The public will be invited to comment via mail or email to DRPA/PATCO, by telephone calls to a special recorded and advertised number, through personnel at the hearings who are bi-lingual and who can interpret and take statements from those who did not wish to wait or who choose not to speak publicly. Transcripts of the hearing, along with other public comment, will be made available to the public at www.ridepatco.org.
13. Following the end of the public comment period and the compilation of all public comments, the DRPA Board of Commissioners/PATCO Directors will be provided a summary package detailing the outcome of the public participation process along with staff recommendations to the appropriate committee of the Board. That committee will then make a final
Delaware River Port Authority/Port Authority Transit Corporation
_____________________________________________________________________________________
Title VI Program - March 2019 24
recommendation with respect to the proposed service change or fare increase to the full DRPA Board of Commissioners/PATCO Directors.
14. The Board will vote at a public Board Meeting on whether to approve the proposed service or fare change. If approved, the Board will pass a resolution summarizing the approved change.
15. If the Board approves a service or fare change, the General Manager of PATCO shall be authorized and directed to implement the proposed service change or fare increase according to the approved schedule. There shall be adequate public notice of the service/fare change prior to its implementation.
16. The public will be notified of the upcoming service or fare change via media releases and on the organization’s websites, www.drpa.org and www.ridepatco.org.
17. A bi-lingual system timetable and website updates will be posted in advance of the approved
change.
DRPA/PATCO MEDIUMS (BI-LINGUAL)
The mediums that will be utilized by DRPA/PATCO to notify the public of meetings on a proposed major service change or fare increase will include: Print – newspapers Seat-drops and PATCO station notices - train seat drops will occur for public meetings and
meeting notices will be hung in all NJ and PA PATCO Stations. Websites – www.drpa.org and www.ridepatco.org. Social Media – PATCO utilizes Facebook and Twitter Email – DRPA/PATCO sends emails to the public who have subscribed to our Travel Alerts
on the DRPA and/or PATCO websites. DRPA/PATCO also relies on community-based organizations and civic, business and neighborhood groups to blast email meeting notices.
Radio – DRPA/PATCO will notify regional radio of any public meetings. VMS Signs – public meeting notices can be placed on variable message signs at and in
PATCO stations. LCD Screens – all PATCO stations will have LCD screens for messaging the public about
public meetings.
Delaware River Port Authority/Port Authority Transit Corporation
_____________________________________________________________________________________
Title VI Program - March 2019 25
Direct mail to relevant regional stakeholders Public Meeting Notice posters will be made available to local libraries, community
centers, and county offices. Public Information Sessions Public Hearings Legal Notices, where appropriate Notices of fare increases are posted in all stations and on the PATCO website in advance
in both English and Spanish. Additionally, the website, through the ‘Google Translate’ feature, allows for translation of material in 100 languages. Signs explaining how to use the PATCO Fare Collection System are also posted in all stations.
PUBLIC INFORMATION DISSEMINATION
PATCO has implemented a Fare Increase or Service Reduction/Increase Procedure and Public Comment Period Policy with respect to implementing public participation for fare and service changes. A copy of this procedure and policy is included under the Monitoring Transit Service section of this document. The DRPA/PATCO websites contain news, employment opportunities, procurement opportunities, schedules and fares, and more. DRPA continues to publish the annual FTA Program of Projects in local newspapers, always including an offer to hold a public hearing if the public so desires. News releases are disseminated to all local media on an ongoing basis. Community meetings are held to discuss upcoming and ongoing projects with the affected communities and elected officials. DRPA and PATCO staff are also active members of many committees at the local Metropolitan Planning Organization (MPO), including the Delaware Valley Regional Planning Commission (DVRPC) Board, Board Policy Committee, Regional Transportation Committee, NJ Subcommittee, PA Subcommittee, Goods Movement Task Force, ITS Committees, and the like. When requested by the DVRPC Regional Technical Committee to answer questions or make presentations, we do so. DRPA/PATCO representatives attend nearly every public meeting that is sponsored by DVRPC so as to be available to the public for information purposes.
PUBLIC OUTREACH EFFORTS
PATCO provided the following public outreach activities between 2016 and 2018:
Delaware River Port Authority/Port Authority Transit Corporation
_____________________________________________________________________________________
Title VI Program - March 2019 26
All board meetings are open to the public and are advertised. Typically board meetings are held at One Port Center in Camden. Several times a year board meetings are held in Philadelphia and New Jersey in the evening to provide a varied schedule to encourage public attendance.
Public outreach events were held for the Station Enhancement Program at Lindenwold, Woodcrest, and Ferry Ave in July 2018. The events included information on station designs and estimated construction schedule.
PATCO provided seat drop flyers and posters notifying customers of and encouraging participation in the 2018 rider survey.
An electric vehicle survey for customers who use PATCO parking lots was promoted electronically (twitter, website) in July 2016 and August 2016.
Delaware River Port Authority/Port Authority Transit Corporation
_____________________________________________________________________________________
Title VI Program - March 2019 27
Limited English Proficiency Assessment
Limited English Proficiency Limited English Proficiency (LEP) refers to individuals who cannot speak, read, write or understand the English language at a level that permits them to interact effectively. Authority Title VI of the Civil Rights Act of 1964 and its implementing regulations require that recipients of federal funds take responsible measures to ensure meaningful access to benefits, services, information and other important portions of programs and activities are available for individuals who are LEP. Title VI of the Civil Rights Act of 1964 states that no person in the United States shall, on the grounds of race, color, or national origin, be excluded from participation in, be denied the benefits of, or be subjected to discrimination under any program or activity receiving federal financial assistance. Executive Order (EO) 13166 - Improving Access to Services or Persons with LEP (August 11, 2000) sets forth the compliance standards that recipients of federal funds must follow to ensure that the program and activities they normally provide in English are accessible to LEP persons and thus does not discriminate on the basis of national origin in violation of Title VI of the Civil Rights Act of 1964, as amended, and its implemented regulations. Recipients must take reasonable steps to ensure meaningful access to their programs and activities by LEP persons. Limited English Proficiency Policy Statement It is the policy of PATCO to take reasonable steps to provide meaningful access to its programs, activities, and services for persons with Limited English Proficiency (LEP). PATCO is committed to complying with federal requirements in providing meaningful access to its programs, activities, and services for LEP persons. Purpose of the LEP Plan The purpose of this Limited English Proficiency (LEP) Plan is to demonstrate compliance with Title VI of the Civil Rights Act of 1964, and to fulfill the requirements of Executive Order 13166. Title VI of the Civil Rights Act of 1964 prohibits discrimination based on the grounds of race, color, or national origin by any entity receiving federal financial assistance. The purpose of Executive Order 13166 is to ensure accessibility to programs and services to otherwise eligible persons who are not proficient in the English language. The purpose of the LEP Plan is to address access needs of persons who do not speak English as their primary language and who have a limited ability to read, write, speak, or understand English. Reasonable Steps to Provide Access Executive Order 13166 directs recipients of federal financial assistance to take reasonable steps to provide LEP persons with meaningful access to their programs, activities and services. The key
Delaware River Port Authority/Port Authority Transit Corporation
_____________________________________________________________________________________
Title VI Program - March 2019 28
to providing meaningful access for LEP persons is to ensure that effective communication exists between the recipient and the LEP person. It is critical that PATCO be proactive in informing and engaging individuals from different cultures and backgrounds in community meetings, planning, service and fare changes, and project development. To accomplish effective communication, PATCO will perform the following actions:
Conduct a needs assessment
Provide for oral and written language assistance
Notify LEP customers of the availability of language assistance services
Translate vital documents in languages other than English
Train staff
Monitor and update the LEP Plan
FOUR-FACTOR ANALYSIS
To identify PATCO’s LEP needs, a four-factor analysis was conducted that analyzed the following: 1. The number and proportion of LEP persons served or encountered in eligible service
populations. 2. The frequency with which LEP individuals come into contact with programs, activities or
services. 3. The importance of the programs, activities and services to LEP persons. 4. The resources available to recipients and the costs.
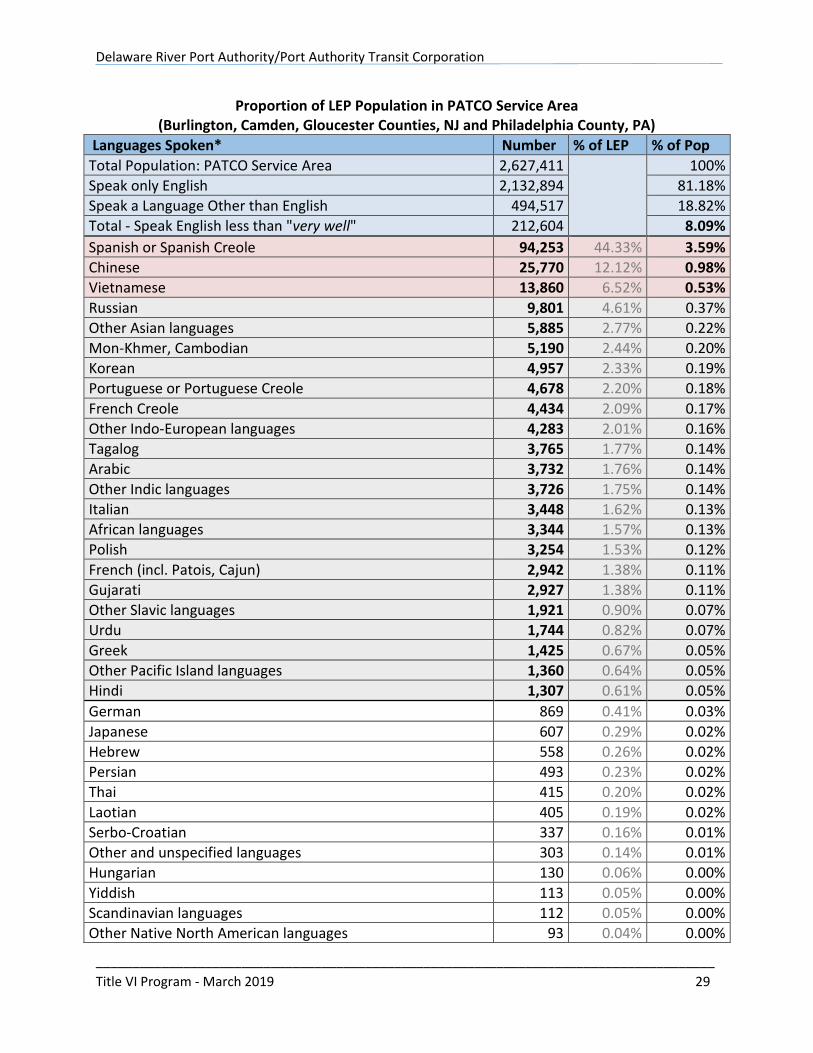
Factor 1: LEP Persons Served PATCO’s service area covers Burlington County, Camden County, and Gloucester County in New Jersey and Philadelphia County in Pennsylvania. The American Community Survey (ACS) 2015 five-year estimates1 show the population of persons over the age of five in PATCO’s service area who speak a language other than English is 18.82 percent or 494,517. Of the 18.82 percent population that speaks a language other than English, 212,604 persons or 8.09 percent speak English less than “very well”. Out of the languages spoken in the four county PATCO service area, there are three primary languages where more than five percent of the identified LEP population speak English less than “very well”: Spanish or Spanish Creole, Chinese, and Vietnamese as shown on the following table.
1 2011-2015 American Community Survey 5-Year Estimates, Table B16001, Burlington County, NJ; Camden County, NJ; Gloucester County, NJ; Philadelphia County, PA: Language Spoken at Home by Ability to Speak English For the Population 5 Years and Over
Delaware River Port Authority/Port Authority Transit Corporation
_____________________________________________________________________________________
Title VI Program - March 2019 29
Proportion of LEP Population in PATCO Service Area (Burlington, Camden, Gloucester Counties, NJ and Philadelphia County, PA)
Languages Spoken* Number % of LEP % of Pop
Total Population: PATCO Service Area 2,627,411
100%
Speak only English 2,132,894 81.18%
Speak a Language Other than English 494,517 18.82%
Total - Speak English less than "very well" 212,604 8.09%
Spanish or Spanish Creole 94,253 44.33% 3.59%
Chinese 25,770 12.12% 0.98%
Vietnamese 13,860 6.52% 0.53%
Russian 9,801 4.61% 0.37%
Other Asian languages 5,885 2.77% 0.22%
Mon-Khmer, Cambodian 5,190 2.44% 0.20%
Korean 4,957 2.33% 0.19%
Portuguese or Portuguese Creole 4,678 2.20% 0.18%
French Creole 4,434 2.09% 0.17%
Other Indo-European languages 4,283 2.01% 0.16%
Tagalog 3,765 1.77% 0.14%
Arabic 3,732 1.76% 0.14%
Other Indic languages 3,726 1.75% 0.14%
Italian 3,448 1.62% 0.13%
African languages 3,344 1.57% 0.13%
Polish 3,254 1.53% 0.12%
French (incl. Patois, Cajun) 2,942 1.38% 0.11%
Gujarati 2,927 1.38% 0.11%
Other Slavic languages 1,921 0.90% 0.07%
Urdu 1,744 0.82% 0.07%
Greek 1,425 0.67% 0.05%
Other Pacific Island languages 1,360 0.64% 0.05%
Hindi 1,307 0.61% 0.05%
German 869 0.41% 0.03%
Japanese 607 0.29% 0.02%
Hebrew 558 0.26% 0.02%
Persian 493 0.23% 0.02%
Thai 415 0.20% 0.02%
Laotian 405 0.19% 0.02%
Serbo-Croatian 337 0.16% 0.01%
Other and unspecified languages 303 0.14% 0.01%
Hungarian 130 0.06% 0.00%
Yiddish 113 0.05% 0.00%
Scandinavian languages 112 0.05% 0.00%
Other Native North American languages 93 0.04% 0.00%
Delaware River Port Authority/Port Authority Transit Corporation
_____________________________________________________________________________________
Title VI Program - March 2019 30
Languages Spoken* Number % of LEP % of Pop
Hmong 55 0.03% 0.00%
Other West Germanic languages 54 0.03% 0.00%
Armenian 54 0.03% 0.00%
Navajo - 0.00% 0.00%
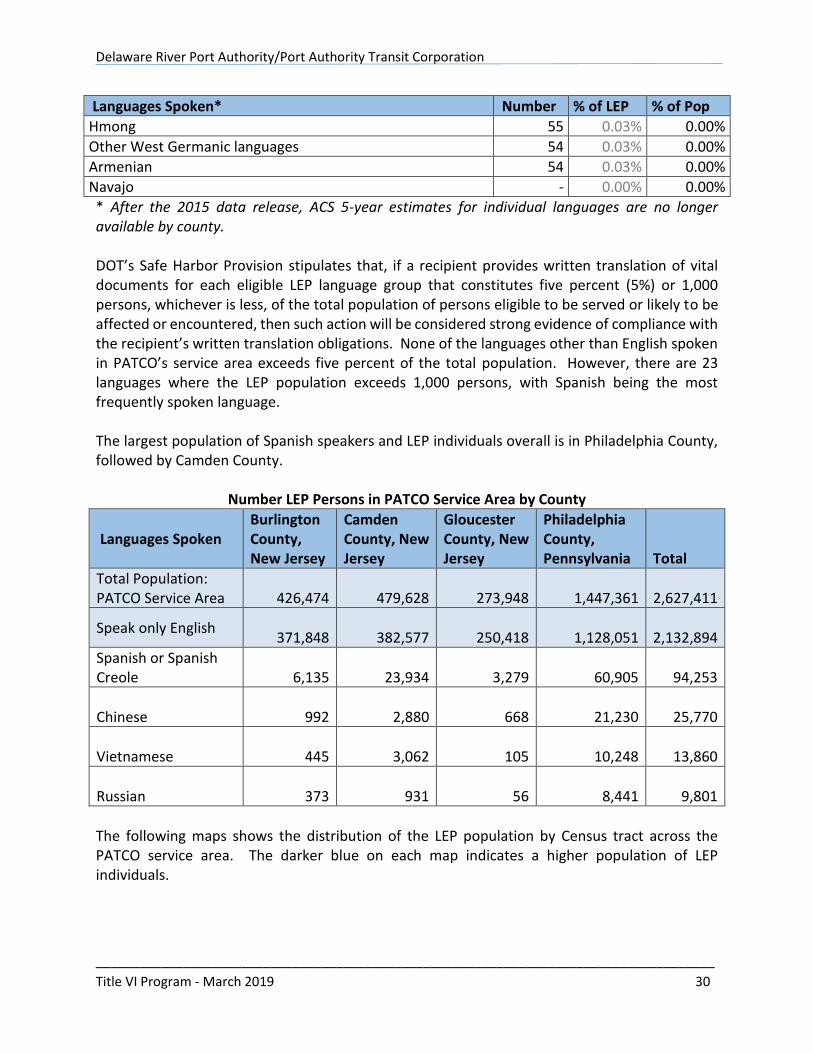
* After the 2015 data release, ACS 5-year estimates for individual languages are no longer available by county. DOT’s Safe Harbor Provision stipulates that, if a recipient provides written translation of vital documents for each eligible LEP language group that constitutes five percent (5%) or 1,000 persons, whichever is less, of the total population of persons eligible to be served or likely to be affected or encountered, then such action will be considered strong evidence of compliance with the recipient’s written translation obligations. None of the languages other than English spoken in PATCO’s service area exceeds five percent of the total population. However, there are 23 languages where the LEP population exceeds 1,000 persons, with Spanish being the most frequently spoken language. The largest population of Spanish speakers and LEP individuals overall is in Philadelphia County, followed by Camden County.
Number LEP Persons in PATCO Service Area by County
Languages Spoken Burlington County, New Jersey
Camden County, New Jersey
Gloucester County, New Jersey
Philadelphia County, Pennsylvania Total
Total Population: PATCO Service Area
426,474
479,628
273,948
1,447,361
2,627,411
Speak only English
371,848
382,577
250,418
1,128,051
2,132,894
Spanish or Spanish Creole
6,135
23,934
3,279
60,905
94,253
Chinese
992
2,880
668
21,230
25,770
Vietnamese
445
3,062
105
10,248
13,860
Russian
373
931
56
8,441
9,801
The following maps shows the distribution of the LEP population by Census tract across the PATCO service area. The darker blue on each map indicates a higher population of LEP individuals.
Delaware River Port Authority/Port Authority Transit Corporation
_____________________________________________________________________________________
Title VI Program - March 2019 31
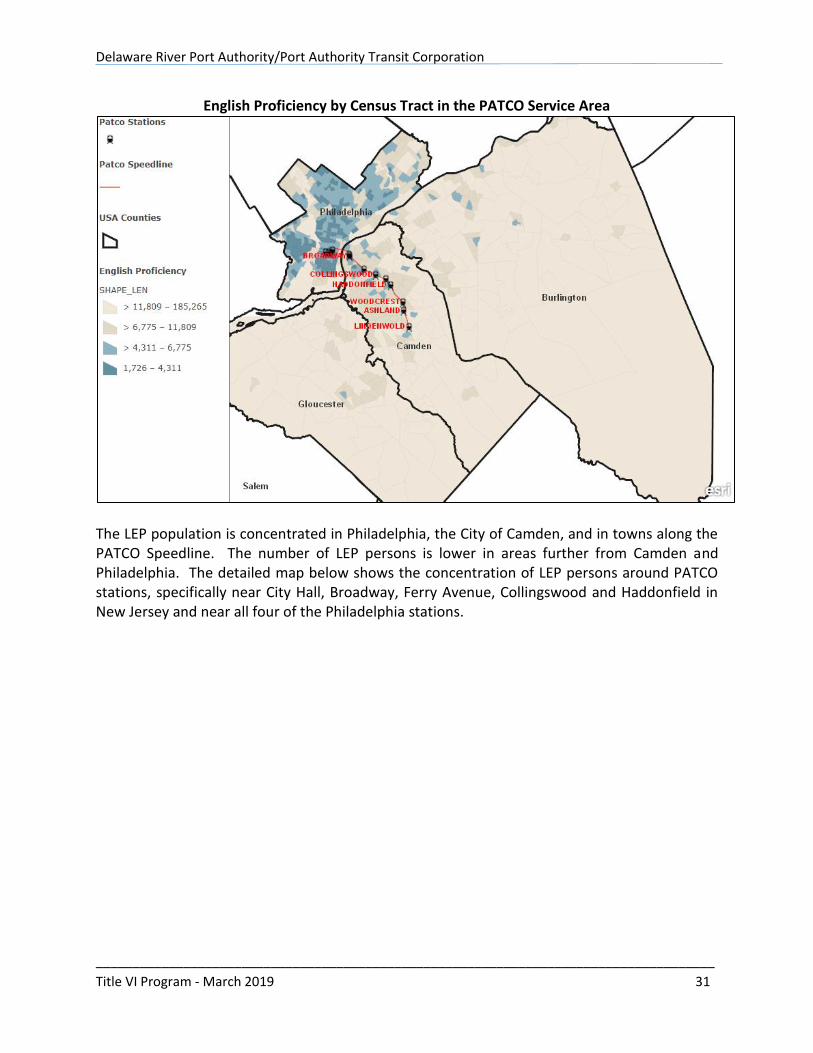
English Proficiency by Census Tract in the PATCO Service Area
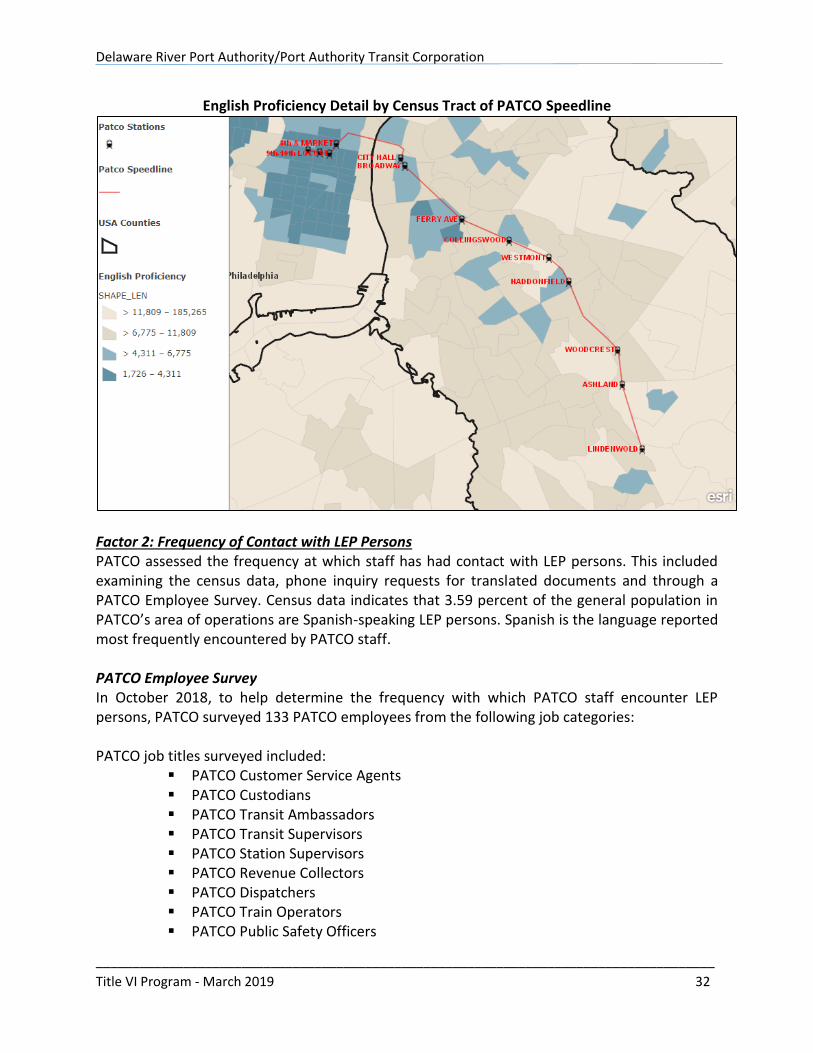
The LEP population is concentrated in Philadelphia, the City of Camden, and in towns along the PATCO Speedline. The number of LEP persons is lower in areas further from Camden and Philadelphia. The detailed map below shows the concentration of LEP persons around PATCO stations, specifically near City Hall, Broadway, Ferry Avenue, Collingswood and Haddonfield in New Jersey and near all four of the Philadelphia stations.
Delaware River Port Authority/Port Authority Transit Corporation
_____________________________________________________________________________________
Title VI Program - March 2019 32
English Proficiency Detail by Census Tract of PATCO Speedline
Factor 2: Frequency of Contact with LEP Persons PATCO assessed the frequency at which staff has had contact with LEP persons. This included examining the census data, phone inquiry requests for translated documents and through a PATCO Employee Survey. Census data indicates that 3.59 percent of the general population in PATCO’s area of operations are Spanish-speaking LEP persons. Spanish is the language reported most frequently encountered by PATCO staff. PATCO Employee Survey In October 2018, to help determine the frequency with which PATCO staff encounter LEP persons, PATCO surveyed 133 PATCO employees from the following job categories: PATCO job titles surveyed included:
PATCO Customer Service Agents PATCO Custodians PATCO Transit Ambassadors PATCO Transit Supervisors PATCO Station Supervisors PATCO Revenue Collectors PATCO Dispatchers PATCO Train Operators PATCO Public Safety Officers
Delaware River Port Authority/Port Authority Transit Corporation
_____________________________________________________________________________________
Title VI Program - March 2019 33
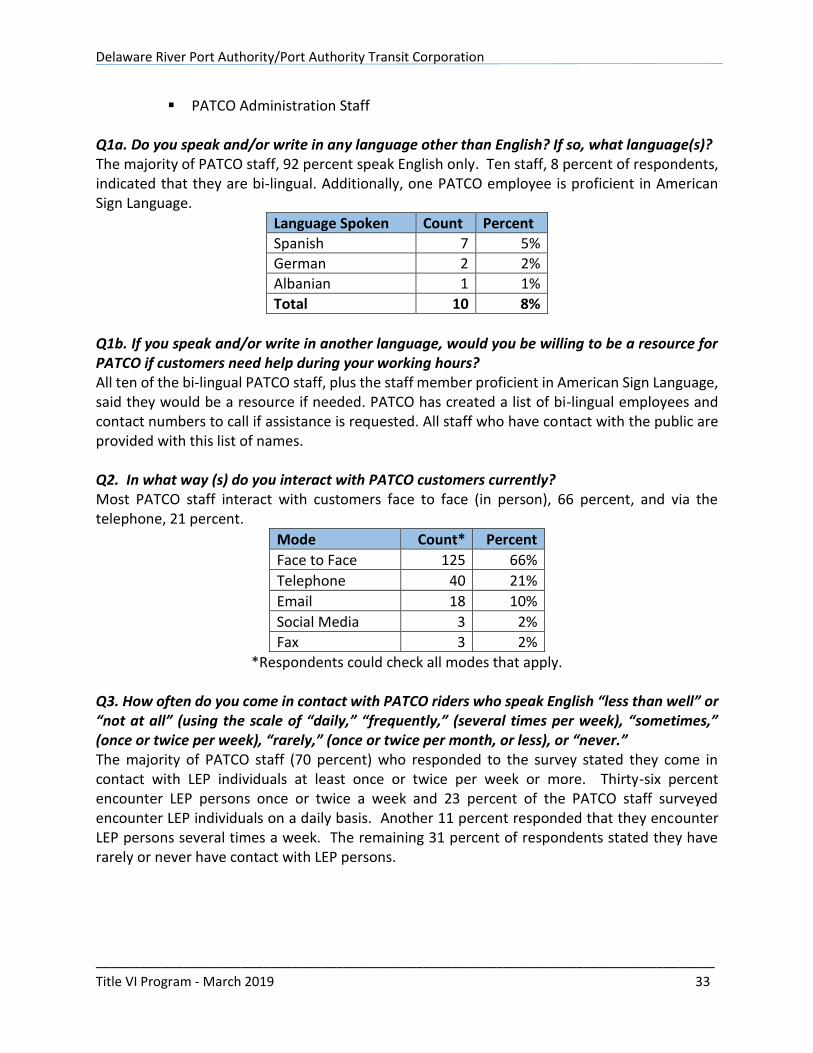
PATCO Administration Staff Q1a. Do you speak and/or write in any language other than English? If so, what language(s)? The majority of PATCO staff, 92 percent speak English only. Ten staff, 8 percent of respondents, indicated that they are bi-lingual. Additionally, one PATCO employee is proficient in American Sign Language.
Language Spoken Count Percent
Spanish 7 5%
German 2 2%
Albanian 1 1%
Total 10 8%
Q1b. If you speak and/or write in another language, would you be willing to be a resource for PATCO if customers need help during your working hours? All ten of the bi-lingual PATCO staff, plus the staff member proficient in American Sign Language, said they would be a resource if needed. PATCO has created a list of bi-lingual employees and contact numbers to call if assistance is requested. All staff who have contact with the public are provided with this list of names. Q2. In what way (s) do you interact with PATCO customers currently? Most PATCO staff interact with customers face to face (in person), 66 percent, and via the telephone, 21 percent.
Mode Count* Percent
Face to Face 125 66%
Telephone 40 21%
Email 18 10%
Social Media 3 2%
Fax 3 2%
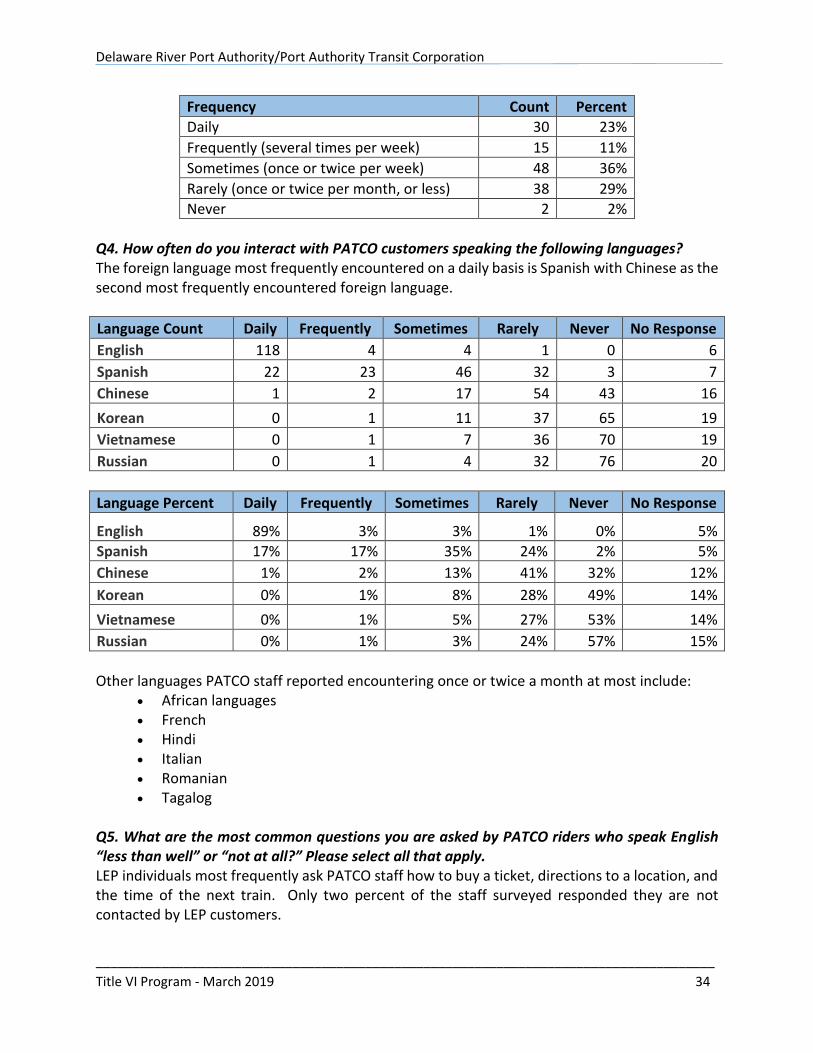
*Respondents could check all modes that apply. Q3. How often do you come in contact with PATCO riders who speak English “less than well” or “not at all” (using the scale of “daily,” “frequently,” (several times per week), “sometimes,” (once or twice per week), “rarely,” (once or twice per month, or less), or “never.” The majority of PATCO staff (70 percent) who responded to the survey stated they come in contact with LEP individuals at least once or twice per week or more. Thirty-six percent encounter LEP persons once or twice a week and 23 percent of the PATCO staff surveyed encounter LEP individuals on a daily basis. Another 11 percent responded that they encounter LEP persons several times a week. The remaining 31 percent of respondents stated they have rarely or never have contact with LEP persons.
Delaware River Port Authority/Port Authority Transit Corporation
_____________________________________________________________________________________
Title VI Program - March 2019 34
Frequency Count Percent
Daily 30 23%
Frequently (several times per week) 15 11%
Sometimes (once or twice per week) 48 36%
Rarely (once or twice per month, or less) 38 29%
Never 2 2%
Q4. How often do you interact with PATCO customers speaking the following languages? The foreign language most frequently encountered on a daily basis is Spanish with Chinese as the second most frequently encountered foreign language.
Language Count Daily Frequently Sometimes Rarely Never No Response
English 118 4 4 1 0 6
Spanish 22 23 46 32 3 7
Chinese 1 2 17 54 43 16
Korean 0 1 11 37 65 19
Vietnamese 0 1 7 36 70 19
Russian 0 1 4 32 76 20
Language Percent Daily Frequently Sometimes Rarely Never No Response
English 89% 3% 3% 1% 0% 5%
Spanish 17% 17% 35% 24% 2% 5%
Chinese 1% 2% 13% 41% 32% 12%
Korean 0% 1% 8% 28% 49% 14%
Vietnamese 0% 1% 5% 27% 53% 14%
Russian 0% 1% 3% 24% 57% 15%
Other languages PATCO staff reported encountering once or twice a month at most include:
African languages French Hindi Italian Romanian Tagalog
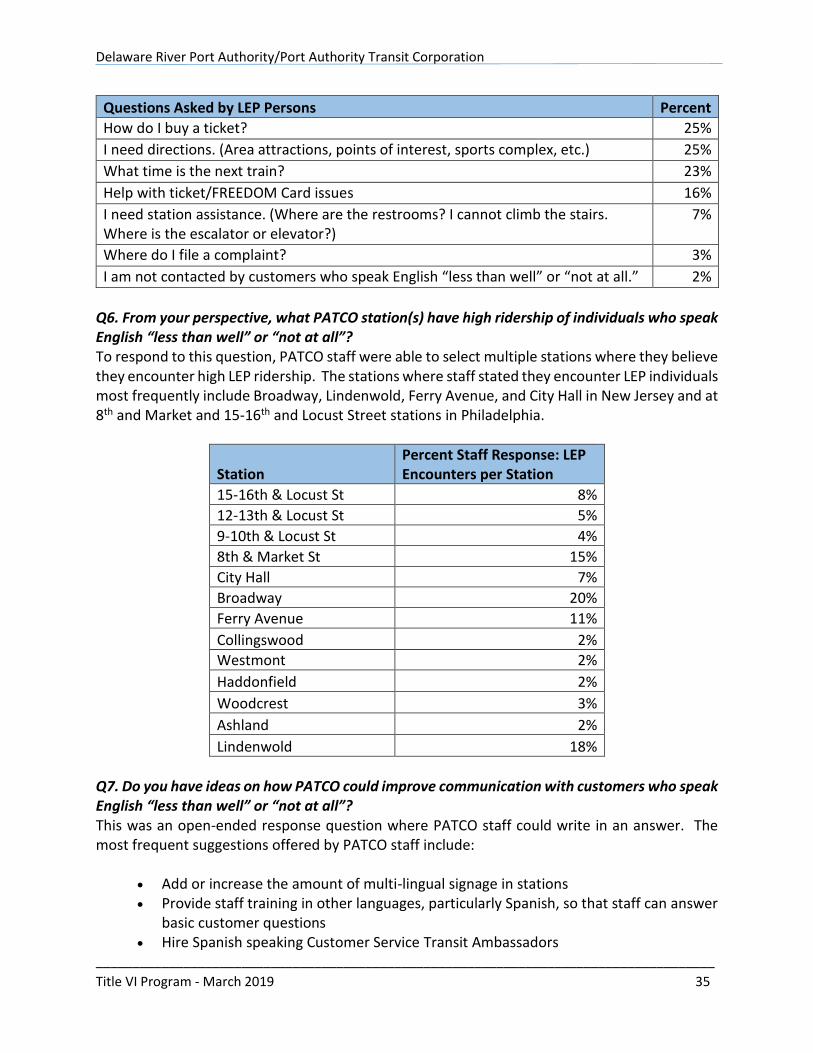
Q5. What are the most common questions you are asked by PATCO riders who speak English “less than well” or “not at all?” Please select all that apply. LEP individuals most frequently ask PATCO staff how to buy a ticket, directions to a location, and the time of the next train. Only two percent of the staff surveyed responded they are not contacted by LEP customers.
Delaware River Port Authority/Port Authority Transit Corporation
_____________________________________________________________________________________
Title VI Program - March 2019 35
Questions Asked by LEP Persons Percent
How do I buy a ticket? 25%
I need directions. (Area attractions, points of interest, sports complex, etc.) 25%
What time is the next train? 23%
Help with ticket/FREEDOM Card issues 16%
I need station assistance. (Where are the restrooms? I cannot climb the stairs. Where is the escalator or elevator?)
7%
Where do I file a complaint? 3%
I am not contacted by customers who speak English “less than well” or “not at all.” 2%
Q6. From your perspective, what PATCO station(s) have high ridership of individuals who speak English “less than well” or “not at all”? To respond to this question, PATCO staff were able to select multiple stations where they believe they encounter high LEP ridership. The stations where staff stated they encounter LEP individuals most frequently include Broadway, Lindenwold, Ferry Avenue, and City Hall in New Jersey and at 8th and Market and 15-16th and Locust Street stations in Philadelphia.
Station Percent Staff Response: LEP Encounters per Station
15-16th & Locust St 8%
12-13th & Locust St 5%
9-10th & Locust St 4%
8th & Market St 15%
City Hall 7%
Broadway 20%
Ferry Avenue 11%
Collingswood 2%
Westmont 2%
Haddonfield 2%
Woodcrest 3%
Ashland 2%
Lindenwold 18%
Q7. Do you have ideas on how PATCO could improve communication with customers who speak English “less than well” or “not at all”? This was an open-ended response question where PATCO staff could write in an answer. The most frequent suggestions offered by PATCO staff include:
Add or increase the amount of multi-lingual signage in stations Provide staff training in other languages, particularly Spanish, so that staff can answer
basic customer questions Hire Spanish speaking Customer Service Transit Ambassadors
Delaware River Port Authority/Port Authority Transit Corporation
_____________________________________________________________________________________
Title VI Program - March 2019 36
Offer printed timetables in multiple languages Use more pictographs instead of text
Other suggestions from staff that PATCO has already implemented included:
Addition of six languages on the ticket vending machines (TVMs); although some staff noted that customers are not aware of this language assistance feature
Availability of a language line that staff can use to access language translation services when assisting customers
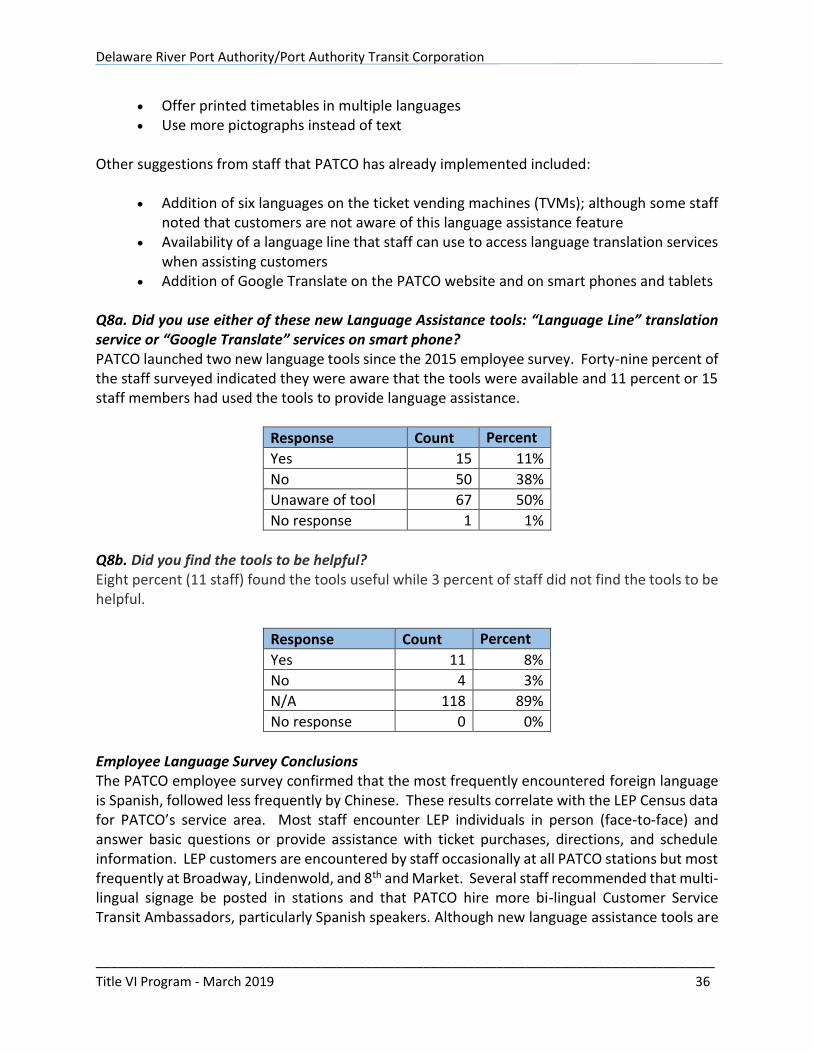
Addition of Google Translate on the PATCO website and on smart phones and tablets Q8a. Did you use either of these new Language Assistance tools: “Language Line” translation service or “Google Translate” services on smart phone? PATCO launched two new language tools since the 2015 employee survey. Forty-nine percent of the staff surveyed indicated they were aware that the tools were available and 11 percent or 15 staff members had used the tools to provide language assistance.
Response Count Percent
Yes 15 11%
No 50 38%
Unaware of tool 67 50%
No response 1 1%
Q8b. Did you find the tools to be helpful? Eight percent (11 staff) found the tools useful while 3 percent of staff did not find the tools to be helpful.
Response Count Percent
Yes 11 8%
No 4 3%
N/A 118 89%
No response 0 0%
Employee Language Survey Conclusions The PATCO employee survey confirmed that the most frequently encountered foreign language is Spanish, followed less frequently by Chinese. These results correlate with the LEP Census data for PATCO’s service area. Most staff encounter LEP individuals in person (face-to-face) and answer basic questions or provide assistance with ticket purchases, directions, and schedule information. LEP customers are encountered by staff occasionally at all PATCO stations but most frequently at Broadway, Lindenwold, and 8th and Market. Several staff recommended that multi-lingual signage be posted in stations and that PATCO hire more bi-lingual Customer Service Transit Ambassadors, particularly Spanish speakers. Although new language assistance tools are
Delaware River Port Authority/Port Authority Transit Corporation
_____________________________________________________________________________________
Title VI Program - March 2019 37
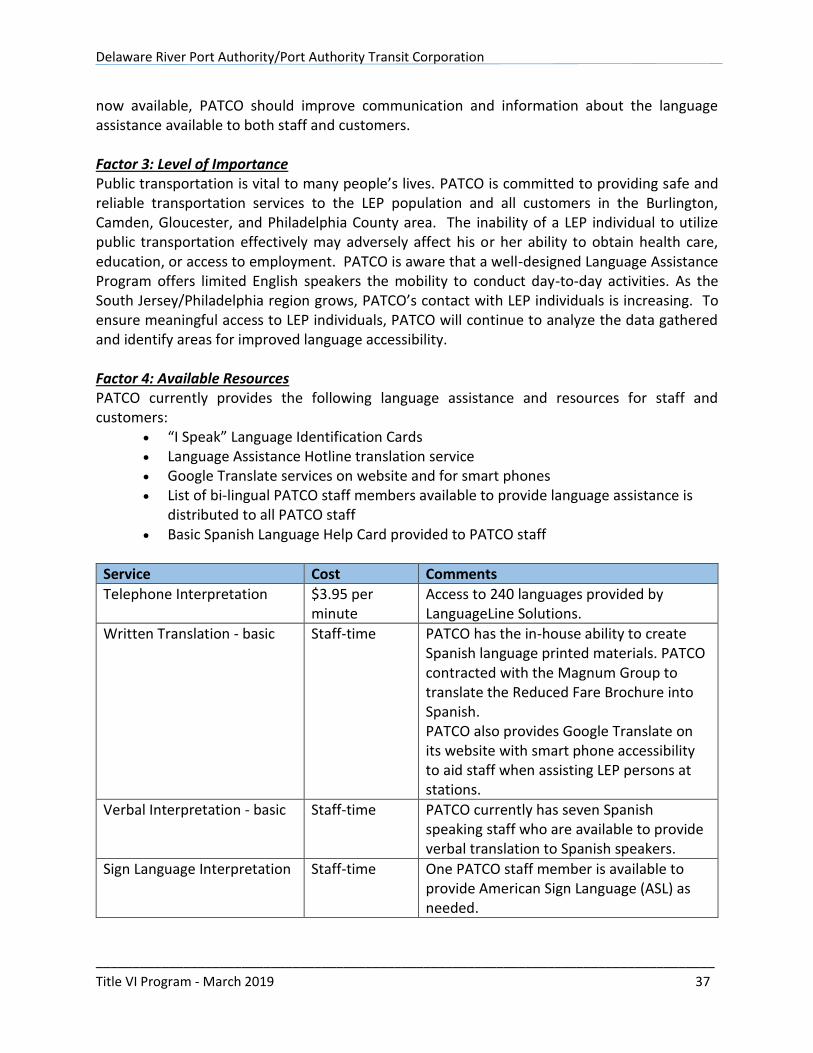
now available, PATCO should improve communication and information about the language assistance available to both staff and customers. Factor 3: Level of Importance Public transportation is vital to many people’s lives. PATCO is committed to providing safe and reliable transportation services to the LEP population and all customers in the Burlington, Camden, Gloucester, and Philadelphia County area. The inability of a LEP individual to utilize public transportation effectively may adversely affect his or her ability to obtain health care, education, or access to employment. PATCO is aware that a well-designed Language Assistance Program offers limited English speakers the mobility to conduct day-to-day activities. As the South Jersey/Philadelphia region grows, PATCO’s contact with LEP individuals is increasing. To ensure meaningful access to LEP individuals, PATCO will continue to analyze the data gathered and identify areas for improved language accessibility. Factor 4: Available Resources PATCO currently provides the following language assistance and resources for staff and customers:
“I Speak” Language Identification Cards Language Assistance Hotline translation service Google Translate services on website and for smart phones List of bi-lingual PATCO staff members available to provide language assistance is
distributed to all PATCO staff Basic Spanish Language Help Card provided to PATCO staff
Service Cost Comments
Telephone Interpretation $3.95 per minute
Access to 240 languages provided by LanguageLine Solutions.
Written Translation - basic Staff-time PATCO has the in-house ability to create Spanish language printed materials. PATCO contracted with the Magnum Group to translate the Reduced Fare Brochure into Spanish. PATCO also provides Google Translate on its website with smart phone accessibility to aid staff when assisting LEP persons at stations.
Verbal Interpretation - basic Staff-time PATCO currently has seven Spanish speaking staff who are available to provide verbal translation to Spanish speakers.
Sign Language Interpretation Staff-time One PATCO staff member is available to provide American Sign Language (ASL) as needed.
Delaware River Port Authority/Port Authority Transit Corporation
_____________________________________________________________________________________
Title VI Program - March 2019 38
Conclusion After analysis of the population in PATCO’s service area, the significant LEP populations, and those persons seeking services, it was determined, that there is a Spanish speaking population within the PATCO service area needing meaningful access to services and programs. Numerous other non-English language speaking individuals are encountered but at much lesser frequency.
Delaware River Port Authority/Port Authority Transit Corporation
_____________________________________________________________________________________
Title VI Program - March 2019 39
LANGUAGE ASSISTANCE PLAN
Ensuring Access for People with Limited English Proficiency
PATCO has developed this Language Assistance Plan (LAP) to help identify reasonable steps to provide language assistance for LEP persons who seek meaningful access to PATCO services. PATCO is able to meet the needs of most LEP individuals by providing language assistance with bi-lingual staff, telephone translation, and face-to-face translation services. PATCO employees have been identified who are able to provide language assistance to persons speaking the following languages:
Spanish German Albanian
If further translation services are needed, PATCO staff have access to an over the telephone foreign language interpretation vendor, which can be utilized. Face-to-face verbal language interpreter services and written language translation services can generally be handled with in-house bi-lingual Spanish speaking employees. PATCO occasionally competitively contracts with written language translation vendors as needed, such as for the Reduced Fare Brochure, or for languages other than Spanish. PATCO will continue to monitor document translation needs for LEP populations and will provide translated documents free of charge to customers as needed or requested. PATCO has not received any requests for document translation other than in Spanish. Notification of Language Assistance Information regarding free language assistance will be posted in public areas. PATCO will notify the Hispanic community that they have the right to free language assistance that includes request for documents and/or materials printed in the Spanish language. Notification regarding the availability of services will be provided through neighborhood community meetings, brochures, minority newspapers, and information disseminated to the public by PATCO. PATCO will also provide employees with information on the language accessibility tools available and how to access them to improve customer assistance. Language Assistance Measures PATCO provides the following language assistance to LEP individuals:
The identification and use of bi-lingual staff to assist LEP individuals who need language assistance either on the telephone or in person, including at PATCO stations, the utilization of bi-lingual Transit Ambassadors to assist Spanish speaking customers in using PATCO. PATCO will continue to recruit and employ bi-lingual employees, namely station supervisors and customer service agents who have the most frequent contact with the LEP population and who will be able to provide the necessary assistance.
Delaware River Port Authority/Port Authority Transit Corporation
_____________________________________________________________________________________
Title VI Program - March 2019 40
Google Translate, an on-line language translation service that instantly translates text and
webpages into 103 languages, including Spanish, is on the PATCO website, www.ridepatco.org, which assists LEP individuals when using the website. The Title VI Notice, Title VI Complaint Form, and Complaint Procedures are provided on the website in Spanish, Chinese, Korean, Vietnamese and Russian.
Station ticket vending machines that have Spanish, Chinese, Korean, Vietnamese and
Russian language columns.
Reduced fare brochures and applications for seniors, disabled and Medicare holders are published in Spanish.
Vital written documents such as the Notice of Title VI Rights, Title VI Complaint forms,
and Title VI Complaint Procedures are available in Spanish, Chinese, Korean, Vietnamese and Russian and are available on PATCO’s website, www.ridepatco.org, and at the administrative offices.
If necessary, PATCO will contract with a professional translation service to assist in the translation of important information. Additionally, PATCO will continue to maintain its equipment (i.e. ticket vending machines), its website and vital written documentation to make sure it is translated into the languages as determined by the Four-Factor Analysis.
In the event of a major service change and/or fare increase, according to the resources available, PATCO proposes the following as part of its Language Assistance Plan:
Post public meeting notices translated in Spanish, Chinese, Korean, Vietnamese and Russian at PATCO Stations as a method to provide notice to LEP populations of public meetings.
Post notices of language assistance at various public meetings and events and include
language that provides a number to call at PATCO to request specific language services.
Have bi-lingual staff available at Open Houses and public meetings in order to greet attendees, and to assess and inform them of translation services available.
Review vital written documents necessary to understand PATCO’s services and benefits
(particularly those relating to a major service change or fare increase) and determine which documents, in addition to those already translated into Spanish, need to be translated into other languages.
Continue to identify and use channels of communication on which the LEP community
relies, including minority newspapers and radio stations.
Delaware River Port Authority/Port Authority Transit Corporation
_____________________________________________________________________________________
Title VI Program - March 2019 41
Foster relationships with businesses, chambers of commerce and organizations that serve
immigrant populations. Staff Training Training is provided to staff members on policies and procedures concerning language assistance and ways to determine whether an individual needs assistance services. The following is a list of training provided to staff during the 2016-2018 period: New Employee Orientation All newly hired employees receive training that includes discussion on the Language Assistance Plan and its implementation as well as an overview of the language assistance tools available and how PATCO translates information into different languages. During this training, new employees receive "I Speak Cards", are shown how to use Google Translate, and are provided with the list of bi-lingual PATCO staff who have volunteered to provide language assistance. Newly hired bi-lingual staff are asked if they would like to volunteer to be included on the bi-lingual staff list. Additionally, employees are trained on how to handle complaints filed by LEP individuals. Customer Service Training In September 2017, PATCO provided customer service training to all Transit Ambassadors that included information on the types of language tools available and how to access them when providing customer assistance to LEP persons. Transit Ambassadors were provided with “I Speak Cards", instructions on accessing the language line provided by LanguageLine Solutions, and training on common Spanish phrases along with a basic Spanish help card to assist employees with answering the most frequent questions asked by Spanish speaking customers. PATCO would like to expand this training to more employees in the future. In 2018, PATCO explored the use of and tested a live video version of the language line to provide improved service to LEP persons. The existing telephone version of the language line would still be the best and most effective solution for PATCO Customer Service Agents. However, Transit Ambassadors would be able to provide faster and more efficient assistance to LEP customers through the video service. PATCO has plans to purchase the video option for Transit Ambassadors. Monitoring the LEP Plan PATCO’s Language Assistance Plan is designed to be updated easily. At a minimum, PATCO will follow the Title VI Program update submission schedule of every three (3) years. PATCO will provide notice of any changes in services to the LEP public and employees and develop a process for determining, on an ongoing basis, whether new documents, services and activities need to be made accessible to LEP individuals. PATCO will continuously evaluate the plan to determine if changes have occurred in:
The current LEP populations in the service area or population affected or encountered
Delaware River Port Authority/Port Authority Transit Corporation
_____________________________________________________________________________________
Title VI Program - March 2019 42
Frequency of encounters with LEP language groups
Nature and importance of activities to LEP persons
Available resources, including technological advances and sources of additional resources and the cost imposed
The staff’s knowledge and understanding of the LEP plan and how it is implemented
The identified sources for assistance to ensure they are still available and viable
LEP complaints and requests in changes to the type of language assistance provided
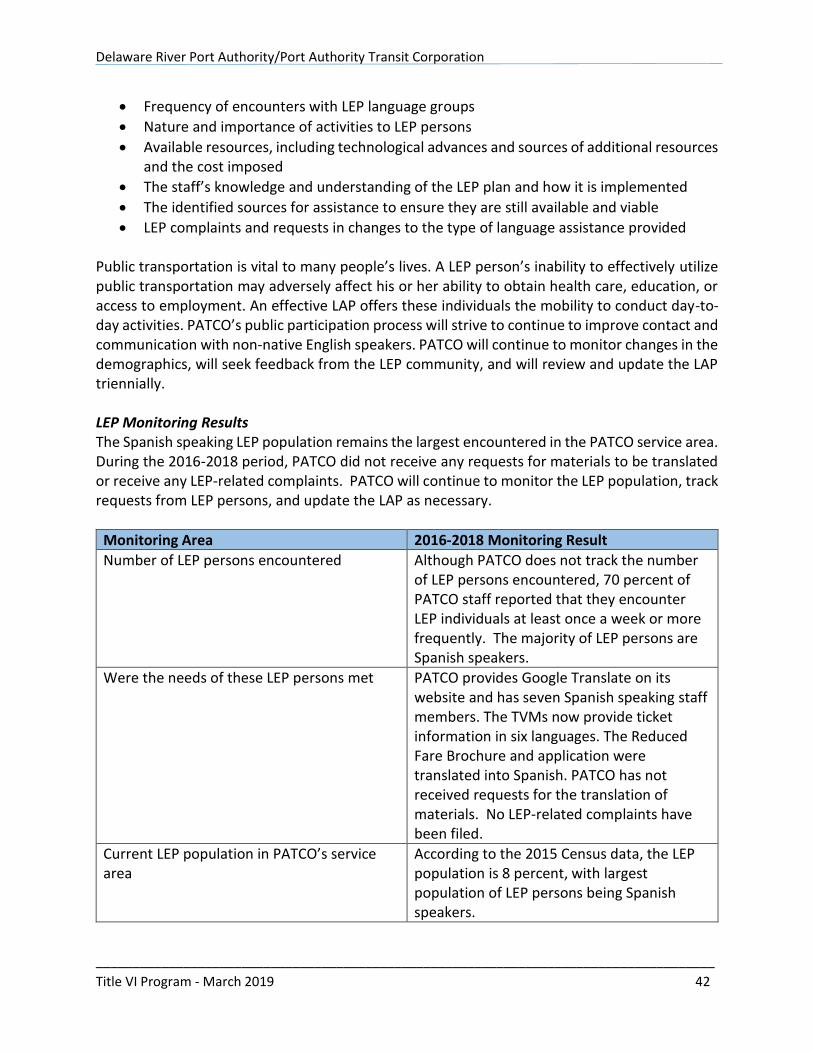
Public transportation is vital to many people’s lives. A LEP person’s inability to effectively utilize public transportation may adversely affect his or her ability to obtain health care, education, or access to employment. An effective LAP offers these individuals the mobility to conduct day-to-day activities. PATCO’s public participation process will strive to continue to improve contact and communication with non-native English speakers. PATCO will continue to monitor changes in the demographics, will seek feedback from the LEP community, and will review and update the LAP triennially. LEP Monitoring Results The Spanish speaking LEP population remains the largest encountered in the PATCO service area. During the 2016-2018 period, PATCO did not receive any requests for materials to be translated or receive any LEP-related complaints. PATCO will continue to monitor the LEP population, track requests from LEP persons, and update the LAP as necessary.
Monitoring Area 2016-2018 Monitoring Result
Number of LEP persons encountered Although PATCO does not track the number of LEP persons encountered, 70 percent of PATCO staff reported that they encounter LEP individuals at least once a week or more frequently. The majority of LEP persons are Spanish speakers.
Were the needs of these LEP persons met PATCO provides Google Translate on its website and has seven Spanish speaking staff members. The TVMs now provide ticket information in six languages. The Reduced Fare Brochure and application were translated into Spanish. PATCO has not received requests for the translation of materials. No LEP-related complaints have been filed.
Current LEP population in PATCO’s service area
According to the 2015 Census data, the LEP population is 8 percent, with largest population of LEP persons being Spanish speakers.
Delaware River Port Authority/Port Authority Transit Corporation
_____________________________________________________________________________________
Title VI Program - March 2019 43
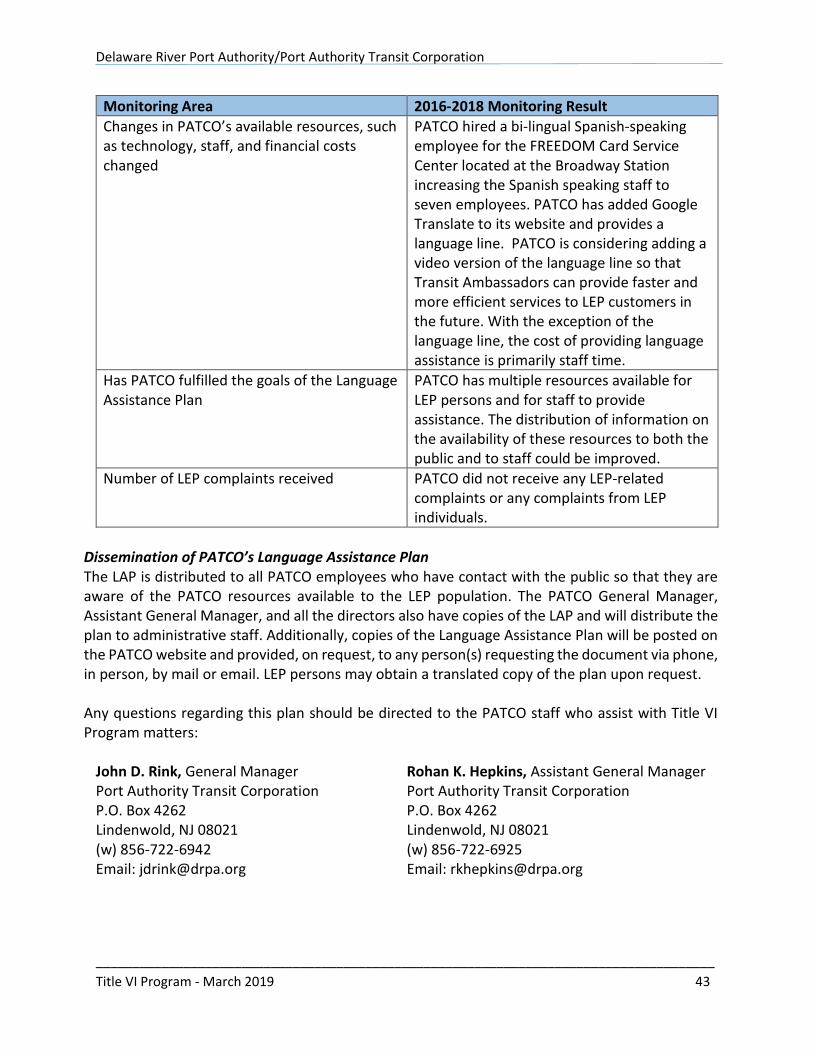
Monitoring Area 2016-2018 Monitoring Result
Changes in PATCO’s available resources, such as technology, staff, and financial costs changed
PATCO hired a bi-lingual Spanish-speaking employee for the FREEDOM Card Service Center located at the Broadway Station increasing the Spanish speaking staff to seven employees. PATCO has added Google Translate to its website and provides a language line. PATCO is considering adding a video version of the language line so that Transit Ambassadors can provide faster and more efficient services to LEP customers in the future. With the exception of the language line, the cost of providing language assistance is primarily staff time.
Has PATCO fulfilled the goals of the Language Assistance Plan
PATCO has multiple resources available for LEP persons and for staff to provide assistance. The distribution of information on the availability of these resources to both the public and to staff could be improved.
Number of LEP complaints received PATCO did not receive any LEP-related complaints or any complaints from LEP individuals.
Dissemination of PATCO’s Language Assistance Plan The LAP is distributed to all PATCO employees who have contact with the public so that they are aware of the PATCO resources available to the LEP population. The PATCO General Manager, Assistant General Manager, and all the directors also have copies of the LAP and will distribute the plan to administrative staff. Additionally, copies of the Language Assistance Plan will be posted on the PATCO website and provided, on request, to any person(s) requesting the document via phone, in person, by mail or email. LEP persons may obtain a translated copy of the plan upon request. Any questions regarding this plan should be directed to the PATCO staff who assist with Title VI Program matters:
John D. Rink, General Manager Port Authority Transit Corporation P.O. Box 4262 Lindenwold, NJ 08021 (w) 856-722-6942 Email: [email protected]
Rohan K. Hepkins, Assistant General Manager Port Authority Transit Corporation P.O. Box 4262 Lindenwold, NJ 08021 (w) 856-722-6925 Email: [email protected]
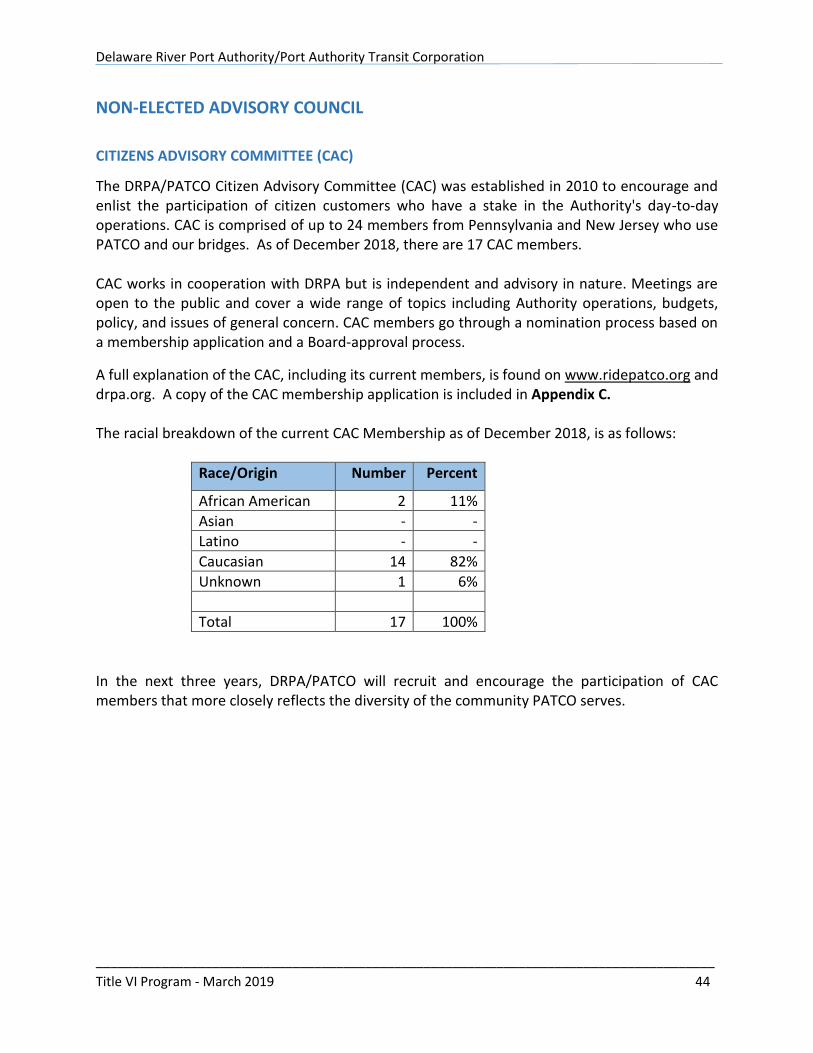
Delaware River Port Authority/Port Authority Transit Corporation
_____________________________________________________________________________________
Title VI Program - March 2019 44
NON-ELECTED ADVISORY COUNCIL
CITIZENS ADVISORY COMMITTEE (CAC)
The DRPA/PATCO Citizen Advisory Committee (CAC) was established in 2010 to encourage and enlist the participation of citizen customers who have a stake in the Authority's day-to-day operations. CAC is comprised of up to 24 members from Pennsylvania and New Jersey who use PATCO and our bridges. As of December 2018, there are 17 CAC members. CAC works in cooperation with DRPA but is independent and advisory in nature. Meetings are open to the public and cover a wide range of topics including Authority operations, budgets, policy, and issues of general concern. CAC members go through a nomination process based on a membership application and a Board-approval process.
A full explanation of the CAC, including its current members, is found on www.ridepatco.org and drpa.org. A copy of the CAC membership application is included in Appendix C. The racial breakdown of the current CAC Membership as of December 2018, is as follows:
Race/Origin Number Percent
African American 2 11%
Asian - -
Latino - -
Caucasian 14 82%
Unknown 1 6%
Total 17 100%
In the next three years, DRPA/PATCO will recruit and encourage the participation of CAC members that more closely reflects the diversity of the community PATCO serves.
Delaware River Port Authority/Port Authority Transit Corporation
_____________________________________________________________________________________
Title VI Program - March 2019 45
PROVIDING ASSISTANCE TO SUB-RECIPIENTS
The DRPA/PATCO is the sole recipient of FTA funding and does not have any sub-recipients.
DETERMINE SITE OR LOCATION OF FACILITIES
No such projects were conducted during the reporting period and no planned activities require land acquisition or the displacement of persons from their residence or place of business.
Delaware River Port Authority/Port Authority Transit Corporation
_____________________________________________________________________________________
Title VI Program - March 2019 46
PATCO SERVICE STANDARDS AND POLICIES
As previously mentioned, PATCO operates one fixed-rail line, which is 14.2 miles long and does not have the ability to deviate from this route. Due to the size and nature of the PATCO system, PATCO does not have minority or non-minority routes. PATCO understands that FTA has additional Title VI program requirements for transit agencies located in an Urbanized Area (UZA) with a population density greater than 200,000 and 50 or more fixed-route peak service vehicles. While PATCO falls within these criteria, these additional requirements appear to be more applicable to larger agencies that operate numerous routes and/or offer multiple modes of travel. Agencies such as these have the ability to eliminate, alter or add service and routes. The following sets forth PATCO’s current service standards and policies:
BACKGROUND
The Federal Transit Administration (FTA) requires that all fixed route providers of public transportation, in order to comply with the provisions of Title VI, must develop quantitative standards for the following elements of service.
Vehicle load: ratio of passengers to the number of seats on the train
Vehicle headways: amount of time between two trains traveling in the same direction on the same route
On-time performance: measure of runs completed on schedule
Service availability: measure of the distribution of routes within the service area
The FTA also requires that all fixed route providers develop qualitative policies for the following elements of service:
Vehicle assignment
Transit amenities
QUANTITATIVE STANDARDS
Vehicle Load PATCO’s fleet consists of 120 railcars, consisting of 60 married pairs. The Series 1000 fleet is capable of
seating 78 passengers with 48 standing passengers for a load ratio of 21:13.
Vehicle Headways PATCO operates a 14.2 mile rail system (one way) and operates 24 hours a day, 7 days a week, 365 days a year. Scheduling, headways and consist configuration involve many factors. These factors include riders per revenue hour, farebox recovery ratio, and funding availability. PATCO also takes into consideration historical patterns as well as special events, which may increase ridership. Below is a summary of the current consist/headway:
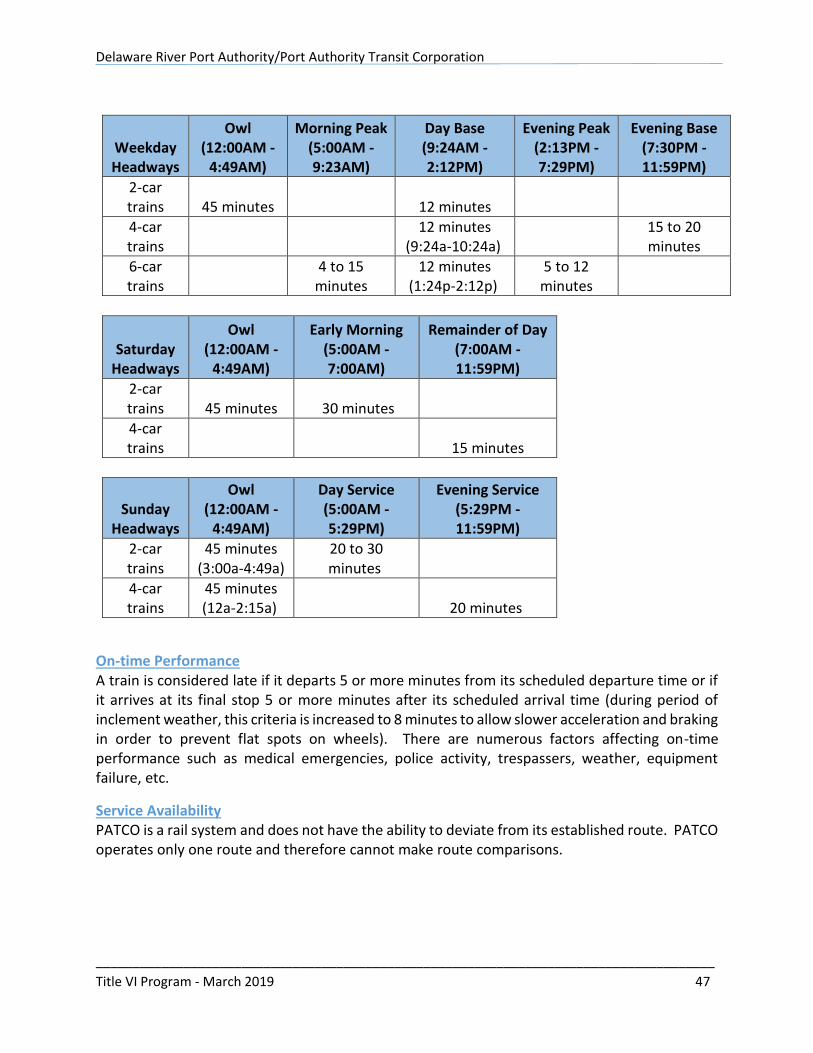
Delaware River Port Authority/Port Authority Transit Corporation
_____________________________________________________________________________________
Title VI Program - March 2019 47
Weekday Headways
Owl (12:00AM -
4:49AM)
Morning Peak (5:00AM - 9:23AM)
Day Base (9:24AM - 2:12PM)
Evening Peak (2:13PM - 7:29PM)
Evening Base (7:30PM - 11:59PM)
2-car trains 45 minutes 12 minutes
4-car trains
12 minutes (9:24a-10:24a)
15 to 20 minutes
6-car trains
4 to 15 minutes
12 minutes (1:24p-2:12p)
5 to 12 minutes
Saturday Headways
Owl (12:00AM -
4:49AM)
Early Morning (5:00AM - 7:00AM)
Remainder of Day (7:00AM - 11:59PM)
2-car trains 45 minutes 30 minutes
4-car trains 15 minutes
Sunday Headways
Owl (12:00AM -
4:49AM)
Day Service (5:00AM - 5:29PM)
Evening Service (5:29PM - 11:59PM)
2-car trains
45 minutes (3:00a-4:49a)
20 to 30 minutes
4-car trains
45 minutes (12a-2:15a) 20 minutes
On-time Performance A train is considered late if it departs 5 or more minutes from its scheduled departure time or if it arrives at its final stop 5 or more minutes after its scheduled arrival time (during period of inclement weather, this criteria is increased to 8 minutes to allow slower acceleration and braking in order to prevent flat spots on wheels). There are numerous factors affecting on-time performance such as medical emergencies, police activity, trespassers, weather, equipment failure, etc.
Service Availability PATCO is a rail system and does not have the ability to deviate from its established route. PATCO operates only one route and therefore cannot make route comparisons.
Delaware River Port Authority/Port Authority Transit Corporation
_____________________________________________________________________________________
Title VI Program - March 2019 48
QUALITATIVE POLICIES
Vehicle Assignment PATCO has only one route; it provides bi-directional trackage. PATCO’s fleet consists of 120 cars, most of which operate as married pairs. The Series 1000 fleet is capable of seating 78 passengers.
Transit Amenities There are limiting factors that affect the decision-making process such as available real estate. For example, PATCO does not own any real estate above many of the subway stations; therefore, parking is not available at those stations. PATCO currently maintains four (4) subway stations in Philadelphia, PA, and nine (9) stations in New Jersey of which two are subway stations in Camden, New Jersey. All stations are equipped with security cameras, emergency call boxes, ticket vending machines (capable of providing instructions in English, Spanish, Russian, Korean, Chinese, and Vietnamese), benches, route maps with connecting transit information, appropriate level of signage, including LED lighted signage on platforms and LCD monitors in stations, public address systems, adequate lighting, escalators in all but two stations and Call-For-Aid phones for information/ticket problems and escalators. The non-subway stations offer parking (both free and paid) including free parking for individuals with disabilities as well as bike racks. All non-subway stations and one subway station are climate controlled. At subway stations where climate control is not possible, ventilation fans have been installed at platform level for added passenger comfort. Seven stations (four subway and three non-subway) are currently equipped with at least one elevator with all stations scheduled to be equipped by the end of 2022. PATCO’s Transit Ambassador program provides enhanced service and assistance to customers on evening and weekends. The purpose of the Transit Ambassadors is to assist patrons who may be unfamiliar with PATCO to navigate the system, assist with ticket questions, as well as walk patrons to their vehicles should they request that service. PATCO considers historical trends to assist with positioning Transit Ambassadors in addition to anticipated station volume. PATCO can reallocate Transit Ambassadors based on the needs of the organization. A bi-lingual Spanish-speaking employee was hired for the FREEDOM Card Service Center located at the Broadway Station based upon customer interactions and need.
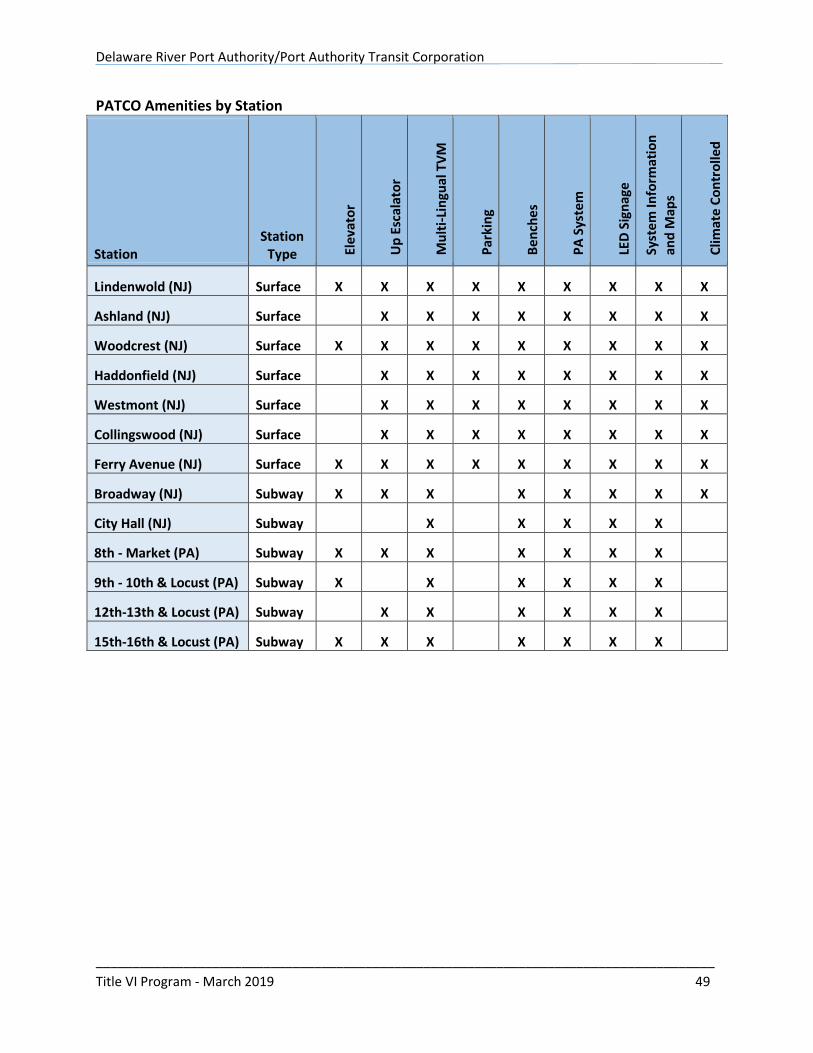
Delaware River Port Authority/Port Authority Transit Corporation
_____________________________________________________________________________________
Title VI Program - March 2019 49
PATCO Amenities by Station
Station Station
Type Elev
ato
r
Up
Esc
alat
or
Mu
lti-
Lin
gual
TV
M
Par
kin
g
Ben
ches
PA
Sys
tem
LED
Sig
nag
e
Syst
em
Info
rmat
ion
and
Map
s
Clim
ate
Co
ntr
olle
d
Lindenwold (NJ) Surface X X X X X X X X X
Ashland (NJ) Surface X X X X X X X X
Woodcrest (NJ) Surface X X X X X X X X X
Haddonfield (NJ) Surface X X X X X X X X
Westmont (NJ) Surface X X X X X X X X
Collingswood (NJ) Surface X X X X X X X X
Ferry Avenue (NJ) Surface X X X X X X X X X
Broadway (NJ) Subway X X X X X X X X
City Hall (NJ) Subway X X X X X
8th - Market (PA) Subway X X X X X X X
9th - 10th & Locust (PA) Subway X X X X X X
12th-13th & Locust (PA) Subway X X X X X X
15th-16th & Locust (PA) Subway X X X X X X X
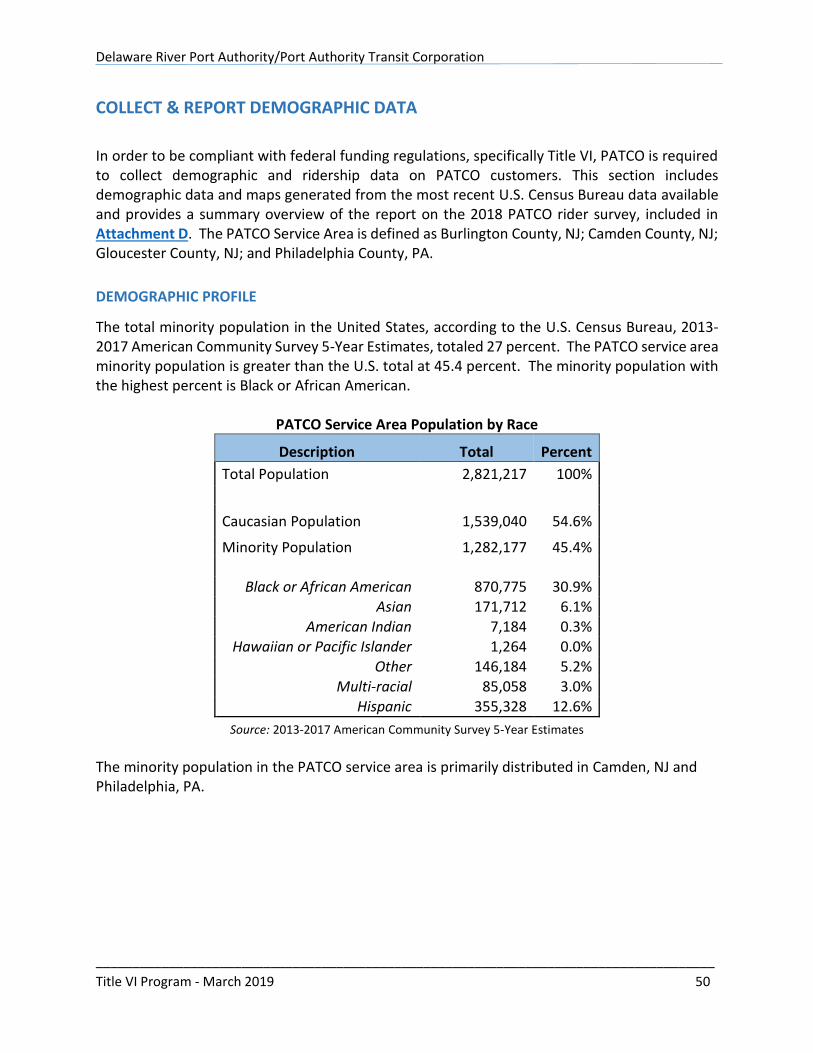
Delaware River Port Authority/Port Authority Transit Corporation
_____________________________________________________________________________________
Title VI Program - March 2019 50
COLLECT & REPORT DEMOGRAPHIC DATA
In order to be compliant with federal funding regulations, specifically Title VI, PATCO is required to collect demographic and ridership data on PATCO customers. This section includes demographic data and maps generated from the most recent U.S. Census Bureau data available and provides a summary overview of the report on the 2018 PATCO rider survey, included in Attachment D. The PATCO Service Area is defined as Burlington County, NJ; Camden County, NJ; Gloucester County, NJ; and Philadelphia County, PA.
DEMOGRAPHIC PROFILE
The total minority population in the United States, according to the U.S. Census Bureau, 2013-2017 American Community Survey 5-Year Estimates, totaled 27 percent. The PATCO service area minority population is greater than the U.S. total at 45.4 percent. The minority population with the highest percent is Black or African American.
PATCO Service Area Population by Race
Description Total Percent
Total Population 2,821,217 100%
Caucasian Population 1,539,040 54.6%
Minority Population 1,282,177 45.4%
Black or African American 870,775 30.9% Asian 171,712 6.1%
American Indian 7,184 0.3% Hawaiian or Pacific Islander 1,264 0.0%
Other 146,184 5.2%
Multi-racial 85,058 3.0% Hispanic 355,328 12.6%
Source: 2013-2017 American Community Survey 5-Year Estimates
The minority population in the PATCO service area is primarily distributed in Camden, NJ and Philadelphia, PA.
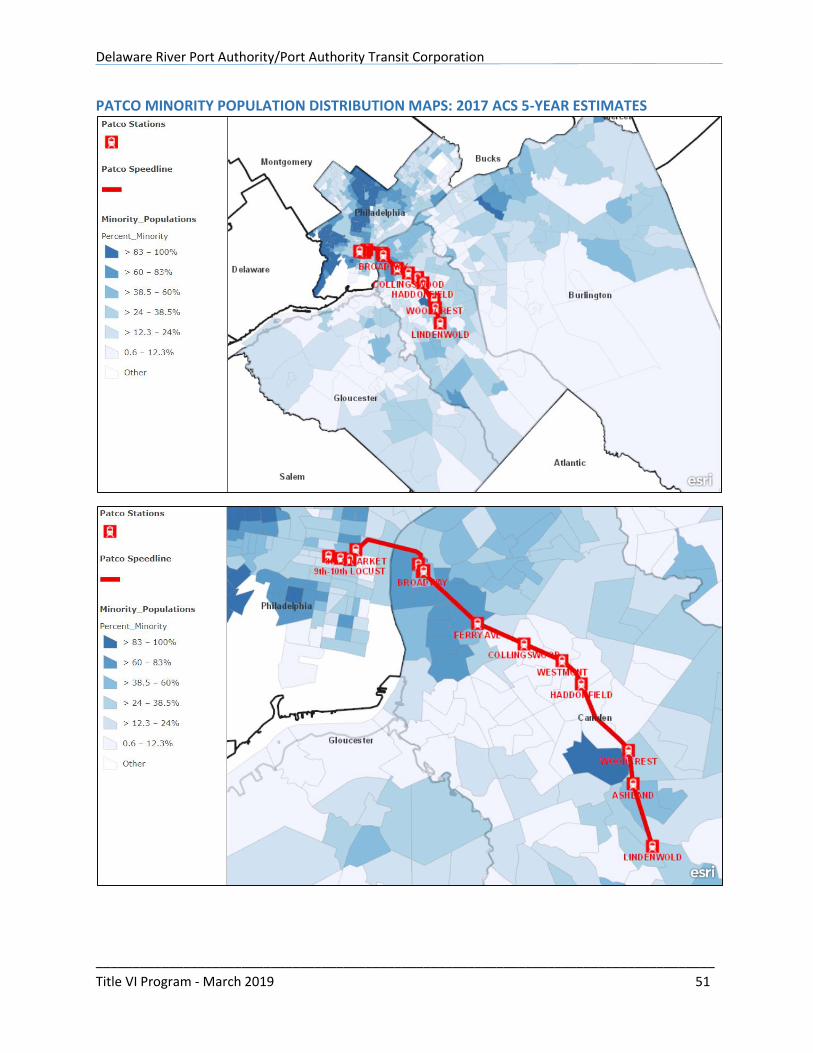
Delaware River Port Authority/Port Authority Transit Corporation
_____________________________________________________________________________________
Title VI Program - March 2019 51
PATCO MINORITY POPULATION DISTRIBUTION MAPS: 2017 ACS 5-YEAR ESTIMATES
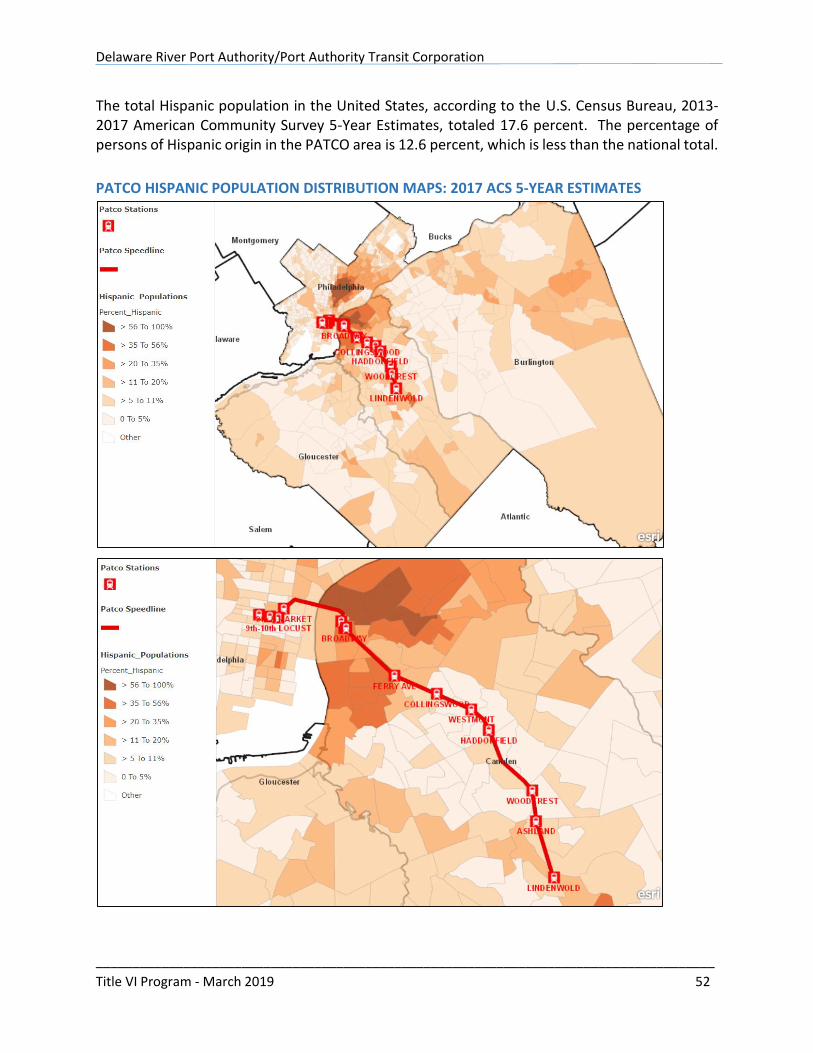
Delaware River Port Authority/Port Authority Transit Corporation
_____________________________________________________________________________________
Title VI Program - March 2019 52
The total Hispanic population in the United States, according to the U.S. Census Bureau, 2013-2017 American Community Survey 5-Year Estimates, totaled 17.6 percent. The percentage of persons of Hispanic origin in the PATCO area is 12.6 percent, which is less than the national total.
PATCO HISPANIC POPULATION DISTRIBUTION MAPS: 2017 ACS 5-YEAR ESTIMATES
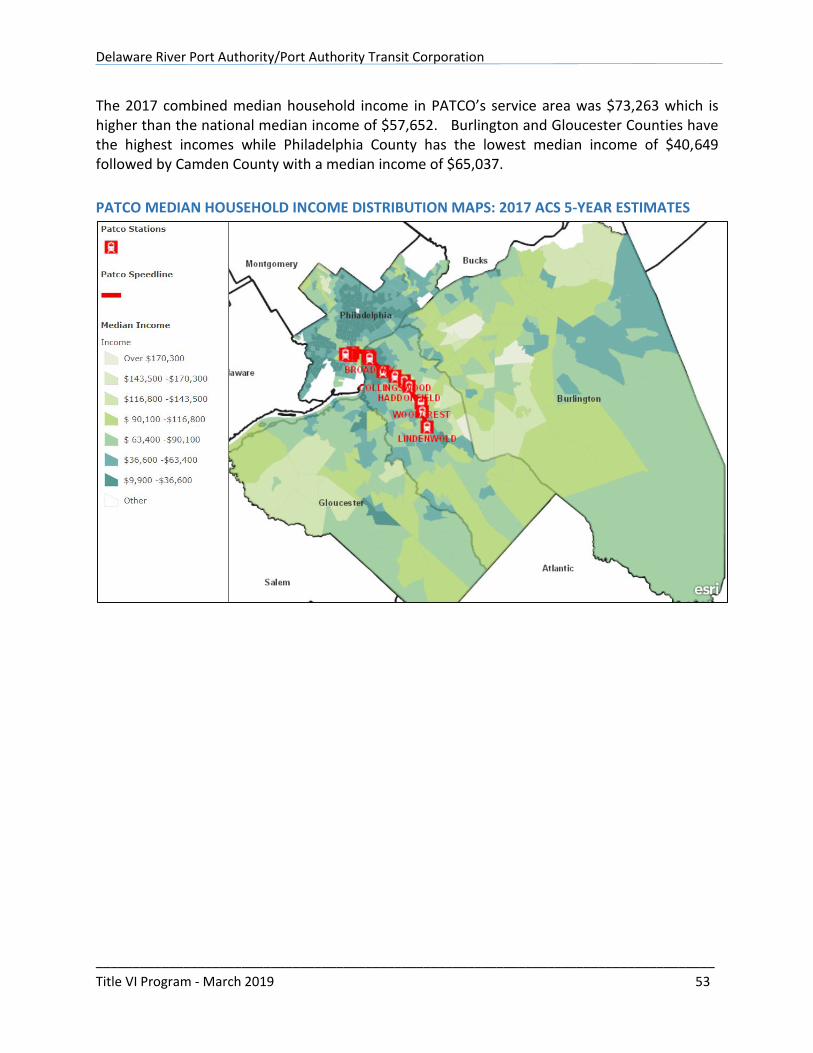
Delaware River Port Authority/Port Authority Transit Corporation
_____________________________________________________________________________________
Title VI Program - March 2019 53
The 2017 combined median household income in PATCO’s service area was $73,263 which is higher than the national median income of $57,652. Burlington and Gloucester Counties have the highest incomes while Philadelphia County has the lowest median income of $40,649 followed by Camden County with a median income of $65,037.
PATCO MEDIAN HOUSEHOLD INCOME DISTRIBUTION MAPS: 2017 ACS 5-YEAR ESTIMATES
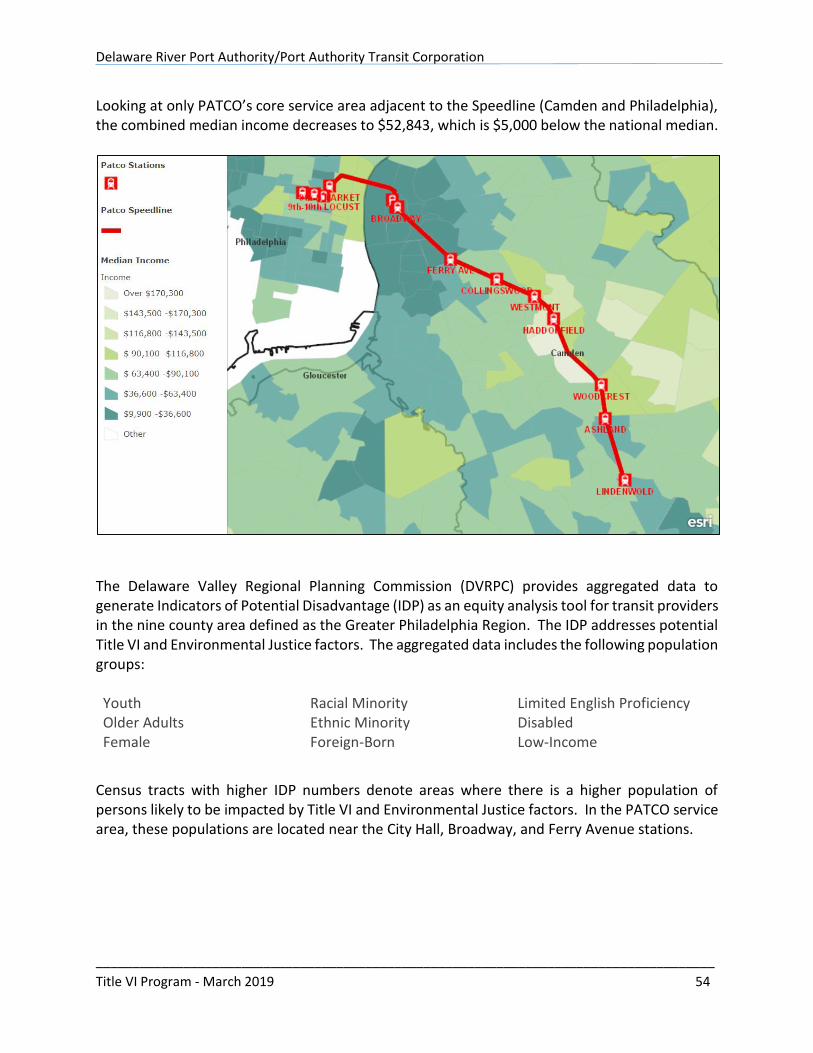
Delaware River Port Authority/Port Authority Transit Corporation
_____________________________________________________________________________________
Title VI Program - March 2019 54
Looking at only PATCO’s core service area adjacent to the Speedline (Camden and Philadelphia), the combined median income decreases to $52,843, which is $5,000 below the national median.
The Delaware Valley Regional Planning Commission (DVRPC) provides aggregated data to generate Indicators of Potential Disadvantage (IDP) as an equity analysis tool for transit providers in the nine county area defined as the Greater Philadelphia Region. The IDP addresses potential Title VI and Environmental Justice factors. The aggregated data includes the following population groups: Youth Older Adults Female
Racial Minority Ethnic Minority Foreign-Born
Limited English Proficiency Disabled Low-Income
Census tracts with higher IDP numbers denote areas where there is a higher population of persons likely to be impacted by Title VI and Environmental Justice factors. In the PATCO service area, these populations are located near the City Hall, Broadway, and Ferry Avenue stations.
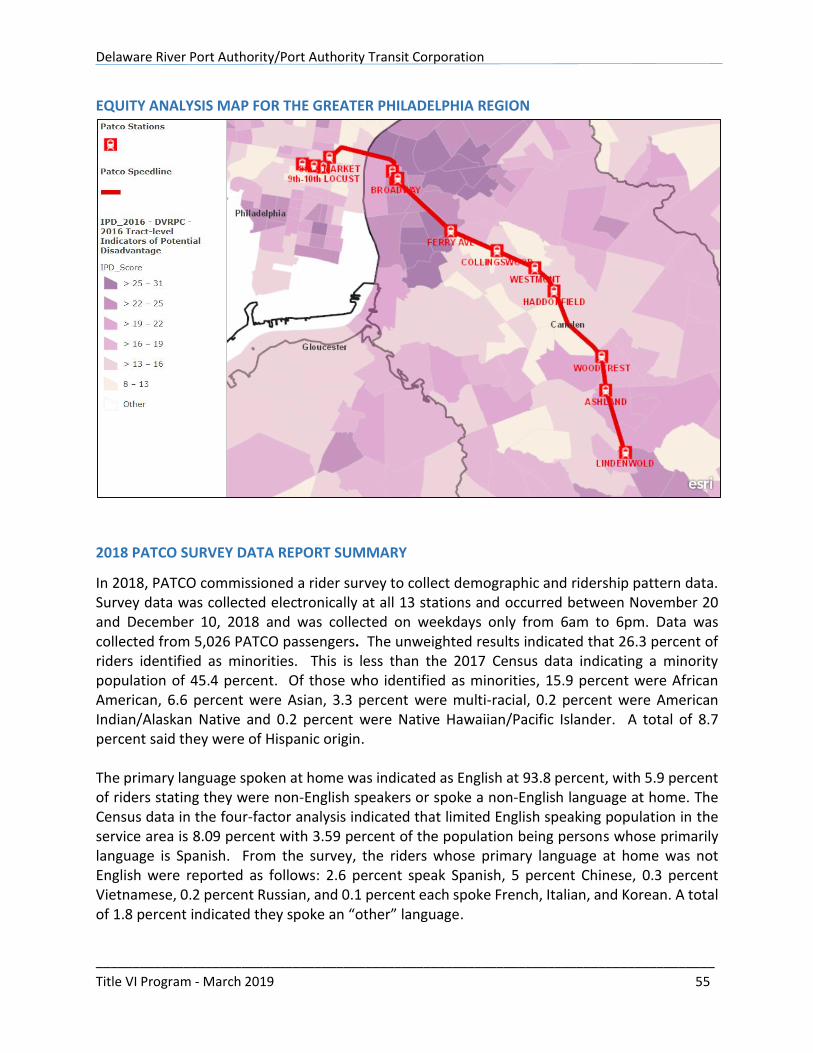
Delaware River Port Authority/Port Authority Transit Corporation
_____________________________________________________________________________________
Title VI Program - March 2019 55
EQUITY ANALYSIS MAP FOR THE GREATER PHILADELPHIA REGION
2018 PATCO SURVEY DATA REPORT SUMMARY
In 2018, PATCO commissioned a rider survey to collect demographic and ridership pattern data. Survey data was collected electronically at all 13 stations and occurred between November 20 and December 10, 2018 and was collected on weekdays only from 6am to 6pm. Data was collected from 5,026 PATCO passengers. The unweighted results indicated that 26.3 percent of riders identified as minorities. This is less than the 2017 Census data indicating a minority population of 45.4 percent. Of those who identified as minorities, 15.9 percent were African American, 6.6 percent were Asian, 3.3 percent were multi-racial, 0.2 percent were American Indian/Alaskan Native and 0.2 percent were Native Hawaiian/Pacific Islander. A total of 8.7 percent said they were of Hispanic origin. The primary language spoken at home was indicated as English at 93.8 percent, with 5.9 percent of riders stating they were non-English speakers or spoke a non-English language at home. The Census data in the four-factor analysis indicated that limited English speaking population in the service area is 8.09 percent with 3.59 percent of the population being persons whose primarily language is Spanish. From the survey, the riders whose primary language at home was not English were reported as follows: 2.6 percent speak Spanish, 5 percent Chinese, 0.3 percent Vietnamese, 0.2 percent Russian, and 0.1 percent each spoke French, Italian, and Korean. A total of 1.8 percent indicated they spoke an “other” language.
Delaware River Port Authority/Port Authority Transit Corporation
_____________________________________________________________________________________
Title VI Program - March 2019 56
Regarding income, 27.9 percent elected not to provide their income. Of those riders who did provide their income, those with incomes less than $50,000 made up 18.8 percent. The full survey data report, which includes a comparison of the 2018 rider survey to the 2015 survey results is provided in Appendix D.
Delaware River Port Authority/Port Authority Transit Corporation
_____________________________________________________________________________________
Title VI Program - March 2019 57
MONITORING TRANSIT SERVICE
2016-2018 MONITORING RESULTS
PATCO operates one route. As for comparing stations, all stations are equally serviced, with the exception of 9-10th & Locust, which closes between the hours of 12:00AM to 5:00AM due to a lack of riders. Any passengers who may be inconvenienced by that closure need only to walk two blocks west or two blocks north to board at either the 12-13th & Locust Street Station or the 8th and Market Street Station, respectively. Otherwise, PATCO operates 24 hours a day, 7 days a week, 365 days a year. Service Standards Monitoring
Vehicle Load PATCO met the vehicle load standard in 2018 and always continues to take steps to improve the passenger loads where possible. Vehicle Headways Headways were modified based upon the monitoring passenger statistics and ridership trends as well as feedback from passengers and employees. PATCO routinely met its stated headway standard in 2018.
On-time Performance The on-time performance for the 67,702 scheduled trips for the year ending 2018 was 96.45%, which is 1.55% below the goal set by PATCO of 98 percent. As PATCO only operates one route, all patrons and stations are affected equally. There are numerous factors affecting on-time performance such as medical emergencies, police activity, trespassers, weather, equipment failure, etc. Determination of no disparate impact PATCO operates in a very diverse community and provides service on only one rail line. This single PATCO route is considered a minority route based upon service area demographics. PATCO has no ability to alter its route; thus the population served is representative of the communities and individuals within those communities. All stations receive the same level of service and any failure to meet either the quantitative service standards or the qualitative policies equally affects all passengers regardless of status.
Delaware River Port Authority/Port Authority Transit Corporation
_____________________________________________________________________________________
Title VI Program - March 2019 58
EVALUATE FARE AND SERVICE CHANGES
PATCO has not made any service reductions or extensions since our last submission in 2016. There are no plans for service reductions or extensions at this time.
DISPARATE IMPACT AND DISPROPORTIONATE BURDEN POLICY
The purpose of the Disparate Impact Policy is to establish a threshold which identifies when adverse effects of a major service change or any fare change are borne disproportionately by minority and/or low-income populations. For the purpose of this Policy, “minority population” means any readily identifiable group of minority persons who live in geographic proximity and in residential land use areas within Census tracts where the percentage of minority persons is higher than the PATCO service-area average. As defined in the FTA Title VI Circular, minority persons include those persons who self-identify as being one or more of the following ethnic groups: American Indian and Alaska Native, Asian, Black or African American, Hispanic or Latino, Native Hawaiian or Other Pacific Islander. For the purpose of this Policy, “low-income” means any readily identifiable group of low-income persons who live in geographic proximity and in residential land use areas within Census tracts where the percentage of low-income persons is higher than the PATCO service-area average. Although not defined as a protected class under Title VI, low-income persons tend to be transit dependent and environmental justice principles are required to be considered in the evaluation of fare and service changes. PATCO has established a Fare Increase or Service Reduction/Increase Procedure and Public Comment Policy. For each proposed fare or service change, PATCO will perform a Fare Equity Analysis or Service Equity Analysis based upon the criteria set forth in the Fare Increase or Service Reduction/Increase Procedure. If PATCO finds that its proposed major service change and/or proposed change to the fare structure could have a potential statistically significant disparate impact on a minority and/or low-income population (when a minority and/or low-income population bears adverse effects by twenty percent (20%) or more than the adverse effects borne by the non-minority or non-low-income population), it will re-analyze the modified service plan and/or proposed change to fare structure to determine whether the impact can be avoided, minimized or mitigated. PATCO may choose not to alter the proposed changes, if it determines that there is substantial, legitimate justification for the change AND there are no alternative methods to accomplish its legitimate program goals that would have less impact on the minority and/or low-income population.
Delaware River Port Authority/Port Authority Transit Corporation
_____________________________________________________________________________________
Title VI Program - March 2019 59
PORT AUTHORITY TRANSIT CORPORATION
FARE INCREASE OR SERVICE REDUCTION/INCREASE PROCEDURE AND PUBLIC COMMENT
POLICY
1.0 Introduction Section 9(e) (3) (H) of the Urban Mass Transportation Act of 1964, as amended (ACT) provides that a recipient of UMTA Section 9 funding shall have: “A locally developed process to solicit and consider public comment prior to raising fares or implementing a major reduction/increase of transit service” The Delaware River Port Authority (DRPA) is a recipient of Section 9 funding, and its operating subsidiary, the Port Authority Transit Corporation (PATCO) has developed and utilized an acceptable public hearing process with respect to fare increase proposals. PATCO has never implemented a major service reduction, nor does it contemplate the same at this time. However, in accordance with the ACT, DRPA/PATCO wishes to formalize a process of soliciting public comment prior to implementing any major reduction or increase in PATCO service. 2.0 Criteria 2.1 For the purpose of establishing this procedure, a major service reduction/increase shall be defined as meeting any of the following criteria: 2.1.1 a reduction/increase of more than 25% of route miles. 2.1.2 a reduction/increase of more than 25% of the transit vehicle revenue miles computed on a daily basis for the day of the week for which the change is made. 2.1.3 if a number of changes in any given fiscal year add up to the percentages in 2.3.1 and/or 2.3.2. 2.2 For the purpose of establishing this procedure, any proposed increase in fares of any percentage constitutes a fare increase 2.3 The following criteria establish certain instances which do not constitute a major service reduction/increase and which are exempt from the requirement to solicit public comment: 2.3.1 Headway adjustments of up to 5 minutes during peak hour service, and up to 15
Delaware River Port Authority/Port Authority Transit Corporation
_____________________________________________________________________________________
Title VI Program - March 2019 60
minutes during non-peak hour service. 2.3.2 Standard seasonal variations. 2.3.3 An emergency situation unless the emergency situation is to be in effect for 180 days or more and the emergency change meets the requirements of 2.1.1 and/or 2.3.2. Examples of emergency service changes include, but are not limited to, those made because of a power failure, major construction, reconstruction and improvement projects. 2.3.4 Experimental service changes for a period of 180 days or less, unless the changes extend beyond 180 days and meet the criteria of 2.3.1 and/or 2.3.2. 3.0 Procedure—DRPA’s Public Comment Procedure, in place since before 1985 and previously submitted to and approved by the FTA, is designed to ensure the participation and meaningful engagement of the public, including minority and low income populations likely to be impacted by the fare increase. 3.1 Pursuant to the procedure, if the staff of PATCO determines that it is necessary to implement a major service change or fare increase, it shall prepare an Equity Analysis and a recommendation with appropriate supporting documentation for consideration by the Board of Directors. PATCO staff will make its initial recommendation for a major service reduction/increase or fare increase to the appropriate committee of the Board of Directors. If the staff recommendation is accepted by the committee, it shall recommend to the Board of Directors that public hearings on the service change shall be held prior to any final determination with respect to the proposed service changes. 3.2 If the Board of Directors approves the initial committee recommendation it shall direct staff to conduct the public hearings on the service reductions/increase or fare increase. 3.3 As the policy provides, to ensure public participation from the public, including low income, LEP and minority populations, PATCO staff will publicly advertise the time and location of the public hearings on posters, in all the rail cars and stations, in radio spots in English and Spanish and in area newspapers, including newspapers published in Spanish ( e.g. Al Dia). Notice of hearings will also be posted on the DRPA’s website, www.drpa.org and PATCO’s website, www.ridepatco.org in English and Spanish, and will be able to be translated into other languages using the Google Translate tool located on PATCO’s webpage. The DRPA will produce and distribute a public notice announcement in English and Spanish explaining the proposed fare increase and inviting public comment about same. The publication will list the date, time and venues for the public comment. The public will be advised that DRPA representatives, including those who are bi-lingual and those for the hearing impaired, would be present to take written comments during the hearings. In addition, efforts will be made to reach out to local community leaders to notify their communities about the hearings in an effort to reach minority, LEP and low income populations.
Delaware River Port Authority/Port Authority Transit Corporation
_____________________________________________________________________________________
Title VI Program - March 2019 61
Public hearings will be scheduled in the evenings at times that are convenient for the public and in locations which are conveniently located and easily accessible to minority, LEP and low income populations in Philadelphia and in New Jersey. Hearings will be held under the supervision of a Hearing Officer and all comments will be duly recorded by a court stenographer. The public will also be offered other ways to comment via mail or email to DRPA, by telephone calls to a special recorded number, through personnel at the hearings who are bi-lingual and who could interpret and take statements from those who did not wish to wait or who chose not to speak publicly. Transcripts of the hearing, along with all other public comment, will be made available to the public should they wish to review same. 3.4 Pursuant to the policy, following the receipt of the hearing transcripts of the two public meetings, PATCO staff makes a final recommendation to the appropriate committee of the Board, which will then make a final recommendation with respect to the proposed service change or fare increase to the Board of Directors. 3.5 If the Board of Directors adopts the committee’s recommendation, then the General Manager of PATCO shall be authorized and directed to implement the proposed service change or fare increase according to the approved schedule, which schedule shall provide for adequate public notice of the service changes prior to their implementation.
Delaware River Port Authority/Port Authority Transit Corporation
_____________________________________________________________________________________
Title VI Program - March 2019 62
APPENDIX A: TITLE VI NOTICE TRANSLATIONS
This appendix includes translations in the following languages:
Spanish
Chinese
Korean
Vietnamese
Russian
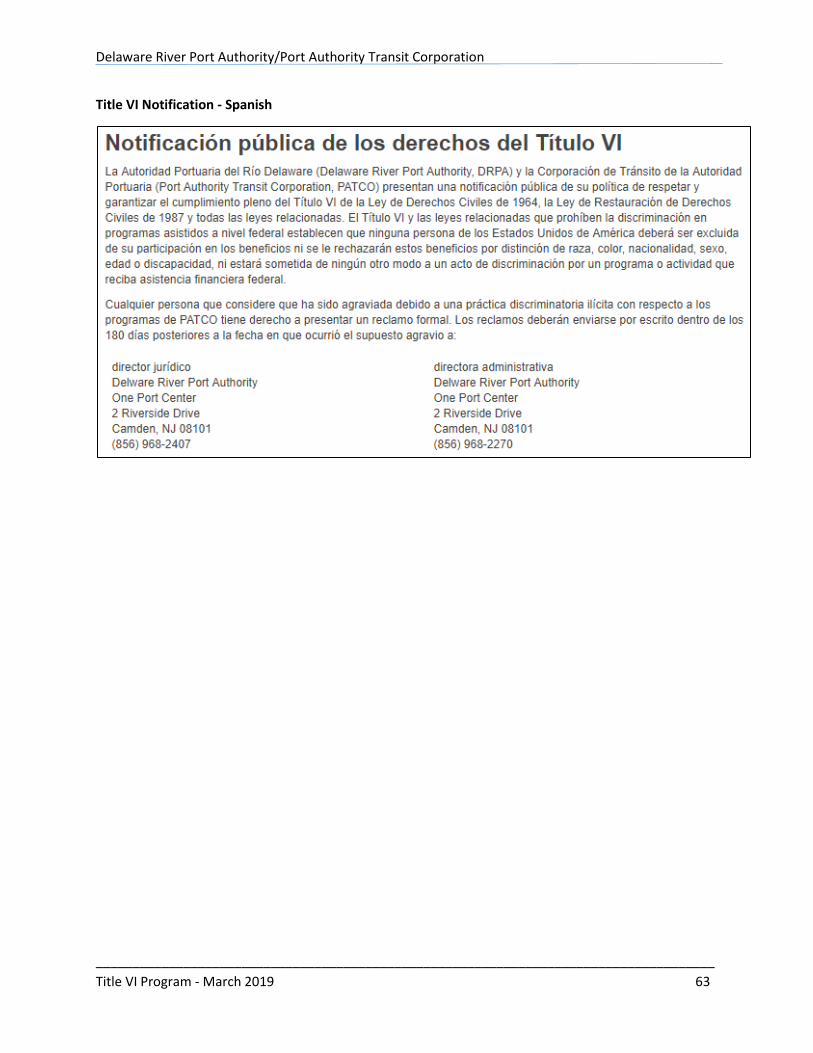
Delaware River Port Authority/Port Authority Transit Corporation
_____________________________________________________________________________________
Title VI Program - March 2019 63
Title VI Notification - Spanish
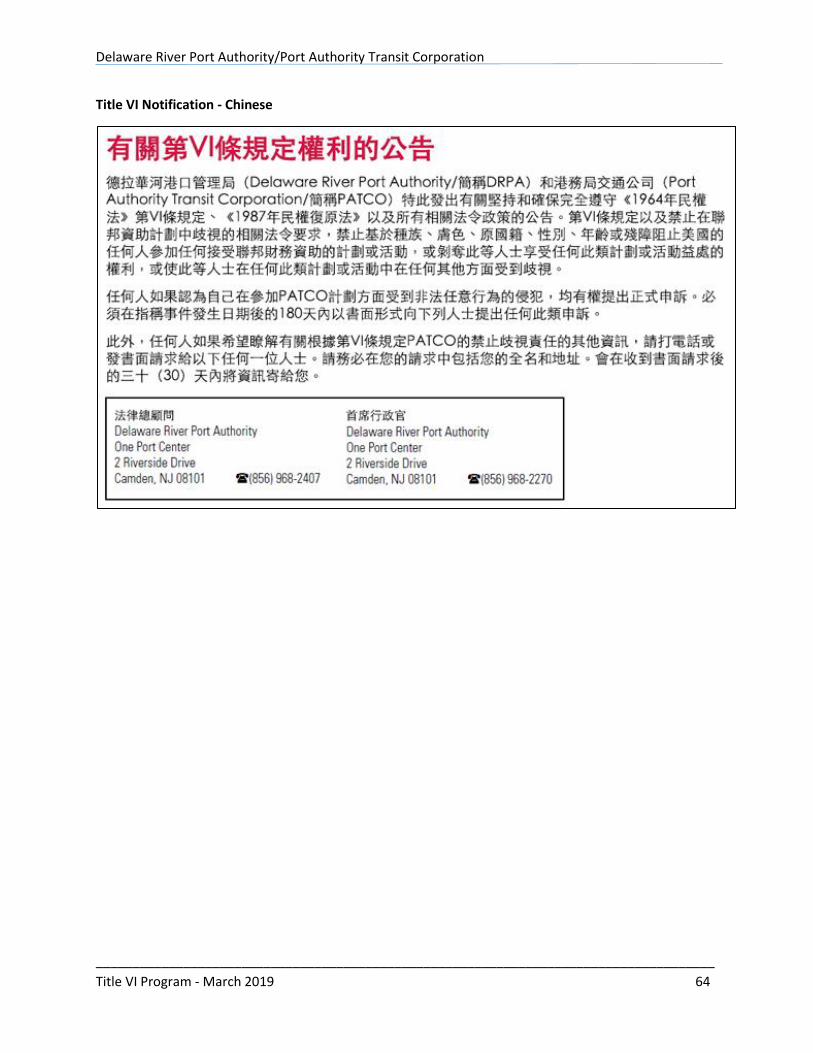
Delaware River Port Authority/Port Authority Transit Corporation
_____________________________________________________________________________________
Title VI Program - March 2019 64
Title VI Notification - Chinese
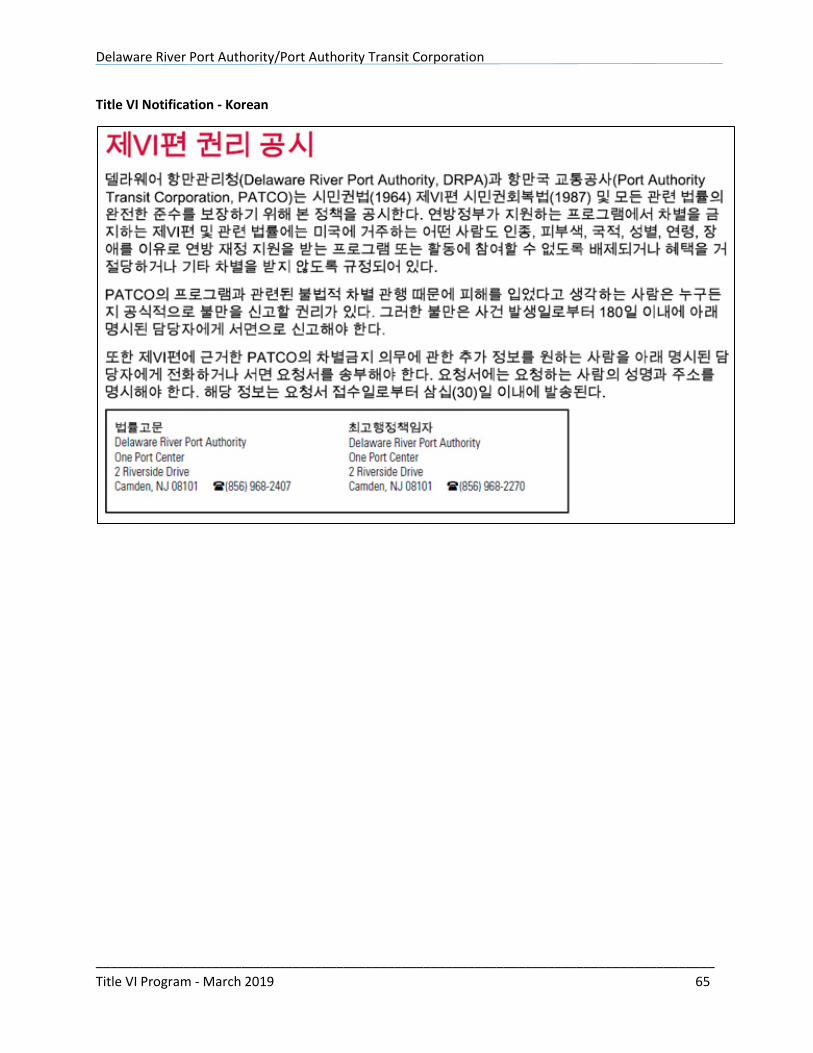
Delaware River Port Authority/Port Authority Transit Corporation
_____________________________________________________________________________________
Title VI Program - March 2019 65
Title VI Notification - Korean
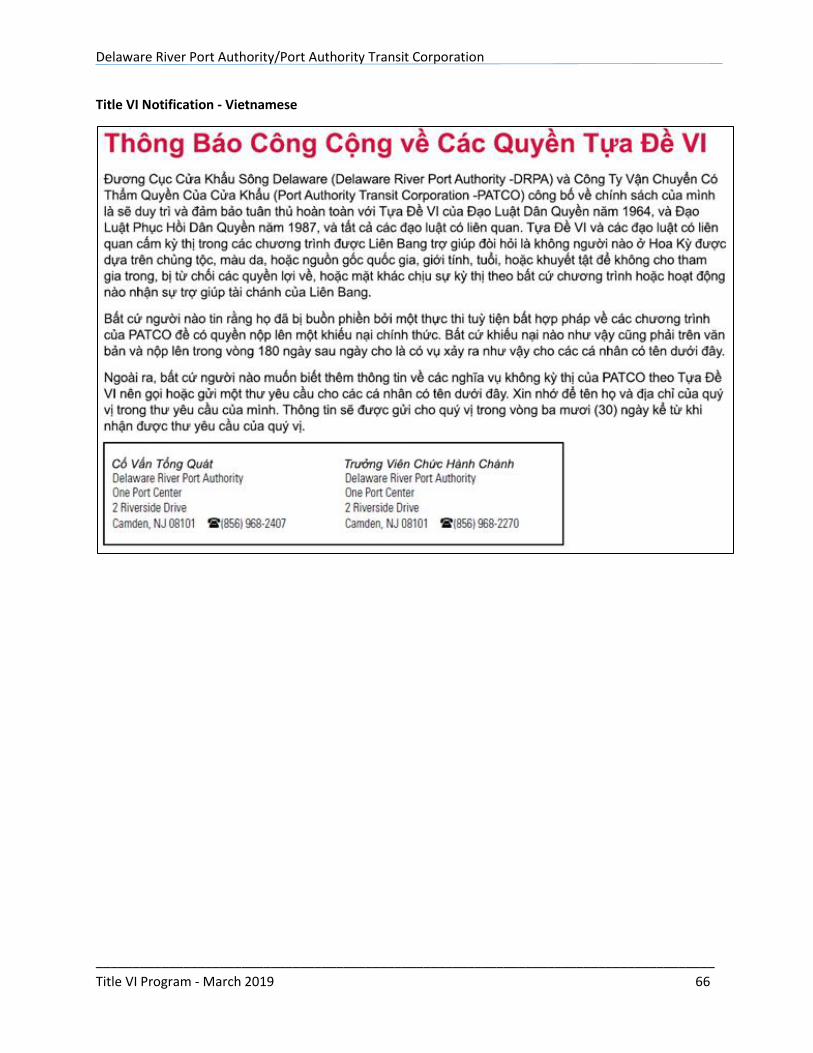
Delaware River Port Authority/Port Authority Transit Corporation
_____________________________________________________________________________________
Title VI Program - March 2019 66
Title VI Notification - Vietnamese
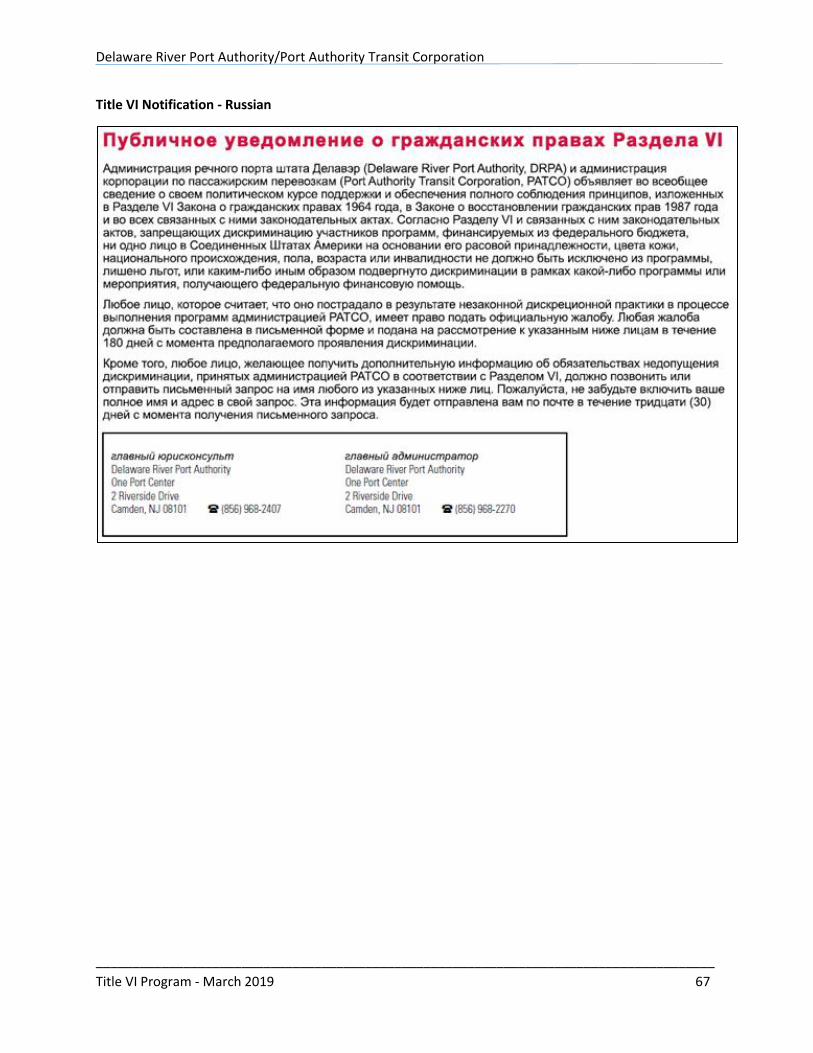
Delaware River Port Authority/Port Authority Transit Corporation
_____________________________________________________________________________________
Title VI Program - March 2019 67
Title VI Notification - Russian
Delaware River Port Authority/Port Authority Transit Corporation
_____________________________________________________________________________________
Title VI Program - March 2019 68
APPENDIX B: TITLE VI COMPLAINT FORM TRANSLATIONS
This appendix includes translations in the following languages:
Spanish
Chinese
Korean
Vietnamese
Russian
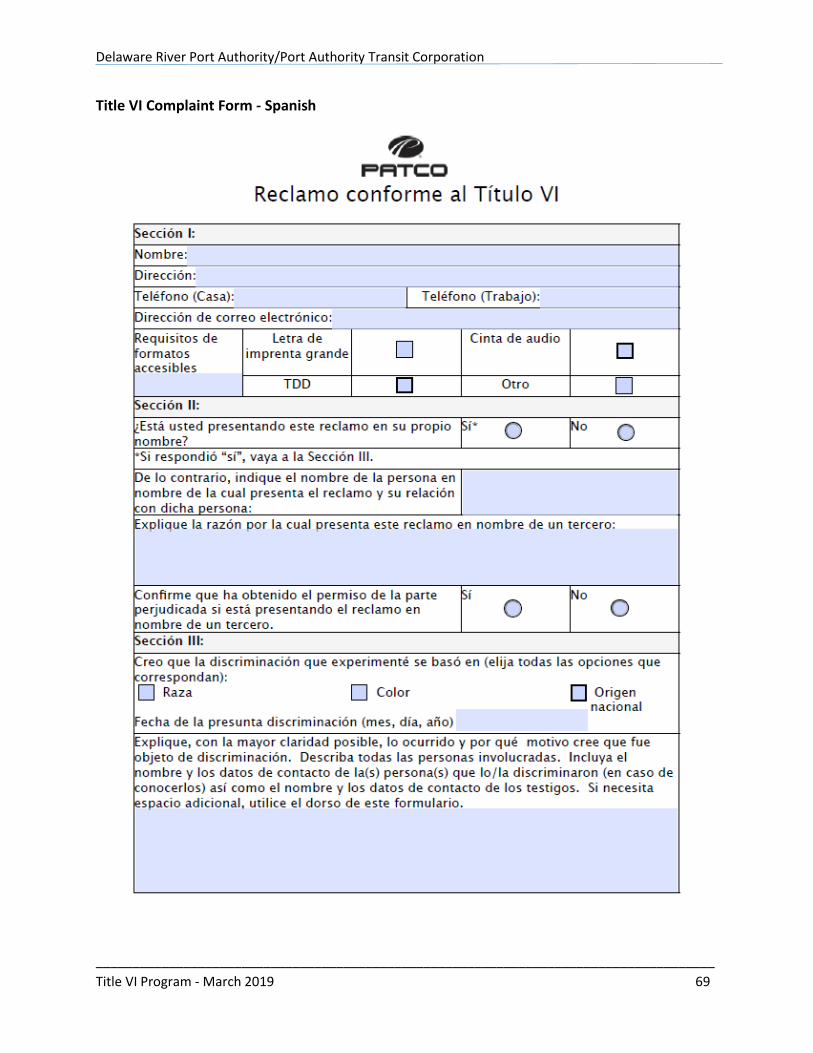
Delaware River Port Authority/Port Authority Transit Corporation
_____________________________________________________________________________________
Title VI Program - March 2019 69
Title VI Complaint Form - Spanish
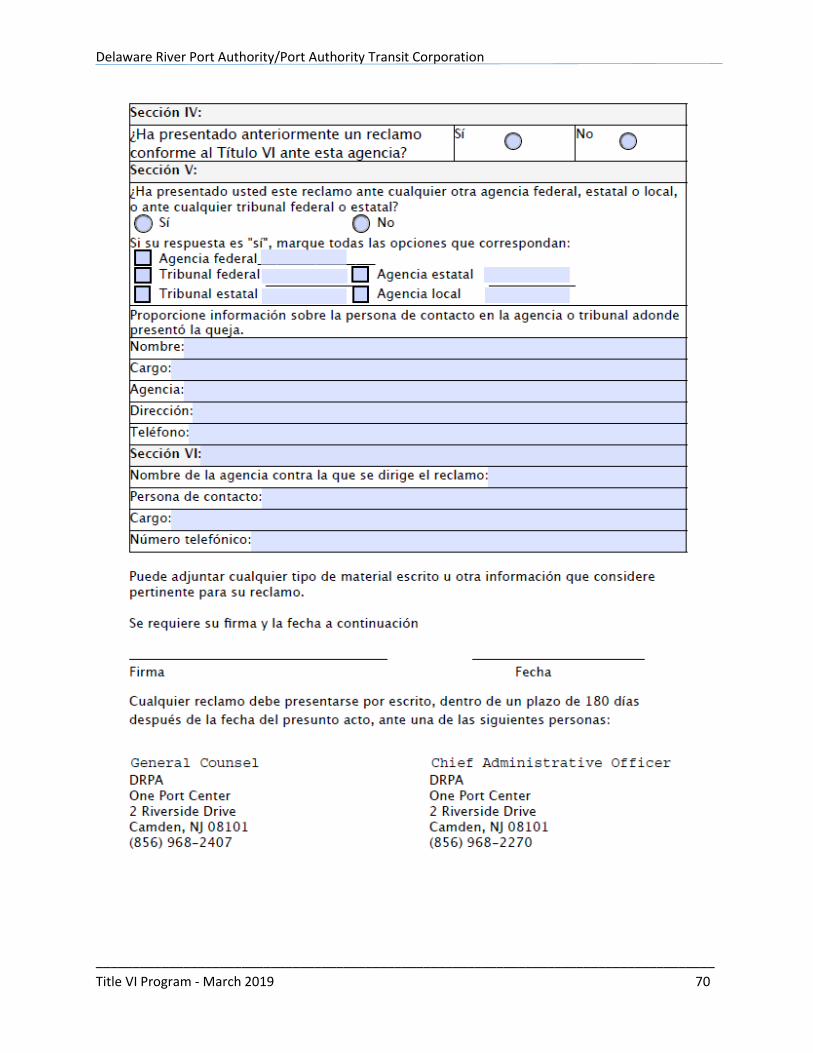
Delaware River Port Authority/Port Authority Transit Corporation
_____________________________________________________________________________________
Title VI Program - March 2019 70
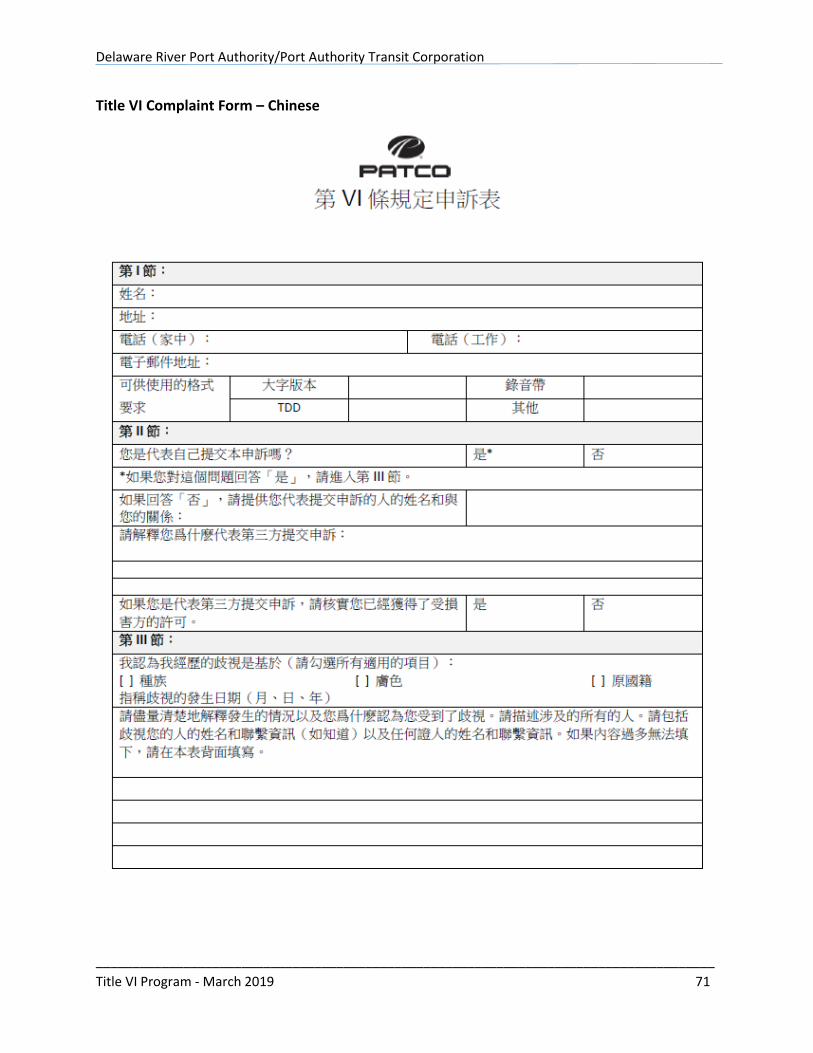
Delaware River Port Authority/Port Authority Transit Corporation
_____________________________________________________________________________________
Title VI Program - March 2019 71
Title VI Complaint Form – Chinese
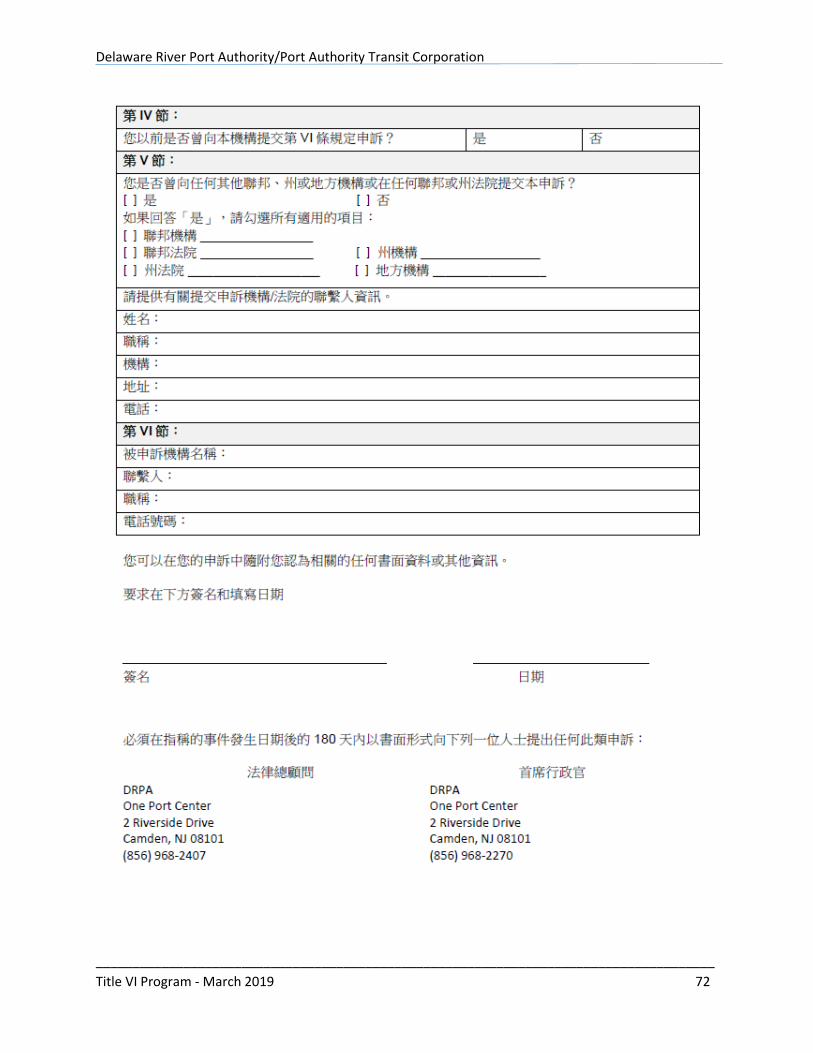
Delaware River Port Authority/Port Authority Transit Corporation
_____________________________________________________________________________________
Title VI Program - March 2019 72
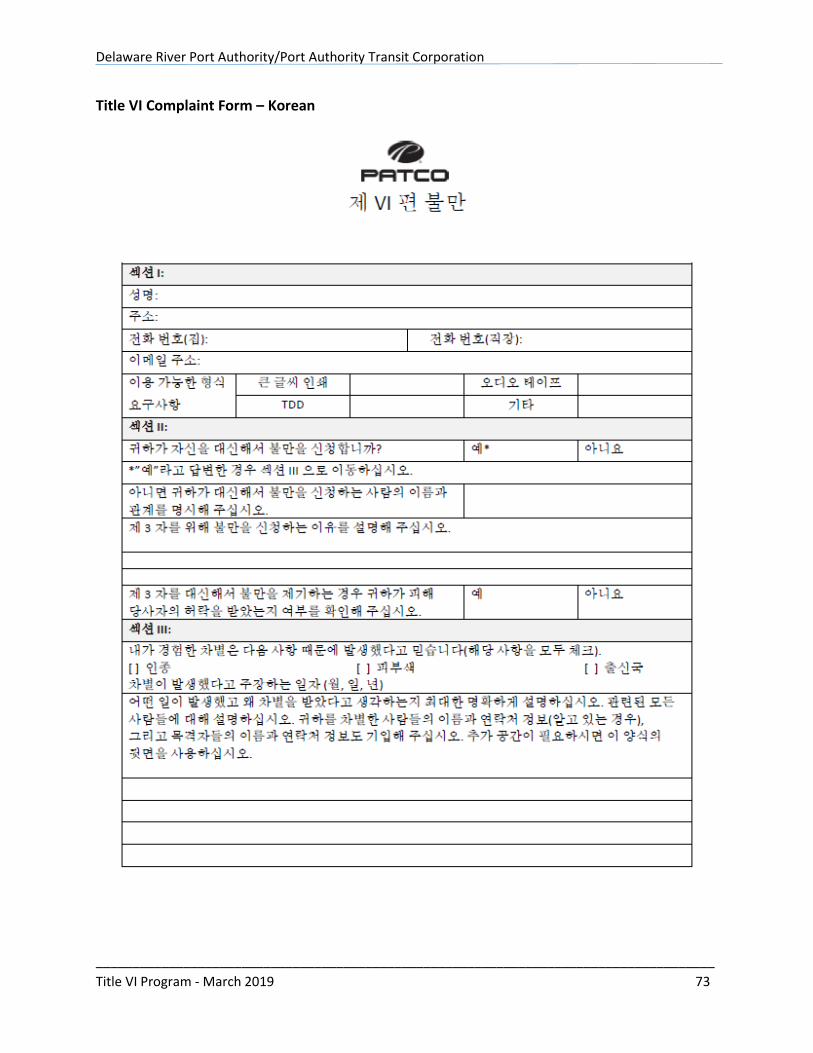
Delaware River Port Authority/Port Authority Transit Corporation
_____________________________________________________________________________________
Title VI Program - March 2019 73
Title VI Complaint Form – Korean
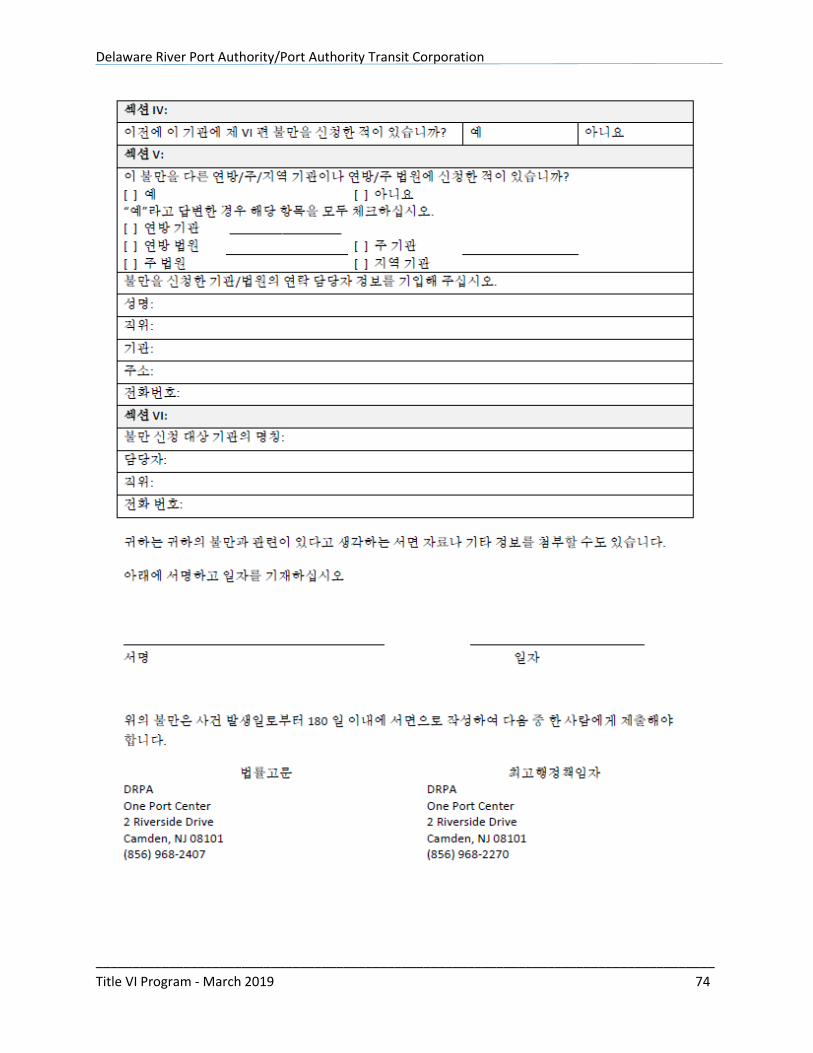
Delaware River Port Authority/Port Authority Transit Corporation
_____________________________________________________________________________________
Title VI Program - March 2019 74
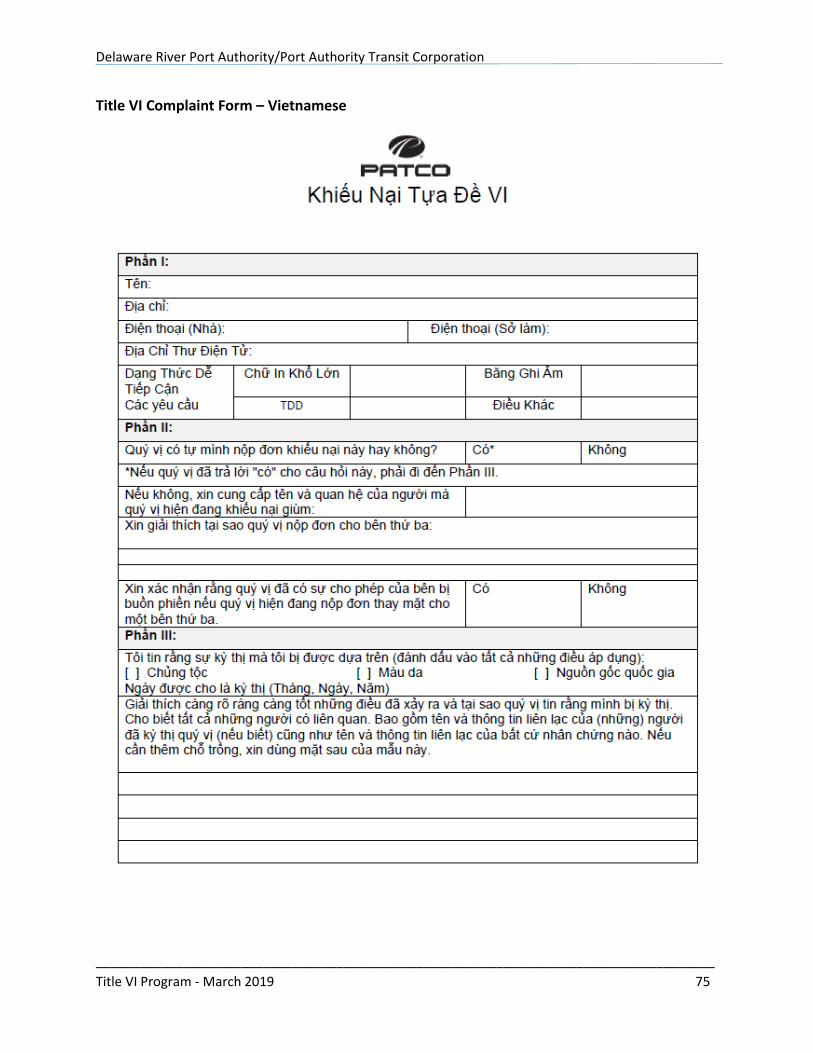
Delaware River Port Authority/Port Authority Transit Corporation
_____________________________________________________________________________________
Title VI Program - March 2019 75
Title VI Complaint Form – Vietnamese
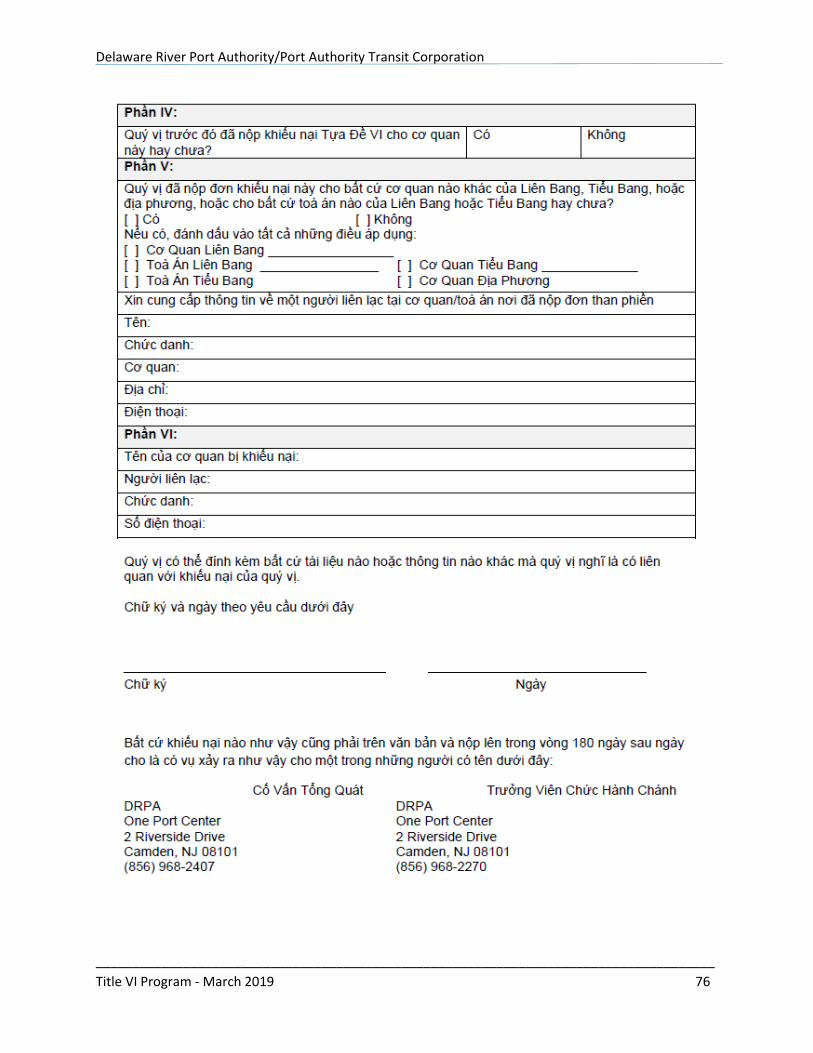
Delaware River Port Authority/Port Authority Transit Corporation
_____________________________________________________________________________________
Title VI Program - March 2019 76
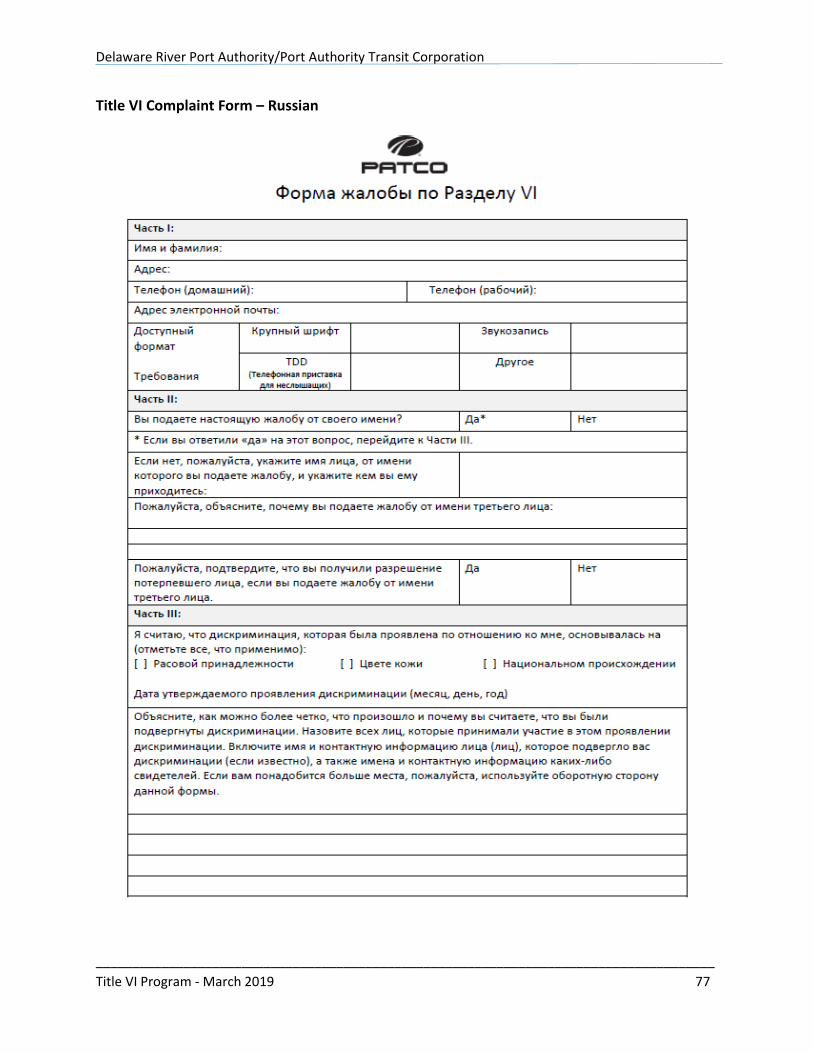
Delaware River Port Authority/Port Authority Transit Corporation
_____________________________________________________________________________________
Title VI Program - March 2019 77
Title VI Complaint Form – Russian
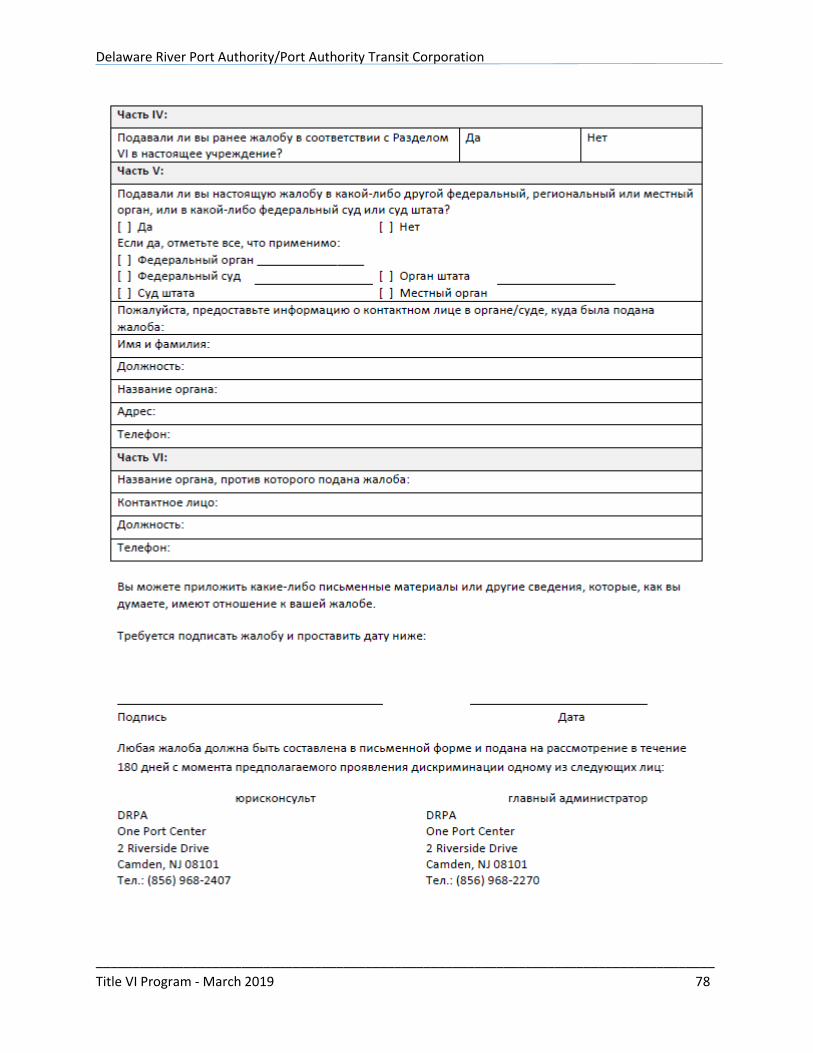
Delaware River Port Authority/Port Authority Transit Corporation
_____________________________________________________________________________________
Title VI Program - March 2019 78
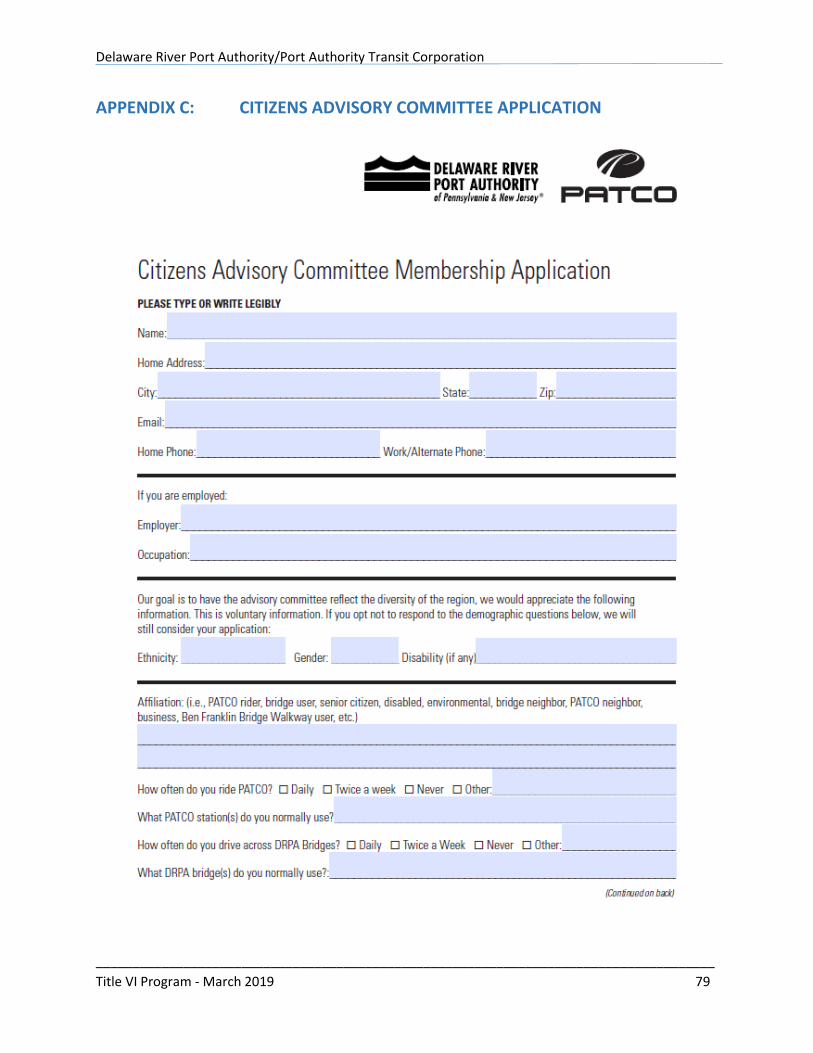
Delaware River Port Authority/Port Authority Transit Corporation
_____________________________________________________________________________________
Title VI Program - March 2019 79
APPENDIX C: CITIZENS ADVISORY COMMITTEE APPLICATION
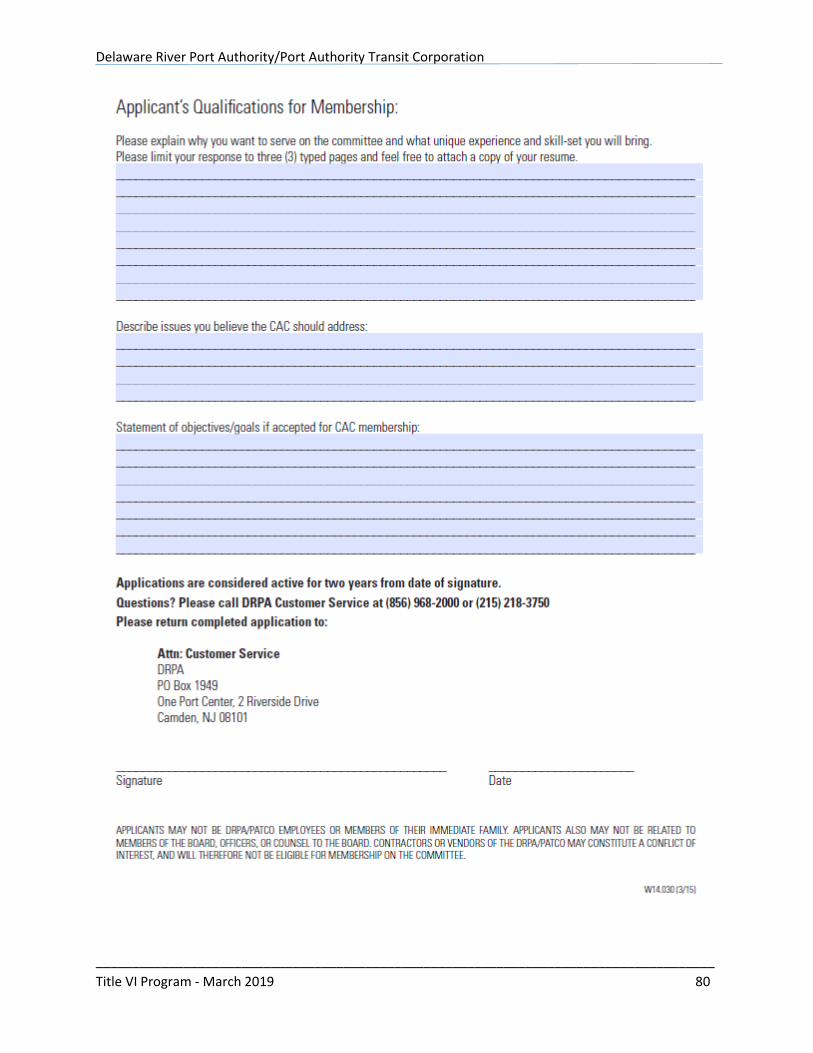
Delaware River Port Authority/Port Authority Transit Corporation
_____________________________________________________________________________________
Title VI Program - March 2019 80
Delaware River Port Authority/Port Authority Transit Corporation
_____________________________________________________________________________________
Title VI Program - March 2019 81
APPENDIX D: 2018 PATCO SURVEY DATA REPORT
PATCO SURVEY DATA REPORT
Krista Wieder, Kairos Development Group
Abstract Overview of PATCO ridership survey results 2018
1
Table of Contents
INTRODUCTION .................................................................................................................................2
1. PURPOSE .......................................................................................................................................2 2. SURVEY METHODOLOGY ...................................................................................................................2 A. WHO & WHAT .......................................................................................................................................... 2 B. APPROACH ................................................................................................................................................ 2 C. WHERE & WHEN ....................................................................................................................................... 3 D. STAFF TRAINING ........................................................................................................................................ 4 E. SAMPLE SIZE, MARGIN OF ERROR, DATA WEIGHTING ...................................................................................... 4
SUMMARY OF SURVEY RESULTS .........................................................................................................7
DETAILED SURVEY RESULTS ................................................................................................................9
1. CROSS-TABULATIONS BY MINORITY VS. NON-MINORITY ...........................................................................9 2. CROSS-TABULATIONS BY NON-ENGLISH SPEAKERS ................................................................................. 14 3. CROSS-TABULATIONS BY HOUSEHOLD INCOME UNDER $50,000 ............................................................... 18 4. DETAILED TABLE COMPARISONS/PERCENT CHANGE FROM 2015 TO 2018 SURVEY ....................................... 21
ATTACHMENT A: PATCO TITLE VI SURVEY TRAINING ATTACHMENT B: PATCO SURVEY QUESTIONS ATTACHMENT C: PATCO SURVEY QUESTIONS – SPANISH
2
Introduction
1. Purpose
Kairos Development Group (Kairos) was contracted to provide assistance in the collection and
assessment of PATCO’s customer demographics and ridership patterns. This ridership data
collection was conducted to ensure PATCO’s compliance with the demographic data
requirements of the Federal Transit Administration (FTA) Title VI regulations, specifically FTA
Circular 4702.1B Chapter IV, Section 5b. All transit agencies, such as PATCO, who receive FTA
funds are required to adhere to the federal Title VI non-discrimination regulations. The goal
was to collect relevant data from a representative sample of riders as part of the analysis to
determine if PATCO is providing equitable service to minority and limited English proficient
customers. The survey results provide PATCO with a ridership profile that will inform future
project, funding, fare and service decisions.
2. Survey Methodology
A. Who & What
Kairos is an economic development firm located in Philadelphia. Kairos specializes in working
with government agencies and nonprofits in the area of community/constituent assessment,
economic, workforce, business and strategic development as well as in identifying and
leveraging sustainable funding. Kairos provided technical assistance to PATCO for the purposes
of collecting survey data that contains customer demographic and travel patterns. They were
also responsible for cleaning and assessing the survey information based on relevant data
points.
B. Approach
Survey Development
The survey was a replicated study from the DVRPC 2015 survey. Questions were updated for
current language, however the main intent for each question remained intact. The survey
collection platform was Qualtrics. PATCO had WiFi enabled tablets allowing each survey
submission to automatically sync with the Qualtrics system. The dates for data collection were
Nov. 20, 21, 26, 27, 28, 29, 30, Dec. 3, 4, 5, 6, 7 and 10. Trained PATCO Staff (Station
Supervisors and Transit Ambassadors) were deployed at all 13 of their stations including:
Lindenwold, Westmont, 15th-16th, 8th & Market, City Hall, Broadway, Woodcrest, Ferry Avenue,
12th-13th; 9th-10th, Haddonfield, Ashland, and Collingswood.
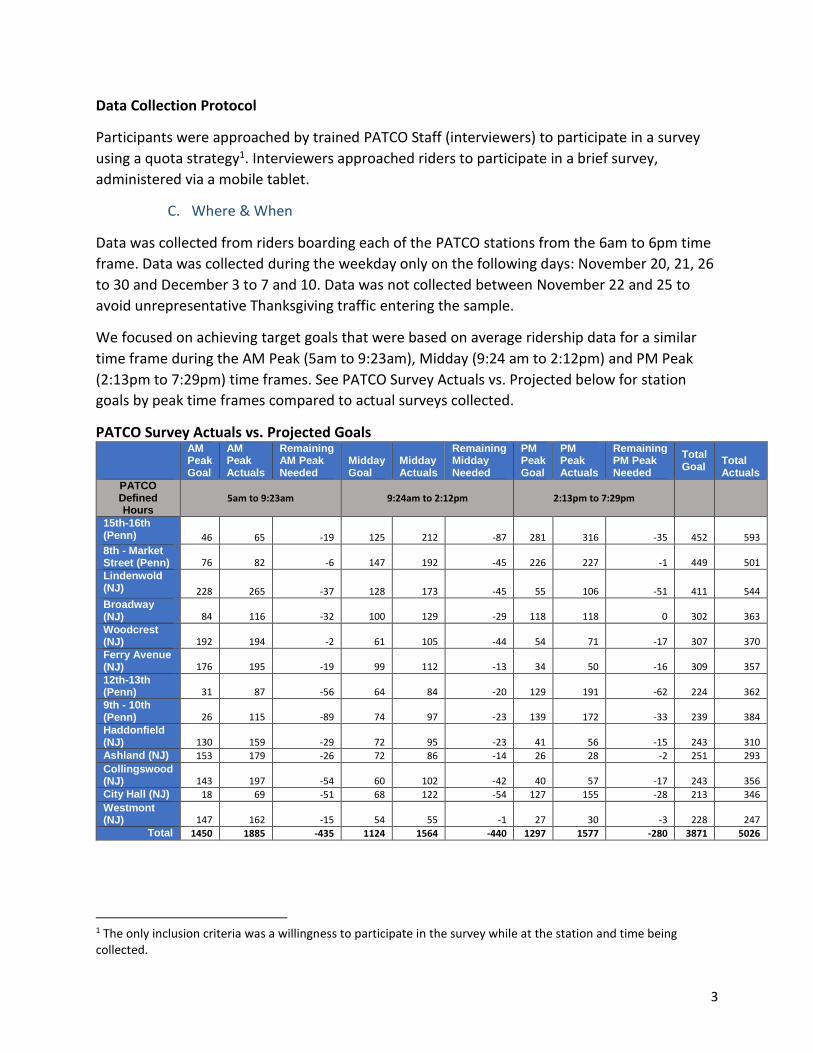
3
Data Collection Protocol
Participants were approached by trained PATCO Staff (interviewers) to participate in a survey
using a quota strategy1. Interviewers approached riders to participate in a brief survey,
administered via a mobile tablet.
C. Where & When
Data was collected from riders boarding each of the PATCO stations from the 6am to 6pm time
frame. Data was collected during the weekday only on the following days: November 20, 21, 26
to 30 and December 3 to 7 and 10. Data was not collected between November 22 and 25 to
avoid unrepresentative Thanksgiving traffic entering the sample.
We focused on achieving target goals that were based on average ridership data for a similar
time frame during the AM Peak (5am to 9:23am), Midday (9:24 am to 2:12pm) and PM Peak
(2:13pm to 7:29pm) time frames. See PATCO Survey Actuals vs. Projected below for station
goals by peak time frames compared to actual surveys collected.
PATCO Survey Actuals vs. Projected Goals
AM Peak Goal
AM Peak Actuals
Remaining AM Peak Needed
Midday Goal
Midday Actuals
Remaining Midday Needed
PM Peak Goal
PM Peak Actuals
Remaining PM Peak Needed
Total Goal
Total Actuals
PATCO Defined Hours
5am to 9:23am 9:24am to 2:12pm 2:13pm to 7:29pm
15th-16th (Penn) 46 65 -19 125 212 -87 281 316 -35 452 593
8th - Market Street (Penn) 76 82 -6 147 192 -45 226 227 -1 449 501 Lindenwold (NJ) 228 265 -37 128 173 -45 55 106 -51 411 544 Broadway (NJ) 84 116 -32 100 129 -29 118 118 0 302 363
Woodcrest (NJ) 192 194 -2 61 105 -44 54 71 -17 307 370 Ferry Avenue (NJ) 176 195 -19 99 112 -13 34 50 -16 309 357
12th-13th (Penn) 31 87 -56 64 84 -20 129 191 -62 224 362 9th - 10th (Penn) 26 115 -89 74 97 -23 139 172 -33 239 384 Haddonfield (NJ) 130 159 -29 72 95 -23 41 56 -15 243 310 Ashland (NJ) 153 179 -26 72 86 -14 26 28 -2 251 293
Collingswood (NJ) 143 197 -54 60 102 -42 40 57 -17 243 356 City Hall (NJ) 18 69 -51 68 122 -54 127 155 -28 213 346
Westmont (NJ) 147 162 -15 54 55 -1 27 30 -3 228 247
Total 1450 1885 -435 1124 1564 -440 1297 1577 -280 3871 5026
1 The only inclusion criteria was a willingness to participate in the survey while at the station and time being collected.
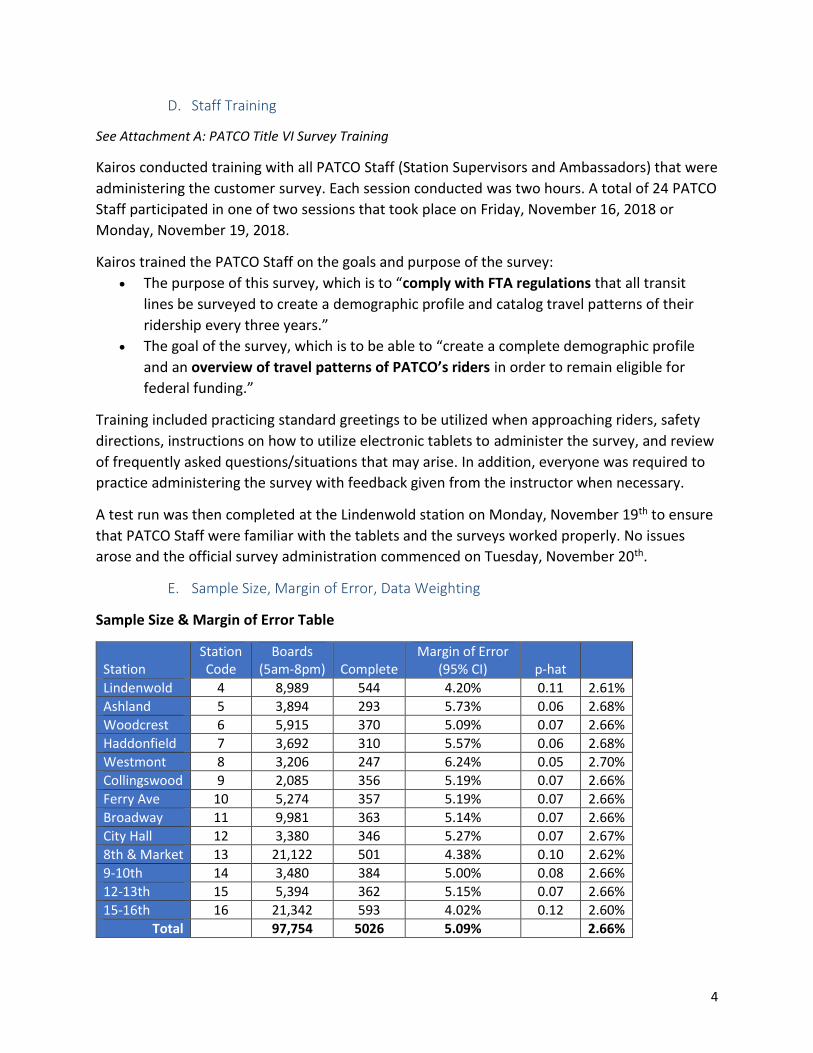
4
D. Staff Training
See Attachment A: PATCO Title VI Survey Training
Kairos conducted training with all PATCO Staff (Station Supervisors and Ambassadors) that were
administering the customer survey. Each session conducted was two hours. A total of 24 PATCO
Staff participated in one of two sessions that took place on Friday, November 16, 2018 or
Monday, November 19, 2018.
Kairos trained the PATCO Staff on the goals and purpose of the survey:
The purpose of this survey, which is to “comply with FTA regulations that all transit
lines be surveyed to create a demographic profile and catalog travel patterns of their
ridership every three years.”
The goal of the survey, which is to be able to “create a complete demographic profile
and an overview of travel patterns of PATCO’s riders in order to remain eligible for
federal funding.”
Training included practicing standard greetings to be utilized when approaching riders, safety
directions, instructions on how to utilize electronic tablets to administer the survey, and review
of frequently asked questions/situations that may arise. In addition, everyone was required to
practice administering the survey with feedback given from the instructor when necessary.
A test run was then completed at the Lindenwold station on Monday, November 19th to ensure
that PATCO Staff were familiar with the tablets and the surveys worked properly. No issues
arose and the official survey administration commenced on Tuesday, November 20th.
E. Sample Size, Margin of Error, Data Weighting
Sample Size & Margin of Error Table
Station Station Code
Boards (5am-8pm) Complete
Margin of Error (95% CI) p-hat
Lindenwold 4 8,989 544 4.20% 0.11 2.61%
Ashland 5 3,894 293 5.73% 0.06 2.68%
Woodcrest 6 5,915 370 5.09% 0.07 2.66%
Haddonfield 7 3,692 310 5.57% 0.06 2.68%
Westmont 8 3,206 247 6.24% 0.05 2.70%
Collingswood 9 2,085 356 5.19% 0.07 2.66%
Ferry Ave 10 5,274 357 5.19% 0.07 2.66%
Broadway 11 9,981 363 5.14% 0.07 2.66%
City Hall 12 3,380 346 5.27% 0.07 2.67%
8th & Market 13 21,122 501 4.38% 0.10 2.62%
9-10th 14 3,480 384 5.00% 0.08 2.66%
12-13th 15 5,394 362 5.15% 0.07 2.66%
15-16th 16 21,342 593 4.02% 0.12 2.60%
Total 97,754 5026 5.09% 2.66%
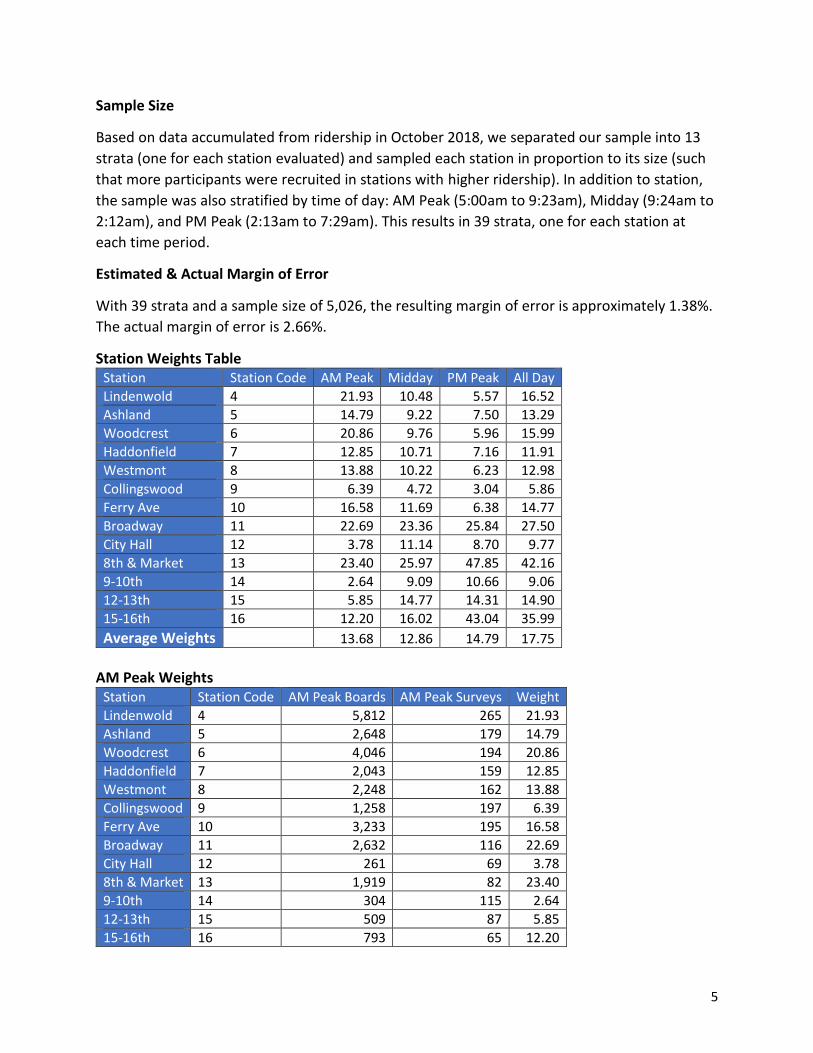
5
Sample Size
Based on data accumulated from ridership in October 2018, we separated our sample into 13
strata (one for each station evaluated) and sampled each station in proportion to its size (such
that more participants were recruited in stations with higher ridership). In addition to station,
the sample was also stratified by time of day: AM Peak (5:00am to 9:23am), Midday (9:24am to
2:12am), and PM Peak (2:13am to 7:29am). This results in 39 strata, one for each station at
each time period.
Estimated & Actual Margin of Error
With 39 strata and a sample size of 5,026, the resulting margin of error is approximately 1.38%.
The actual margin of error is 2.66%.
Station Weights Table Station Station Code AM Peak Midday PM Peak All Day Lindenwold 4 21.93 10.48 5.57 16.52 Ashland 5 14.79 9.22 7.50 13.29 Woodcrest 6 20.86 9.76 5.96 15.99 Haddonfield 7 12.85 10.71 7.16 11.91 Westmont 8 13.88 10.22 6.23 12.98 Collingswood 9 6.39 4.72 3.04 5.86 Ferry Ave 10 16.58 11.69 6.38 14.77 Broadway 11 22.69 23.36 25.84 27.50 City Hall 12 3.78 11.14 8.70 9.77 8th & Market 13 23.40 25.97 47.85 42.16 9-10th 14 2.64 9.09 10.66 9.06 12-13th 15 5.85 14.77 14.31 14.90 15-16th 16 12.20 16.02 43.04 35.99 Average Weights 13.68 12.86 14.79 17.75
AM Peak Weights
Station Station Code AM Peak Boards AM Peak Surveys Weight Lindenwold 4 5,812 265 21.93 Ashland 5 2,648 179 14.79 Woodcrest 6 4,046 194 20.86 Haddonfield 7 2,043 159 12.85 Westmont 8 2,248 162 13.88 Collingswood 9 1,258 197 6.39 Ferry Ave 10 3,233 195 16.58 Broadway 11 2,632 116 22.69 City Hall 12 261 69 3.78 8th & Market 13 1,919 82 23.40 9-10th 14 304 115 2.64 12-13th 15 509 87 5.85 15-16th 16 793 65 12.20
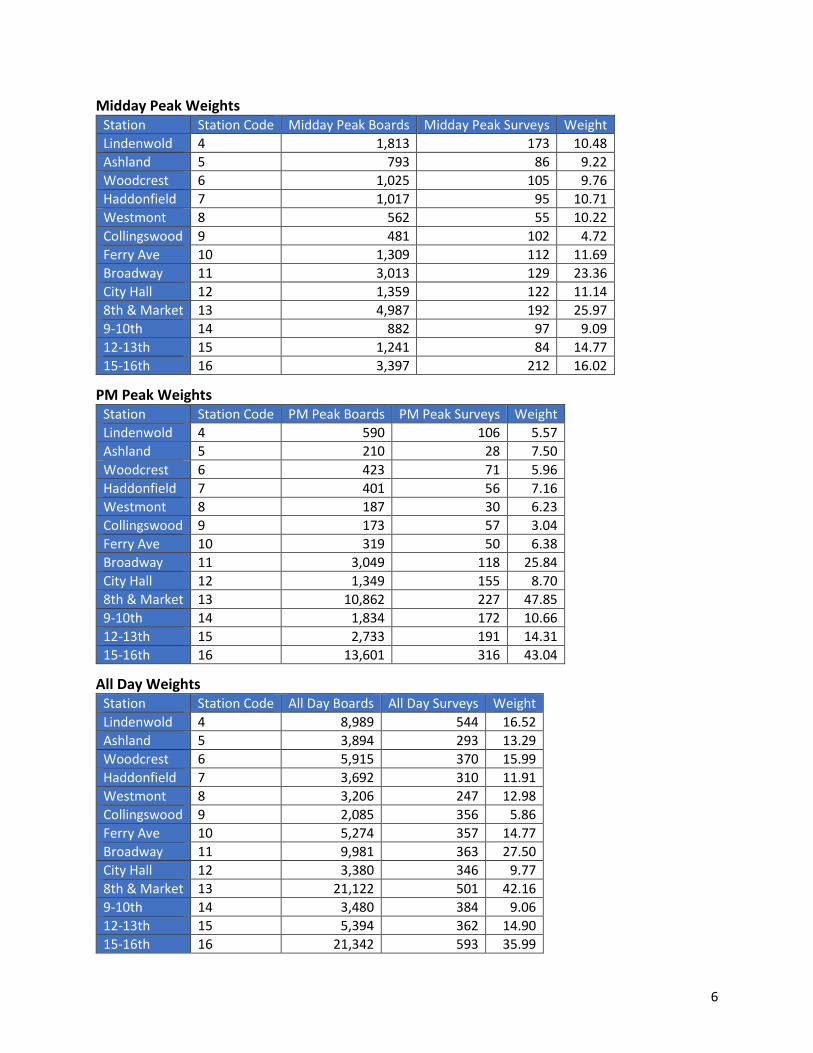
6
Midday Peak Weights Station Station Code Midday Peak Boards Midday Peak Surveys Weight Lindenwold 4 1,813 173 10.48 Ashland 5 793 86 9.22 Woodcrest 6 1,025 105 9.76 Haddonfield 7 1,017 95 10.71 Westmont 8 562 55 10.22 Collingswood 9 481 102 4.72 Ferry Ave 10 1,309 112 11.69 Broadway 11 3,013 129 23.36 City Hall 12 1,359 122 11.14 8th & Market 13 4,987 192 25.97 9-10th 14 882 97 9.09 12-13th 15 1,241 84 14.77 15-16th 16 3,397 212 16.02
PM Peak Weights Station Station Code PM Peak Boards PM Peak Surveys Weight Lindenwold 4 590 106 5.57 Ashland 5 210 28 7.50 Woodcrest 6 423 71 5.96 Haddonfield 7 401 56 7.16 Westmont 8 187 30 6.23 Collingswood 9 173 57 3.04 Ferry Ave 10 319 50 6.38 Broadway 11 3,049 118 25.84 City Hall 12 1,349 155 8.70 8th & Market 13 10,862 227 47.85 9-10th 14 1,834 172 10.66 12-13th 15 2,733 191 14.31 15-16th 16 13,601 316 43.04
All Day Weights Station Station Code All Day Boards All Day Surveys Weight Lindenwold 4 8,989 544 16.52 Ashland 5 3,894 293 13.29 Woodcrest 6 5,915 370 15.99 Haddonfield 7 3,692 310 11.91 Westmont 8 3,206 247 12.98 Collingswood 9 2,085 356 5.86 Ferry Ave 10 5,274 357 14.77 Broadway 11 9,981 363 27.50 City Hall 12 3,380 346 9.77 8th & Market 13 21,122 501 42.16 9-10th 14 3,480 384 9.06 12-13th 15 5,394 362 14.90 15-16th 16 21,342 593 35.99
7
Data Analysis & Weighting
Due to the low margin of error and the confidence interval of 95% which allows for a 5% error,
only actual error is reported in the results.
All data is reported using both weighted and unweighted sample sizes. Unweighted sample
sizes are the raw data collected, meaning the actual sample size by station and time. Weighted
data is reported both by Peak hours (6am to 6pm) and by All Day (5am to 7:29pm) hours.
Weighted data is calculated dividing actual sample by ridership. Reporting weighted data is
done in two phases: first, the average weights are calculated by station and ridership. Weighted
scores are generated using the following formula w2 = N/n then 1/w. Once these weights are
calculated, the raw numbers are multiplied by the weighted scores. All tables will have three
columns: Weighted score by Peak hours; Weighted score by All Day hours; and Unweighted
scores.
The 2015 survey removed all “refused” answer surveys from their data analysis for questions
prior to #14. However, this survey included all answers, including “refused”, as this was an
option provided to all participants. All surveys that included this response are considered
complete and were included in the unweighted data results.
The 2015 survey, like the current survey, only collected peak hour data between the hours of
6am – 6pm. Therefore, peak hours are defined as 6am to 6pm for the purposes of weighted
peak hour results.
Summary of Survey Results3 See Attachment B: PATCO Survey Questions & Attachment C: PATCO Survey Questions – Spanish
Busiest Stations & Time of Day
Based on an assessment of ridership, station surveys collected and weighted by station, the
following stations and times of day were identified as having the heaviest ridership.
AM Peak: Lindenwold, Woodcrest and Ferry Avenue
Midday: 8th & Market, 15th-16th and Lindenwold
PM Peak: 15th-16th, 8th & Market, 9th-10th, 12th-13th
Fare Type
Based on the unweighted response of riders, 73.5% used the Freedom Card, 24.6% used a
Paper Ticket and only 1.9% used the Share Card.
2 w = weight; N = Population (I.e. ridership); n = sample size 3 All data in this section is based on unweighted survey numbers.
8
Most frequent origin/destination
Based on the unweighted response of riders, 60.1% were coming from home and 25.9% were
coming from work. Other notable places of origin for riders included technical school/college
(5.2%), medical/dental appointments (2.7%), personal business (2%), and social (1.5%). Less
than 1% were either coming from shopping or a K-12 school. Approximately 1.4% said ‘other’.
Based on the unweighted response of riders, 48.3% were heading to work and 33.7% were
heading home at the time of being surveyed, making up the majority of destinations. Other
notable ridership destinations included technical school/college (4.6%), social (4%), personal
business (3.5%), medical/dental appointments (3%), and shopping (1%). Approximately 1.8% of
riders said ‘other’ and only .1% of riders were heading to a K-12 school.
Most frequent means used to get to PATCO
Based on the unweighted response, over half (53.3%) of riders drove and parked their car to get
to the PATCO station while approximately a quarter (25.9%) of riders walked to the PATCO
station. Only 6.4% were dropped off in a car, 5.9% took another train, 5.4% took a bus and 1%
biked to get to the PATCO station. Other means of arrival less than 1% each were a taxi,
carpooling or ‘other’ means of transportation.
Most frequent times per week riders made trip
Based on the unweighted response of riders, 58.5% make that same trip 5 or more days a week.
Only 11.6% make the trip 4 days a week, 14.1% make the trip 1-3 days a week, 12.7% a couple
of days a month and 3.1% were making the trip for the first time.
Gender
Based on the unweighted response of riders, 53.8% were female and 45.2% were male. Other
responses included nonbinary (.4%), prefer not to answer (.4%), transgender (.1%) and other
(.1%).
Age
Based on the unweighted response of riders, those who rode the most were ages 21-30 (25.7%)
and ages 31-40 (21.5%). The other age groups most frequently represented in ridership were
those ages 41-50 (17.7%), 51-60 (16.9%) and ages 61+ (12.9%). Only 4.2% were ages 11-20 and
1% refused to answer.
Minority vs. Non-Minority
Based on the unweighted response of riders, 66% were white or non-minority and 26.3%
identified as minorities. Approximately 5.9% identified other and 1.9% refused to answer. Of
those who identified as minorities, 15.9% were African American, 6.6% were Asian, 3.3% were
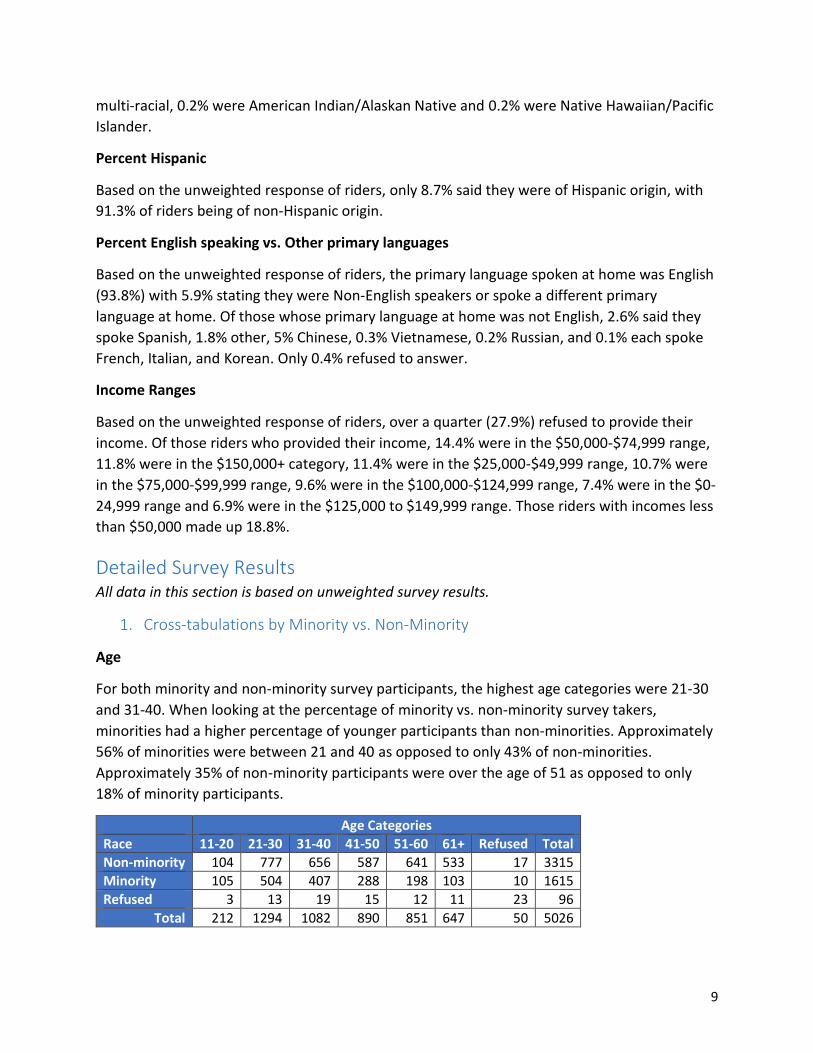
9
multi-racial, 0.2% were American Indian/Alaskan Native and 0.2% were Native Hawaiian/Pacific
Islander.
Percent Hispanic
Based on the unweighted response of riders, only 8.7% said they were of Hispanic origin, with
91.3% of riders being of non-Hispanic origin.
Percent English speaking vs. Other primary languages
Based on the unweighted response of riders, the primary language spoken at home was English
(93.8%) with 5.9% stating they were Non-English speakers or spoke a different primary
language at home. Of those whose primary language at home was not English, 2.6% said they
spoke Spanish, 1.8% other, 5% Chinese, 0.3% Vietnamese, 0.2% Russian, and 0.1% each spoke
French, Italian, and Korean. Only 0.4% refused to answer.
Income Ranges
Based on the unweighted response of riders, over a quarter (27.9%) refused to provide their
income. Of those riders who provided their income, 14.4% were in the $50,000-$74,999 range,
11.8% were in the $150,000+ category, 11.4% were in the $25,000-$49,999 range, 10.7% were
in the $75,000-$99,999 range, 9.6% were in the $100,000-$124,999 range, 7.4% were in the $0-
24,999 range and 6.9% were in the $125,000 to $149,999 range. Those riders with incomes less
than $50,000 made up 18.8%.
Detailed Survey Results All data in this section is based on unweighted survey results.
1. Cross-tabulations by Minority vs. Non-Minority
Age
For both minority and non-minority survey participants, the highest age categories were 21-30
and 31-40. When looking at the percentage of minority vs. non-minority survey takers,
minorities had a higher percentage of younger participants than non-minorities. Approximately
56% of minorities were between 21 and 40 as opposed to only 43% of non-minorities.
Approximately 35% of non-minority participants were over the age of 51 as opposed to only
18% of minority participants.
Age Categories
Race 11-20 21-30 31-40 41-50 51-60 61+ Refused Total
Non-minority 104 777 656 587 641 533 17 3315
Minority 105 504 407 288 198 103 10 1615
Refused 3 13 19 15 12 11 23 96
Total 212 1294 1082 890 851 647 50 5026
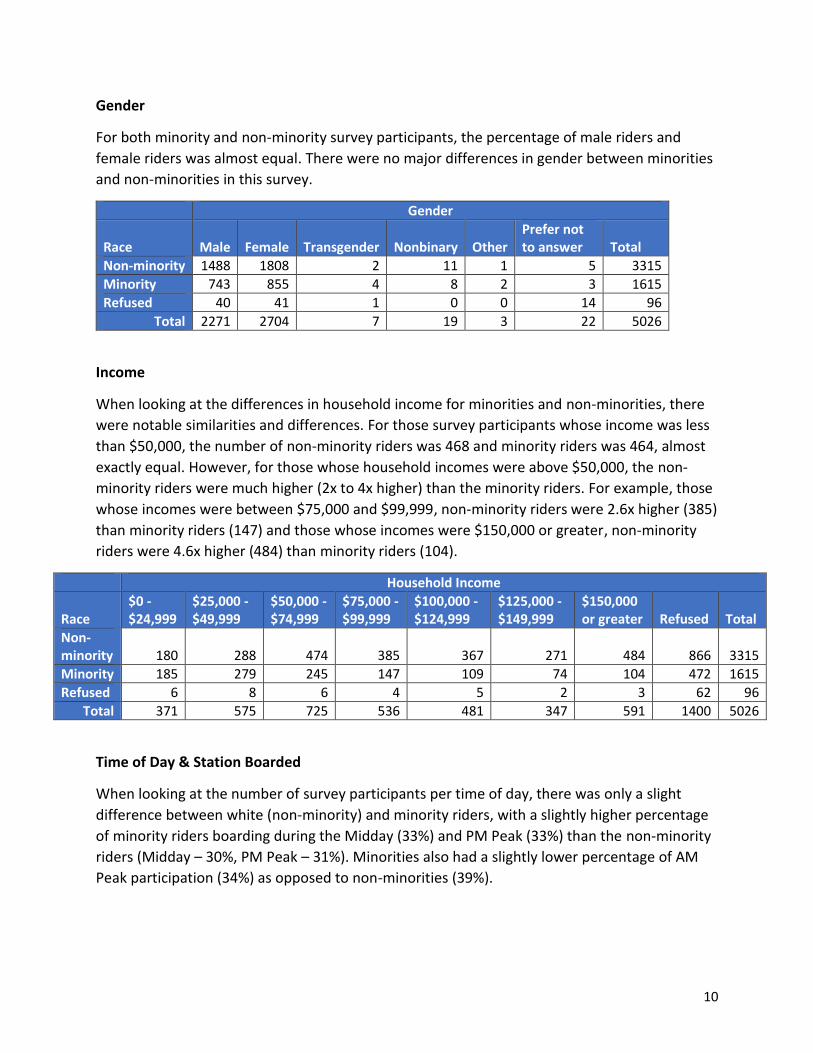
10
Gender
For both minority and non-minority survey participants, the percentage of male riders and
female riders was almost equal. There were no major differences in gender between minorities
and non-minorities in this survey.
Gender
Race Male Female Transgender Nonbinary Other Prefer not to answer Total
Non-minority 1488 1808 2 11 1 5 3315
Minority 743 855 4 8 2 3 1615
Refused 40 41 1 0 0 14 96
Total 2271 2704 7 19 3 22 5026
Income
When looking at the differences in household income for minorities and non-minorities, there
were notable similarities and differences. For those survey participants whose income was less
than $50,000, the number of non-minority riders was 468 and minority riders was 464, almost
exactly equal. However, for those whose household incomes were above $50,000, the non-
minority riders were much higher (2x to 4x higher) than the minority riders. For example, those
whose incomes were between $75,000 and $99,999, non-minority riders were 2.6x higher (385)
than minority riders (147) and those whose incomes were $150,000 or greater, non-minority
riders were 4.6x higher (484) than minority riders (104).
Household Income
Race $0 - $24,999
$25,000 - $49,999
$50,000 - $74,999
$75,000 - $99,999
$100,000 - $124,999
$125,000 - $149,999
$150,000 or greater Refused Total
Non-minority 180 288 474 385 367 271 484 866 3315
Minority 185 279 245 147 109 74 104 472 1615
Refused 6 8 6 4 5 2 3 62 96
Total 371 575 725 536 481 347 591 1400 5026
Time of Day & Station Boarded
When looking at the number of survey participants per time of day, there was only a slight
difference between white (non-minority) and minority riders, with a slightly higher percentage
of minority riders boarding during the Midday (33%) and PM Peak (33%) than the non-minority
riders (Midday – 30%, PM Peak – 31%). Minorities also had a slightly lower percentage of AM
Peak participation (34%) as opposed to non-minorities (39%).
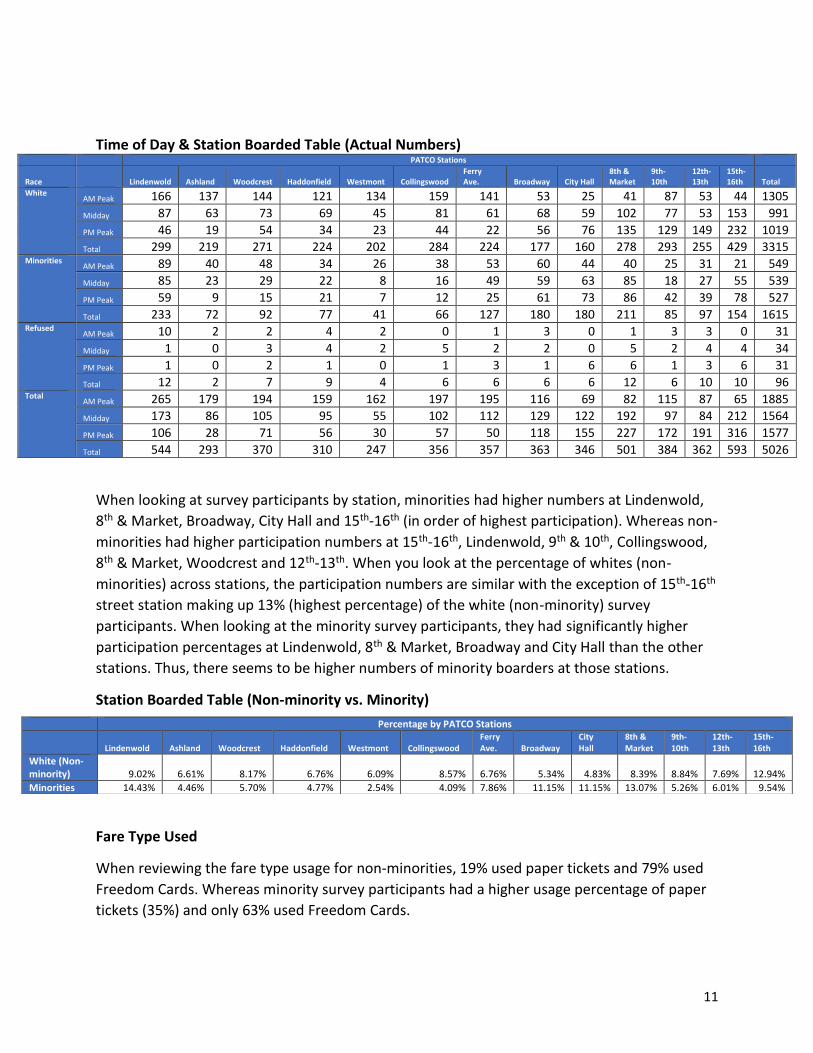
11
Time of Day & Station Boarded Table (Actual Numbers)
PATCO Stations
Race Lindenwold Ashland Woodcrest Haddonfield Westmont Collingswood Ferry Ave. Broadway City Hall
8th & Market
9th-10th
12th-13th
15th-16th Total
White
AM Peak 166 137 144 121 134 159 141 53 25 41 87 53 44 1305
Midday 87 63 73 69 45 81 61 68 59 102 77 53 153 991
PM Peak 46 19 54 34 23 44 22 56 76 135 129 149 232 1019
Total 299 219 271 224 202 284 224 177 160 278 293 255 429 3315 Minorities
AM Peak 89 40 48 34 26 38 53 60 44 40 25 31 21 549
Midday 85 23 29 22 8 16 49 59 63 85 18 27 55 539
PM Peak 59 9 15 21 7 12 25 61 73 86 42 39 78 527
Total 233 72 92 77 41 66 127 180 180 211 85 97 154 1615 Refused
AM Peak 10 2 2 4 2 0 1 3 0 1 3 3 0 31
Midday 1 0 3 4 2 5 2 2 0 5 2 4 4 34
PM Peak 1 0 2 1 0 1 3 1 6 6 1 3 6 31
Total 12 2 7 9 4 6 6 6 6 12 6 10 10 96 Total
AM Peak 265 179 194 159 162 197 195 116 69 82 115 87 65 1885
Midday 173 86 105 95 55 102 112 129 122 192 97 84 212 1564
PM Peak 106 28 71 56 30 57 50 118 155 227 172 191 316 1577
Total 544 293 370 310 247 356 357 363 346 501 384 362 593 5026
When looking at survey participants by station, minorities had higher numbers at Lindenwold,
8th & Market, Broadway, City Hall and 15th-16th (in order of highest participation). Whereas non-
minorities had higher participation numbers at 15th-16th, Lindenwold, 9th & 10th, Collingswood,
8th & Market, Woodcrest and 12th-13th. When you look at the percentage of whites (non-
minorities) across stations, the participation numbers are similar with the exception of 15th-16th
street station making up 13% (highest percentage) of the white (non-minority) survey
participants. When looking at the minority survey participants, they had significantly higher
participation percentages at Lindenwold, 8th & Market, Broadway and City Hall than the other
stations. Thus, there seems to be higher numbers of minority boarders at those stations.
Station Boarded Table (Non-minority vs. Minority)
Fare Type Used
When reviewing the fare type usage for non-minorities, 19% used paper tickets and 79% used
Freedom Cards. Whereas minority survey participants had a higher usage percentage of paper
tickets (35%) and only 63% used Freedom Cards.
Percentage by PATCO Stations
Lindenwold Ashland Woodcrest Haddonfield Westmont Collingswood Ferry Ave. Broadway
City Hall
8th & Market
9th-10th
12th-13th
15th-16th
White (Non-minority) 9.02% 6.61% 8.17% 6.76% 6.09% 8.57% 6.76% 5.34% 4.83% 8.39% 8.84% 7.69% 12.94%
Minorities 14.43% 4.46% 5.70% 4.77% 2.54% 4.09% 7.86% 11.15% 11.15% 13.07% 5.26% 6.01% 9.54%
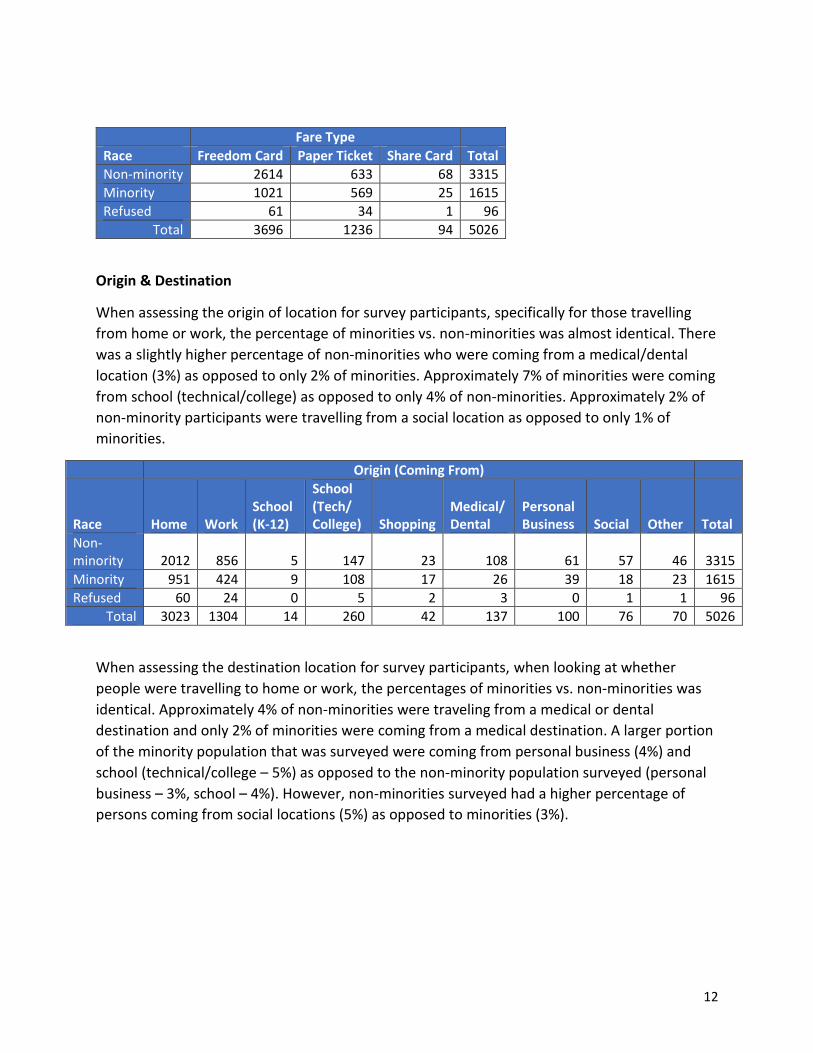
12
Fare Type
Race Freedom Card Paper Ticket Share Card Total Non-minority 2614 633 68 3315 Minority 1021 569 25 1615 Refused 61 34 1 96
Total 3696 1236 94 5026
Origin & Destination
When assessing the origin of location for survey participants, specifically for those travelling
from home or work, the percentage of minorities vs. non-minorities was almost identical. There
was a slightly higher percentage of non-minorities who were coming from a medical/dental
location (3%) as opposed to only 2% of minorities. Approximately 7% of minorities were coming
from school (technical/college) as opposed to only 4% of non-minorities. Approximately 2% of
non-minority participants were travelling from a social location as opposed to only 1% of
minorities.
Origin (Coming From)
Race Home Work School (K-12)
School (Tech/ College) Shopping
Medical/Dental
Personal Business Social Other Total
Non-minority 2012 856 5 147 23 108 61 57 46 3315
Minority 951 424 9 108 17 26 39 18 23 1615
Refused 60 24 0 5 2 3 0 1 1 96
Total 3023 1304 14 260 42 137 100 76 70 5026
When assessing the destination location for survey participants, when looking at whether
people were travelling to home or work, the percentages of minorities vs. non-minorities was
identical. Approximately 4% of non-minorities were traveling from a medical or dental
destination and only 2% of minorities were coming from a medical destination. A larger portion
of the minority population that was surveyed were coming from personal business (4%) and
school (technical/college – 5%) as opposed to the non-minority population surveyed (personal
business – 3%, school – 4%). However, non-minorities surveyed had a higher percentage of
persons coming from social locations (5%) as opposed to minorities (3%).
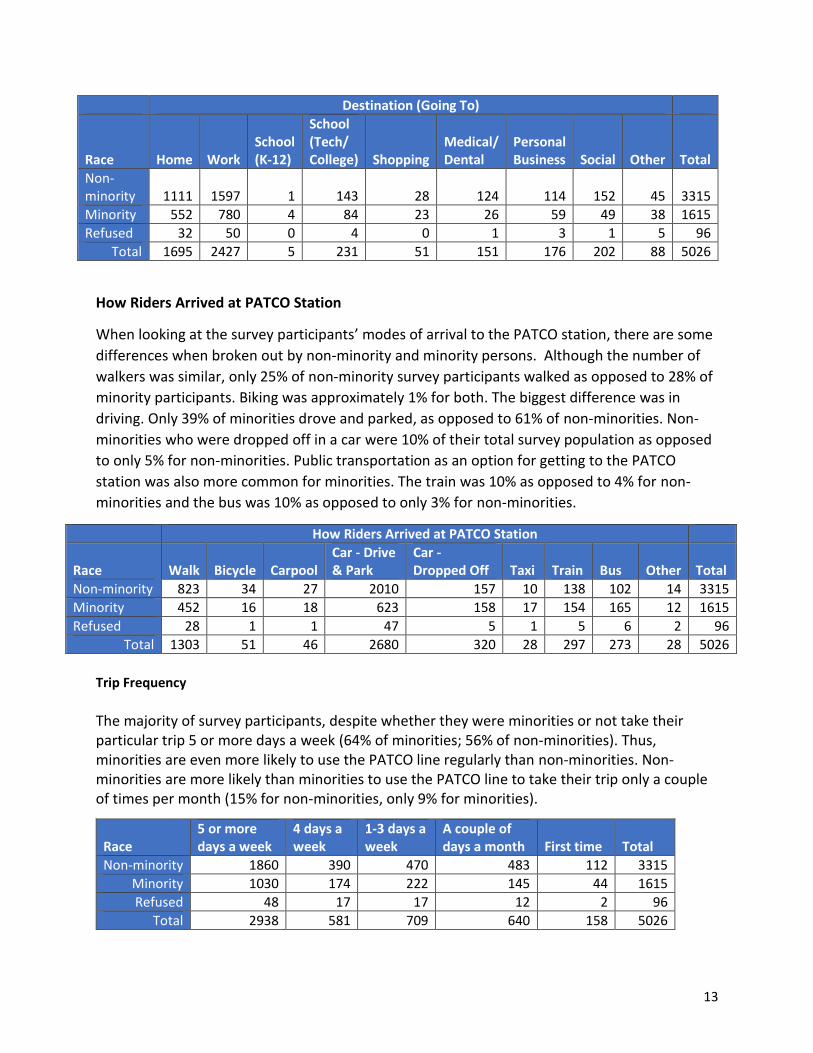
13
Destination (Going To)
Race Home Work School (K-12)
School (Tech/ College) Shopping
Medical/ Dental
Personal Business Social Other Total
Non-minority 1111 1597 1 143 28 124 114 152 45 3315
Minority 552 780 4 84 23 26 59 49 38 1615
Refused 32 50 0 4 0 1 3 1 5 96
Total 1695 2427 5 231 51 151 176 202 88 5026
How Riders Arrived at PATCO Station
When looking at the survey participants’ modes of arrival to the PATCO station, there are some
differences when broken out by non-minority and minority persons. Although the number of
walkers was similar, only 25% of non-minority survey participants walked as opposed to 28% of
minority participants. Biking was approximately 1% for both. The biggest difference was in
driving. Only 39% of minorities drove and parked, as opposed to 61% of non-minorities. Non-
minorities who were dropped off in a car were 10% of their total survey population as opposed
to only 5% for non-minorities. Public transportation as an option for getting to the PATCO
station was also more common for minorities. The train was 10% as opposed to 4% for non-
minorities and the bus was 10% as opposed to only 3% for non-minorities.
How Riders Arrived at PATCO Station
Race Walk Bicycle Carpool Car - Drive & Park
Car - Dropped Off Taxi Train Bus Other Total
Non-minority 823 34 27 2010 157 10 138 102 14 3315
Minority 452 16 18 623 158 17 154 165 12 1615
Refused 28 1 1 47 5 1 5 6 2 96
Total 1303 51 46 2680 320 28 297 273 28 5026
Trip Frequency
The majority of survey participants, despite whether they were minorities or not take their particular trip 5 or more days a week (64% of minorities; 56% of non-minorities). Thus, minorities are even more likely to use the PATCO line regularly than non-minorities. Non-minorities are more likely than minorities to use the PATCO line to take their trip only a couple of times per month (15% for non-minorities, only 9% for minorities).
Race 5 or more days a week
4 days a week
1-3 days a week
A couple of days a month First time Total
Non-minority 1860 390 470 483 112 3315 Minority 1030 174 222 145 44 1615 Refused 48 17 17 12 2 96
Total 2938 581 709 640 158 5026
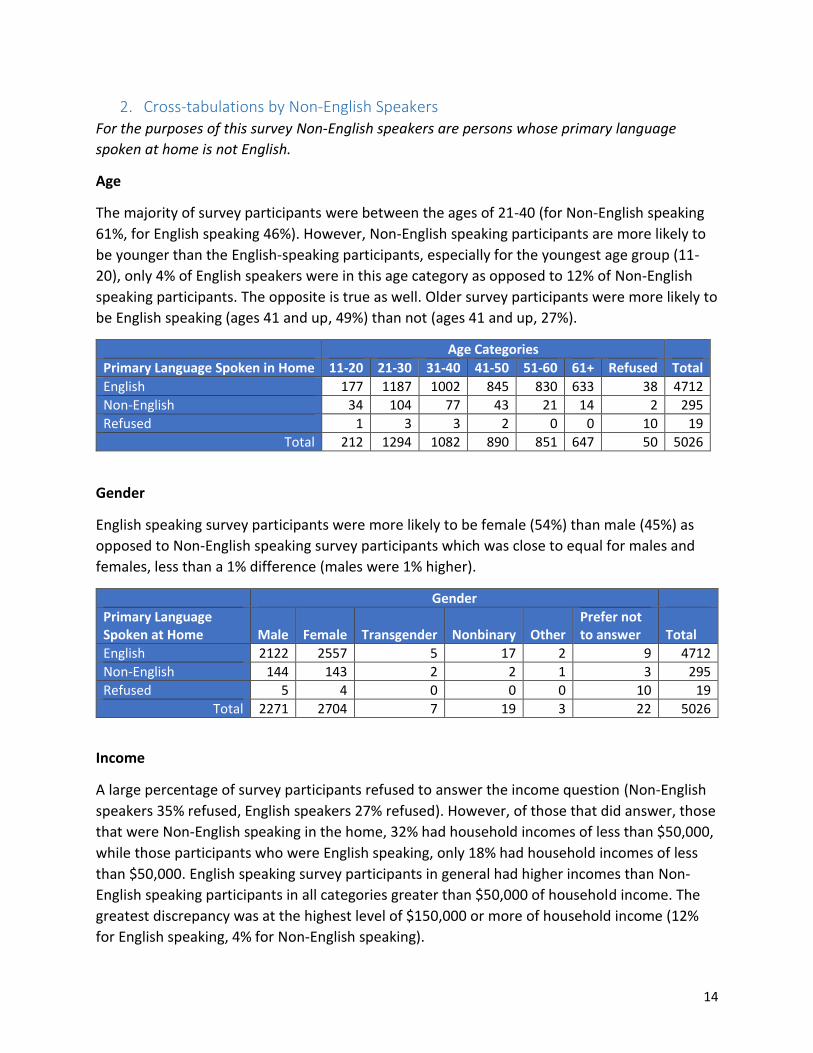
14
2. Cross-tabulations by Non-English Speakers For the purposes of this survey Non-English speakers are persons whose primary language
spoken at home is not English.
Age
The majority of survey participants were between the ages of 21-40 (for Non-English speaking
61%, for English speaking 46%). However, Non-English speaking participants are more likely to
be younger than the English-speaking participants, especially for the youngest age group (11-
20), only 4% of English speakers were in this age category as opposed to 12% of Non-English
speaking participants. The opposite is true as well. Older survey participants were more likely to
be English speaking (ages 41 and up, 49%) than not (ages 41 and up, 27%).
Age Categories
Primary Language Spoken in Home 11-20 21-30 31-40 41-50 51-60 61+ Refused Total
English 177 1187 1002 845 830 633 38 4712
Non-English 34 104 77 43 21 14 2 295
Refused 1 3 3 2 0 0 10 19
Total 212 1294 1082 890 851 647 50 5026
Gender
English speaking survey participants were more likely to be female (54%) than male (45%) as
opposed to Non-English speaking survey participants which was close to equal for males and
females, less than a 1% difference (males were 1% higher).
Gender
Primary Language Spoken at Home Male Female Transgender Nonbinary Other
Prefer not to answer Total
English 2122 2557 5 17 2 9 4712
Non-English 144 143 2 2 1 3 295
Refused 5 4 0 0 0 10 19
Total 2271 2704 7 19 3 22 5026
Income
A large percentage of survey participants refused to answer the income question (Non-English
speakers 35% refused, English speakers 27% refused). However, of those that did answer, those
that were Non-English speaking in the home, 32% had household incomes of less than $50,000,
while those participants who were English speaking, only 18% had household incomes of less
than $50,000. English speaking survey participants in general had higher incomes than Non-
English speaking participants in all categories greater than $50,000 of household income. The
greatest discrepancy was at the highest level of $150,000 or more of household income (12%
for English speaking, 4% for Non-English speaking).
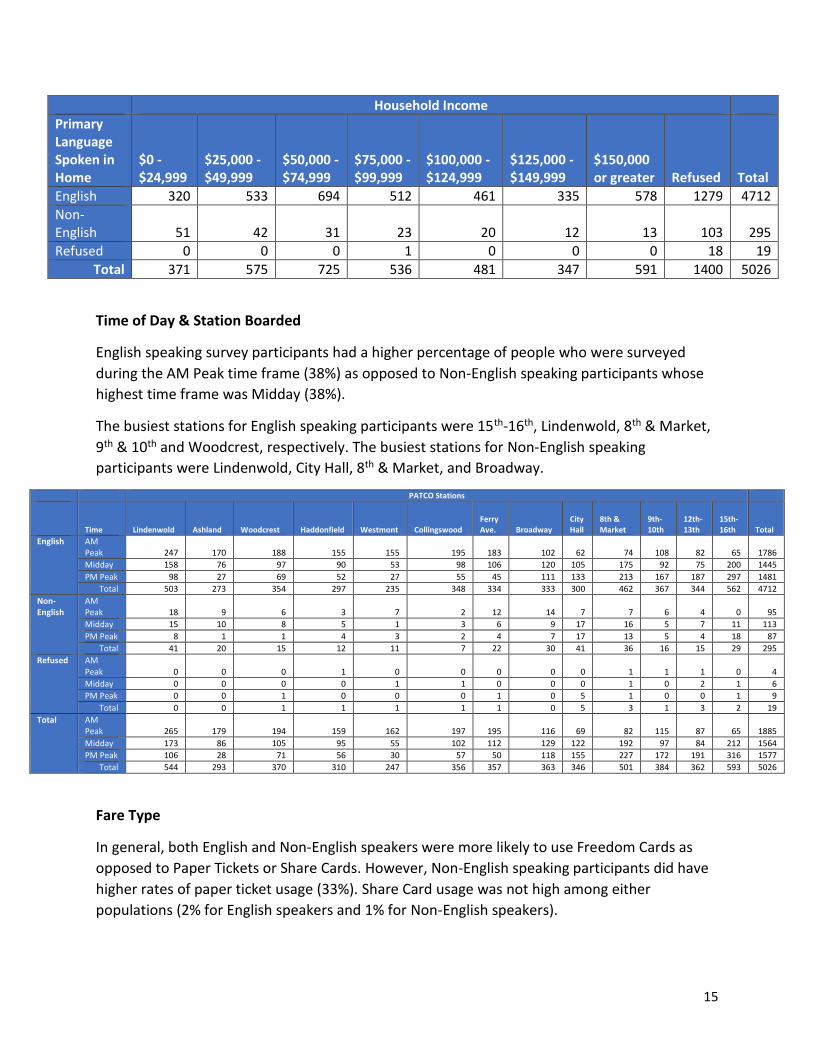
15
Household Income
Primary Language Spoken in Home
$0 - $24,999
$25,000 - $49,999
$50,000 - $74,999
$75,000 - $99,999
$100,000 - $124,999
$125,000 - $149,999
$150,000 or greater Refused Total
English 320 533 694 512 461 335 578 1279 4712
Non-English 51 42 31 23 20 12 13 103 295
Refused 0 0 0 1 0 0 0 18 19
Total 371 575 725 536 481 347 591 1400 5026
Time of Day & Station Boarded
English speaking survey participants had a higher percentage of people who were surveyed
during the AM Peak time frame (38%) as opposed to Non-English speaking participants whose
highest time frame was Midday (38%).
The busiest stations for English speaking participants were 15th-16th, Lindenwold, 8th & Market,
9th & 10th and Woodcrest, respectively. The busiest stations for Non-English speaking
participants were Lindenwold, City Hall, 8th & Market, and Broadway.
PATCO Stations
Time Lindenwold Ashland Woodcrest Haddonfield Westmont Collingswood Ferry Ave. Broadway
City Hall
8th & Market
9th-10th
12th-13th
15th-16th Total
English AM Peak 247 170 188 155 155 195 183 102 62 74 108 82 65 1786
Midday 158 76 97 90 53 98 106 120 105 175 92 75 200 1445
PM Peak 98 27 69 52 27 55 45 111 133 213 167 187 297 1481
Total 503 273 354 297 235 348 334 333 300 462 367 344 562 4712
Non-English
AM Peak 18 9 6 3 7 2 12 14 7 7 6 4 0 95
Midday 15 10 8 5 1 3 6 9 17 16 5 7 11 113
PM Peak 8 1 1 4 3 2 4 7 17 13 5 4 18 87
Total 41 20 15 12 11 7 22 30 41 36 16 15 29 295
Refused AM Peak 0 0 0 1 0 0 0 0 0 1 1 1 0 4
Midday 0 0 0 0 1 1 0 0 0 1 0 2 1 6
PM Peak 0 0 1 0 0 0 1 0 5 1 0 0 1 9
Total 0 0 1 1 1 1 1 0 5 3 1 3 2 19
Total AM Peak 265 179 194 159 162 197 195 116 69 82 115 87 65 1885
Midday 173 86 105 95 55 102 112 129 122 192 97 84 212 1564
PM Peak 106 28 71 56 30 57 50 118 155 227 172 191 316 1577
Total 544 293 370 310 247 356 357 363 346 501 384 362 593 5026
Fare Type
In general, both English and Non-English speakers were more likely to use Freedom Cards as
opposed to Paper Tickets or Share Cards. However, Non-English speaking participants did have
higher rates of paper ticket usage (33%). Share Card usage was not high among either
populations (2% for English speakers and 1% for Non-English speakers).
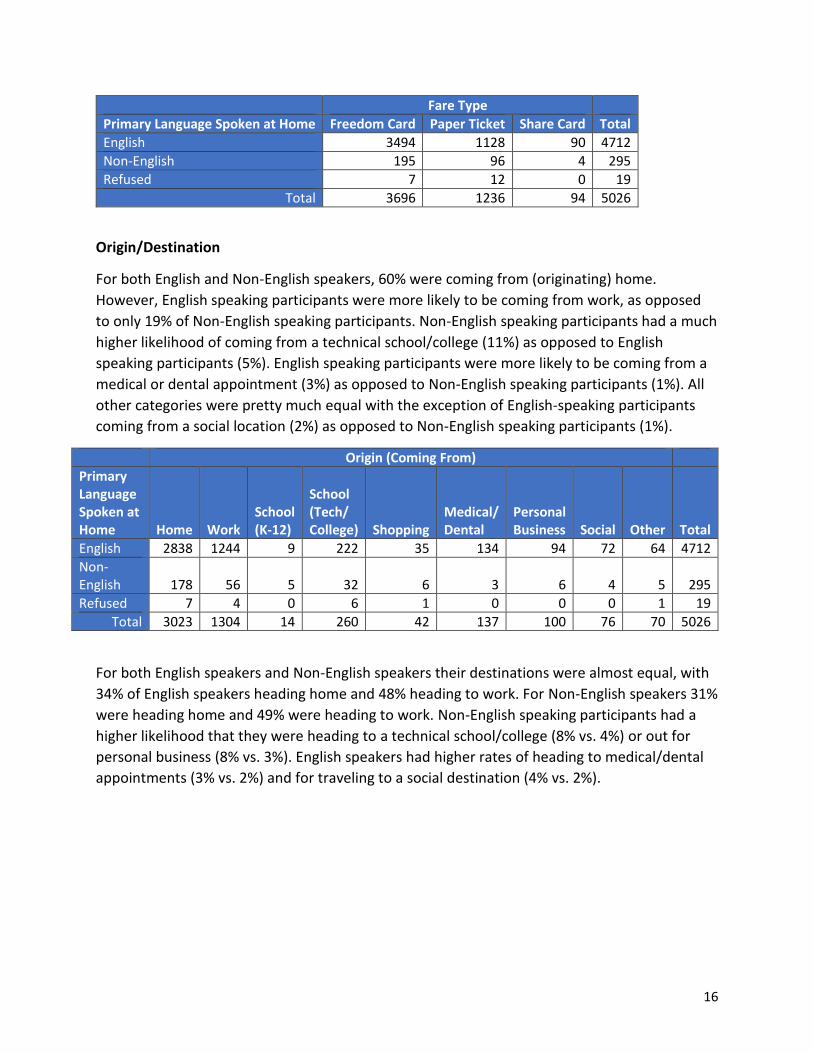
16
Fare Type
Primary Language Spoken at Home Freedom Card Paper Ticket Share Card Total
English 3494 1128 90 4712
Non-English 195 96 4 295
Refused 7 12 0 19
Total 3696 1236 94 5026
Origin/Destination
For both English and Non-English speakers, 60% were coming from (originating) home.
However, English speaking participants were more likely to be coming from work, as opposed
to only 19% of Non-English speaking participants. Non-English speaking participants had a much
higher likelihood of coming from a technical school/college (11%) as opposed to English
speaking participants (5%). English speaking participants were more likely to be coming from a
medical or dental appointment (3%) as opposed to Non-English speaking participants (1%). All
other categories were pretty much equal with the exception of English-speaking participants
coming from a social location (2%) as opposed to Non-English speaking participants (1%).
Origin (Coming From)
Primary Language Spoken at Home Home Work
School (K-12)
School (Tech/ College) Shopping
Medical/ Dental
Personal Business Social Other Total
English 2838 1244 9 222 35 134 94 72 64 4712
Non-English 178 56 5 32 6 3 6 4 5 295
Refused 7 4 0 6 1 0 0 0 1 19
Total 3023 1304 14 260 42 137 100 76 70 5026
For both English speakers and Non-English speakers their destinations were almost equal, with
34% of English speakers heading home and 48% heading to work. For Non-English speakers 31%
were heading home and 49% were heading to work. Non-English speaking participants had a
higher likelihood that they were heading to a technical school/college (8% vs. 4%) or out for
personal business (8% vs. 3%). English speakers had higher rates of heading to medical/dental
appointments (3% vs. 2%) and for traveling to a social destination (4% vs. 2%).
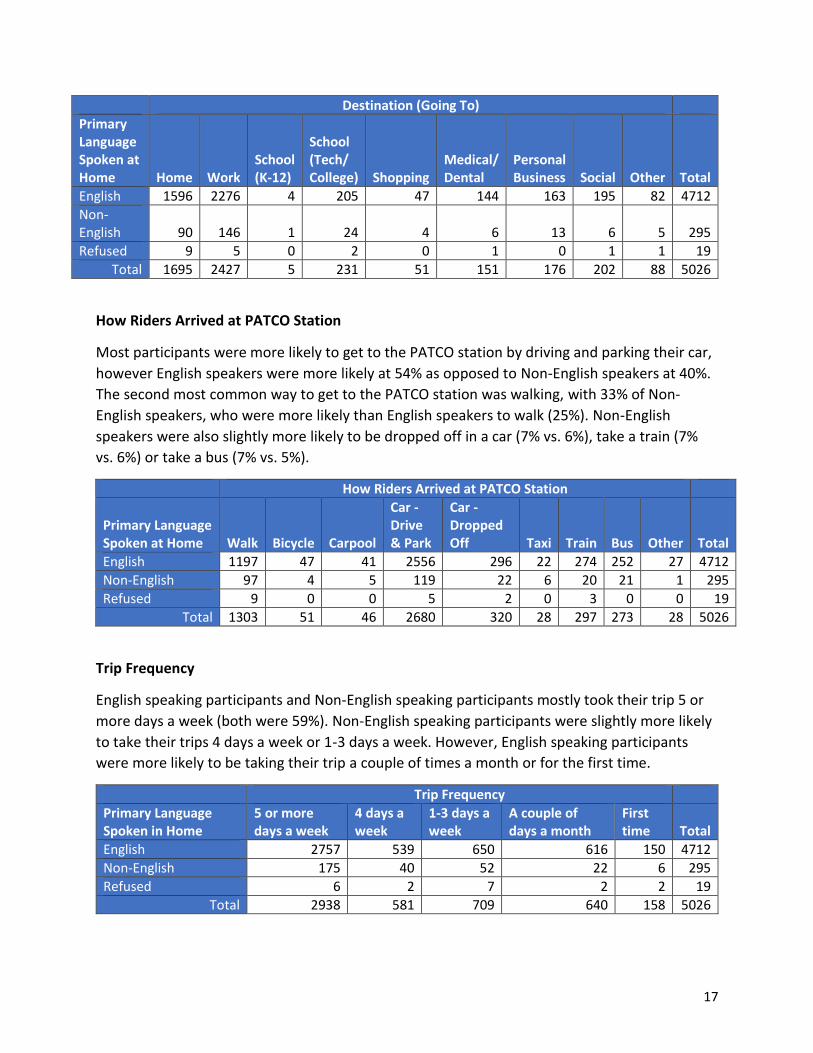
17
Destination (Going To)
Primary Language Spoken at Home Home Work
School (K-12)
School (Tech/ College) Shopping
Medical/ Dental
Personal Business Social Other Total
English 1596 2276 4 205 47 144 163 195 82 4712
Non-English 90 146 1 24 4 6 13 6 5 295
Refused 9 5 0 2 0 1 0 1 1 19
Total 1695 2427 5 231 51 151 176 202 88 5026
How Riders Arrived at PATCO Station
Most participants were more likely to get to the PATCO station by driving and parking their car,
however English speakers were more likely at 54% as opposed to Non-English speakers at 40%.
The second most common way to get to the PATCO station was walking, with 33% of Non-
English speakers, who were more likely than English speakers to walk (25%). Non-English
speakers were also slightly more likely to be dropped off in a car (7% vs. 6%), take a train (7%
vs. 6%) or take a bus (7% vs. 5%).
How Riders Arrived at PATCO Station
Primary Language Spoken at Home Walk Bicycle Carpool
Car - Drive & Park
Car - Dropped Off Taxi Train Bus Other Total
English 1197 47 41 2556 296 22 274 252 27 4712
Non-English 97 4 5 119 22 6 20 21 1 295
Refused 9 0 0 5 2 0 3 0 0 19
Total 1303 51 46 2680 320 28 297 273 28 5026
Trip Frequency
English speaking participants and Non-English speaking participants mostly took their trip 5 or
more days a week (both were 59%). Non-English speaking participants were slightly more likely
to take their trips 4 days a week or 1-3 days a week. However, English speaking participants
were more likely to be taking their trip a couple of times a month or for the first time.
Trip Frequency
Primary Language Spoken in Home
5 or more days a week
4 days a week
1-3 days a week
A couple of days a month
First time Total
English 2757 539 650 616 150 4712
Non-English 175 40 52 22 6 295
Refused 6 2 7 2 2 19
Total 2938 581 709 640 158 5026
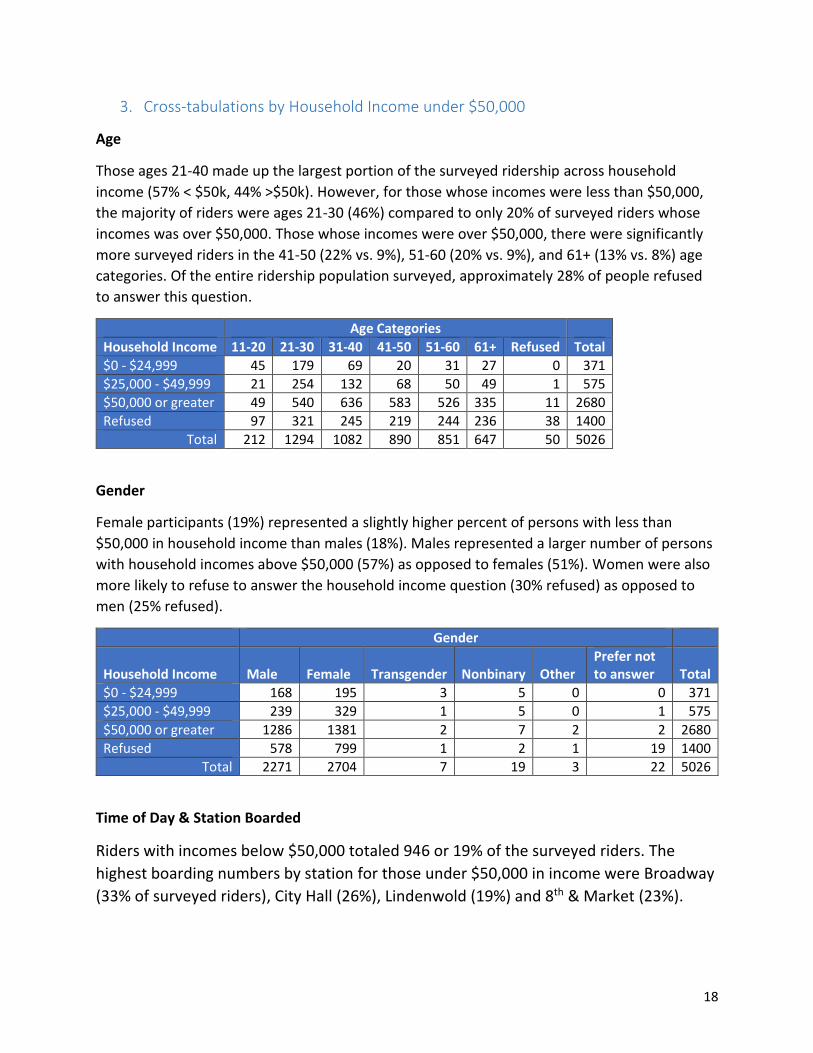
18
3. Cross-tabulations by Household Income under $50,000
Age
Those ages 21-40 made up the largest portion of the surveyed ridership across household
income (57% < $50k, 44% >$50k). However, for those whose incomes were less than $50,000,
the majority of riders were ages 21-30 (46%) compared to only 20% of surveyed riders whose
incomes was over $50,000. Those whose incomes were over $50,000, there were significantly
more surveyed riders in the 41-50 (22% vs. 9%), 51-60 (20% vs. 9%), and 61+ (13% vs. 8%) age
categories. Of the entire ridership population surveyed, approximately 28% of people refused
to answer this question.
Age Categories
Household Income 11-20 21-30 31-40 41-50 51-60 61+ Refused Total
$0 - $24,999 45 179 69 20 31 27 0 371
$25,000 - $49,999 21 254 132 68 50 49 1 575
$50,000 or greater 49 540 636 583 526 335 11 2680
Refused 97 321 245 219 244 236 38 1400
Total 212 1294 1082 890 851 647 50 5026
Gender
Female participants (19%) represented a slightly higher percent of persons with less than
$50,000 in household income than males (18%). Males represented a larger number of persons
with household incomes above $50,000 (57%) as opposed to females (51%). Women were also
more likely to refuse to answer the household income question (30% refused) as opposed to
men (25% refused).
Gender
Household Income Male Female Transgender Nonbinary Other Prefer not to answer Total
$0 - $24,999 168 195 3 5 0 0 371
$25,000 - $49,999 239 329 1 5 0 1 575
$50,000 or greater 1286 1381 2 7 2 2 2680
Refused 578 799 1 2 1 19 1400
Total 2271 2704 7 19 3 22 5026
Time of Day & Station Boarded
Riders with incomes below $50,000 totaled 946 or 19% of the surveyed riders. The
highest boarding numbers by station for those under $50,000 in income were Broadway
(33% of surveyed riders), City Hall (26%), Lindenwold (19%) and 8th & Market (23%).
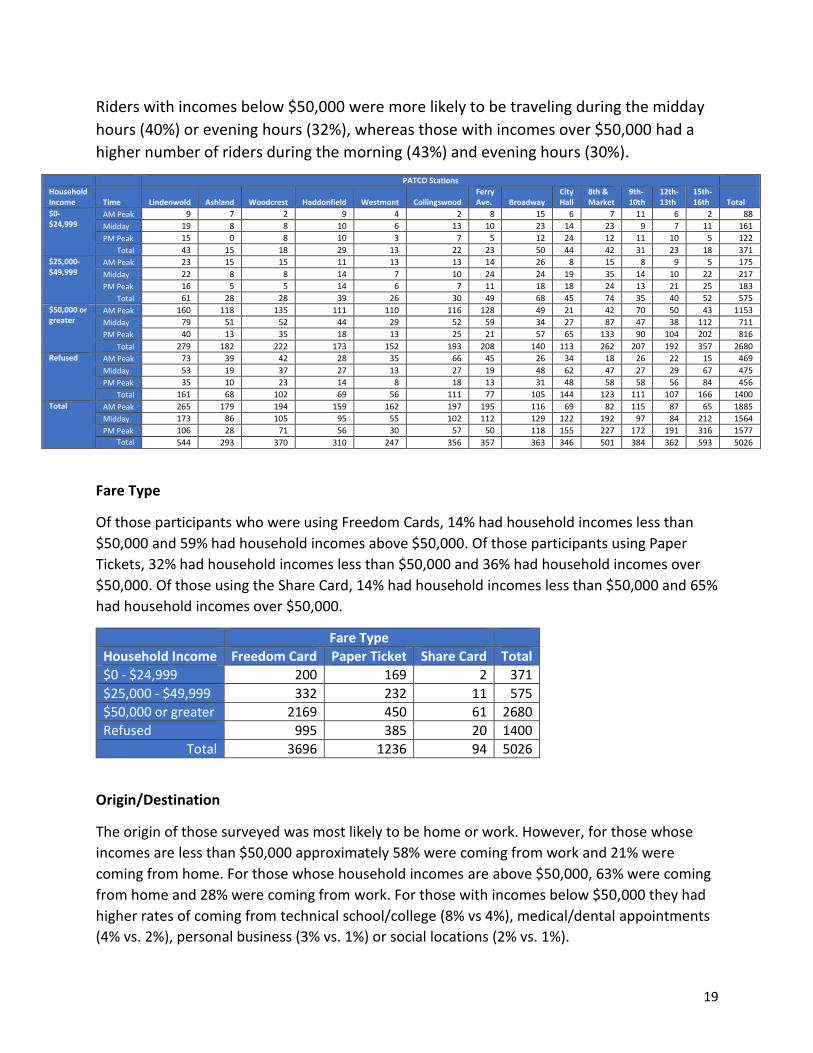
19
Riders with incomes below $50,000 were more likely to be traveling during the midday
hours (40%) or evening hours (32%), whereas those with incomes over $50,000 had a
higher number of riders during the morning (43%) and evening hours (30%).
PATCO Stations
Household Income Time Lindenwold Ashland Woodcrest Haddonfield Westmont Collingswood
Ferry Ave. Broadway
City Hall
8th & Market
9th-10th
12th-13th
15th-16th Total
$0-$24,999
AM Peak 9 7 2 9 4 2 8 15 6 7 11 6 2 88
Midday 19 8 8 10 6 13 10 23 14 23 9 7 11 161
PM Peak 15 0 8 10 3 7 5 12 24 12 11 10 5 122
Total 43 15 18 29 13 22 23 50 44 42 31 23 18 371 $25,000-$49,999
AM Peak 23 15 15 11 13 13 14 26 8 15 8 9 5 175
Midday 22 8 8 14 7 10 24 24 19 35 14 10 22 217
PM Peak 16 5 5 14 6 7 11 18 18 24 13 21 25 183
Total 61 28 28 39 26 30 49 68 45 74 35 40 52 575 $50,000 or greater
AM Peak 160 118 135 111 110 116 128 49 21 42 70 50 43 1153
Midday 79 51 52 44 29 52 59 34 27 87 47 38 112 711
PM Peak 40 13 35 18 13 25 21 57 65 133 90 104 202 816
Total 279 182 222 173 152 193 208 140 113 262 207 192 357 2680 Refused AM Peak 73 39 42 28 35 66 45 26 34 18 26 22 15 469
Midday 53 19 37 27 13 27 19 48 62 47 27 29 67 475
PM Peak 35 10 23 14 8 18 13 31 48 58 58 56 84 456
Total 161 68 102 69 56 111 77 105 144 123 111 107 166 1400 Total AM Peak 265 179 194 159 162 197 195 116 69 82 115 87 65 1885
Midday 173 86 105 95 55 102 112 129 122 192 97 84 212 1564
PM Peak 106 28 71 56 30 57 50 118 155 227 172 191 316 1577 Total 544 293 370 310 247 356 357 363 346 501 384 362 593 5026
Fare Type
Of those participants who were using Freedom Cards, 14% had household incomes less than
$50,000 and 59% had household incomes above $50,000. Of those participants using Paper
Tickets, 32% had household incomes less than $50,000 and 36% had household incomes over
$50,000. Of those using the Share Card, 14% had household incomes less than $50,000 and 65%
had household incomes over $50,000.
Fare Type
Household Income Freedom Card Paper Ticket Share Card Total
$0 - $24,999 200 169 2 371
$25,000 - $49,999 332 232 11 575
$50,000 or greater 2169 450 61 2680
Refused 995 385 20 1400
Total 3696 1236 94 5026
Origin/Destination
The origin of those surveyed was most likely to be home or work. However, for those whose
incomes are less than $50,000 approximately 58% were coming from work and 21% were
coming from home. For those whose household incomes are above $50,000, 63% were coming
from home and 28% were coming from work. For those with incomes below $50,000 they had
higher rates of coming from technical school/college (8% vs 4%), medical/dental appointments
(4% vs. 2%), personal business (3% vs. 1%) or social locations (2% vs. 1%).
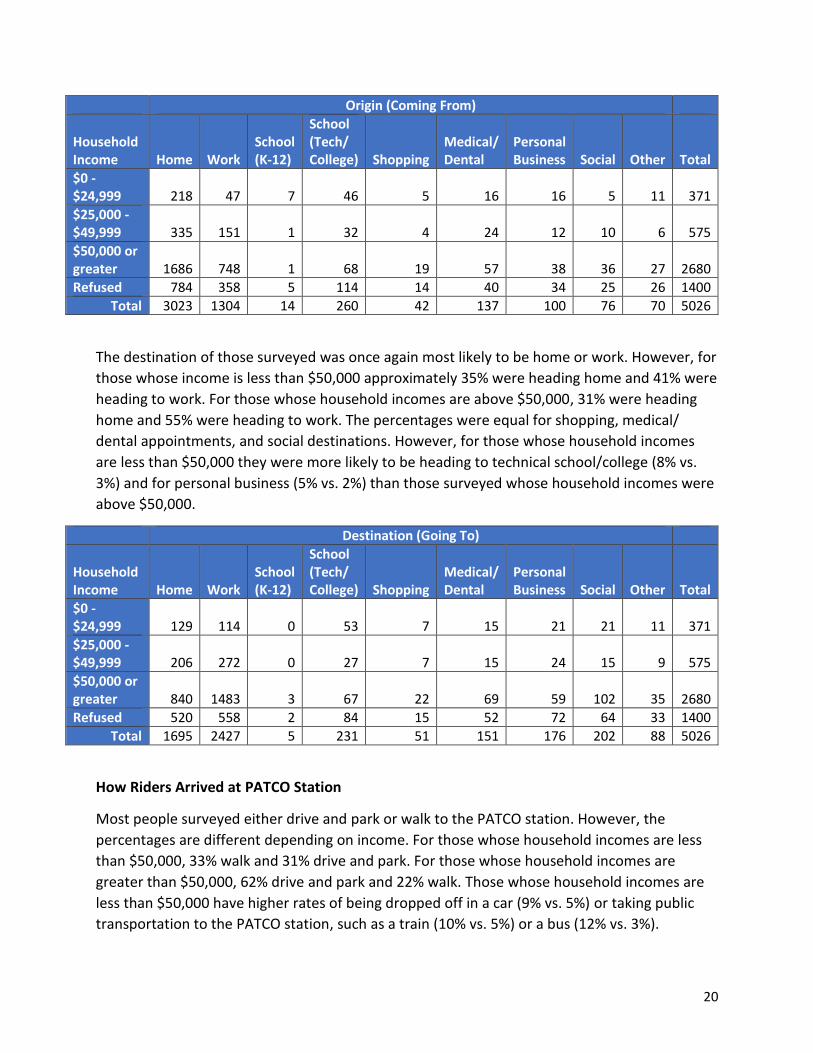
20
Origin (Coming From)
Household Income Home Work
School (K-12)
School (Tech/ College) Shopping
Medical/ Dental
Personal Business Social Other Total
$0 - $24,999 218 47 7 46 5 16 16 5 11 371
$25,000 - $49,999 335 151 1 32 4 24 12 10 6 575
$50,000 or greater 1686 748 1 68 19 57 38 36 27 2680
Refused 784 358 5 114 14 40 34 25 26 1400
Total 3023 1304 14 260 42 137 100 76 70 5026
The destination of those surveyed was once again most likely to be home or work. However, for
those whose income is less than $50,000 approximately 35% were heading home and 41% were
heading to work. For those whose household incomes are above $50,000, 31% were heading
home and 55% were heading to work. The percentages were equal for shopping, medical/
dental appointments, and social destinations. However, for those whose household incomes
are less than $50,000 they were more likely to be heading to technical school/college (8% vs.
3%) and for personal business (5% vs. 2%) than those surveyed whose household incomes were
above $50,000.
Destination (Going To)
Household Income Home Work
School (K-12)
School (Tech/ College) Shopping
Medical/ Dental
Personal Business Social Other Total
$0 - $24,999 129 114 0 53 7 15 21 21 11 371
$25,000 - $49,999 206 272 0 27 7 15 24 15 9 575
$50,000 or greater 840 1483 3 67 22 69 59 102 35 2680
Refused 520 558 2 84 15 52 72 64 33 1400
Total 1695 2427 5 231 51 151 176 202 88 5026
How Riders Arrived at PATCO Station
Most people surveyed either drive and park or walk to the PATCO station. However, the
percentages are different depending on income. For those whose household incomes are less
than $50,000, 33% walk and 31% drive and park. For those whose household incomes are
greater than $50,000, 62% drive and park and 22% walk. Those whose household incomes are
less than $50,000 have higher rates of being dropped off in a car (9% vs. 5%) or taking public
transportation to the PATCO station, such as a train (10% vs. 5%) or a bus (12% vs. 3%).
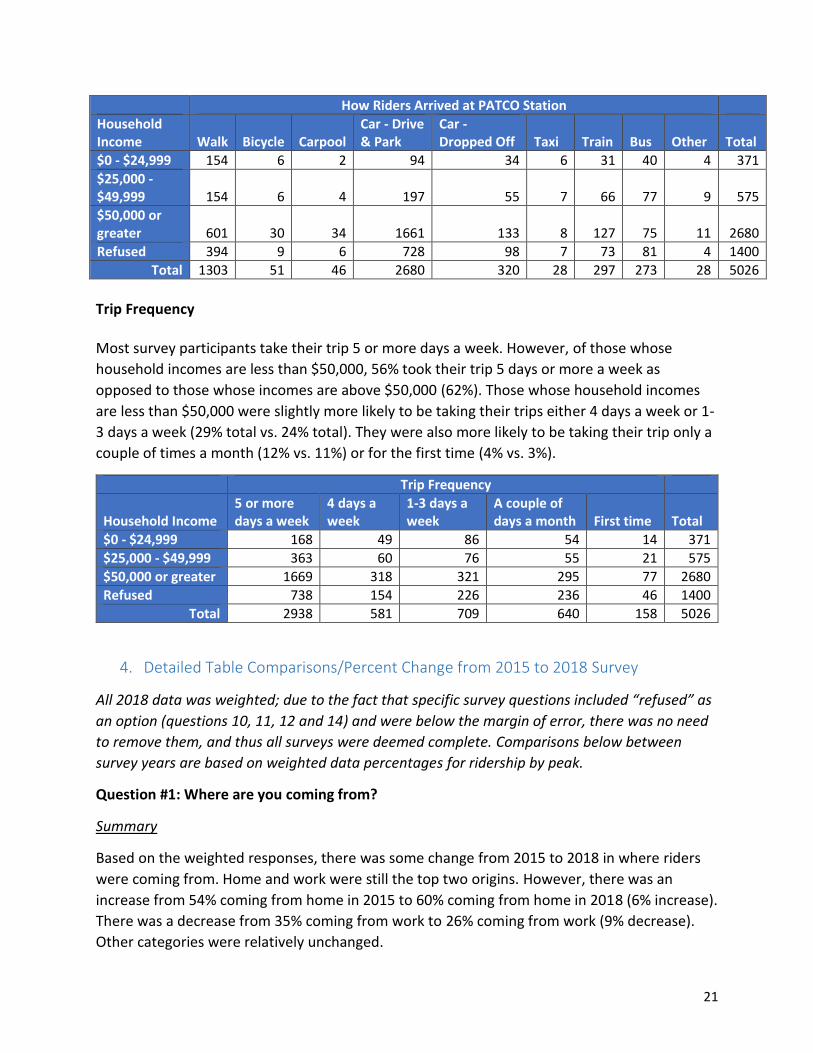
21
How Riders Arrived at PATCO Station
Household Income Walk Bicycle Carpool
Car - Drive & Park
Car - Dropped Off Taxi Train Bus Other Total
$0 - $24,999 154 6 2 94 34 6 31 40 4 371
$25,000 - $49,999 154 6 4 197 55 7 66 77 9 575
$50,000 or greater 601 30 34 1661 133 8 127 75 11 2680
Refused 394 9 6 728 98 7 73 81 4 1400
Total 1303 51 46 2680 320 28 297 273 28 5026
Trip Frequency Most survey participants take their trip 5 or more days a week. However, of those whose
household incomes are less than $50,000, 56% took their trip 5 days or more a week as
opposed to those whose incomes are above $50,000 (62%). Those whose household incomes
are less than $50,000 were slightly more likely to be taking their trips either 4 days a week or 1-
3 days a week (29% total vs. 24% total). They were also more likely to be taking their trip only a
couple of times a month (12% vs. 11%) or for the first time (4% vs. 3%).
Trip Frequency
Household Income 5 or more days a week
4 days a week
1-3 days a week
A couple of days a month First time Total
$0 - $24,999 168 49 86 54 14 371
$25,000 - $49,999 363 60 76 55 21 575
$50,000 or greater 1669 318 321 295 77 2680
Refused 738 154 226 236 46 1400
Total 2938 581 709 640 158 5026
4. Detailed Table Comparisons/Percent Change from 2015 to 2018 Survey
All 2018 data was weighted; due to the fact that specific survey questions included “refused” as
an option (questions 10, 11, 12 and 14) and were below the margin of error, there was no need
to remove them, and thus all surveys were deemed complete. Comparisons below between
survey years are based on weighted data percentages for ridership by peak.
Question #1: Where are you coming from?
Summary
Based on the weighted responses, there was some change from 2015 to 2018 in where riders
were coming from. Home and work were still the top two origins. However, there was an
increase from 54% coming from home in 2015 to 60% coming from home in 2018 (6% increase).
There was a decrease from 35% coming from work to 26% coming from work (9% decrease).
Other categories were relatively unchanged.
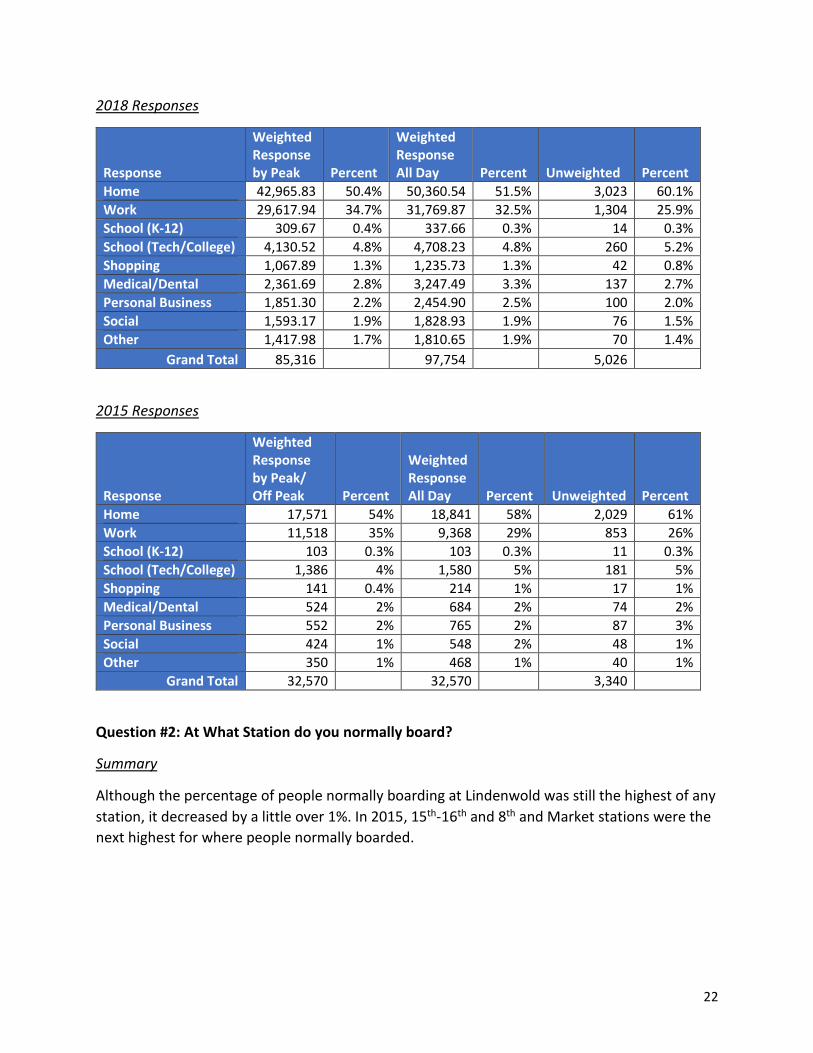
22
2018 Responses
Response
Weighted Response by Peak Percent
Weighted Response All Day Percent Unweighted Percent
Home 42,965.83 50.4% 50,360.54 51.5% 3,023 60.1% Work 29,617.94 34.7% 31,769.87 32.5% 1,304 25.9% School (K-12) 309.67 0.4% 337.66 0.3% 14 0.3% School (Tech/College) 4,130.52 4.8% 4,708.23 4.8% 260 5.2% Shopping 1,067.89 1.3% 1,235.73 1.3% 42 0.8% Medical/Dental 2,361.69 2.8% 3,247.49 3.3% 137 2.7% Personal Business 1,851.30 2.2% 2,454.90 2.5% 100 2.0% Social 1,593.17 1.9% 1,828.93 1.9% 76 1.5% Other 1,417.98 1.7% 1,810.65 1.9% 70 1.4%
Grand Total 85,316 97,754 5,026
2015 Responses
Response
Weighted Response by Peak/ Off Peak Percent
Weighted Response All Day Percent Unweighted Percent
Home 17,571 54% 18,841 58% 2,029 61%
Work 11,518 35% 9,368 29% 853 26%
School (K-12) 103 0.3% 103 0.3% 11 0.3%
School (Tech/College) 1,386 4% 1,580 5% 181 5%
Shopping 141 0.4% 214 1% 17 1%
Medical/Dental 524 2% 684 2% 74 2%
Personal Business 552 2% 765 2% 87 3%
Social 424 1% 548 2% 48 1%
Other 350 1% 468 1% 40 1%
Grand Total 32,570 32,570 3,340
Question #2: At What Station do you normally board?
Summary
Although the percentage of people normally boarding at Lindenwold was still the highest of any
station, it decreased by a little over 1%. In 2015, 15th-16th and 8th and Market stations were the
next highest for where people normally boarded.
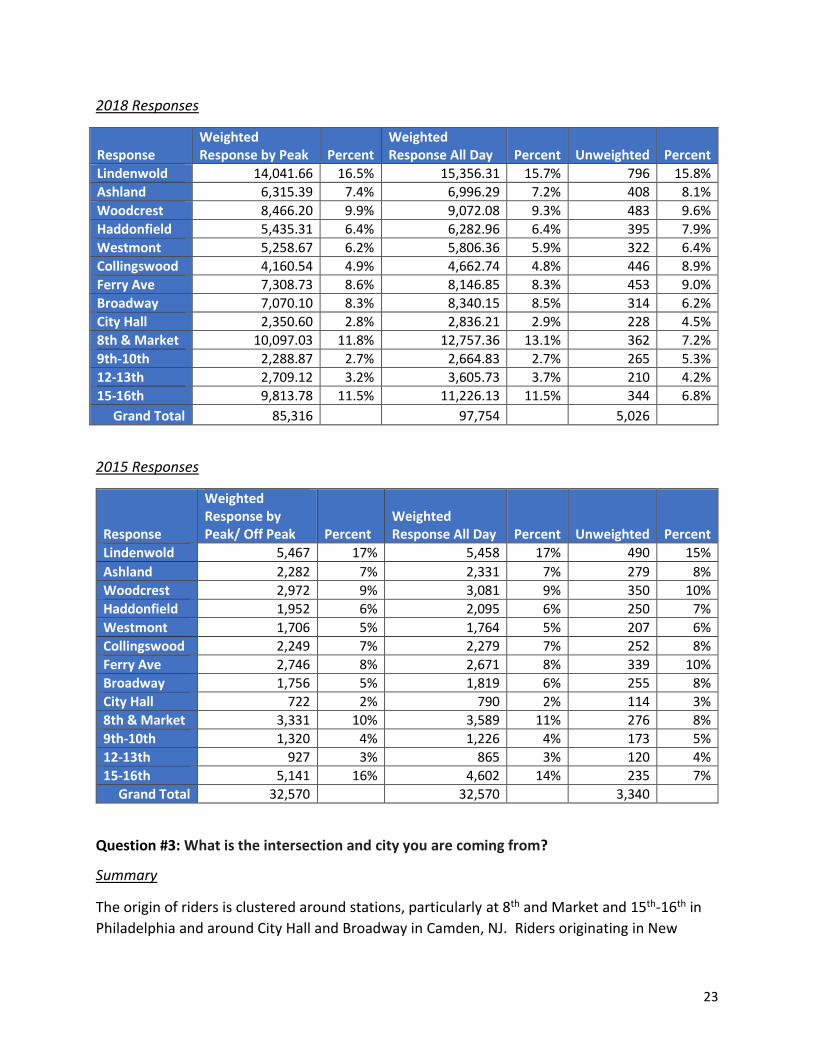
23
2018 Responses
Response Weighted Response by Peak Percent
Weighted Response All Day Percent Unweighted Percent
Lindenwold 14,041.66 16.5% 15,356.31 15.7% 796 15.8% Ashland 6,315.39 7.4% 6,996.29 7.2% 408 8.1% Woodcrest 8,466.20 9.9% 9,072.08 9.3% 483 9.6% Haddonfield 5,435.31 6.4% 6,282.96 6.4% 395 7.9% Westmont 5,258.67 6.2% 5,806.36 5.9% 322 6.4% Collingswood 4,160.54 4.9% 4,662.74 4.8% 446 8.9% Ferry Ave 7,308.73 8.6% 8,146.85 8.3% 453 9.0% Broadway 7,070.10 8.3% 8,340.15 8.5% 314 6.2% City Hall 2,350.60 2.8% 2,836.21 2.9% 228 4.5% 8th & Market 10,097.03 11.8% 12,757.36 13.1% 362 7.2% 9th-10th 2,288.87 2.7% 2,664.83 2.7% 265 5.3% 12-13th 2,709.12 3.2% 3,605.73 3.7% 210 4.2% 15-16th 9,813.78 11.5% 11,226.13 11.5% 344 6.8%
Grand Total 85,316 97,754 5,026
2015 Responses
Response
Weighted Response by Peak/ Off Peak Percent
Weighted Response All Day Percent Unweighted Percent
Lindenwold 5,467 17% 5,458 17% 490 15%
Ashland 2,282 7% 2,331 7% 279 8%
Woodcrest 2,972 9% 3,081 9% 350 10%
Haddonfield 1,952 6% 2,095 6% 250 7%
Westmont 1,706 5% 1,764 5% 207 6%
Collingswood 2,249 7% 2,279 7% 252 8%
Ferry Ave 2,746 8% 2,671 8% 339 10%
Broadway 1,756 5% 1,819 6% 255 8%
City Hall 722 2% 790 2% 114 3%
8th & Market 3,331 10% 3,589 11% 276 8%
9th-10th 1,320 4% 1,226 4% 173 5%
12-13th 927 3% 865 3% 120 4%
15-16th 5,141 16% 4,602 14% 235 7%
Grand Total 32,570 32,570 3,340
Question #3: What is the intersection and city you are coming from?
Summary
The origin of riders is clustered around stations, particularly at 8th and Market and 15th-16th in
Philadelphia and around City Hall and Broadway in Camden, NJ. Riders originating in New
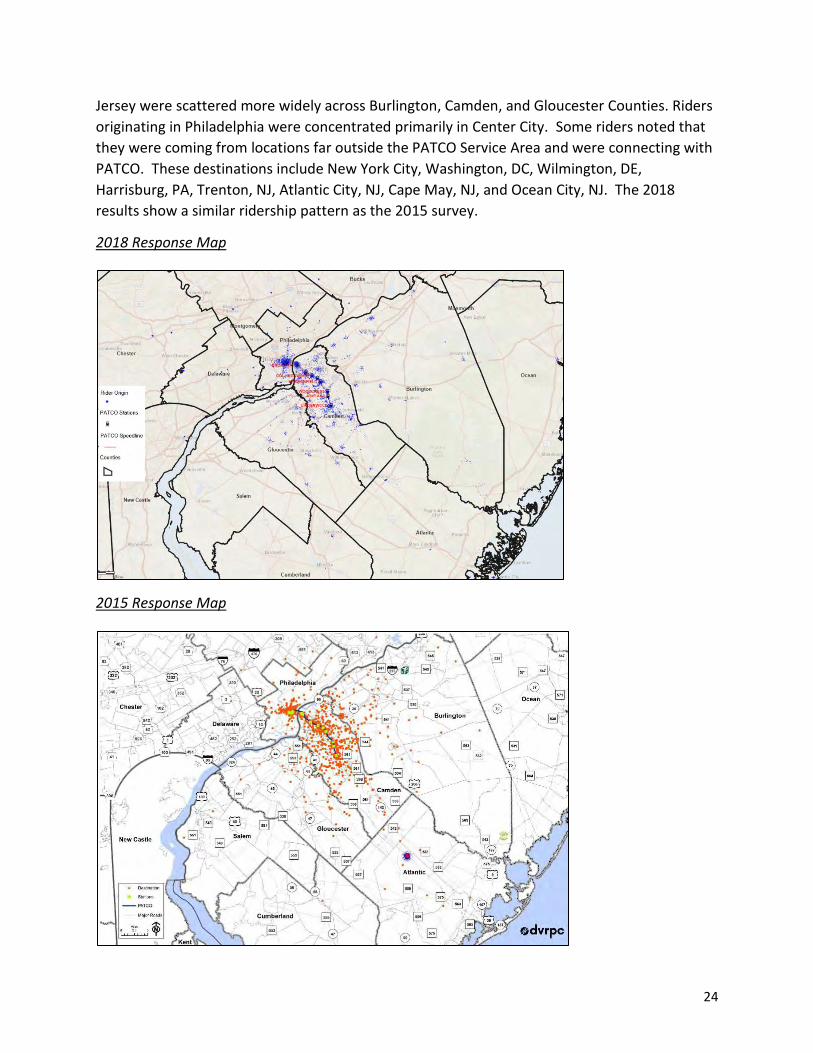
24
Jersey were scattered more widely across Burlington, Camden, and Gloucester Counties. Riders
originating in Philadelphia were concentrated primarily in Center City. Some riders noted that
they were coming from locations far outside the PATCO Service Area and were connecting with
PATCO. These destinations include New York City, Washington, DC, Wilmington, DE,
Harrisburg, PA, Trenton, NJ, Atlantic City, NJ, Cape May, NJ, and Ocean City, NJ. The 2018
results show a similar ridership pattern as the 2015 survey.
2018 Response Map
2015 Response Map
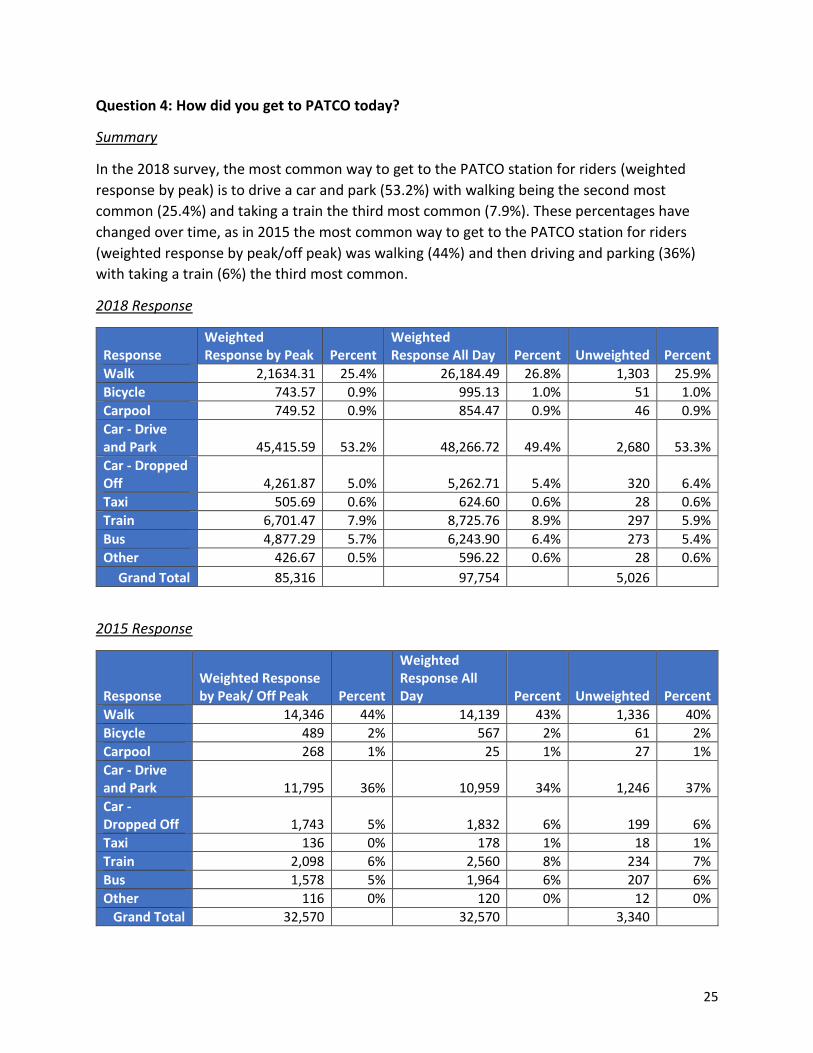
25
Question 4: How did you get to PATCO today?
Summary
In the 2018 survey, the most common way to get to the PATCO station for riders (weighted
response by peak) is to drive a car and park (53.2%) with walking being the second most
common (25.4%) and taking a train the third most common (7.9%). These percentages have
changed over time, as in 2015 the most common way to get to the PATCO station for riders
(weighted response by peak/off peak) was walking (44%) and then driving and parking (36%)
with taking a train (6%) the third most common.
2018 Response
Response Weighted Response by Peak Percent
Weighted Response All Day Percent Unweighted Percent
Walk 2,1634.31 25.4% 26,184.49 26.8% 1,303 25.9% Bicycle 743.57 0.9% 995.13 1.0% 51 1.0% Carpool 749.52 0.9% 854.47 0.9% 46 0.9% Car - Drive and Park 45,415.59 53.2% 48,266.72 49.4% 2,680 53.3% Car - Dropped Off 4,261.87 5.0% 5,262.71 5.4% 320 6.4% Taxi 505.69 0.6% 624.60 0.6% 28 0.6% Train 6,701.47 7.9% 8,725.76 8.9% 297 5.9% Bus 4,877.29 5.7% 6,243.90 6.4% 273 5.4% Other 426.67 0.5% 596.22 0.6% 28 0.6%
Grand Total 85,316 97,754 5,026
2015 Response
Response Weighted Response by Peak/ Off Peak Percent
Weighted Response All Day Percent Unweighted Percent
Walk 14,346 44% 14,139 43% 1,336 40%
Bicycle 489 2% 567 2% 61 2%
Carpool 268 1% 25 1% 27 1%
Car - Drive and Park 11,795 36% 10,959 34% 1,246 37%
Car - Dropped Off 1,743 5% 1,832 6% 199 6%
Taxi 136 0% 178 1% 18 1%
Train 2,098 6% 2,560 8% 234 7%
Bus 1,578 5% 1,964 6% 207 6%
Other 116 0% 120 0% 12 0%
Grand Total 32,570 32,570 3,340
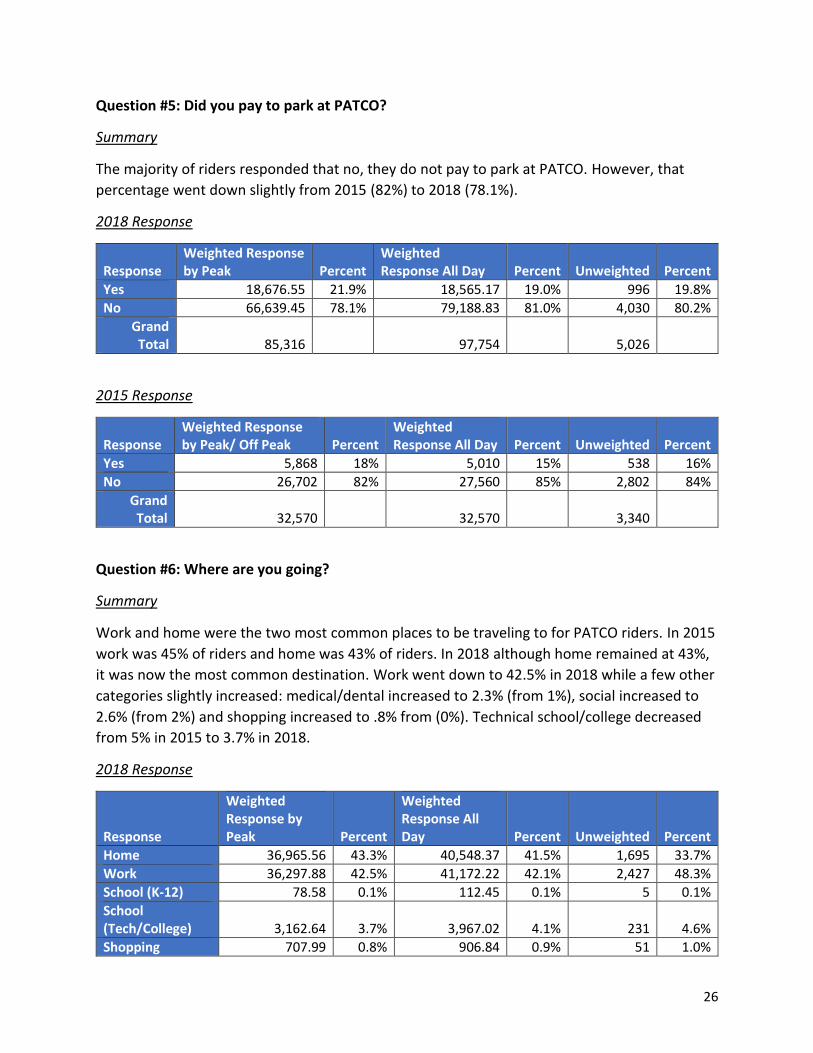
26
Question #5: Did you pay to park at PATCO?
Summary
The majority of riders responded that no, they do not pay to park at PATCO. However, that
percentage went down slightly from 2015 (82%) to 2018 (78.1%).
2018 Response
Response Weighted Response by Peak Percent
Weighted Response All Day Percent Unweighted Percent
Yes 18,676.55 21.9% 18,565.17 19.0% 996 19.8% No 66,639.45 78.1% 79,188.83 81.0% 4,030 80.2%
Grand Total 85,316 97,754 5,026
2015 Response
Response Weighted Response by Peak/ Off Peak Percent
Weighted Response All Day Percent Unweighted Percent
Yes 5,868 18% 5,010 15% 538 16%
No 26,702 82% 27,560 85% 2,802 84%
Grand Total 32,570 32,570 3,340
Question #6: Where are you going?
Summary
Work and home were the two most common places to be traveling to for PATCO riders. In 2015
work was 45% of riders and home was 43% of riders. In 2018 although home remained at 43%,
it was now the most common destination. Work went down to 42.5% in 2018 while a few other
categories slightly increased: medical/dental increased to 2.3% (from 1%), social increased to
2.6% (from 2%) and shopping increased to .8% from (0%). Technical school/college decreased
from 5% in 2015 to 3.7% in 2018.
2018 Response
Response
Weighted Response by Peak Percent
Weighted Response All Day Percent Unweighted Percent
Home 36,965.56 43.3% 40,548.37 41.5% 1,695 33.7% Work 36,297.88 42.5% 41,172.22 42.1% 2,427 48.3% School (K-12) 78.58 0.1% 112.45 0.1% 5 0.1% School (Tech/College) 3,162.64 3.7% 3,967.02 4.1% 231 4.6% Shopping 707.99 0.8% 906.84 0.9% 51 1.0%
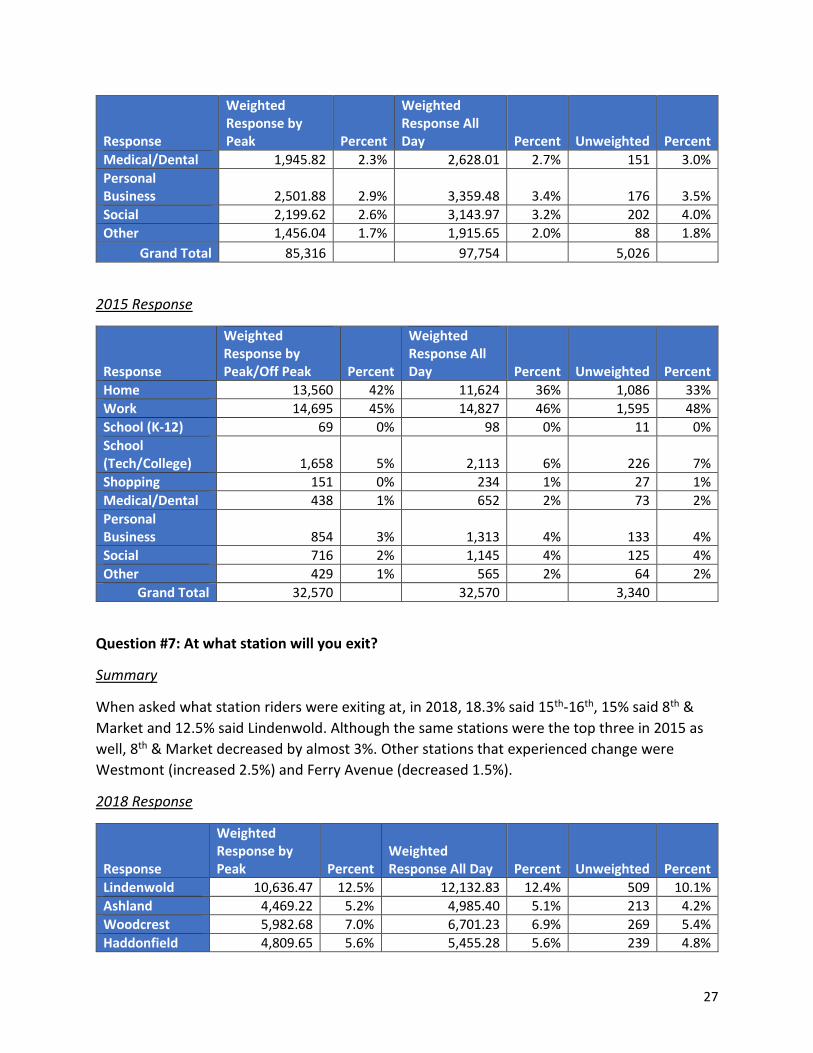
27
Response
Weighted Response by Peak Percent
Weighted Response All Day Percent Unweighted Percent
Medical/Dental 1,945.82 2.3% 2,628.01 2.7% 151 3.0% Personal Business 2,501.88 2.9% 3,359.48 3.4% 176 3.5% Social 2,199.62 2.6% 3,143.97 3.2% 202 4.0% Other 1,456.04 1.7% 1,915.65 2.0% 88 1.8%
Grand Total 85,316 97,754 5,026
2015 Response
Response
Weighted Response by Peak/Off Peak Percent
Weighted Response All Day Percent Unweighted Percent
Home 13,560 42% 11,624 36% 1,086 33%
Work 14,695 45% 14,827 46% 1,595 48%
School (K-12) 69 0% 98 0% 11 0%
School (Tech/College) 1,658 5% 2,113 6% 226 7%
Shopping 151 0% 234 1% 27 1%
Medical/Dental 438 1% 652 2% 73 2%
Personal Business 854 3% 1,313 4% 133 4%
Social 716 2% 1,145 4% 125 4%
Other 429 1% 565 2% 64 2%
Grand Total 32,570 32,570 3,340
Question #7: At what station will you exit?
Summary
When asked what station riders were exiting at, in 2018, 18.3% said 15th-16th, 15% said 8th &
Market and 12.5% said Lindenwold. Although the same stations were the top three in 2015 as
well, 8th & Market decreased by almost 3%. Other stations that experienced change were
Westmont (increased 2.5%) and Ferry Avenue (decreased 1.5%).
2018 Response
Response
Weighted Response by Peak Percent
Weighted Response All Day Percent Unweighted Percent
Lindenwold 10,636.47 12.5% 12,132.83 12.4% 509 10.1% Ashland 4,469.22 5.2% 4,985.40 5.1% 213 4.2% Woodcrest 5,982.68 7.0% 6,701.23 6.9% 269 5.4% Haddonfield 4,809.65 5.6% 5,455.28 5.6% 239 4.8%
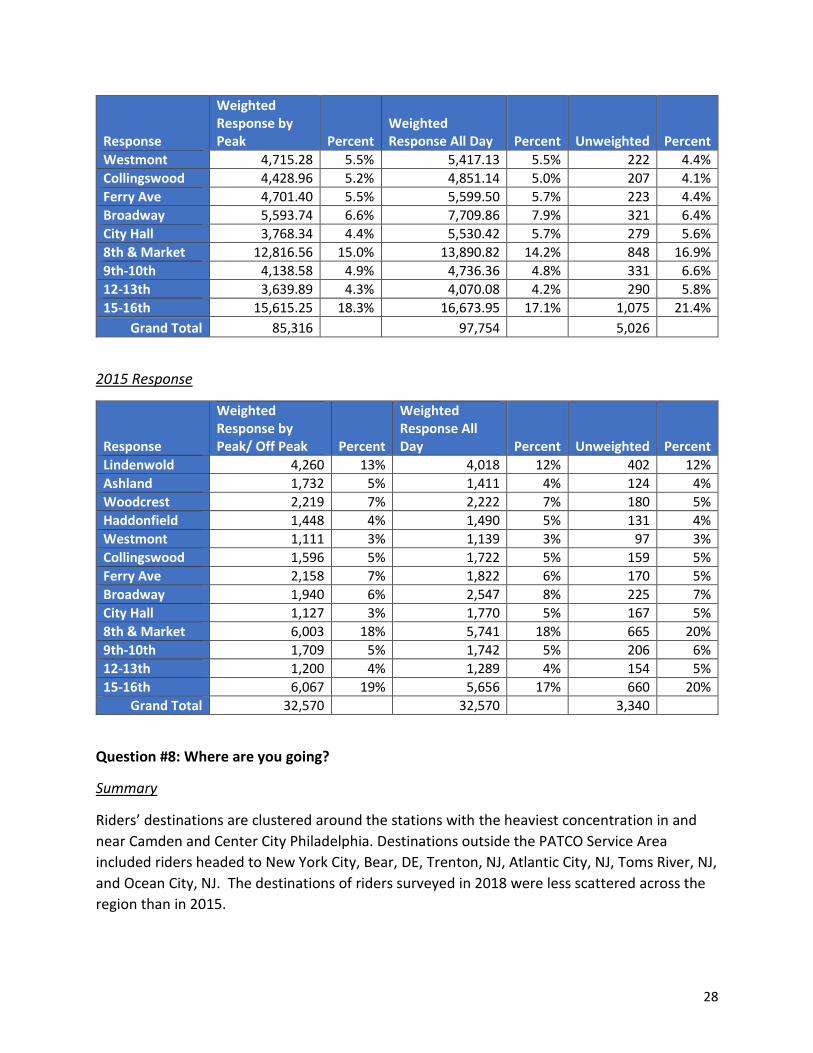
28
Response
Weighted Response by Peak Percent
Weighted Response All Day Percent Unweighted Percent
Westmont 4,715.28 5.5% 5,417.13 5.5% 222 4.4% Collingswood 4,428.96 5.2% 4,851.14 5.0% 207 4.1% Ferry Ave 4,701.40 5.5% 5,599.50 5.7% 223 4.4% Broadway 5,593.74 6.6% 7,709.86 7.9% 321 6.4% City Hall 3,768.34 4.4% 5,530.42 5.7% 279 5.6% 8th & Market 12,816.56 15.0% 13,890.82 14.2% 848 16.9% 9th-10th 4,138.58 4.9% 4,736.36 4.8% 331 6.6% 12-13th 3,639.89 4.3% 4,070.08 4.2% 290 5.8% 15-16th 15,615.25 18.3% 16,673.95 17.1% 1,075 21.4%
Grand Total 85,316 97,754 5,026
2015 Response
Response
Weighted Response by Peak/ Off Peak Percent
Weighted Response All Day Percent Unweighted Percent
Lindenwold 4,260 13% 4,018 12% 402 12%
Ashland 1,732 5% 1,411 4% 124 4%
Woodcrest 2,219 7% 2,222 7% 180 5%
Haddonfield 1,448 4% 1,490 5% 131 4%
Westmont 1,111 3% 1,139 3% 97 3%
Collingswood 1,596 5% 1,722 5% 159 5%
Ferry Ave 2,158 7% 1,822 6% 170 5%
Broadway 1,940 6% 2,547 8% 225 7%
City Hall 1,127 3% 1,770 5% 167 5%
8th & Market 6,003 18% 5,741 18% 665 20%
9th-10th 1,709 5% 1,742 5% 206 6%
12-13th 1,200 4% 1,289 4% 154 5%
15-16th 6,067 19% 5,656 17% 660 20%
Grand Total 32,570 32,570 3,340
Question #8: Where are you going?
Summary
Riders’ destinations are clustered around the stations with the heaviest concentration in and
near Camden and Center City Philadelphia. Destinations outside the PATCO Service Area
included riders headed to New York City, Bear, DE, Trenton, NJ, Atlantic City, NJ, Toms River, NJ,
and Ocean City, NJ. The destinations of riders surveyed in 2018 were less scattered across the
region than in 2015.
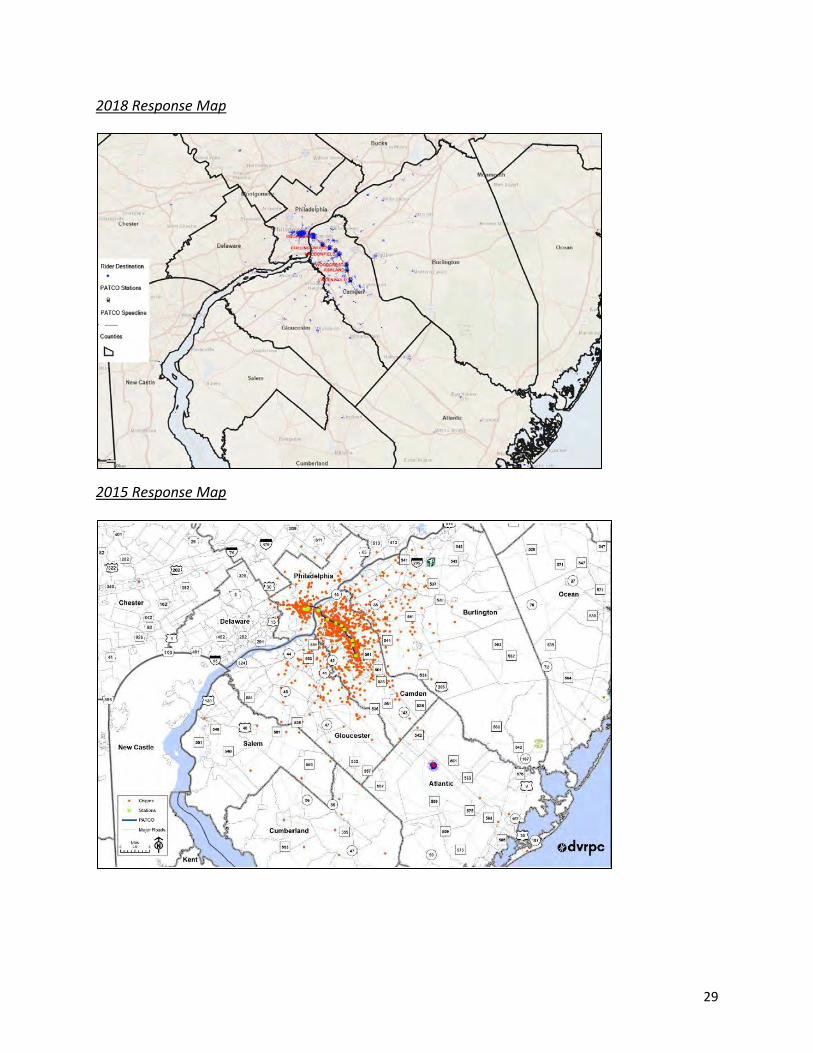
29
2018 Response Map
2015 Response Map
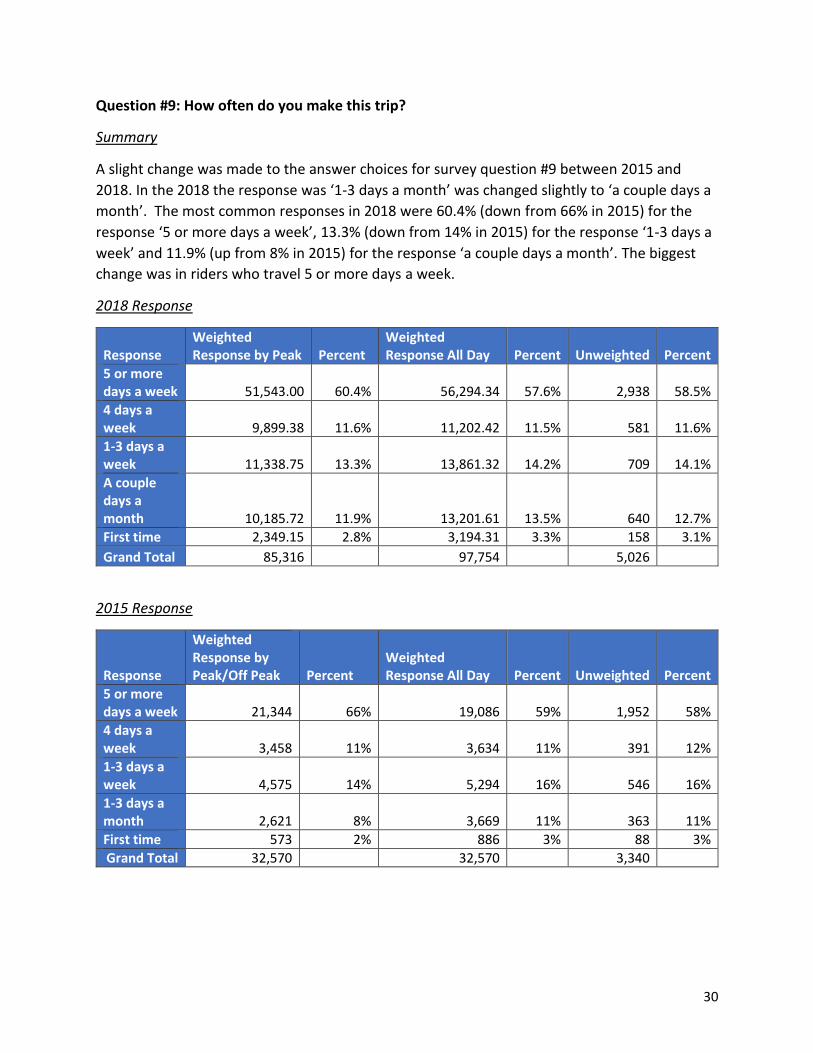
30
Question #9: How often do you make this trip?
Summary
A slight change was made to the answer choices for survey question #9 between 2015 and
2018. In the 2018 the response was ‘1-3 days a month’ was changed slightly to ‘a couple days a
month’. The most common responses in 2018 were 60.4% (down from 66% in 2015) for the
response ‘5 or more days a week’, 13.3% (down from 14% in 2015) for the response ‘1-3 days a
week’ and 11.9% (up from 8% in 2015) for the response ‘a couple days a month’. The biggest
change was in riders who travel 5 or more days a week.
2018 Response
Response Weighted Response by Peak Percent
Weighted Response All Day Percent Unweighted Percent
5 or more days a week 51,543.00 60.4% 56,294.34 57.6% 2,938 58.5% 4 days a week 9,899.38 11.6% 11,202.42 11.5% 581 11.6% 1-3 days a week 11,338.75 13.3% 13,861.32 14.2% 709 14.1% A couple days a month 10,185.72 11.9% 13,201.61 13.5% 640 12.7% First time 2,349.15 2.8% 3,194.31 3.3% 158 3.1%
Grand Total 85,316 97,754 5,026
2015 Response
Response
Weighted Response by Peak/Off Peak Percent
Weighted Response All Day Percent Unweighted Percent
5 or more days a week 21,344 66% 19,086 59% 1,952 58%
4 days a week 3,458 11% 3,634 11% 391 12%
1-3 days a week 4,575 14% 5,294 16% 546 16%
1-3 days a month 2,621 8% 3,669 11% 363 11%
First time 573 2% 886 3% 88 3%
Grand Total 32,570 32,570 3,340
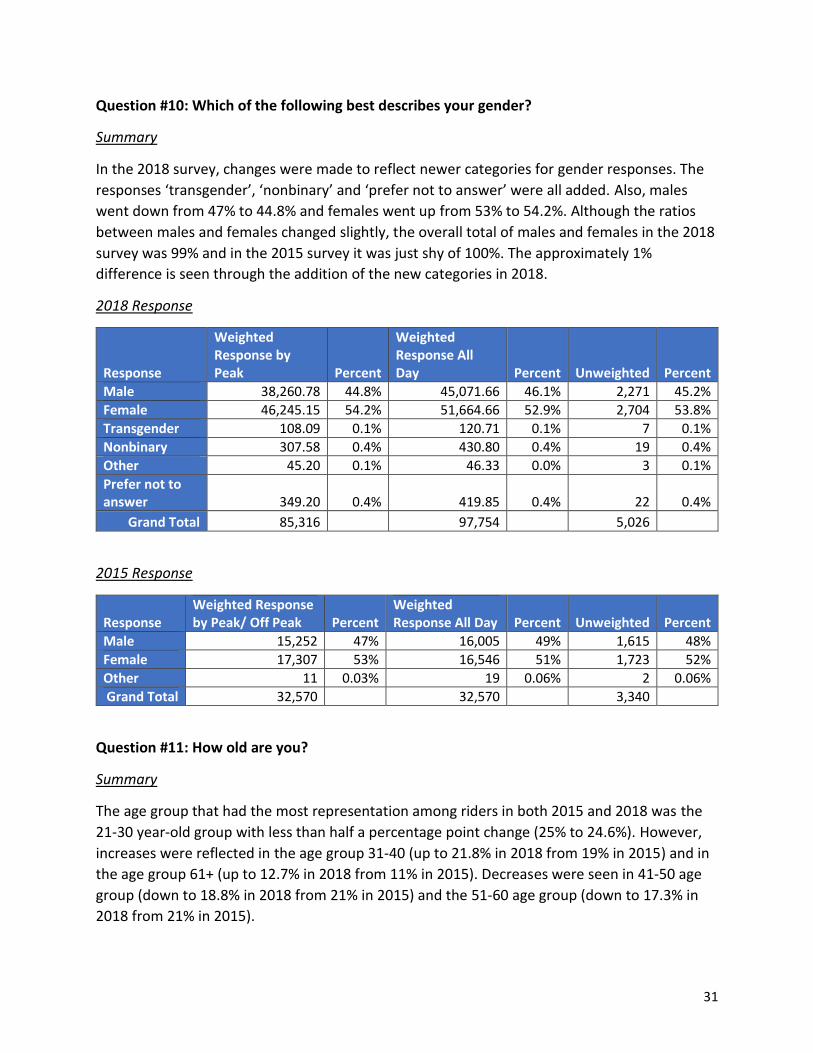
31
Question #10: Which of the following best describes your gender?
Summary
In the 2018 survey, changes were made to reflect newer categories for gender responses. The
responses ‘transgender’, ‘nonbinary’ and ‘prefer not to answer’ were all added. Also, males
went down from 47% to 44.8% and females went up from 53% to 54.2%. Although the ratios
between males and females changed slightly, the overall total of males and females in the 2018
survey was 99% and in the 2015 survey it was just shy of 100%. The approximately 1%
difference is seen through the addition of the new categories in 2018.
2018 Response
Response
Weighted Response by Peak Percent
Weighted Response All Day Percent Unweighted Percent
Male 38,260.78 44.8% 45,071.66 46.1% 2,271 45.2% Female 46,245.15 54.2% 51,664.66 52.9% 2,704 53.8% Transgender 108.09 0.1% 120.71 0.1% 7 0.1% Nonbinary 307.58 0.4% 430.80 0.4% 19 0.4% Other 45.20 0.1% 46.33 0.0% 3 0.1% Prefer not to answer 349.20 0.4% 419.85 0.4% 22 0.4%
Grand Total 85,316 97,754 5,026
2015 Response
Response Weighted Response by Peak/ Off Peak Percent
Weighted Response All Day Percent Unweighted Percent
Male 15,252 47% 16,005 49% 1,615 48%
Female 17,307 53% 16,546 51% 1,723 52%
Other 11 0.03% 19 0.06% 2 0.06%
Grand Total 32,570 32,570 3,340
Question #11: How old are you?
Summary
The age group that had the most representation among riders in both 2015 and 2018 was the
21-30 year-old group with less than half a percentage point change (25% to 24.6%). However,
increases were reflected in the age group 31-40 (up to 21.8% in 2018 from 19% in 2015) and in
the age group 61+ (up to 12.7% in 2018 from 11% in 2015). Decreases were seen in 41-50 age
group (down to 18.8% in 2018 from 21% in 2015) and the 51-60 age group (down to 17.3% in
2018 from 21% in 2015).
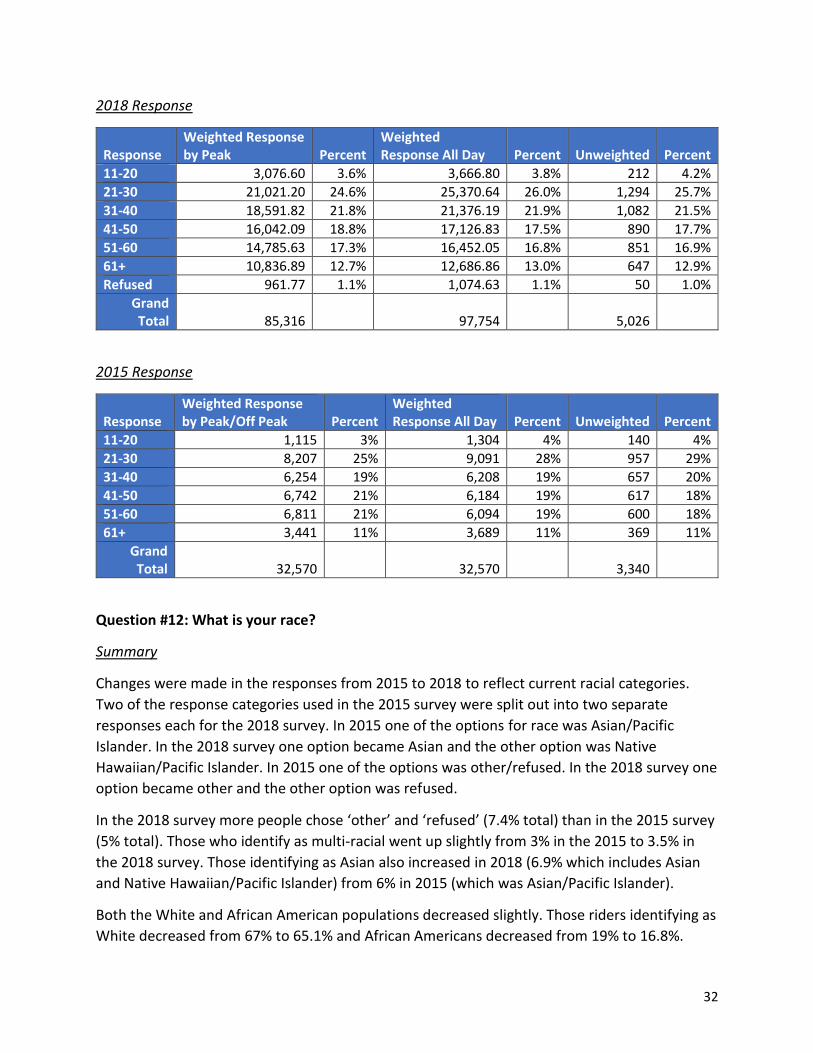
32
2018 Response
Response Weighted Response by Peak Percent
Weighted Response All Day Percent Unweighted Percent
11-20 3,076.60 3.6% 3,666.80 3.8% 212 4.2% 21-30 21,021.20 24.6% 25,370.64 26.0% 1,294 25.7% 31-40 18,591.82 21.8% 21,376.19 21.9% 1,082 21.5% 41-50 16,042.09 18.8% 17,126.83 17.5% 890 17.7% 51-60 14,785.63 17.3% 16,452.05 16.8% 851 16.9% 61+ 10,836.89 12.7% 12,686.86 13.0% 647 12.9% Refused 961.77 1.1% 1,074.63 1.1% 50 1.0%
Grand Total 85,316 97,754 5,026
2015 Response
Response Weighted Response by Peak/Off Peak Percent
Weighted Response All Day Percent Unweighted Percent
11-20 1,115 3% 1,304 4% 140 4%
21-30 8,207 25% 9,091 28% 957 29%
31-40 6,254 19% 6,208 19% 657 20%
41-50 6,742 21% 6,184 19% 617 18%
51-60 6,811 21% 6,094 19% 600 18%
61+ 3,441 11% 3,689 11% 369 11%
Grand Total 32,570 32,570 3,340
Question #12: What is your race?
Summary
Changes were made in the responses from 2015 to 2018 to reflect current racial categories.
Two of the response categories used in the 2015 survey were split out into two separate
responses each for the 2018 survey. In 2015 one of the options for race was Asian/Pacific
Islander. In the 2018 survey one option became Asian and the other option was Native
Hawaiian/Pacific Islander. In 2015 one of the options was other/refused. In the 2018 survey one
option became other and the other option was refused.
In the 2018 survey more people chose ‘other’ and ‘refused’ (7.4% total) than in the 2015 survey
(5% total). Those who identify as multi-racial went up slightly from 3% in the 2015 to 3.5% in
the 2018 survey. Those identifying as Asian also increased in 2018 (6.9% which includes Asian
and Native Hawaiian/Pacific Islander) from 6% in 2015 (which was Asian/Pacific Islander).
Both the White and African American populations decreased slightly. Those riders identifying as
White decreased from 67% to 65.1% and African Americans decreased from 19% to 16.8%.
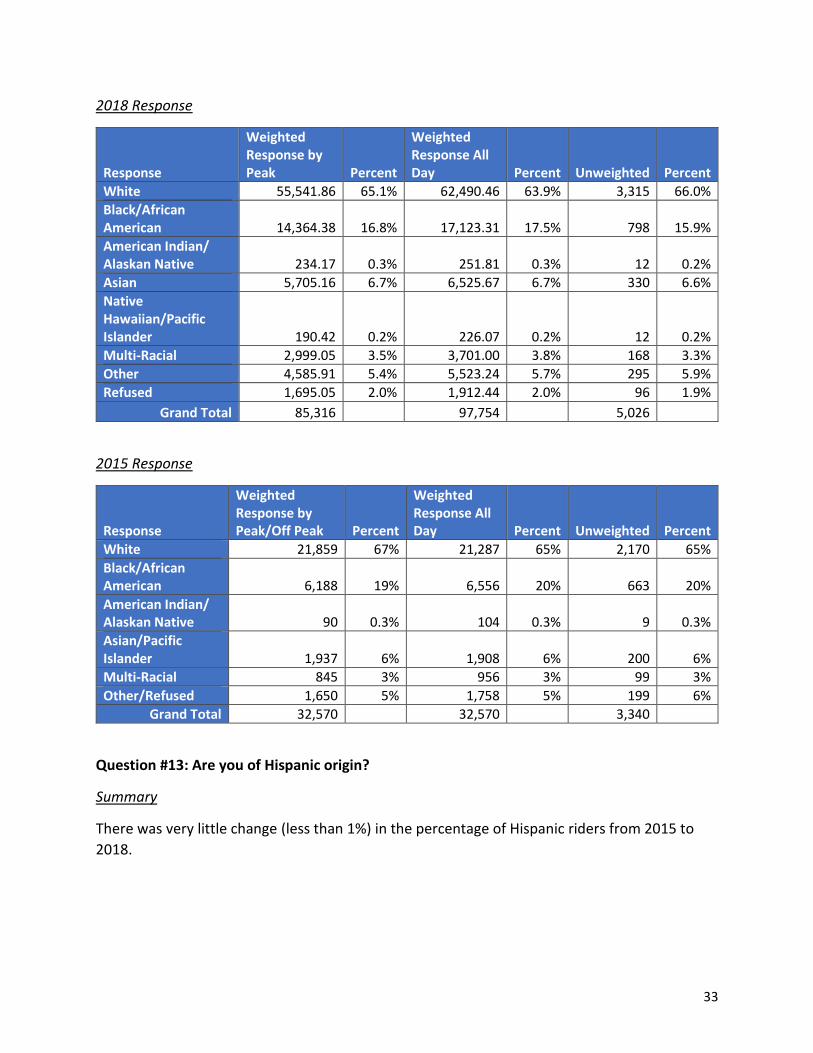
33
2018 Response
Response
Weighted Response by Peak Percent
Weighted Response All Day Percent Unweighted Percent
White 55,541.86 65.1% 62,490.46 63.9% 3,315 66.0% Black/African American 14,364.38 16.8% 17,123.31 17.5% 798 15.9% American Indian/ Alaskan Native 234.17 0.3% 251.81 0.3% 12 0.2% Asian 5,705.16 6.7% 6,525.67 6.7% 330 6.6% Native Hawaiian/Pacific Islander 190.42 0.2% 226.07 0.2% 12 0.2% Multi-Racial 2,999.05 3.5% 3,701.00 3.8% 168 3.3% Other 4,585.91 5.4% 5,523.24 5.7% 295 5.9% Refused 1,695.05 2.0% 1,912.44 2.0% 96 1.9%
Grand Total 85,316 97,754 5,026
2015 Response
Response
Weighted Response by Peak/Off Peak Percent
Weighted Response All Day Percent Unweighted Percent
White 21,859 67% 21,287 65% 2,170 65%
Black/African American 6,188 19% 6,556 20% 663 20%
American Indian/ Alaskan Native 90 0.3% 104 0.3% 9 0.3%
Asian/Pacific Islander 1,937 6% 1,908 6% 200 6%
Multi-Racial 845 3% 956 3% 99 3%
Other/Refused 1,650 5% 1,758 5% 199 6%
Grand Total 32,570 32,570 3,340
Question #13: Are you of Hispanic origin?
Summary
There was very little change (less than 1%) in the percentage of Hispanic riders from 2015 to
2018.
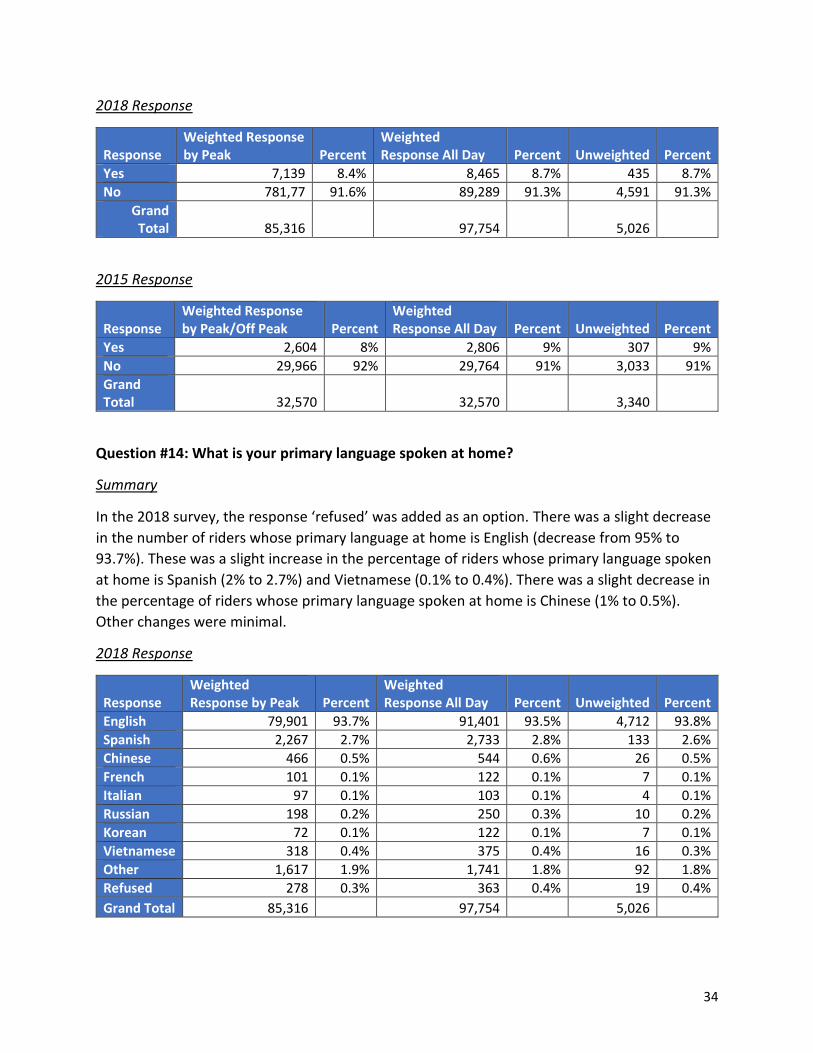
34
2018 Response
Response Weighted Response by Peak Percent
Weighted Response All Day Percent Unweighted Percent
Yes 7,139 8.4% 8,465 8.7% 435 8.7% No 781,77 91.6% 89,289 91.3% 4,591 91.3%
Grand Total 85,316 97,754 5,026
2015 Response
Response Weighted Response by Peak/Off Peak Percent
Weighted Response All Day Percent Unweighted Percent
Yes 2,604 8% 2,806 9% 307 9%
No 29,966 92% 29,764 91% 3,033 91%
Grand Total 32,570 32,570 3,340
Question #14: What is your primary language spoken at home?
Summary
In the 2018 survey, the response ‘refused’ was added as an option. There was a slight decrease
in the number of riders whose primary language at home is English (decrease from 95% to
93.7%). These was a slight increase in the percentage of riders whose primary language spoken
at home is Spanish (2% to 2.7%) and Vietnamese (0.1% to 0.4%). There was a slight decrease in
the percentage of riders whose primary language spoken at home is Chinese (1% to 0.5%).
Other changes were minimal.
2018 Response
Response Weighted Response by Peak Percent
Weighted Response All Day Percent Unweighted Percent
English 79,901 93.7% 91,401 93.5% 4,712 93.8% Spanish 2,267 2.7% 2,733 2.8% 133 2.6% Chinese 466 0.5% 544 0.6% 26 0.5% French 101 0.1% 122 0.1% 7 0.1% Italian 97 0.1% 103 0.1% 4 0.1% Russian 198 0.2% 250 0.3% 10 0.2% Korean 72 0.1% 122 0.1% 7 0.1% Vietnamese 318 0.4% 375 0.4% 16 0.3% Other 1,617 1.9% 1,741 1.8% 92 1.8% Refused 278 0.3% 363 0.4% 19 0.4%
Grand Total 85,316 97,754 5,026
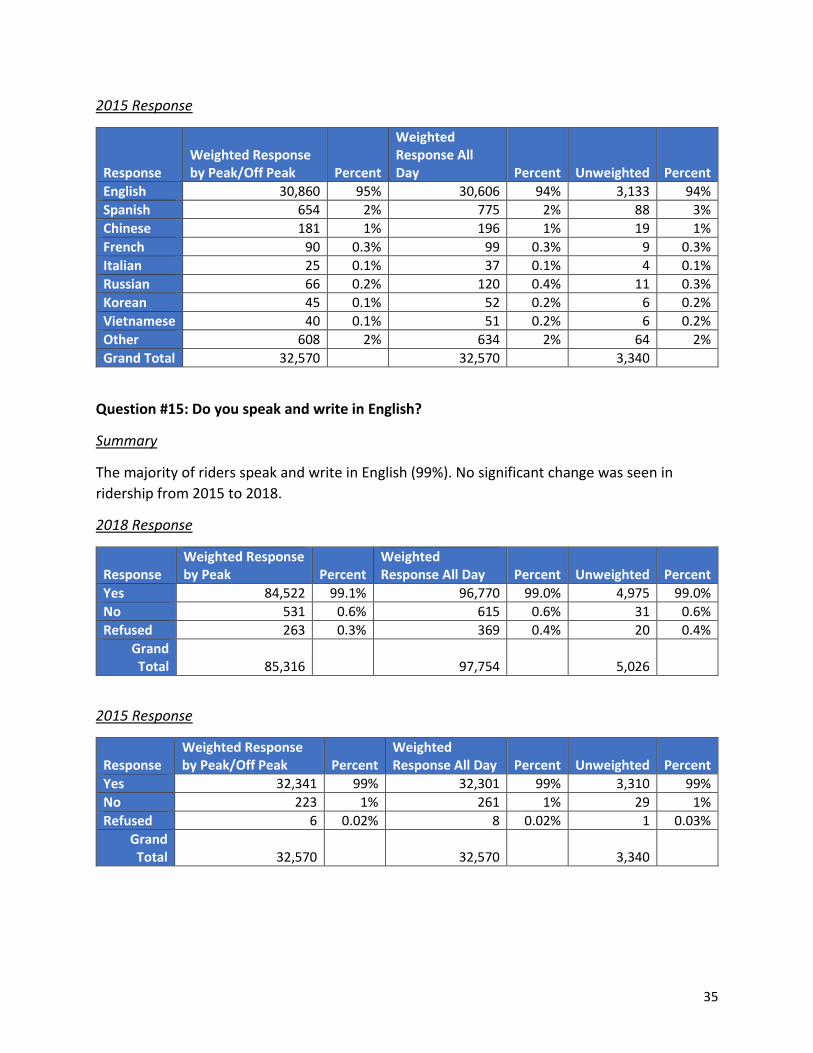
35
2015 Response
Response Weighted Response by Peak/Off Peak Percent
Weighted Response All Day Percent Unweighted Percent
English 30,860 95% 30,606 94% 3,133 94%
Spanish 654 2% 775 2% 88 3%
Chinese 181 1% 196 1% 19 1%
French 90 0.3% 99 0.3% 9 0.3%
Italian 25 0.1% 37 0.1% 4 0.1%
Russian 66 0.2% 120 0.4% 11 0.3%
Korean 45 0.1% 52 0.2% 6 0.2%
Vietnamese 40 0.1% 51 0.2% 6 0.2%
Other 608 2% 634 2% 64 2%
Grand Total 32,570 32,570 3,340
Question #15: Do you speak and write in English?
Summary
The majority of riders speak and write in English (99%). No significant change was seen in
ridership from 2015 to 2018.
2018 Response
Response Weighted Response by Peak Percent
Weighted Response All Day Percent Unweighted Percent
Yes 84,522 99.1% 96,770 99.0% 4,975 99.0%
No 531 0.6% 615 0.6% 31 0.6%
Refused 263 0.3% 369 0.4% 20 0.4%
Grand Total 85,316 97,754 5,026
2015 Response
Response Weighted Response by Peak/Off Peak Percent
Weighted Response All Day Percent Unweighted Percent
Yes 32,341 99% 32,301 99% 3,310 99%
No 223 1% 261 1% 29 1%
Refused 6 0.02% 8 0.02% 1 0.03%
Grand Total 32,570 32,570 3,340
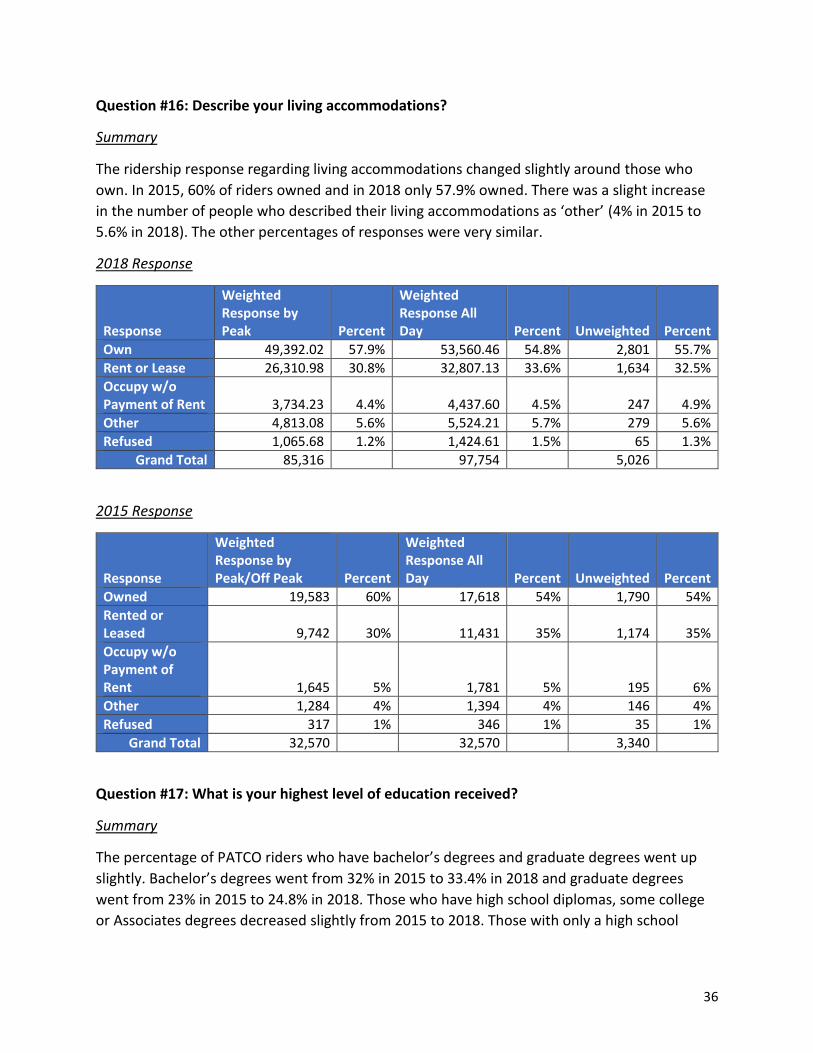
36
Question #16: Describe your living accommodations?
Summary
The ridership response regarding living accommodations changed slightly around those who
own. In 2015, 60% of riders owned and in 2018 only 57.9% owned. There was a slight increase
in the number of people who described their living accommodations as ‘other’ (4% in 2015 to
5.6% in 2018). The other percentages of responses were very similar.
2018 Response
Response
Weighted Response by Peak Percent
Weighted Response All Day Percent Unweighted Percent
Own 49,392.02 57.9% 53,560.46 54.8% 2,801 55.7%
Rent or Lease 26,310.98 30.8% 32,807.13 33.6% 1,634 32.5%
Occupy w/o Payment of Rent 3,734.23 4.4% 4,437.60 4.5% 247 4.9%
Other 4,813.08 5.6% 5,524.21 5.7% 279 5.6%
Refused 1,065.68 1.2% 1,424.61 1.5% 65 1.3%
Grand Total 85,316 97,754 5,026
2015 Response
Response
Weighted Response by Peak/Off Peak Percent
Weighted Response All Day Percent Unweighted Percent
Owned 19,583 60% 17,618 54% 1,790 54%
Rented or Leased 9,742 30% 11,431 35% 1,174 35%
Occupy w/o Payment of Rent 1,645 5% 1,781 5% 195 6%
Other 1,284 4% 1,394 4% 146 4%
Refused 317 1% 346 1% 35 1%
Grand Total 32,570 32,570 3,340
Question #17: What is your highest level of education received?
Summary
The percentage of PATCO riders who have bachelor’s degrees and graduate degrees went up
slightly. Bachelor’s degrees went from 32% in 2015 to 33.4% in 2018 and graduate degrees
went from 23% in 2015 to 24.8% in 2018. Those who have high school diplomas, some college
or Associates degrees decreased slightly from 2015 to 2018. Those with only a high school
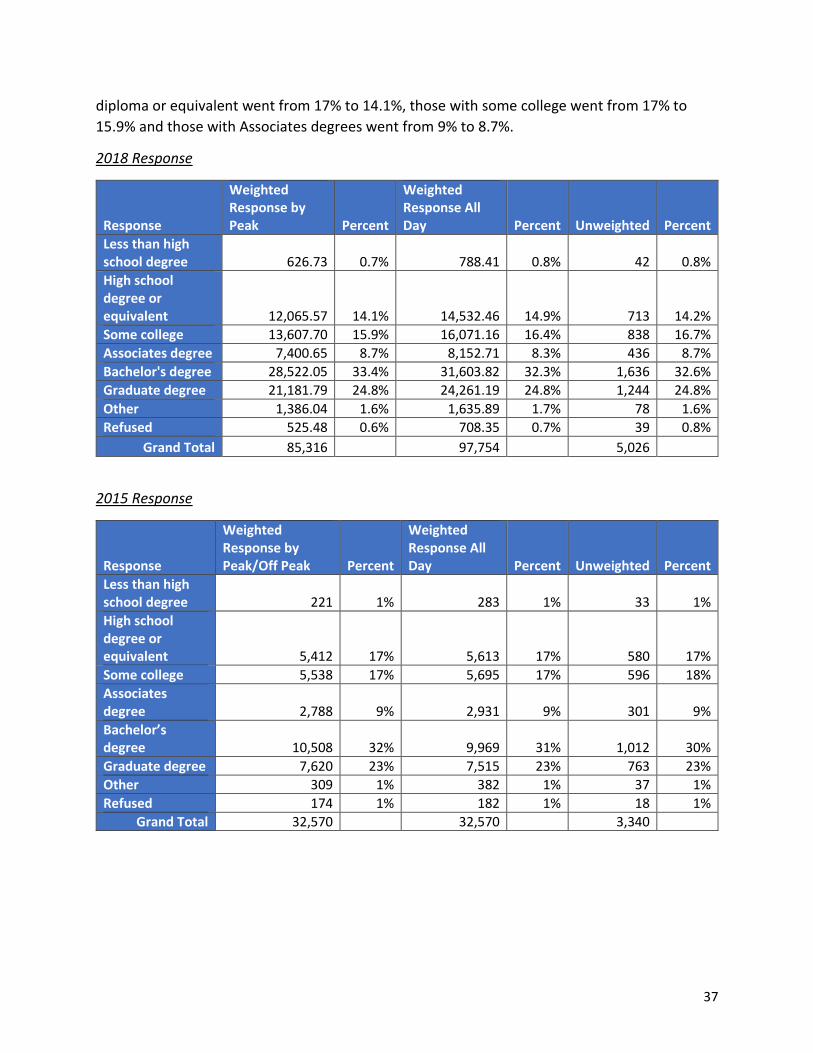
37
diploma or equivalent went from 17% to 14.1%, those with some college went from 17% to
15.9% and those with Associates degrees went from 9% to 8.7%.
2018 Response
Response
Weighted Response by Peak Percent
Weighted Response All Day Percent Unweighted Percent
Less than high school degree 626.73 0.7% 788.41 0.8% 42 0.8% High school degree or equivalent 12,065.57 14.1% 14,532.46 14.9% 713 14.2% Some college 13,607.70 15.9% 16,071.16 16.4% 838 16.7% Associates degree 7,400.65 8.7% 8,152.71 8.3% 436 8.7% Bachelor's degree 28,522.05 33.4% 31,603.82 32.3% 1,636 32.6% Graduate degree 21,181.79 24.8% 24,261.19 24.8% 1,244 24.8% Other 1,386.04 1.6% 1,635.89 1.7% 78 1.6% Refused 525.48 0.6% 708.35 0.7% 39 0.8%
Grand Total 85,316 97,754 5,026
2015 Response
Response
Weighted Response by Peak/Off Peak Percent
Weighted Response All Day Percent Unweighted Percent
Less than high school degree 221 1% 283 1% 33 1%
High school degree or equivalent 5,412 17% 5,613 17% 580 17%
Some college 5,538 17% 5,695 17% 596 18%
Associates degree 2,788 9% 2,931 9% 301 9%
Bachelor’s degree 10,508 32% 9,969 31% 1,012 30%
Graduate degree 7,620 23% 7,515 23% 763 23%
Other 309 1% 382 1% 37 1%
Refused 174 1% 182 1% 18 1%
Grand Total 32,570 32,570 3,340
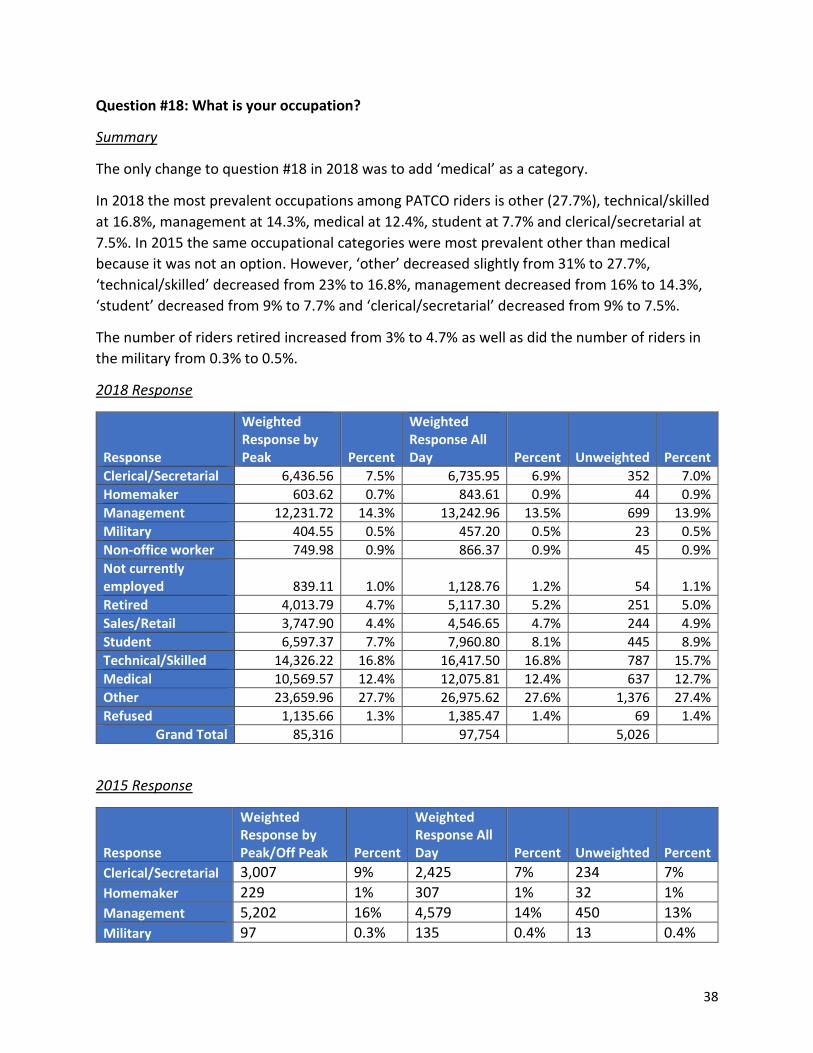
38
Question #18: What is your occupation?
Summary
The only change to question #18 in 2018 was to add ‘medical’ as a category.
In 2018 the most prevalent occupations among PATCO riders is other (27.7%), technical/skilled
at 16.8%, management at 14.3%, medical at 12.4%, student at 7.7% and clerical/secretarial at
7.5%. In 2015 the same occupational categories were most prevalent other than medical
because it was not an option. However, ‘other’ decreased slightly from 31% to 27.7%,
‘technical/skilled’ decreased from 23% to 16.8%, management decreased from 16% to 14.3%,
‘student’ decreased from 9% to 7.7% and ‘clerical/secretarial’ decreased from 9% to 7.5%.
The number of riders retired increased from 3% to 4.7% as well as did the number of riders in
the military from 0.3% to 0.5%.
2018 Response
Response
Weighted Response by Peak Percent
Weighted Response All Day Percent Unweighted Percent
Clerical/Secretarial 6,436.56 7.5% 6,735.95 6.9% 352 7.0%
Homemaker 603.62 0.7% 843.61 0.9% 44 0.9%
Management 12,231.72 14.3% 13,242.96 13.5% 699 13.9%
Military 404.55 0.5% 457.20 0.5% 23 0.5%
Non-office worker 749.98 0.9% 866.37 0.9% 45 0.9%
Not currently employed 839.11 1.0% 1,128.76 1.2% 54 1.1%
Retired 4,013.79 4.7% 5,117.30 5.2% 251 5.0%
Sales/Retail 3,747.90 4.4% 4,546.65 4.7% 244 4.9%
Student 6,597.37 7.7% 7,960.80 8.1% 445 8.9%
Technical/Skilled 14,326.22 16.8% 16,417.50 16.8% 787 15.7%
Medical 10,569.57 12.4% 12,075.81 12.4% 637 12.7%
Other 23,659.96 27.7% 26,975.62 27.6% 1,376 27.4%
Refused 1,135.66 1.3% 1,385.47 1.4% 69 1.4%
Grand Total 85,316 97,754 5,026
2015 Response
Response
Weighted Response by Peak/Off Peak Percent
Weighted Response All Day Percent Unweighted Percent
Clerical/Secretarial 3,007 9% 2,425 7% 234 7%
Homemaker 229 1% 307 1% 32 1%
Management 5,202 16% 4,579 14% 450 13%
Military 97 0.3% 135 0.4% 13 0.4%
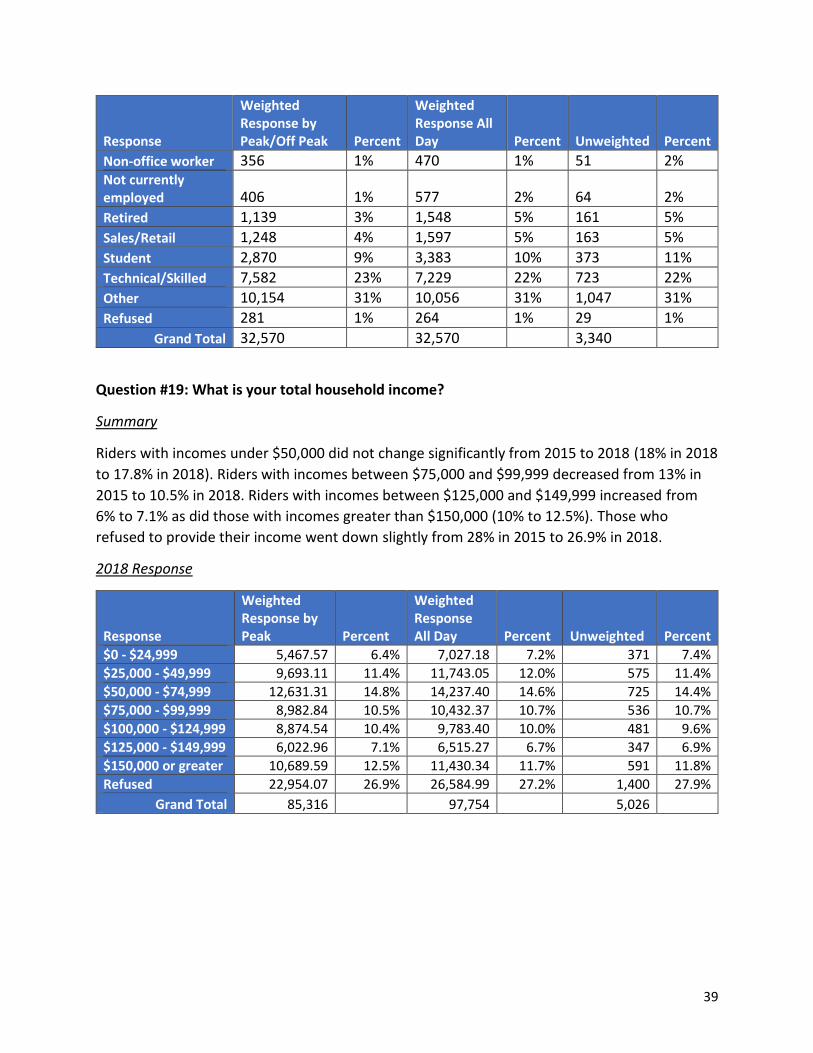
39
Response
Weighted Response by Peak/Off Peak Percent
Weighted Response All Day Percent Unweighted Percent
Non-office worker 356 1% 470 1% 51 2% Not currently employed 406 1% 577 2% 64 2%
Retired 1,139 3% 1,548 5% 161 5%
Sales/Retail 1,248 4% 1,597 5% 163 5%
Student 2,870 9% 3,383 10% 373 11%
Technical/Skilled 7,582 23% 7,229 22% 723 22%
Other 10,154 31% 10,056 31% 1,047 31%
Refused 281 1% 264 1% 29 1%
Grand Total 32,570 32,570 3,340
Question #19: What is your total household income?
Summary
Riders with incomes under $50,000 did not change significantly from 2015 to 2018 (18% in 2018
to 17.8% in 2018). Riders with incomes between $75,000 and $99,999 decreased from 13% in
2015 to 10.5% in 2018. Riders with incomes between $125,000 and $149,999 increased from
6% to 7.1% as did those with incomes greater than $150,000 (10% to 12.5%). Those who
refused to provide their income went down slightly from 28% in 2015 to 26.9% in 2018.
2018 Response
Response
Weighted Response by Peak Percent
Weighted Response All Day Percent Unweighted Percent
$0 - $24,999 5,467.57 6.4% 7,027.18 7.2% 371 7.4% $25,000 - $49,999 9,693.11 11.4% 11,743.05 12.0% 575 11.4% $50,000 - $74,999 12,631.31 14.8% 14,237.40 14.6% 725 14.4% $75,000 - $99,999 8,982.84 10.5% 10,432.37 10.7% 536 10.7% $100,000 - $124,999 8,874.54 10.4% 9,783.40 10.0% 481 9.6% $125,000 - $149,999 6,022.96 7.1% 6,515.27 6.7% 347 6.9% $150,000 or greater 10,689.59 12.5% 11,430.34 11.7% 591 11.8% Refused 22,954.07 26.9% 26,584.99 27.2% 1,400 27.9%
Grand Total 85,316 97,754 5,026
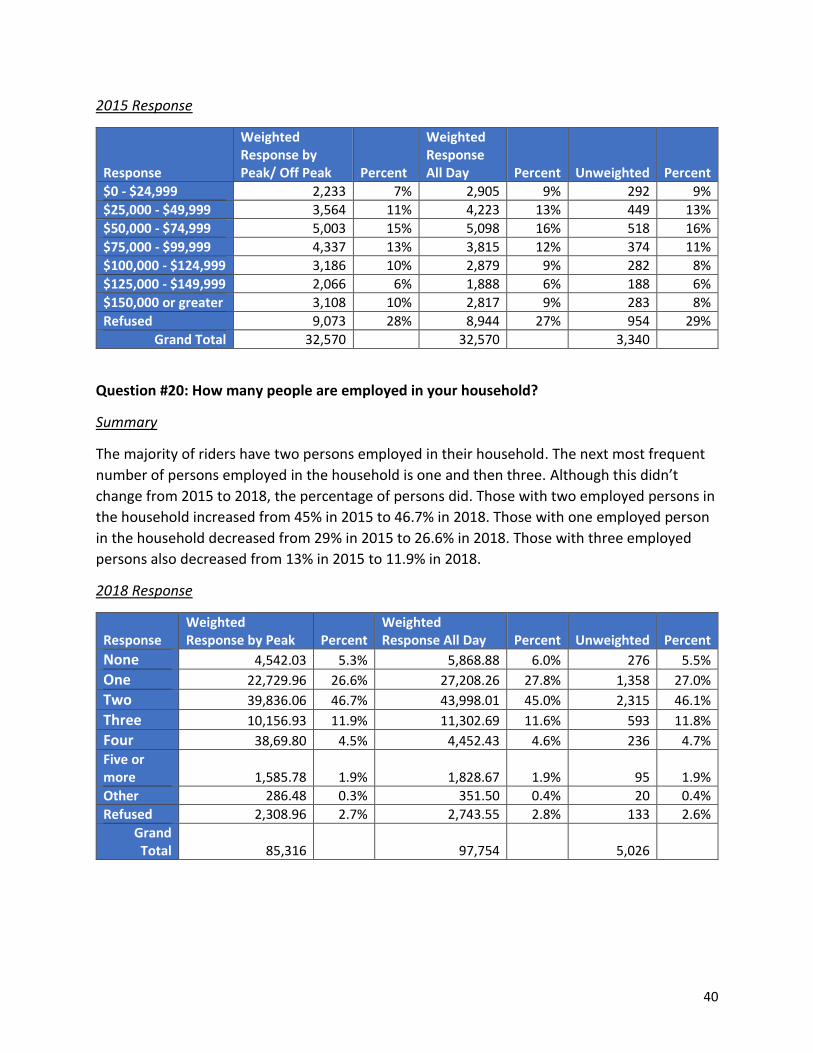
40
2015 Response
Response
Weighted Response by Peak/ Off Peak Percent
Weighted Response All Day Percent Unweighted Percent
$0 - $24,999 2,233 7% 2,905 9% 292 9%
$25,000 - $49,999 3,564 11% 4,223 13% 449 13%
$50,000 - $74,999 5,003 15% 5,098 16% 518 16%
$75,000 - $99,999 4,337 13% 3,815 12% 374 11%
$100,000 - $124,999 3,186 10% 2,879 9% 282 8%
$125,000 - $149,999 2,066 6% 1,888 6% 188 6%
$150,000 or greater 3,108 10% 2,817 9% 283 8%
Refused 9,073 28% 8,944 27% 954 29%
Grand Total 32,570 32,570 3,340
Question #20: How many people are employed in your household?
Summary
The majority of riders have two persons employed in their household. The next most frequent
number of persons employed in the household is one and then three. Although this didn’t
change from 2015 to 2018, the percentage of persons did. Those with two employed persons in
the household increased from 45% in 2015 to 46.7% in 2018. Those with one employed person
in the household decreased from 29% in 2015 to 26.6% in 2018. Those with three employed
persons also decreased from 13% in 2015 to 11.9% in 2018.
2018 Response
Response Weighted Response by Peak Percent
Weighted Response All Day Percent Unweighted Percent
None 4,542.03 5.3% 5,868.88 6.0% 276 5.5%
One 22,729.96 26.6% 27,208.26 27.8% 1,358 27.0%
Two 39,836.06 46.7% 43,998.01 45.0% 2,315 46.1%
Three 10,156.93 11.9% 11,302.69 11.6% 593 11.8%
Four 38,69.80 4.5% 4,452.43 4.6% 236 4.7%
Five or more 1,585.78 1.9% 1,828.67 1.9% 95 1.9%
Other 286.48 0.3% 351.50 0.4% 20 0.4%
Refused 2,308.96 2.7% 2,743.55 2.8% 133 2.6%
Grand Total 85,316 97,754 5,026
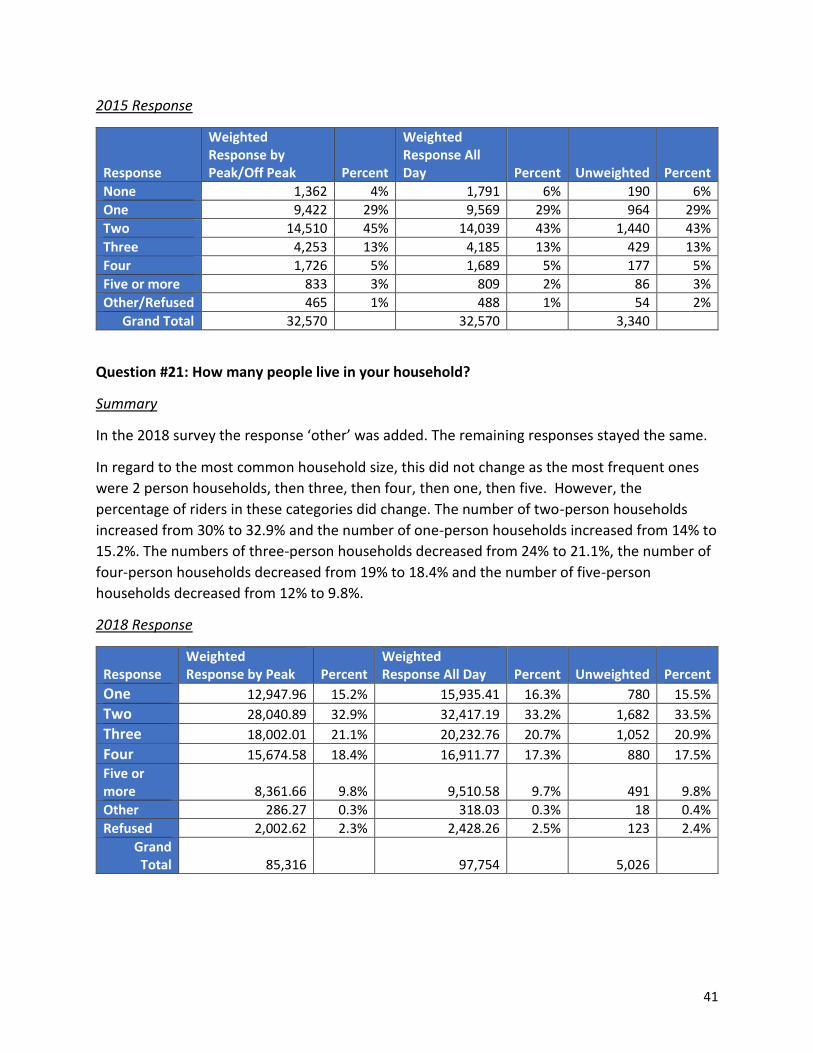
41
2015 Response
Response
Weighted Response by Peak/Off Peak Percent
Weighted Response All Day Percent Unweighted Percent
None 1,362 4% 1,791 6% 190 6%
One 9,422 29% 9,569 29% 964 29%
Two 14,510 45% 14,039 43% 1,440 43%
Three 4,253 13% 4,185 13% 429 13%
Four 1,726 5% 1,689 5% 177 5%
Five or more 833 3% 809 2% 86 3%
Other/Refused 465 1% 488 1% 54 2%
Grand Total 32,570 32,570 3,340
Question #21: How many people live in your household?
Summary
In the 2018 survey the response ‘other’ was added. The remaining responses stayed the same.
In regard to the most common household size, this did not change as the most frequent ones
were 2 person households, then three, then four, then one, then five. However, the
percentage of riders in these categories did change. The number of two-person households
increased from 30% to 32.9% and the number of one-person households increased from 14% to
15.2%. The numbers of three-person households decreased from 24% to 21.1%, the number of
four-person households decreased from 19% to 18.4% and the number of five-person
households decreased from 12% to 9.8%.
2018 Response
Response Weighted Response by Peak Percent
Weighted Response All Day Percent Unweighted Percent
One 12,947.96 15.2% 15,935.41 16.3% 780 15.5% Two 28,040.89 32.9% 32,417.19 33.2% 1,682 33.5% Three 18,002.01 21.1% 20,232.76 20.7% 1,052 20.9% Four 15,674.58 18.4% 16,911.77 17.3% 880 17.5% Five or more 8,361.66 9.8% 9,510.58 9.7% 491 9.8% Other 286.27 0.3% 318.03 0.3% 18 0.4% Refused 2,002.62 2.3% 2,428.26 2.5% 123 2.4%
Grand Total 85,316 97,754 5,026
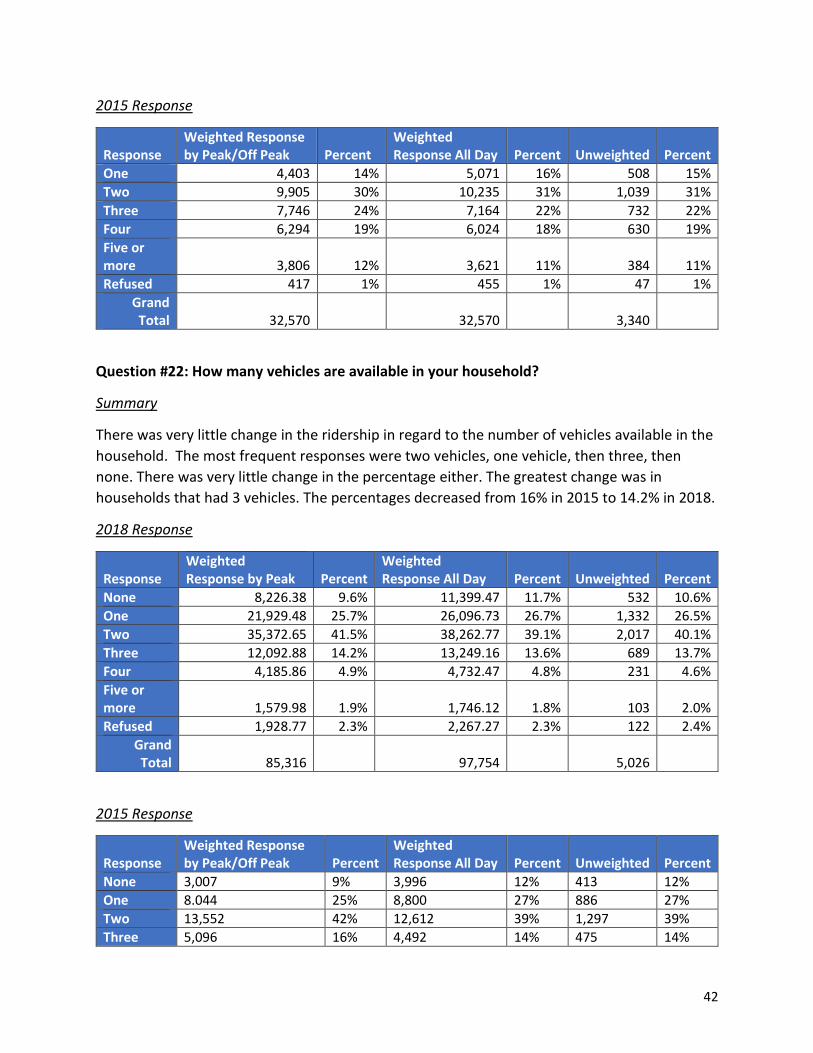
42
2015 Response
Response Weighted Response by Peak/Off Peak Percent
Weighted Response All Day Percent Unweighted Percent
One 4,403 14% 5,071 16% 508 15%
Two 9,905 30% 10,235 31% 1,039 31%
Three 7,746 24% 7,164 22% 732 22%
Four 6,294 19% 6,024 18% 630 19%
Five or more 3,806 12% 3,621 11% 384 11%
Refused 417 1% 455 1% 47 1%
Grand Total 32,570 32,570 3,340
Question #22: How many vehicles are available in your household?
Summary
There was very little change in the ridership in regard to the number of vehicles available in the
household. The most frequent responses were two vehicles, one vehicle, then three, then
none. There was very little change in the percentage either. The greatest change was in
households that had 3 vehicles. The percentages decreased from 16% in 2015 to 14.2% in 2018.
2018 Response
Response Weighted Response by Peak Percent
Weighted Response All Day Percent Unweighted Percent
None 8,226.38 9.6% 11,399.47 11.7% 532 10.6% One 21,929.48 25.7% 26,096.73 26.7% 1,332 26.5% Two 35,372.65 41.5% 38,262.77 39.1% 2,017 40.1% Three 12,092.88 14.2% 13,249.16 13.6% 689 13.7% Four 4,185.86 4.9% 4,732.47 4.8% 231 4.6% Five or more 1,579.98 1.9% 1,746.12 1.8% 103 2.0% Refused 1,928.77 2.3% 2,267.27 2.3% 122 2.4%
Grand Total 85,316 97,754 5,026
2015 Response
Response Weighted Response by Peak/Off Peak Percent
Weighted Response All Day Percent Unweighted Percent
None 3,007 9% 3,996 12% 413 12%
One 8.044 25% 8,800 27% 886 27%
Two 13,552 42% 12,612 39% 1,297 39%
Three 5,096 16% 4,492 14% 475 14%
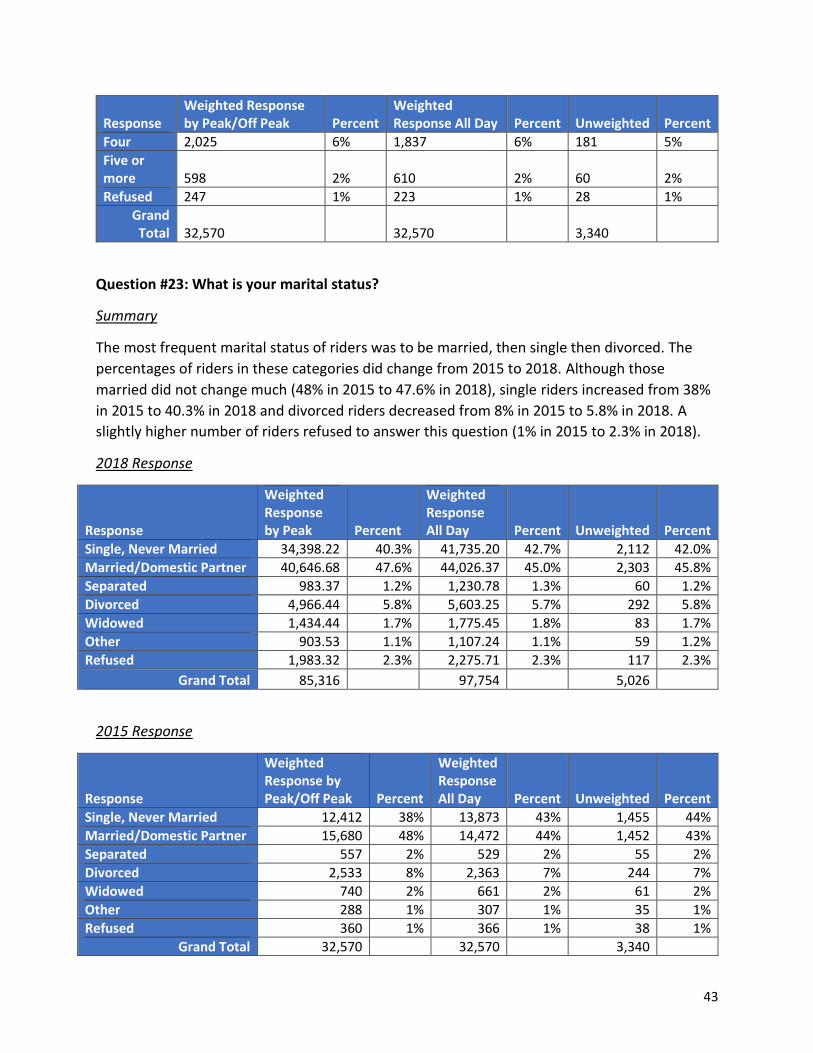
43
Response Weighted Response by Peak/Off Peak Percent
Weighted Response All Day Percent Unweighted Percent
Four 2,025 6% 1,837 6% 181 5%
Five or more 598 2% 610 2% 60 2%
Refused 247 1% 223 1% 28 1%
Grand Total 32,570 32,570 3,340
Question #23: What is your marital status?
Summary
The most frequent marital status of riders was to be married, then single then divorced. The
percentages of riders in these categories did change from 2015 to 2018. Although those
married did not change much (48% in 2015 to 47.6% in 2018), single riders increased from 38%
in 2015 to 40.3% in 2018 and divorced riders decreased from 8% in 2015 to 5.8% in 2018. A
slightly higher number of riders refused to answer this question (1% in 2015 to 2.3% in 2018).
2018 Response
Response
Weighted Response by Peak Percent
Weighted Response All Day Percent Unweighted Percent
Single, Never Married 34,398.22 40.3% 41,735.20 42.7% 2,112 42.0% Married/Domestic Partner 40,646.68 47.6% 44,026.37 45.0% 2,303 45.8% Separated 983.37 1.2% 1,230.78 1.3% 60 1.2% Divorced 4,966.44 5.8% 5,603.25 5.7% 292 5.8% Widowed 1,434.44 1.7% 1,775.45 1.8% 83 1.7% Other 903.53 1.1% 1,107.24 1.1% 59 1.2% Refused 1,983.32 2.3% 2,275.71 2.3% 117 2.3%
Grand Total 85,316 97,754 5,026
2015 Response
Response
Weighted Response by Peak/Off Peak Percent
Weighted Response All Day Percent Unweighted Percent
Single, Never Married 12,412 38% 13,873 43% 1,455 44%
Married/Domestic Partner 15,680 48% 14,472 44% 1,452 43%
Separated 557 2% 529 2% 55 2%
Divorced 2,533 8% 2,363 7% 244 7%
Widowed 740 2% 661 2% 61 2%
Other 288 1% 307 1% 35 1%
Refused 360 1% 366 1% 38 1%
Grand Total 32,570 32,570 3,340
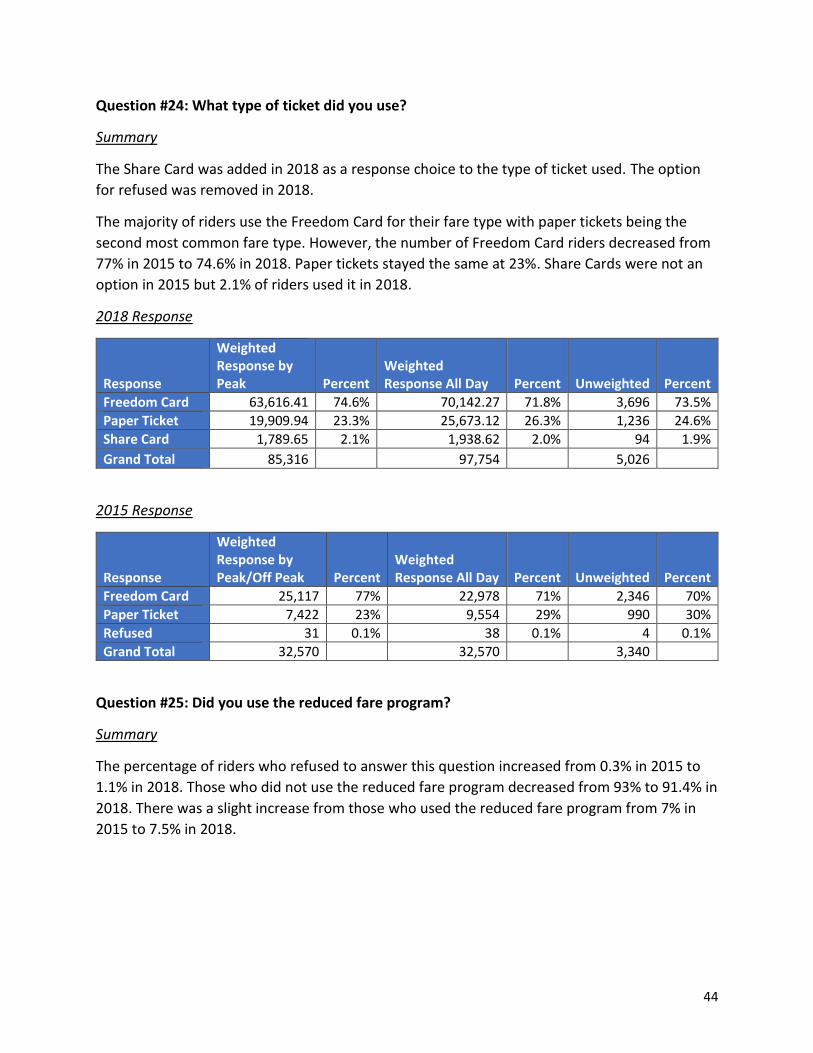
44
Question #24: What type of ticket did you use?
Summary
The Share Card was added in 2018 as a response choice to the type of ticket used. The option
for refused was removed in 2018.
The majority of riders use the Freedom Card for their fare type with paper tickets being the
second most common fare type. However, the number of Freedom Card riders decreased from
77% in 2015 to 74.6% in 2018. Paper tickets stayed the same at 23%. Share Cards were not an
option in 2015 but 2.1% of riders used it in 2018.
2018 Response
Response
Weighted Response by Peak Percent
Weighted Response All Day Percent Unweighted Percent
Freedom Card 63,616.41 74.6% 70,142.27 71.8% 3,696 73.5% Paper Ticket 19,909.94 23.3% 25,673.12 26.3% 1,236 24.6% Share Card 1,789.65 2.1% 1,938.62 2.0% 94 1.9%
Grand Total 85,316 97,754 5,026
2015 Response
Response
Weighted Response by Peak/Off Peak Percent
Weighted Response All Day Percent Unweighted Percent
Freedom Card 25,117 77% 22,978 71% 2,346 70%
Paper Ticket 7,422 23% 9,554 29% 990 30%
Refused 31 0.1% 38 0.1% 4 0.1%
Grand Total 32,570 32,570 3,340
Question #25: Did you use the reduced fare program?
Summary
The percentage of riders who refused to answer this question increased from 0.3% in 2015 to
1.1% in 2018. Those who did not use the reduced fare program decreased from 93% to 91.4% in
2018. There was a slight increase from those who used the reduced fare program from 7% in
2015 to 7.5% in 2018.
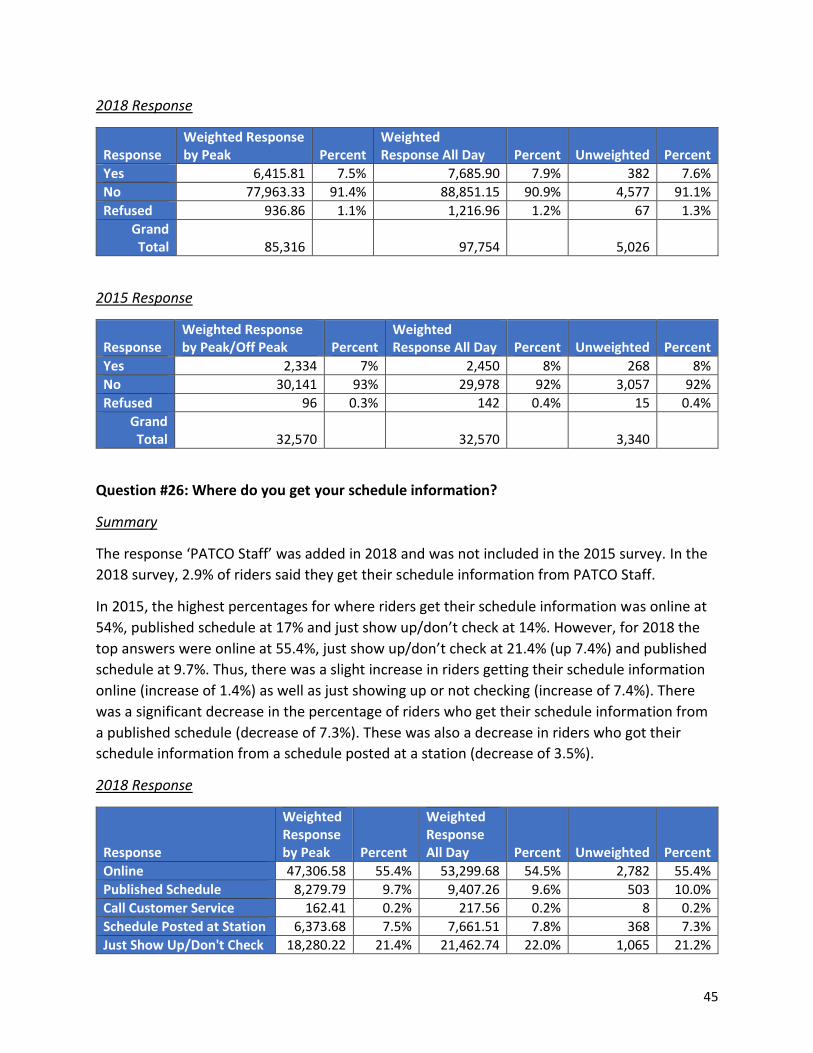
45
2018 Response
Response Weighted Response by Peak Percent
Weighted Response All Day Percent Unweighted Percent
Yes 6,415.81 7.5% 7,685.90 7.9% 382 7.6% No 77,963.33 91.4% 88,851.15 90.9% 4,577 91.1% Refused 936.86 1.1% 1,216.96 1.2% 67 1.3%
Grand Total 85,316 97,754 5,026
2015 Response
Response Weighted Response by Peak/Off Peak Percent
Weighted Response All Day Percent Unweighted Percent
Yes 2,334 7% 2,450 8% 268 8%
No 30,141 93% 29,978 92% 3,057 92%
Refused 96 0.3% 142 0.4% 15 0.4%
Grand Total 32,570 32,570 3,340
Question #26: Where do you get your schedule information?
Summary
The response ‘PATCO Staff’ was added in 2018 and was not included in the 2015 survey. In the
2018 survey, 2.9% of riders said they get their schedule information from PATCO Staff.
In 2015, the highest percentages for where riders get their schedule information was online at
54%, published schedule at 17% and just show up/don’t check at 14%. However, for 2018 the
top answers were online at 55.4%, just show up/don’t check at 21.4% (up 7.4%) and published
schedule at 9.7%. Thus, there was a slight increase in riders getting their schedule information
online (increase of 1.4%) as well as just showing up or not checking (increase of 7.4%). There
was a significant decrease in the percentage of riders who get their schedule information from
a published schedule (decrease of 7.3%). These was also a decrease in riders who got their
schedule information from a schedule posted at a station (decrease of 3.5%).
2018 Response
Response
Weighted Response by Peak Percent
Weighted Response All Day Percent Unweighted Percent
Online 47,306.58 55.4% 53,299.68 54.5% 2,782 55.4% Published Schedule 8,279.79 9.7% 9,407.26 9.6% 503 10.0% Call Customer Service 162.41 0.2% 217.56 0.2% 8 0.2% Schedule Posted at Station 6,373.68 7.5% 7,661.51 7.8% 368 7.3% Just Show Up/Don't Check 18,280.22 21.4% 21,462.74 22.0% 1,065 21.2%
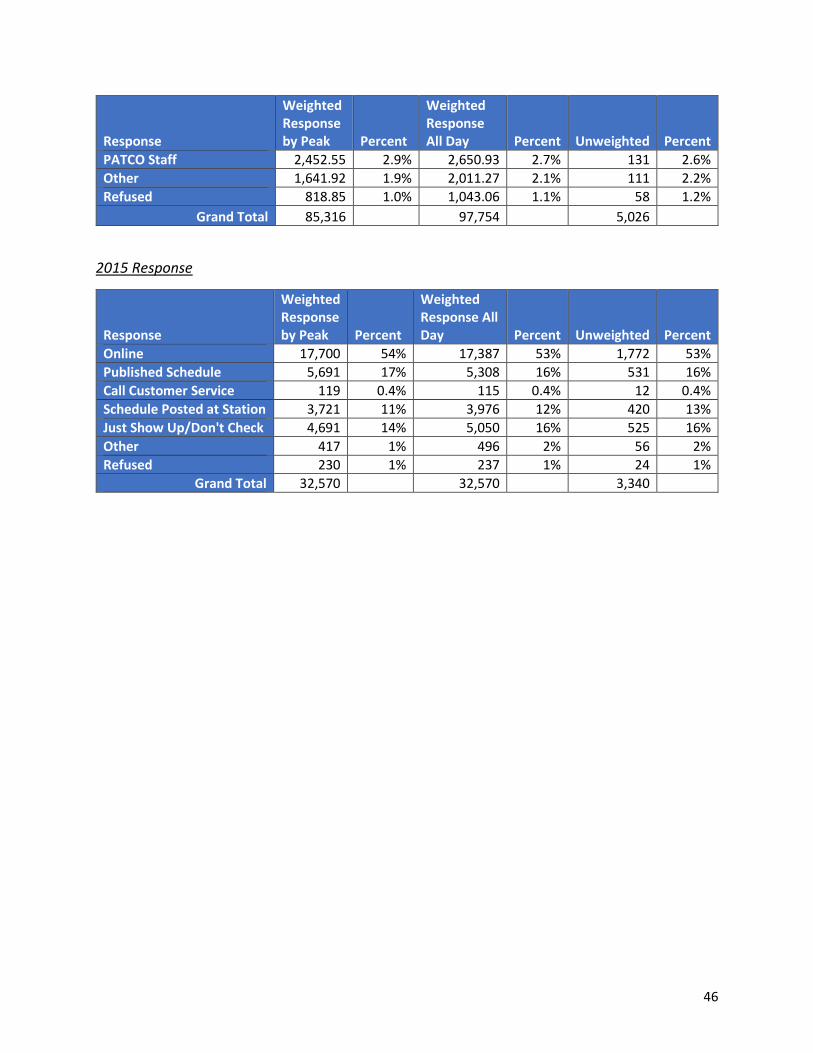
46
Response
Weighted Response by Peak Percent
Weighted Response All Day Percent Unweighted Percent
PATCO Staff 2,452.55 2.9% 2,650.93 2.7% 131 2.6% Other 1,641.92 1.9% 2,011.27 2.1% 111 2.2% Refused 818.85 1.0% 1,043.06 1.1% 58 1.2%
Grand Total 85,316 97,754 5,026
2015 Response
Response
Weighted Response by Peak Percent
Weighted Response All Day Percent Unweighted Percent
Online 17,700 54% 17,387 53% 1,772 53%
Published Schedule 5,691 17% 5,308 16% 531 16%
Call Customer Service 119 0.4% 115 0.4% 12 0.4%
Schedule Posted at Station 3,721 11% 3,976 12% 420 13%
Just Show Up/Don't Check 4,691 14% 5,050 16% 525 16%
Other 417 1% 496 2% 56 2%
Refused 230 1% 237 1% 24 1%
Grand Total 32,570 32,570 3,340
12/26/18
1
Survey Training
Purpose
The purpose of this survey is to comply with FTA regulations that
all transit lines be surveyed to create a demographic profile and catalog travel patterns of
their ridership every three years.
The goal is to be able to create a complete demographic profile
and an overview of travel patterns of PATCO’s riders in
order to to remain eligible for federal funding.
12/26/18
2
They Know You are Coming
This signage will be visible throughout the platforms and
stations
Greeting Script
Good morning/afternoon, PATCO is conducting a brief survey of its riders today. Your participation is vital to better understand who our riders are. This will only take a few minutes. Your response will remain confidential and will not be released to anyone for any reason.
12/26/18
3
FAQFor Passengers
This survey is required by the FTA (Federal Transit Administration)
All data is anonymous – no names are taken
PATCO will not sell or give away the data
Only PATCO, Kairos Development Group and Milligan & Company will have the data
Passengers can only complete one survey
How to Conduct a Survey
• Its important to: • Smile & Make Eye Contact• Address them as Sir or Ma’am• Make eye contact
• If they refuse (many will) thank them for their time and let them walk away and remember its not personal
• Skip any question the customer refuses to answer – do not press
• When done, thank them for their time and wish them a good day
12/26/18
4
What NOT to do when Conducting a Survey
• Make sure to not press people who do not want to take the survey.
• If a customer is pressing you or confronting you, make sure to walk away. Do NOT engage or reply back. If they persist, look for a Kairos, Milligan or PATCO Supervisor.
What to Expect When You Begin/End Your Shift
Upon arrival at your station you will be greeted by a Kairos,
Milligan or PATCO Representative and will be given a tablet and script card. We will
meet in the entrance of the station.
At the end of your shift you will meet at the entrance to the
station where a representative will take your tablet.

12/26/18
5
Review Survey
Link to Survey
Initial Survey Data (entered prior to administering the survey to the customer)
1. Your Name or Unique ID2. Station

12/26/18
6
There are 26 Questions.
Review and practice the questions prior to conducting the
survey.
*For the gender, race, and income question (due to confidentiality) if the customer doesn’t want to answer, offer to hand the tablet to the customer for them to provide their response.
Thank YouYour work is appreciated and important for the continued funding of PATCO, as well as for the customers.

12/26/18
7
Questions
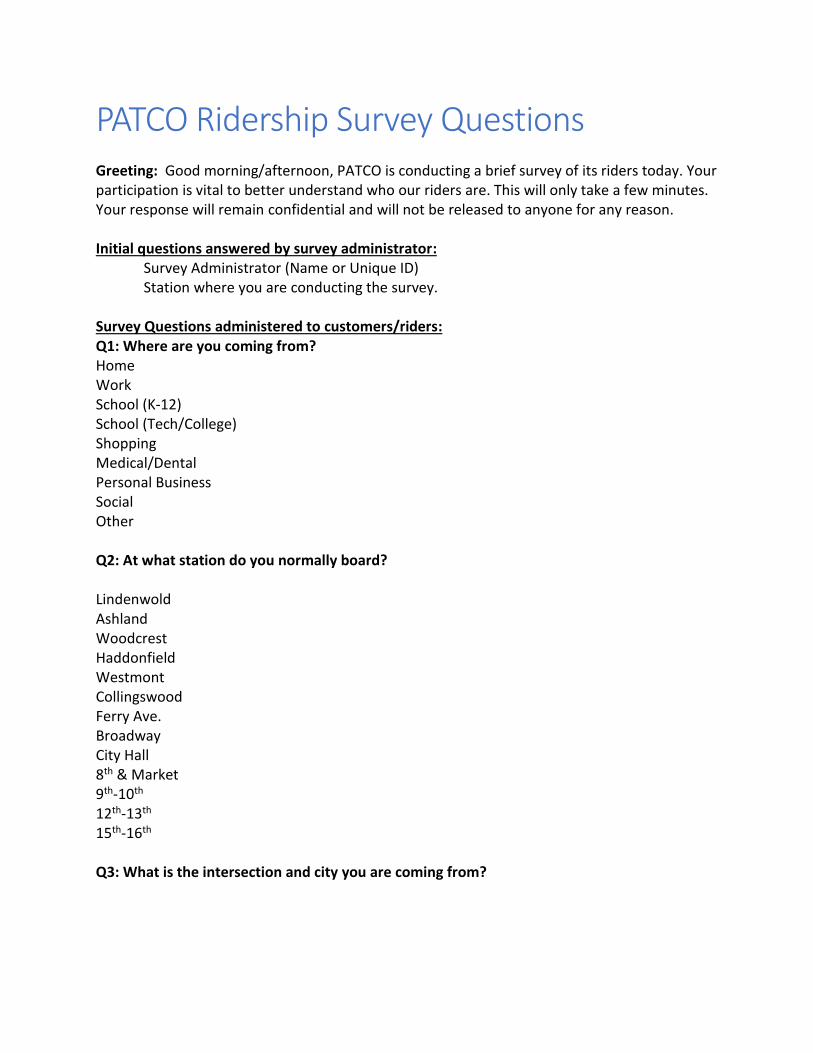
PATCO Ridership Survey Questions Greeting: Good morning/afternoon, PATCO is conducting a brief survey of its riders today. Your participation is vital to better understand who our riders are. This will only take a few minutes. Your response will remain confidential and will not be released to anyone for any reason. Initial questions answered by survey administrator:
Survey Administrator (Name or Unique ID) Station where you are conducting the survey.
Survey Questions administered to customers/riders: Q1: Where are you coming from? Home Work School (K-12) School (Tech/College) Shopping Medical/Dental Personal Business Social Other Q2: At what station do you normally board? Lindenwold Ashland Woodcrest Haddonfield Westmont Collingswood Ferry Ave. Broadway City Hall 8th & Market 9th-10th 12th-13th 15th-16th Q3: What is the intersection and city you are coming from?

Q4: How did you get to PATCO today? Walk Bicycle Carpool Car – Drive and Park Car- Dropped Off Taxi Train Bus Other Q5: Did you pay to park at PATCO? No Yes Q6: Where are you going? Home Work School (K-12) School (Tech/College) Shopping Medical/Dental Personal Business Social Other Q7: At what station will you exit? Lindenwold Ashland Woodcrest Haddonfield Westmont Collingswood Ferry Ave. Broadway City Hall 8th & Market 9th-10th 12th-13th 15th-16th Q8: What is the intersection and city you are going to?
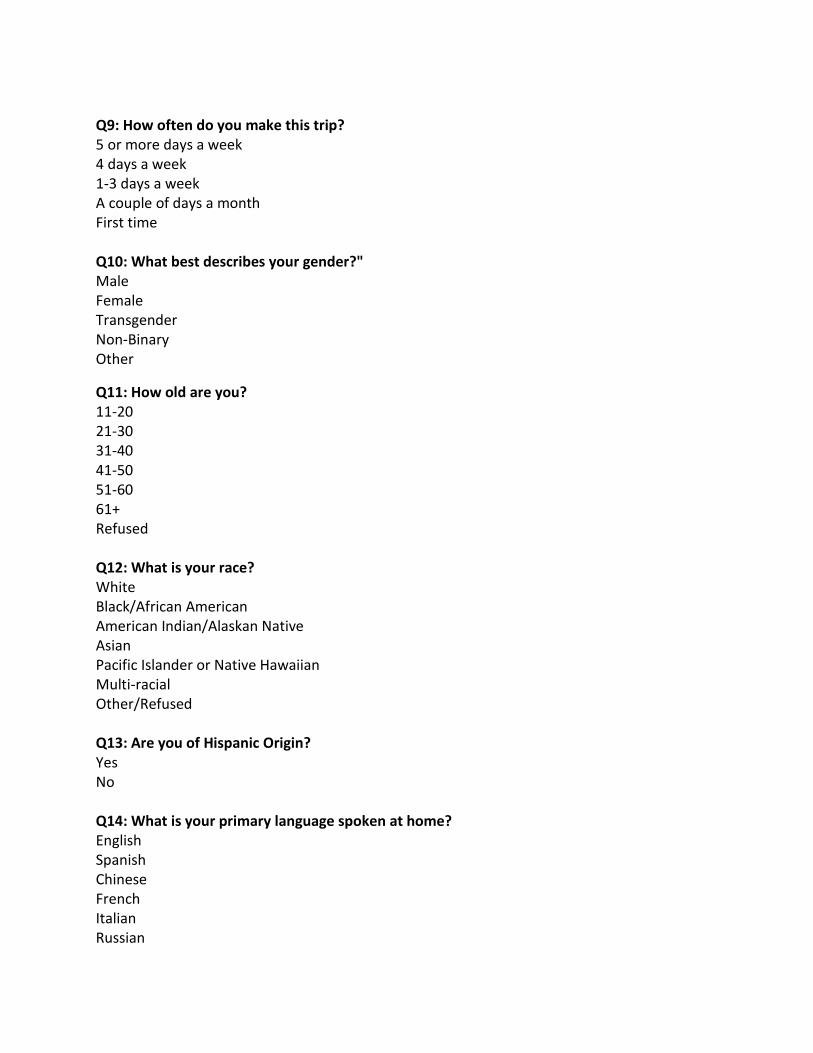
Q9: How often do you make this trip? 5 or more days a week 4 days a week 1-3 days a week A couple of days a month First time Q10: What best describes your gender?" Male Female Transgender Non-Binary Other
Q11: How old are you? 11-20 21-30 31-40 41-50 51-60 61+ Refused Q12: What is your race? White Black/African American American Indian/Alaskan Native Asian Pacific Islander or Native Hawaiian Multi-racial Other/Refused Q13: Are you of Hispanic Origin? Yes No Q14: What is your primary language spoken at home? English Spanish Chinese French Italian Russian

Korean Vietnamese Other Refused Q15: Do you speak and write in English? Yes No Refused Q16: Describe your living accommodations? Owned Rented or Leased Occupied W/O Payment of Rent Other Refused Q17: What is your highest level of education received? Less than high school degree High school degree or equivalent Some college Associates Degree Bachelor’s Degree Graduate Degree Other Refused Q18: What is your Occupation? Clerical/Secretarial Homemaker Management Military Non-office worker Medical Not currently employed Retired Sales/Retail Student Technical/Skilled Other Refused

Q19: What is your total household income? $0 - $24,999 $25,000 - $49,999 $50,000 - $74,999 $75,000 - $99,999 $100,000 – 124,999 $125,000 - $149,999 $150,000 or greater Refused Q20: How many people are employed in your household? None One Two Three Four Five or more Other/Refused Q21: How many people live in your household? One Two Three Four Five or more Refused Q22: How many vehicles are available in your household? None One Two Three Four Five or more Refused Q23: What is your marital status? Single, never married Married/Domestic partner Separated Divorced Widowed Other Refused

Q24: What type of ticket did you use? Freedom Card Share Card Paper ticket Q25: Did you use the reduced fare program? No Yes Refused Q26: Where do you get your schedule information? Online Published Schedule Call Customer Service Schedule Posted at Station PATCO Staff Just Show up/Don’t check Other Refused
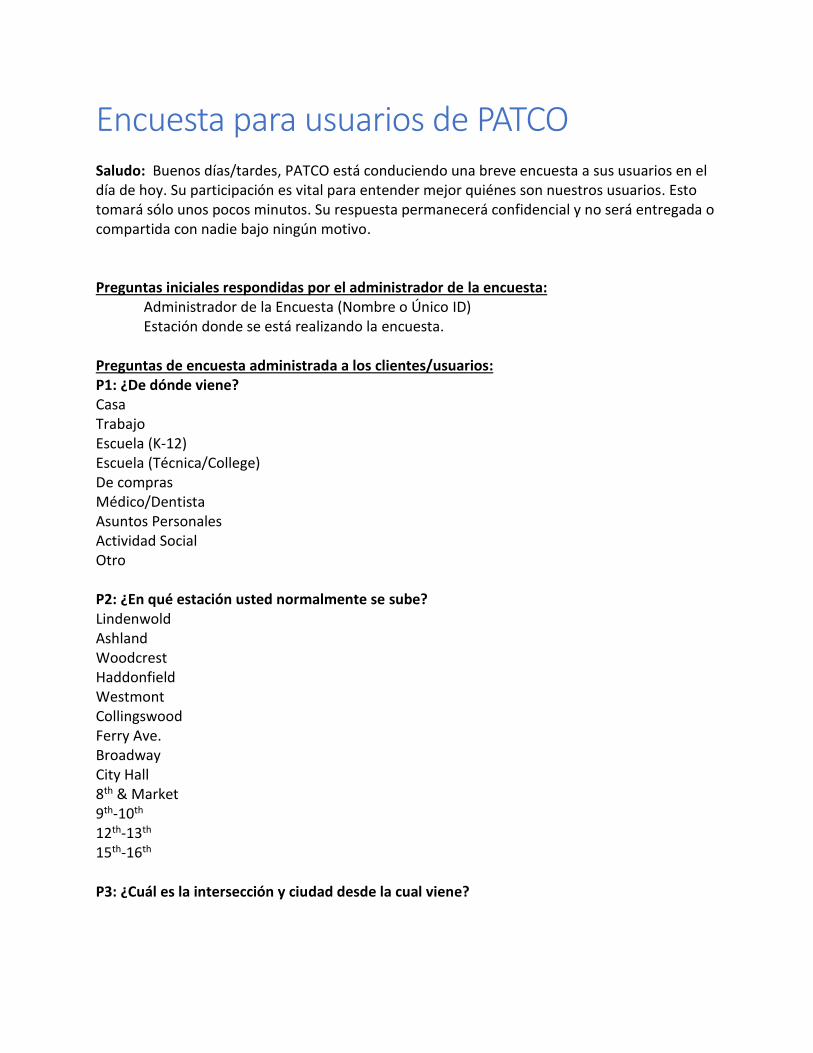
Encuesta para usuarios de PATCO Saludo: Buenos días/tardes, PATCO está conduciendo una breve encuesta a sus usuarios en el día de hoy. Su participación es vital para entender mejor quiénes son nuestros usuarios. Esto tomará sólo unos pocos minutos. Su respuesta permanecerá confidencial y no será entregada o compartida con nadie bajo ningún motivo. Preguntas iniciales respondidas por el administrador de la encuesta:
Administrador de la Encuesta (Nombre o Único ID) Estación donde se está realizando la encuesta.
Preguntas de encuesta administrada a los clientes/usuarios: P1: ¿De dónde viene? Casa Trabajo Escuela (K-12) Escuela (Técnica/College) De compras Médico/Dentista Asuntos Personales Actividad Social Otro P2: ¿En qué estación usted normalmente se sube? Lindenwold Ashland Woodcrest Haddonfield Westmont Collingswood Ferry Ave. Broadway City Hall 8th & Market 9th-10th 12th-13th 15th-16th P3: ¿Cuál es la intersección y ciudad desde la cual viene?
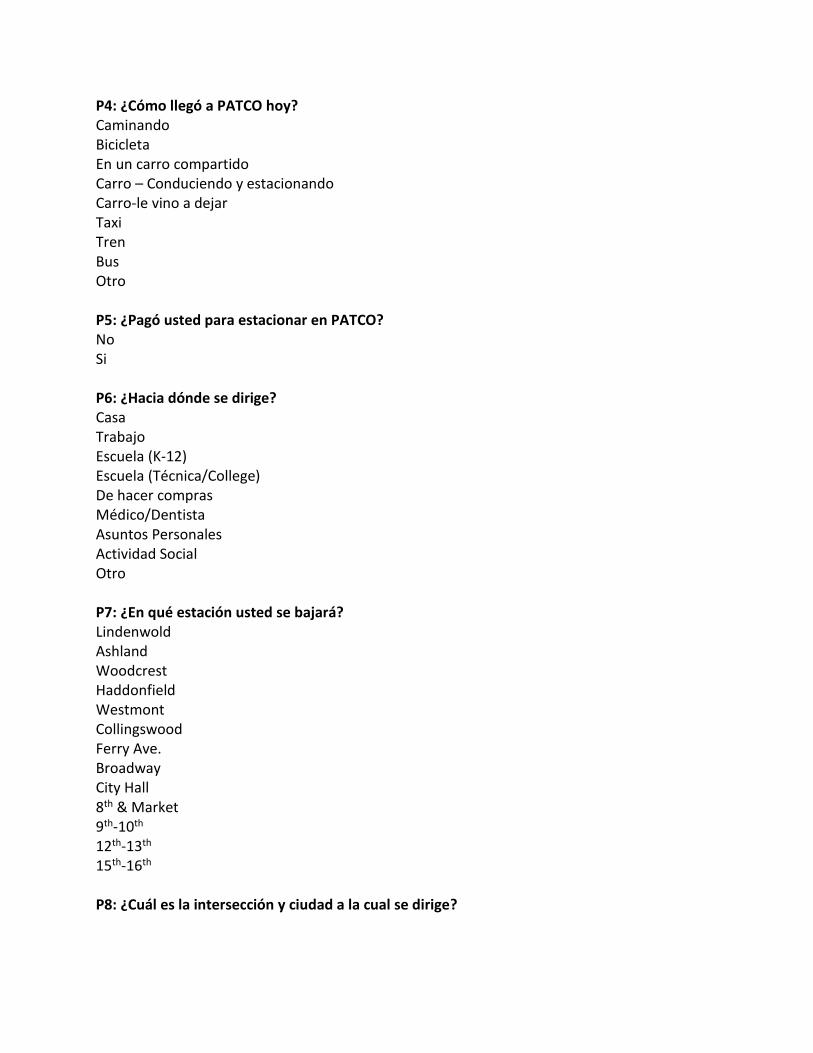
P4: ¿Cómo llegó a PATCO hoy? Caminando Bicicleta En un carro compartido Carro – Conduciendo y estacionando Carro-le vino a dejar Taxi Tren Bus Otro P5: ¿Pagó usted para estacionar en PATCO? No Si P6: ¿Hacia dónde se dirige? Casa Trabajo Escuela (K-12) Escuela (Técnica/College) De hacer compras Médico/Dentista Asuntos Personales Actividad Social Otro P7: ¿En qué estación usted se bajará? Lindenwold Ashland Woodcrest Haddonfield Westmont Collingswood Ferry Ave. Broadway City Hall 8th & Market 9th-10th 12th-13th 15th-16th P8: ¿Cuál es la intersección y ciudad a la cual se dirige?
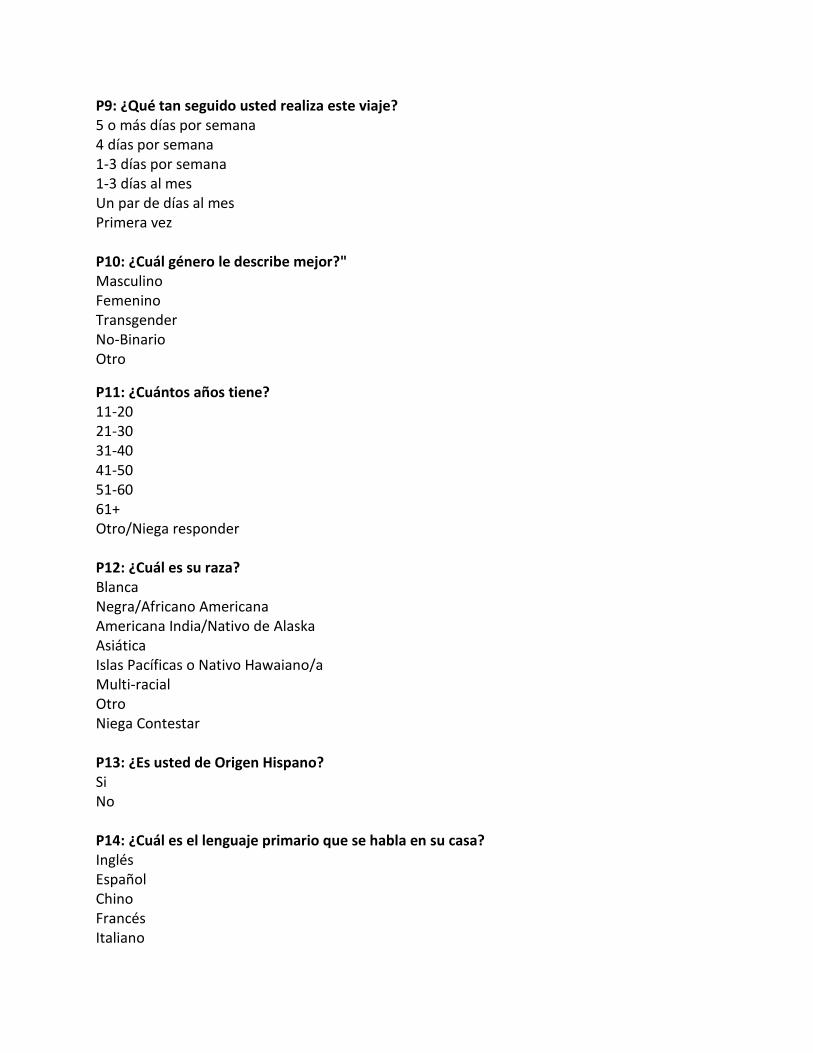
P9: ¿Qué tan seguido usted realiza este viaje? 5 o más días por semana 4 días por semana 1-3 días por semana 1-3 días al mes Un par de días al mes Primera vez P10: ¿Cuál género le describe mejor?" Masculino Femenino Transgender No-Binario Otro
P11: ¿Cuántos años tiene? 11-20 21-30 31-40 41-50 51-60 61+ Otro/Niega responder P12: ¿Cuál es su raza? Blanca Negra/Africano Americana Americana India/Nativo de Alaska Asiática Islas Pacíficas o Nativo Hawaiano/a Multi-racial Otro Niega Contestar P13: ¿Es usted de Origen Hispano? Si No P14: ¿Cuál es el lenguaje primario que se habla en su casa? Inglés Español Chino Francés Italiano
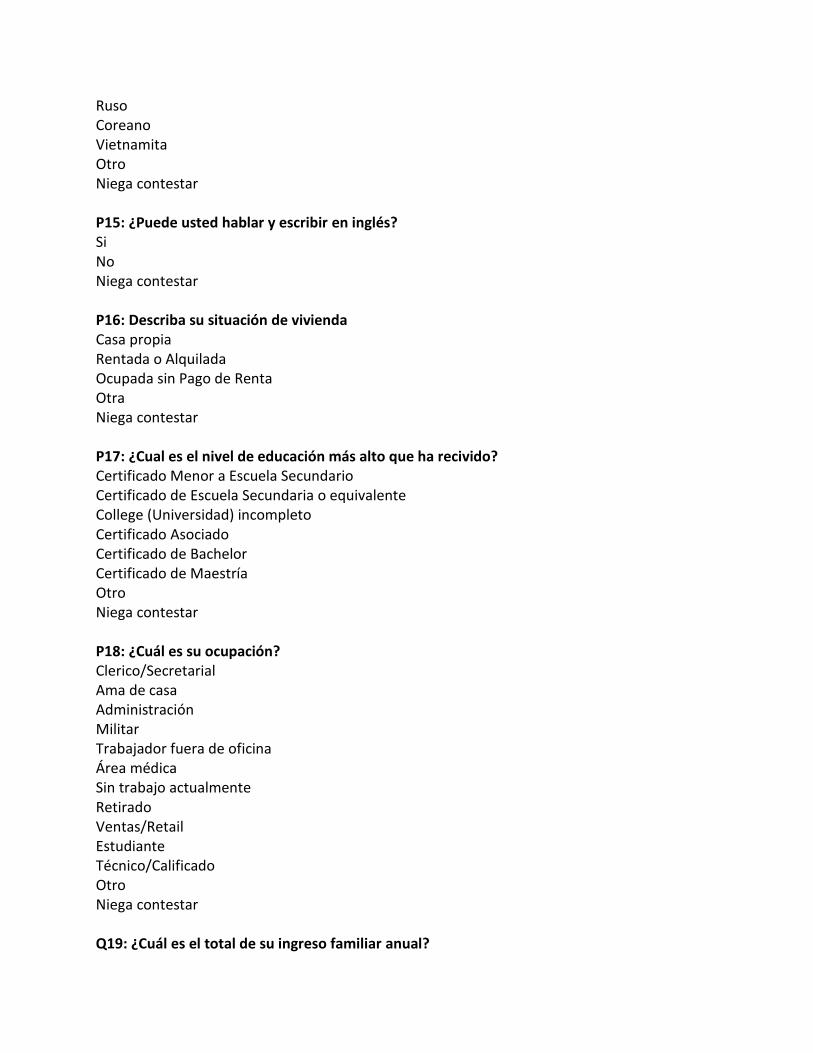
Ruso Coreano Vietnamita Otro Niega contestar P15: ¿Puede usted hablar y escribir en inglés? Si No Niega contestar P16: Describa su situación de vivienda Casa propia Rentada o Alquilada Ocupada sin Pago de Renta Otra Niega contestar P17: ¿Cual es el nivel de educación más alto que ha recivido? Certificado Menor a Escuela Secundario Certificado de Escuela Secundaria o equivalente College (Universidad) incompleto Certificado Asociado Certificado de Bachelor Certificado de Maestría Otro Niega contestar P18: ¿Cuál es su ocupación? Clerico/Secretarial Ama de casa Administración Militar Trabajador fuera de oficina Área médica Sin trabajo actualmente Retirado Ventas/Retail Estudiante Técnico/Calificado Otro Niega contestar Q19: ¿Cuál es el total de su ingreso familiar anual?
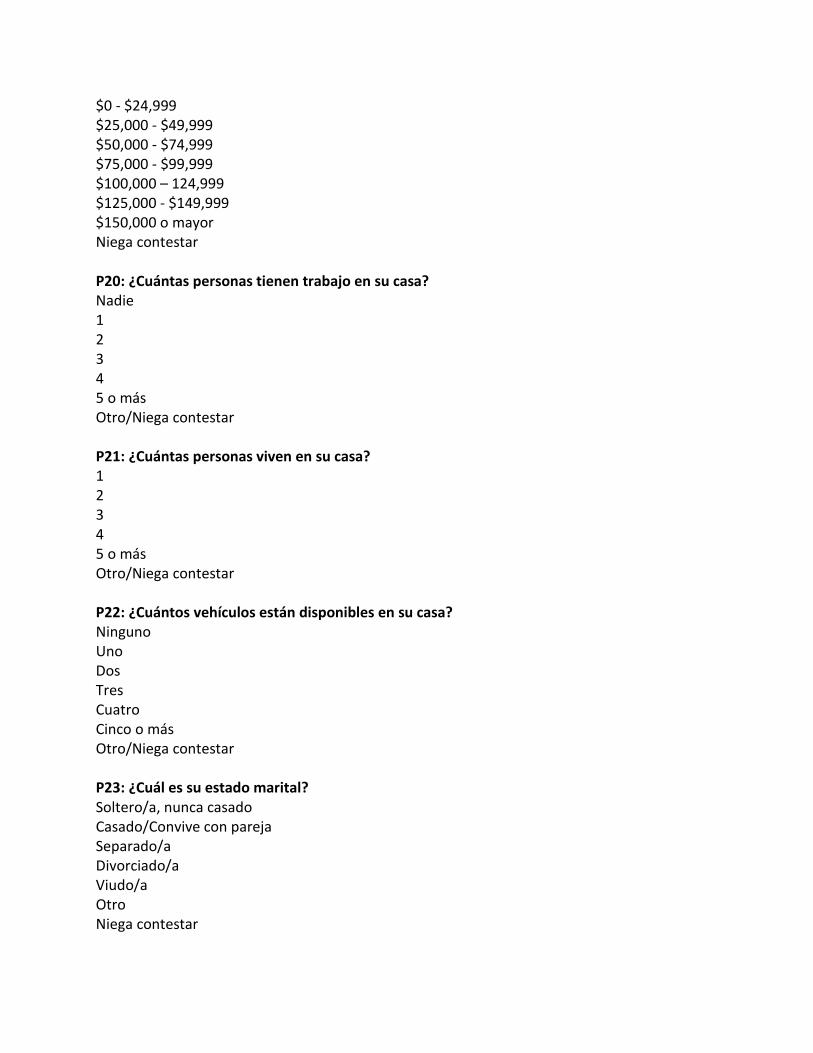
$0 - $24,999 $25,000 - $49,999 $50,000 - $74,999 $75,000 - $99,999 $100,000 – 124,999 $125,000 - $149,999 $150,000 o mayor Niega contestar P20: ¿Cuántas personas tienen trabajo en su casa? Nadie 1 2 3 4 5 o más Otro/Niega contestar P21: ¿Cuántas personas viven en su casa? 1 2 3 4 5 o más Otro/Niega contestar P22: ¿Cuántos vehículos están disponibles en su casa? Ninguno Uno Dos Tres Cuatro Cinco o más Otro/Niega contestar P23: ¿Cuál es su estado marital? Soltero/a, nunca casado Casado/Convive con pareja Separado/a Divorciado/a Viudo/a Otro Niega contestar

P24: ¿Qué tipo de ticket utiliza? Freedom Card Share Card Ticket de papel P25: ¿Utilizó el programa de reducción de costo? No Si Niega contestar P26: ¿Cómo obtiene información de los horarios? Online Horario Escrito Llamando al Servicio de Clientes Horarios publicados en la Estación Sólo se presenta en la estación/No checkea Otro Niega contestar