Embed Size (px)
Citation preview

Temi di discussionedel Servizio Studi
Technology transfer and economic growth in developing countries: an econometric analysis
Number 564 - November 2005
by V. Crispolti and D. Marconi

The purpose of the Temi di discussione series is to promote the circulation of working papers prepared within the Bank of Italy or presented in Bank seminars by outside economists with the aim of stimulating comments and suggestions.
The views expressed in the articles are those of the authors and do not involve the responsibility of the Bank.
Editorial Board: GIORGIO GOBBI, MARCELLO BOFONDI, MICHELE CAIVANO, ANDREA LAMORGESE, FRANCESCO PATERNÒ, MARCELLO PERICOLI, ALESSANDRO SECCHI, FABRIZIO VENDITTI, STEFANIA ZOTTERI.Editorial Assistants: ROBERTO MARANO, CRISTIANA RAMPAZZI.

Technology Transfer and Economic Growth in Developing Countries: an Econometric Analysis
by Valerio Crispolti*∗and Daniela Marconi*
Abstract
In this paper we investigate two potential channels of international technology transfer towards developing countries: trade and foreign direct investments. We study the extent to which, through these channels, research and development expenditures (R&D) performed by advanced countries affect total factor productivity (TFP) levels in a panel of 45 developing countries over the period 1980-2000. Paying particular attention to the potential spillovers effects stemming from human capital, we estimate a TFP equation using the FMOLS technique. Our findings show that both channels induce substantial technology transfer across countries. In addition each developing country, for a given amount of foreign R&D, enjoys bigger spillovers the higher its educational level.
JEL classification: O47, F12, F21.
Keywords: Technology transfer, Economic growth, Trade, FDI.
Contents
1. Introduction.......................................................................................................................7 2. An illustrative model of technology transfer ......................................................................9 3. Empirical implementation ...............................................................................................12 4. Data ................................................................................................................................15 5. Empirical results .............................................................................................................15 6. Robustness ......................................................................................................................17 7. Conclusions.....................................................................................................................19 TABLES..............................................................................................................................21 Appendix .............................................................................................................................29
A.1 FMOLS overview.................................................................................................29 A.2 Estimates of the bilateral FDI positions.................................................................32 A.3 Real business sector R&D.....................................................................................33 A.4 Initial conditions for the R&D capital stock ..........................................................33
References ...........................................................................................................................34
* Bank of Italy, Research department.


1. Introduction1
Recent advances in growth theory, often departing from the perfect competition
paradigm, endogenize technological change, making it the outcome of innovative activities
performed by firms. Each innovation, being the result of dedicated investments in research
and development (R&D) which will ultimately affect total factor productivity (TFP), gives the
innovator monopoly power over its product.2 In the quality ladder models innovation leads to
a superior product (Aghion and Howitt (1998)). In variety expanding models it brings forth
a new product (Grossman and Helpman (1991)). In those models that combine the vertical
and horizontal dimension to eliminate scale effects, innovative activity essentially reduces
production costs (Peretto and Smulders (2002)).
The evidence shows that innovative activities today are still highly concentrated in few
industrial countries.3 Generally, developing countries do not engage in relevant amounts of
R&D. Most of the time they are technological followers whose technical progress eventually
relies upon the ability to adopt and appropriate innovations produced by advanced countries4.
Hence, understanding international technology spillovers becomes a crucial issue in
explaining economic development.
1 The authors would like to thanks F. Alcalà, P. Caselli, A. Ciccone, F. Cingano, R. Rinaldi and V. Rolli foruseful comments on earlier versions of the paper. The views expressed in this paper are those of the authors andnot represent the views of the Bank of Italy. All errors are our responsability.
2 The concept of TFP was first introduced by Solow (1956). The so called Solow’s residual represents theamount of output that is left after we have taken into account the contribution of all the production factors. InSolow (1956) there was no other explanation for it than exogenous technological progress. In the new growththeory, instead, the forces that offset the inherent tendency of diminishing return to the accumulated factors areendogenous to the economic system.
3 According to the National Science Foundation (2002), in 1998 about 80 per cent of world innovationactivity was performed by only 7 developed countries. The United States accounted for roughly 40 per cent ofworld R&D expenditures, spending as much as the rest of the major advanced countries (G7) countries combined.Japan, the second largest R&D investing country, is responsible for about 18 per cent of world expenditure andthe European Union for approximately 30 per cent. In terms of GDP, in 2000 Japan invested about 3 per cent inR&D, United States about 2.7 per cent and the European Union around 1.9 per cent. The business sector is themajor R&D performer in each of the leading economies: in 2000 the industrial sector performed more than 70percent in the United States and Japan, whereas in the European countries above 60 percent. Within the businesssector, manufacturing firms performs more than 90 per cent of industrial R&D in Japan, more than 80 per centin European Union and almost 70 per cent in United States. Machinery and transport equipment and, to a lessextent, the chemical industry account by far for the largest amount of R&D.
4 See Grossman and Helpman (1991).
8
As we described more extensively in our previous work (Crispolti and Marconi (2003)),
many theoretical and empirical studies investigate the channels through which international
technology transfers occur and the country specific factors that may spur them. According to
this literature three channels have been singled out: (i) international trade of capital goods,
(ii) international direct investments (FDI) and (iii) international trade in technology recorded
by payments for royalties and license fees. Through these channels, each developing country
may benefit of passive or active spillovers.
Passive spillovers generally arise through the import of more specialized capital goods
from developed countries. So that, TFP increases simply because a greater variety of
specialized inputs are employed in the production process.
Active technological spillovers, instead, occur when innovation and learning are
primarily conscious and purposive. That is, when local firms do not merely adopt, but also
possess the technological capability to master and eventually improve upon technologies
conceived in other countries, thereby improving domestic production and inventive activity.5
As argued by many authors, the absorption of foreign technology depends upon the
capabilities of the host country, which, among other things, is affected by the domestic human
capital stock. Namely, there may exist a human capital threshold below which developing
countries are not able to capture the benefits associated with any of the transmission channels.6
Due to the scarcity of data on royalties and licence fees, in this paper we concentrate our
analysis on the role played by capital goods trade and FDI in transferring technology across
countries. Whereas most of the studies on this field focus on technology spillovers among
advanced countries, we test for the existence of spillovers from advanced countries towards
developing countries.7 Following and extending the empirical work of Coe et al.(1997), we
5 FDI are generally considered the channel through wich active technology spillovers may actually occurs.Some authors, however, argued that trade may also contribute to active technology spillovers: by exposing do-mestic firms to new products, it may help reverse engeneering and induce innovation or imitation by the localcompetitors (see for example Grossman and Helpman (1991) and Connolly (2003)).
6 See Saggi (2000), Mayer (2001) and OECD (2001).
7 International R&D spillover literature mainly studies technology transfer among developed countries (seefor example Coe and Helpman (1995), Van Pottelsberge de la Potterie and Lichtenberg (2001), Xu and Wang(1999)). Some attempts to include developing countries in such an analysis were made by Coe at al. (1997),Bayoumi and Xu and Wang (2001).

9
analyze how developing countries’ TFP levels react to R&D expenditures performed by United
States, Japan and the European Union (TRIAD).
Our paper contributes to the existing empirical literature in two aspects: (i) it investigates
the long-run relation between TFP and the R&D intensity of machinery imports and FDI, at
first considered separately and then jointly.8,9 (ii) It explicitly takes into account the role of
human capital in supporting technological spillovers.
Our findings suggest that trade and FDI induce a process of technology transmission
from TRIAD’s economies to developing countries. Moreover, we observe evidence of a
significant interaction between the level of education in each developing country and the
channels of transmission at stake. Namely, our data support the belief that the average level
of education attained by a country is an important element for it to benefit from international
technology spillovers.
The paper unfolds as follow: next section sketches a simple benchmark model of
technology transmission in order to point out the main aspects involved in the international
technology transfer process. Section 3 presents the econometric model which is estimated to
test for international technology transfer through the trade and FDI channels. A brief review
of our data is presented in section 4. Section 5 reports our empirical findings. Section 6 is
devoted to the robustness analysis and section 7 concludes.
2. An illustrative model of technology transfer
This section draws from section 3 of our companion paper (Crispolti and Marconi
(2003)) where we developed a simple production framework upon which we base our empirical
analysis. Our aim is to show explicitly the role of active and passive technology spillovers on
TFP.
Let’s consider a small open developing economy, which faces a perfectly elastic demand
in world markets and prices exogenously given.10 For simplicity, we assume that the country
8 See Keller (2002) for an exhaustive review of theoretical and econometric contributions.
9 Recent studies on technology transfers towards developing countries only draw attention to the tradechannel, neglecting the potential benefits stemming from the FDI channel (see for example Coe et al. (1997)).
10 The assumption of small open economy appears quite reasonable in the case of developing countries. “Thisallow us to study the channels through which world markets influence domestic behavior without our needing to

10
has one primary factor of production in fixed supply (labor), which is allocated over three
activities: (i) the production of the final good, (ii) the manufacturing of intermediate goods
and (iii) research. While the final good sector produces a homogenous good under perfect
competition, the intermediate good sector supplies differentiated inputs (i.e. distinct varieties)
each of them manufactured by a single monopolistic firm. Intermediate goods are traded and
the producing firms may be owned by national or foreign investors. Foreign inventors have
three choices: 1) produce the new variety by themselves in the home country and then export
it (trade channel); 2) produce the new variety in the developing country and sell it in the
market and abroad (FDI); 3) sell the licence to a firm owned by residents of the developing
country (licensing). We assume that from the inventor’s point of view the three alternatives are
equivalent, that is, in any event the inventor appropriates the discounted value of future profits
stemming from the production of the intermediate input. The intermediate goods firms control
and accumulate firm specific knowledge which, by improving labor productivity, reduces the
unit production cost. The firm specific knowledge is increased by allocating labor to the R&D
sector and it is only partially appropriable. Namely, we assume that while it provides the
exclusive right to produce an intermediate good (i.e. monopoly profits), at the same time,
spilling over the whole economy, it increases the general purpose knowledge stock which
everyone else can access to. Finally firms do not internalize their contribution to the general
purpose knowledge stock.
Formally, the production function of the final good has the following Cobb-Douglas
structure:
Y = (RLy)1−α
nXi=1
xαi with 0 < α < 1,(1)
where xi is the i-th intermediate input, Ly is the number of workers employed in the final
good sector and R is the general purpose knowledge stock available in this economy.11 The
j-th intermediate’s firm produces inputs and invests in knowledge capital according to the
following equations:
worry initially about the reverse feedback relationships” (Grossman and Helpman (1991), chapter 6, page 144).
11 In literature there are several ways of modelling it. For instance, by a weighted sum of the specificknowledge stocks belonging to all domestic and foreign firms operating in the economy, that is:

11
xj = RjLxj,(2)
·Rj = f (Rj, R, hj) with 0 < β < 1.(3)
Labor productivity in the intermediate goods sector coincides with the firm-specific stock of
knowledge, Rj, each firm can increase it investing in knowledge formation,·Rj, which builds
on firm-specific knowledge, general purpose knowledge and human capital (h). By increasing
their knowledge stock, firms improve their technology, reducing the cost of producing one
unit of output. We can think of the role of human capital as one that allow not only the
accumulation of this firm specific stock but also the diffusion of part of this knowledge to the
rest of the economy, to form the general purpose stock.12
In order to keep the analysis extremely simple, we assume that all the firms operating
in the economy are able to sell their goods at the same price, which must also be equal to
the international price.13 Since all intermediate inputs enter symmetrically in the final good
production function and, in equilibrium, each variety bears the same price, inputs will be
employed in the same quantity (i.e. X = nx). Using this assumption we can rewrite (1) as:
Y = (nR)1−αL1−αy Xα,(4)
R =
ndXj=1
ωjRj ;
ndXj=1
ωj = 1,
see Peretto and Smulders (2002) for further details.
12 On the formation of a general purpose knowledge stock see Romer (1990).
13 We could assume that the firms are symmetric (i.e. they have exactly the same production functions andface the same production costs), or we could introduce some kind of labor market segmentation that would allowus to have different wages to compensate for productivity differences. Since this is not the focus of our research,we would leave the choice open.

12
from which
TFP = (nR)1−α .(5)
Therefore, total factor productivity is a function of the number of varieties employed in
production (passive spillovers) and the stock of accumulated knowledge (active spillovers).
Notice that, while the number of varieties can be easily increased through international trade,
knowledge rises only if the country is actively involved in the production of technological
advanced goods or is able to capture and absorb foreign knowledge. Equation (4) and (5) will
be our theoretical benchmark in the empirical analysis.
3. Empirical implementation
In this section we estimate an empirical equation implied by the theoretical benchmark
model outlined in section 2. Ideally we would like to work on firm or industry level data, but
since they are not available, at least for a relevant sample of developing countries, we must
rely on aggregate data.
Equation (5) points out that TFP ultimately hinges upon the levels and the dynamics of
two crucial variables, namely the varieties of intermediate goods, n, and the accumulated
general purpose knowledge, R. Since both n and R are the outcome of cumulative past
research efforts reflecting past investments in R&D, it follows that TFP is eventually affected
by the R&D capital stock.14
Therefore, in order to ascertain whether trade in capital goods and inward FDI make
technology spill over internationally we set up an econometric model based on equation (5)
and investigates the impact of TRIAD’s R&D stocks on developing countries’ TFPs.
Our approach links TFP’s movements to proxies for the R&D content of imports and
FDI and to their interactions with a proxy of human capital investment: the domestic average
14 See Coe and Helpman (1995) for more details on the relationship between n and the R&D effort.

13
years of schooling, as calculated by Barro and Lee (2000) and Cohen and Soto (2001) over the
population of age 15 and plus.15
Our analysis follows the traditional international R&D spillover equation approach.
Hence, to test for trade and inward FDI as technology transfer channels, we estimate the
following equation:
(6) lnTFPit = αi + δt + β1 lnRtradeit + β2hit lnR
tradeit +
+ β3 lnRfdiit + β4hit lnR
fdiit + β5hit + ²it,
where αi and δt represent respectively the country-specific and time-specific dummies. Rtradeit
and Rfdiit are our measures for the foreign R&D capital stock which each developing country,
by means of the trade and FDI channels, may access to. Finally, hit is our proxy for the human
capital stock and ²it is an error term. Ideally the coefficients β1 and β3 would capture the
passive spillovers, that is effects on n, whereas β2 and β4 would capture the active spillovers,
such as those on R. The TFP measure is obtained according to the standard level accounting
procedures, therefore following Collins and Bosworth (1996) we set:16
\TFPit =µbyitbxαit
¶; where by = Y/hL, bx = X/hL and α = 0.35.
Notice that the labor force is augmented to take into account the average years of schooling of
the working population in each country.
Following Van Pottelsberghe de la Potterie and Lichtenberg (2001), our measures of
foreign R&D capital stocks are given by the sum of the products between each TRIAD member
15 We are aware of the criticisms that can be raised on the use of such a measure as a proxy of changes in thestock of human capital (see for example Hanushek (2000)), or as a proxy of the stock itself, nevertheless this isthe only measure available for a large group of developing countries and for a reasonable time length.
16 Collins and Bosworth (1996) point out that a reasonable range for the capital share, α, is 0.3 to 0.4.OECD economies are generally closer to the lower bound, whereas developing countries to the upper. In orderto minimize concern about the differences among the economies in the panel we follow the authors in setting αequal to 0.35.

14
R&D intensity and the bilateral capital good imports or the inward FDI positions respectively.
That is:
Rtradeit =Xj
mijt
µRjtGDPjt
¶and Rfdiit =
Xj
fijt
µRjtGDPjt
¶,(7)
with i ∈ i...N and j ∈ US, JP,EU ,
wheremijt stands for the bilateral capital good imports of the i-th developing country from the
j-th TRIAD’s member at time t. Accordingly, fijt is the j-th TRIAD’s country outward FDI
stock in the i-th developing country at time t. Finally, the R&D intensity in the j-th advanced
country at time t, (Rjt/GDPjt) , is given by the ratio of the j-th TRIAD member R&D capital
stock and its GDP. As in Coe and Helpman (1995), the domestic R&D capital stock for each
TRIAD’s country is derived making use of the following perpetual inventory formula:17
R&Dstockt = (1− δ)R&Dstock
t−1 +R&Dexpendituret where δ = 0.05,
where the R&D expenditure is in real terms (see the appendix for more details).
Notice that, as in Coe et al. (1997), our econometric model implies that the R&D capital
stock available to each developing countries reflects only the accessible foreign R&D capital
stock. That is, we assume that domestic R&D expenditures in our sample developing countries
are negligible. In the robustness section we will make some corrections to take into account
the fact that, despite the lack of data, we know that some of these countries actually do perform
relatively significant amounts of R&D.18
17 Coe and Helpman (1995) obtain alternative measures of R&D capital stocks assuming the obsolescencerate, δ, equal to 0.1 and 0.15. Since their results do not change significantly, we stick to their first assumption(i.e. δ = 0.05).
18 See Coe et al. (1997) for further details and Mayer (2001) for a list of countries that register significantR&D expenditures.

15
4. Data
Our empirical results are based on a panel of 45 developing countries over the period
1980-2000. Data for all countries are summarized in table 1. Most of the variables used in
the econometric analysis come from the Bosworth and Collins (1996) dataset, which provides
yearly figures for real GDP (Y ), real capital stock (X), labor force (L) and the average years
of schooling (our proxy for the level of human capital h). TRIAD’s figures on business
sector R&D expenditures come from the OECD’s Main Scientific and Technological Indicators
database. Bilateral trade and FDI data come, respectively, from the UN’s ComTrade dataset
and from the UNCTAD’s FDI dataset combined with the Eurostat’s NewCronos figures.19,20
It is worth noting that there is a remarkable difference in the quality of data for each
channel. While for the trade channel we consider bilateral imports of capital goods only, for
the FDI channel such a breakdown is not available, forcing us to consider the whole amount
of bilateral FDI stocks.
5. Empirical results
In tables 2 we report the regression results for different specifications of equations (6).
According to the panel cointegration literature, estimating the coefficients of (6) involves
some methodological issues related to the statistical properties of the variables at stake.21
Namely, if variables are cointegrated the OLS estimator does not provide consistent estimates
of the βs. Kao and Chiang (2000) show that there are alternative econometric techniques
which may be more promising in cointegrated panel regression.22 Phillips and Moon (2000)
and Pedroni (2004), extending a previous contribution by Phillips (1995), point out that the
19 As in Coe and and Helpman (1995) we use the bilateral imports of machinery and transport equipment(SITC 7, rev.2) as a proxy for the imports of capital goods.
20 Since bilateral FDI data are not available for all relevant declaring and partner countries, we estimate themmaking use of both the Eurostat’s database, which provides a regional breakdown for the TRIAD’s FDI outwardpositions, and UNCTAD’s dataset, which in turn supplies figures for the inward FDI positions in the relevant 45developing countries (see the appendix for more details).
21 See Baltagi (2001) and Phillips and Moon (1999) for a review.
22 See also Baltagi and Kao (2000), Banerjee (1999) and Pedroni (1999).

16
Fully Modified Ordinary Least Square estimator (FMOLS) yields consistent estimates of the
regression coefficients.
Since the variables in our panel turn out to be nonstationary and cointegrated, we
estimate the coefficients of equation (6) by FMOLS, thus we are estimating a long-run relation
between TFP and the R&D intensity of machinery imports and FDI23,24. In what follows
we investigate the technology transfer issue, first looking at each channel of transmission
separately, then at both channels simultaneously.
Trade channel
In regression (i) of table 2 we allow trade to be the only channel through which
developing countries may enjoy a technology transfer. The coefficient of the trade foreign
R&D capital stock turns out to be positive and within the range 0.04-0.26, which, in the field
literature, is believed to characterize less industrialized economies (Coe et al. (1997), note
12, page 143). In regression (ii) we investigate the potential role played by human capital
accumulated in each country. That is, we allow for the marginal effect of the foreign R&D
measure to depend on the level of h by introducing an interaction term in (6).25 Under this
new specification, two distinct effects on TFP are considered: a direct one, captured by the
coefficient β1 in regression (i) and an indirect one, represented by β2, which hinges upon the
average level of education attained by each developing country. According to regression (ii)
the trade foreign R&D capital stock continues to affect positively the TFP levels, but contrary
to regression (i) such an effect is indirect (β2 is significant and positive) rather than direct
(β1 is not significantly different from zero). Such a result would suggest that trading with
advanced countries may not be enough in order to enjoy a technology transfer, and that the
level of education, h, is relevant in determining the magnitude of the transfer.
23 The results of the unit root tests are reported in table 5.
24 That is, the residuals of the regression are integrated of order zero. Following Van pottelsberghe de laPotterie and Lichtenberg (2001) and Kao et al. (1999), in order to check for the stationarity of the error term,we perform several tests recently developed by Pedroni (1995) and Pesaran (1997), exploiting both the time andcountry dimension. The results of such tests are presented in table 2 for each and every specification of equation(6).
25 In this case the TFP elasticity to foreign R&D changes is given by β1 + β2 ∗H, whereH is some kind ofaverage ofH.

17
FDI channel
In regression (iii) we perform the same exercise on the FDI channel. Again, when we
do not control for the educational levels, we find that the FDI foreign R&D measure has
a significant and positive effect on the developing countries’ TFPs. But, once we add such a
control, the interaction term in regression (iv), we find again that the magnitude of the spillover
on developing countries’ TFPs depends on the level of education reached by the country.
As in regression (ii), the direct effect of the FDI foreign R&D turns out to be statistically
null, suggesting that attracting FDI is not sufficient to generate a technology transfer. On
the contrary, the indirect effect is significant and positively signed, showing that h plays an
important role in making the FDI foreign R&D variable effective.
In regressions (v) to (vi) we consider the two channels simultaneously, and, although,
as we would expect, the coefficients associated to each channel and to the interaction terms
are reduced, they are all sinificant, indicating that both channels do actually affect the TFP
and that not taking them into account simultaneously may lead to overestimate their impact on
TFP. Also, note that, while the coefficient on the FDI interaction is highly significant, that on
the interaction with trade is significant olnly at the 10% level. This result suggest that the level
of education may be particularly important for the FDI channel.26
6. Robustness
Table 3 presents the results of additional regressions run in order to check for the
soundness of our results. In so doing we focus our attention to the case of on the two channels
taken together.
Following the lines of Coe and Helpman (1995) and Grossman and Helpman (1991)
our estimates of (6) may suffer from the exclusion of a control for the relative size of sample
countries. Hence, what we have been capturing in regressions (v) to (vi) of table 2 might
actually be a “size” effect, rather than the impact of a true exposure to foreign technology.
We tackled this issue using the measure of real openness proposed by Alcalà and Ciccone
26 For a discussion on the issues related to FDI data see Xu (2000). It is important to underline that thesectoral composition of FDI is likely to be fundamental in determining the potential of technology transfer, withFDI in high-tech sectors having a greater potential. As we will argue later on, countries may fundamentally differin the sectoral composition of their FDI, with countries receiving FDI in technology advanced production andothers in low-tech or resource based production. The evidence shows that what matters is not only the amount,but also the quality of FDI in assessing the possibility to appropriate of foreign technology.

18
(2004) as a proxy for the country size.27 Columns (i) and (ii) report our results. Despite the
introduction of a new variable, estimates of the two channel’s effects are remarkably stable
both in terms of coefficients and of total elasticities, meaning that developing countries do
benefit from the exposure to foreign technology.
Columns (iii) and (iv) deal with another omitted variable issue. As mentioned in previous
sections while estimating regression (6) we did not take into account developing countries
domestic R&D expenditures. We argued that generally developing countries do not perform a
significant R&D effort and even if so, data on the business sector R&D stocks are not available
or highly incomplete for econometric analyses. Nevertheless some developing countries do
perform a relatively significant R&D expenditure. Therefore, as suggested in Mayer (2001),
we exclude from our sample those countries that are thought to undertake relevant domestic
R&D efforts.28 It is worth nothing that the excluded countries are also those with higher human
capital levels. Results still provide evidence in favor of technology transfers through both
channels, suggesting that neglecting domestic R&D efforts does not alter our results. However
as we would expect, since the average level of human capital is lower, total elasticities of
TFP to foreign R&D are significantly reduced, reinforcing the idea that countries with low
human capital and negligible domestic R&D benefit less from technology transfers, especially
through FDI.
In the remaining columns we check whether our findings are confirmed at regional
level. Namely, we estimate (6) by region: Asia, Africa and Latin America. Columns (v)
to (x) provide evidence in favor of our previous results, showing that the technology transfer
occurs in all regions, though with some interesting differences. We find that in all regions,
the trade related total elasticity of TFP to foreign R&D does not depend on human capital
(i.e. β2 is statistically null in all regions). Since trade in capital goods mostly involves passive
spillovers, it might be the case that such a channel does not necessary need human capital to
exert positive effects on TFP. On the contrary, except for the case of Asia, the positive effect of
the FDI channel ultimately hinges on education, providing evidence of the existence of active
27 This measure of real openness variable is given by exports plus imports in US$ exchange rate over GDP inpurchasing power parity US$ to take into account cross-country differences in the relative price of non-tradablegoods. See Alcalà and Ciccone (2004) for more details.
28 According to Mayer (2001) these countries are: Argentina, Brazil, Chile, China, India, Indonesia, Korea,Mexico, Pakistan, Singapore, Taiwan, Thailand and Venezuela.

19
spillovers. Such a result is particularly interesting. As we mentioned before, since we are
not able to control for the sectoral composition of FDI, the heterogeneity of FDI figures may
indeed hide very different realities that could ultimately lead to opposite conclusions in terms
of technology transfer potential of this channel. This seems to be the case in our region-specific
regressions. In Asia, where evidence at the regional level, suggest that most of the inward FDI
are directed toward the manufacturing sector, we get positive direct and indirect effects of
TRIAD’s R&D on TFPs. On the contrary, in Latin America, where the largest portion of FDI
goes to the tertiary sector (i.e. financial services and insurances), the overall positive effect of
foreign R&D is granted only because human capital is relatively high on average.29 Finally,
in Africa, the region with the lowest level of human capital, the positive impact of the FDI is
only through the interaction with human capital.30
7. Conclusion
Recent contributions to the growth theory point out the potential benefits for developing
countries of importing capital goods and attracting FDI in order to increase their TFP.
Given that technological progress is the result of cumulative investments in R&D and
that innovative activities are concentrated in few advanced economies, developing countries
through capital good imports and inward FDI positions, may not only access to foreign
technology, but also appropriate it.
In this paper we studied the extent to which R&D expenditures performed by the
TRIAD’s members affect TFP levels in a panel of 45 developing countries over the period
1980-2000. In so doing, we pay particular attention to the role of human capital in magnifiying
or inhibiting technology spillovers to these countries. Our measure of human capital consists
29 See Crispolti and Marconi (2003) for a more accurate description of the available evidence on FDI geo-graphical and sectoral breakdown.
30 According to the spatial econometric theory our results may suffer from some sort of spatial dependenceamong countries of the panel, that can be modeled by means of a weights’ matrix (see Anselin (1988)). Wechecked for that using the Stata routines spatwmat, spatreg and spatdiag written by M. Pisati. We constructedour matrix of of weights making use of the latitude and longitude measures provided by G. Clair, G. Gaulier, T.Mayer and S. Zignago [see www.cepii.fr/francgraph/bdd/distances.pdf for further information]. Although testsperformed on the residuals from the OLS estimate of regression (6) show that there exists spatial dependenceamong countries, the results does not differ significantly from our FMOLS results, in particular the maximumlikelihood estimates of all the relevant coefficients show the same signs and magnitudes of those from the FMOLSestimate. The results of these tests, which are not reported in the paper, are available from the authors uponrequest.

20
of the average level of education attained in each economy of the sample, the only proxy for
human capital available for a large number of countries and for a reasonable time span.
Using the FMOLS technique we estimate a cointegrated equation of international R&D
spillovers on TFP and we find that both channels (i.e. trade and FDI) induce a substantial
technology transfer across countries. Moreover, for a given amount of foreign R&D capital
stock, each developing country enjoys a bigger technology transfer the higher is its average
years of schooling. That is, the R&D content of capital good imports and FDI has not only
a positive direct effect, potentially equal for each country in the panel, but also an indirect
one, which makes the overall effect on TFP differ among countries according to their level of
education.

TABLES

Table 1
SUMMARY STATISTICSCountries TFP (1) TFP(2) Trade R&D capital stock FDI R&D capital stock Average year of education
ratio 2000 to 1980 average 1980-2000
Argentina 0.87 0.97 0.84 8.75 7.78Bangladesh 1.00 1.30 0.87 10.13 2.76Bolivia 0.77 0.92 0.85 7.70 6.03Brazil 0.64 0.90 2.45 7.21 4.99Cameroon 0.64 0.83 0.39 2.44 3.40Chile 1.25 1.36 1.75 31.00 7.91China 2.16 2.46 5.91 36.28 5.23Columbia 0.75 0.89 0.89 7.42 5.36Cote d’Ivoire 0.53 0.89 0.44 4.12 2.35Dominican Rep. 0.89 1.07 3.37 13.98 4.63Ecuador 0.74 0.83 0.56 6.17 6.59Egypt 0.75 1.26 1.04 5.88 4.51El Salvador 0.67 0.87 4.29 8.18 4.30Ghana 0.97 1.09 1.83 3.50 4.14Guatemala 0.72 0.94 1.50 3.12 3.42Honduras 0.65 0.82 1.24 10.30 4.41India 1.15 1.51 2.02 10.46 3.73Indonesia 0.77 1.00 1.46 3.84 4.90Kenya 0.81 1.01 0.55 1.65 4.32Korea 1.32 1.48 5.81 30.79 9.91Madagascar 0.56 0.81 0.52 5.84 2.89Malawi 0.99 1.31 0.33 3.13 3.04Malaysia 1.00 1.19 4.72 6.64 6.77Mali 0.73 1.00 0.80 26.04 0.80Mexico 0.71 0.88 3.94 7.67 6.54Mozambique 0.79 1.19 0.57 47.37 1.36Nicaragua 0.49 0.66 1.79 8.07 4.46Nigeria 0.45 0.85 0.23 5.35 2.64Pakistan 0.89 1.31 0.66 6.49 3.28Paraguay 0.67 0.75 1.25 3.73 5.81Peru 0.66 0.77 1.01 7.06 6.92Philippines 0.73 0.83 4.59 6.32 7.15Rwanda 0.46 0.58 0.31 3.01 2.12Senegal 0.87 1.13 1.11 3.62 2.07Singapore 1.26 1.54 4.09 10.05 6.66Sri Lanka 1.05 1.16 1.95 6.91 6.16Taiwan 1.54 1.58 5.71 7.56 8.05Thailand 1.06 1.37 5.30 16.24 5.74Trinidad and Tobago 0.82 0.86 0.83 4.58 8.09Tunisia 0.86 1.17 1.81 1.19 3.64Uganda 1.07 1.52 0.76 86.31 2.69Uruguay 0.91 1.04 0.96 1.84 7.13Venezuela 0.76 0.83 0.79 10.75 5.80Zambia 0.80 1.00 0.20 4.49 4.93Zimbabwe 0.69 1.03 1.57 3.71 5.46
Maximum 2.16 2.46 5.91 86.31 9.91Minimum 0.45 0.58 0.20 1.19 0.80Average 0.86 1.08 1.86 11.26 4.91
Regional averages
Africa (16 cnts) 0.73 1.02 0.64 3.27 3.15Asia (12 cnts) 1.06 1.30 4.34 12.90 5.86Latin America (17 cnts) 0.79 0.93 2.16 7.97 5.89

Table 2
TOTAL FACTOR PRODUCTIVITY RESULTSCoefficients Variables (i) (ii) (iii) (iv) (v) (vi)
Trade channel
β1 lnR&DTrade 0.1784‡ 0.0345 0.1602‡ 0.0675†β2 H ∗ lnR&DTrade 0.0215‡ 0.0102]
FDI channel
β3 lnR&DFDI 0.1257‡ 0.0289 0.0979‡ 0.0600‡β4 H ∗ lnR&DFDI 0.0234‡ 0.0090†
Control:
H NO YES NO YES NO YES
R2 adjusted 0.2669 0.3443 0.1443 0.2998 0.3543 0.4258
Total elasticity of TFP with respect to:
R&DTrade¡β1 + H ∗ β2
¢0.1784 0.1055 — — 0.1602 0.1176
R&DFDI¡β3 + H ∗ β4
¢— — 0.1257 0.1148 0.0979 0.1042
Cointegration tests
Pedroni’s tests (1995)PC1 -17.4236‡ -17.2285‡ -17.2447‡ -19.2717‡ -19.3149‡ -19.0730‡PC2 -17.0037‡ -16.8133‡ -16.8291‡ -18.8073‡ -18.8494‡ -18.6134‡
Pedroni’s tests (1999)Panel ν-statistic 1.02120 0.22182 -0.06285 -0.00996 -0.16744 -1.54764Panel ρ-statistic -1.74228† 1.56105 0.07073 2.07764 0.81060 4.60410Panel τ -statistic A -3.88695‡ -3.31096‡ -2.32463‡ -3.10283‡ -2.95307‡ -6.05980‡Panel τ -statistic B -3.84764‡ -3.25837‡ -1.64402† -5.02566‡ -2.73029‡ -4.18179‡Group ρ-statistic 0.47586 4.06644 2.26439 5.01782 3.03797 7.30621Group τ -statistic A -3.47871‡ -4.24269‡ -2.14760‡ -2.37227‡ -2.85070‡ -7.26478‡Group τ -statistic B -3.30124‡ -4.99685‡ -2.84197‡ -6.91386‡ -3.22804‡ -4.93258‡
Kao’s tests (1997)DF ρ-statistic 0.0808 0.3112 0.4675 -0.3541 -0.9052 -0.6053DF τρ-statistic -12.9073‡ -9.2907‡ -11.3502‡ -10.5760‡ -13.8413‡ -10.8487‡DF ρ∗-statistic -7.9172‡ -7.4473‡ -7.2262‡ -8.3997‡ -9.4329‡ -8.8334‡DF τ∗ρ-statistic -2.1268† -0.1385 -1.2033 -1.0438 -3.3645‡ -1.2659ADF (1 lag) 5.6192 5.6497 4.7712 4.3414 4.7812 4.9761
The dependent variable is ln(TFP). Regressions include unreported country and time specific effects. Definitions: H is the average year of schooling,
R&DTrade is the foreign R&D capital stock available through the trade channel,R&DFdi that through FDI. H is the H sample mean, H = 4.907757.
The t-statistics A is nonparametric, whereas B is parametric. ‡ indicates reject null hypothesis of no effects or no cointegration at 1% significance level, † at 5%
level and ] at 10%.

Table 3
ROBUSTNESS ANALYSISCoefficients Variables real openess domestic R&D
(i) (ii) (iii) (iv)
n=45; t=21; NT=950 n=32; t=21; NT=672
Trade channel:
β1 lnR&DTrade 0.1652‡ 0.0825‡ 0.1263‡ 0.0654]β2 H ∗ lnR&DTrade 0.0130† 0.0105]
FDI channel:
β3 lnR&DFDI 0.0937‡ 0.0599‡ 0.0552‡ 0.0432†β4 H ∗ lnR&DFDI 0.0094‡ 0.0048
Controls:
β5 H -0.2282‡ -0.1595‡β6 ln(real openess) -0.0741‡ -0.1186‡ -0.0518‡ -0.0741‡
R2 adjusted 0.3727 0.4489 0.2180 0.2469
Total elasticity of TFP with respect to:
R&DTrade¡β1 + H ∗ β2
¢0.1652 0.1463 0.1263 0.1115
R&DFDI¡β3 + H ∗ β4
¢0.0937 0.1060 0.0552 0.0432
H (average value) 4.907757 4.385465
Cointegration tests:
Pedroni’s tests (1995)
PC1 -19.6640‡ -19.7514‡ -16.8492‡ -16.5219‡PC2 -19.1901‡ -19.2754‡ -16.4431‡ -16.1237‡
Kao’s tests (1997)
DF ρ-statistic -1.1617 -0.9213 -0.9119 -0.7335DF τρ-statistic -14.0048‡ -11.2099‡ -10.6143‡ -9.0781‡DF ρ∗-statistic -9.8757‡ -9.3381‡ -8.2485‡ -7.8857‡DF τ∗ρ-statistic -3.6623‡ -1.6525† -2.9315‡ -1.4042]ADF (1 lag) 4.7292 4.9471 4.0677 4.1543
The dependent variable is ln(TFP). Regressions include unreported country-specific and time-specific effects. Definitions: H is the average year of
schooling, R&DTrade is the foreign R&D capital stock available through the trade channel, R&DFdi that through FDI. H is the H sample mean. In
regressions (iii) and (iv) the following countries were excluded from the panel: Argentina, Brazil, Chile, China, India, Indonesia, Korea, Mexico, Pakistan,
Singapore, Taiwan, Thailand and Venezuela. ‡ indicates reject null hypothesis of no effects or no cointegration at 1% significance level, † at 5% level and ] at
10%.

Table 3 (concluded)
ROBUSTNESS ANALYSISCoefficients Variables (vii) (viii) (ix) (x) (xi) (xii)
Asia Latin America Africa
n=12; t=21; NT=252 n=17; t=21; NT=357 n=16; t=21; NT=336
Trade channel:
β1 lnR&DTrade 0.2182‡ 0.2380‡ 0.1623‡ 0.2239‡ 0.1642‡ 0.1826‡β2 H ∗ lnR&DTrade -0.0066 -0.0054 -0.0021
FDI channel:
β3 lnR&DFDI 0.1572‡ 0.0961‡ 0.0638‡ -0.1123† 0.0731‡ 0.0193β4 H ∗ lnR&DFDI 0.0159‡ 0.0285‡ 0.0257‡
Controls:
β5 H -0.2687‡ -0.4331‡ -0.2006‡β6 ln(real openess) -0.2414‡ -0.2387‡ -0.1860 -0.1074‡ -0.0080 -0.0350
R2 adjusted 0.4780 0.6301 0.1811 0.5289 0.2694 0.3079
Total elasticity of TFP with respect to:
R&DTrade¡β1 + H ∗ β2
¢0.2182 0.2380 0.1623 0.2239 0.1642 0.1826
R&DFDI¡β3 + H ∗ β4
¢0.1572 0.1893 0.0638 0.0556 0.0731 0.0809
H (average value) 5.861731 5.892495 3.145991
Cointegration tests:
Pedroni’s tests (1995)
PC1 -12.4427‡ -15.5707‡ -9.6328‡ -13.7609‡ -14.4686‡ -14.8782‡PC2 -12.1429‡ -15.1955‡ -9.4007‡ -13.4293‡ -14.1199‡ -14.5196‡
Kao’s tests (1997)
DF ρ-statistic -1.1598 -2.7332‡ 0.0555 -1.7498† -1.9059† -2.0697†DF τρ-statistic -8.5156‡ -7.2124‡ -7.8955‡ -7.0277‡ -8.2385‡ -7.4297‡DF ρ∗-statistic -5.8603‡ -7.7235‡ -4.8765‡ -7.6080‡ -7.8278‡ -8.0057‡DF τ∗ρ-statistic -2.2612† -2.5646‡ -1.5283] -1.5956] -3.1647‡ -2.2951†ADF (1 lag) 1.4759 0.5482 3.3306 2.3728 2.3415 2.4016
The dependent variable is ln(TFP). Regressions include unreported country-specific and time-specific effects. Definitions: H is the average year of
schooling, R&DTrade is the foreign R&D capital stock available through the trade channel, R&DFdi that through FDI. H is the H sample mean. ‡
indicates reject null hypothesis of no effects or no cointegration at 1% significance level, † at 5% level and ] at 10%.

Table 4
SUMMARY STATISTICSVariable Mean Std.Dev. Min Max Observations
TFP overall -3.595 1.869 -7.402 0.388 N=945between 1.885 -7.223 0.059 n=45within 0.129 -4.327 -3.060 T=21
H overall 4.908 2.078 0.613 11.138 N=945between 2.025 0.795 9.906 n=45within 0.552 3.032 6.436 T=21
R&D Trade overall 5.222 1.742 1.475 9.420 N=945between 1.698 2.163 8.375 n=45within 0.462 3.717 6.490 T=21
R&D FDI overall 5.811 2.010 -0.156 11.064 N=945between 1.893 2.010 9.116 n=45within 0.729 3.645 9.152 T=21
H*(R&D Trade) overall 27.748 18.170 1.644 99.217 N=945between 17.496 2.346 80.166 n=45within 5.526 6.339 46.799 T=21
H*(R&D FDI) overall 31.034 19.314 -0.450 104.149 N=945between 18.181 1.931 71.083 n=45within 7.036 9.353 64.100 T=21
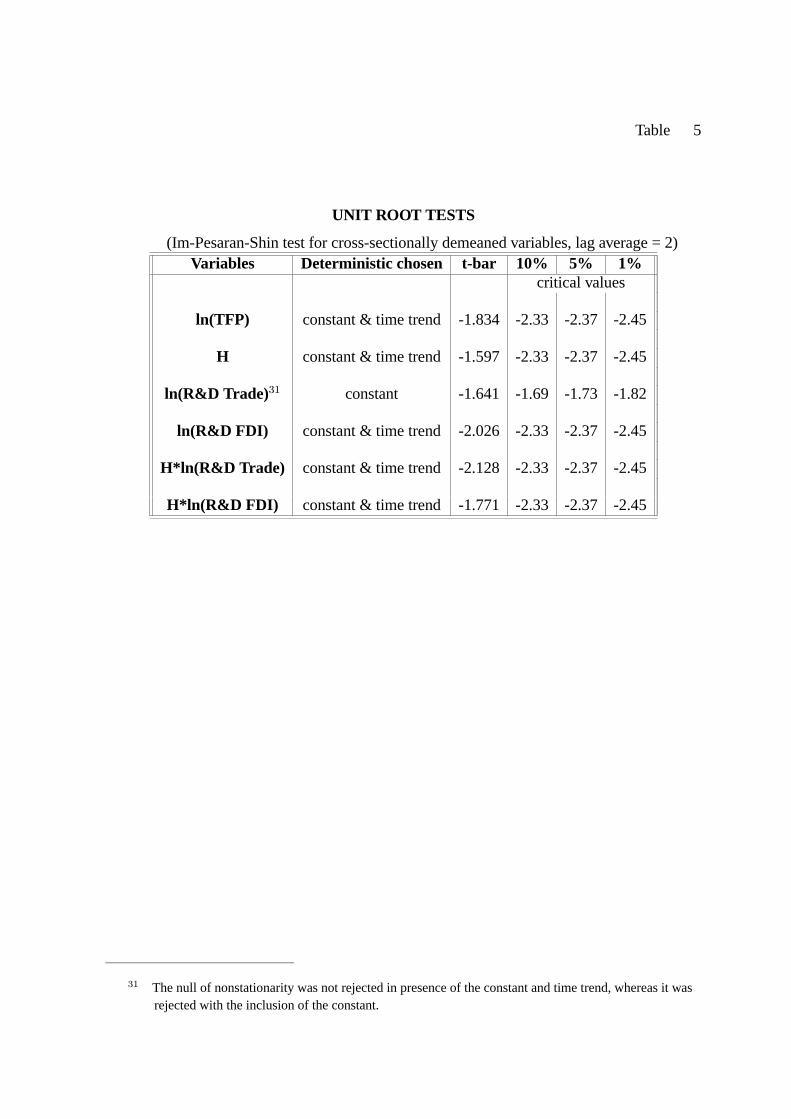
Table 5
UNIT ROOT TESTS
(Im-Pesaran-Shin test for cross-sectionally demeaned variables, lag average = 2)Variables Deterministic chosen t-bar 10% 5% 1%
critical values
ln(TFP) constant & time trend -1.834 -2.33 -2.37 -2.45
H constant & time trend -1.597 -2.33 -2.37 -2.45
ln(R&D Trade)31 constant -1.641 -1.69 -1.73 -1.82
ln(R&D FDI) constant & time trend -2.026 -2.33 -2.37 -2.45
H*ln(R&D Trade) constant & time trend -2.128 -2.33 -2.37 -2.45
H*ln(R&D FDI) constant & time trend -1.771 -2.33 -2.37 -2.45
31 The null of nonstationarity was not rejected in presence of the constant and time trend, whereas it was rejected with the inclusion of the constant.

Table 6
CORRELATIONS BETWEEN VARIABLESTFP H R&D Trade R&D FDI H*(R&D Trade) H*(R&D FDI)
TFP 1.000H -0.180 1.000
R&D Trade -0.142 0.586 1.000R&D FDI -0.197 0.603 0.858 1.000
H*(R&D Trade) -0.091 0.890 0.849 0.753 1.000H*(R&D FDI) -0.126 0.911 0.793 0.832 0.960 1.000

Appendix
7.1 FMOLS overview
In this section we provide a brief review of the FMOLS estimator, for a complete
overview the reader is referred to Baltagi and Kao (2000), Kao and Chiang (2000) and Phillips
and Moon (2000).
Consider the following fixed effect panel regression:
yit = αi + x0itβ + uit with i = 1, ..., N, t = 1, ..., T,(8)
where yit are scalars, β is a k× 1 vector of slopes, αi are the country intercepts and uitare the stationary disturbance terms. Assuming that xit are k × 1 processes integrated of
order one for all i, that is:
xit = xi(t−1) + εit,(9)
where εit is a white noise, equation (8) describes a system of cointegrated regressions. The
OLS estimator for βs is given by:
bβOLS ="N,TXi,t
(xit − xi)(xit − xi)0#−1 "N,TX
i,t
(xit − xi)(yit − yi)#.(10)
Under the assumptions that yit, xit are independent across cross-sectional units and
for any member of the panel the innovation vector, wit = (uit, ε0it)0 , satisfies some regular
conditions such that, as shown by Kao and Chiang (2000), the long-run covariance matrix of
wit is given by :
Ω = Σ+ Γ+ Γ0,(11)

30
with
Ω =∞X
j=−∞E (wijw
0i0) =
∙Ωu ΩuεΩεu Ωε
¸,
Γ =∞Xj=1
E (wijw0i0) =
∙Γu ΓuεΓεu Γε
¸,
Σ = E (wi0w0i0) =
∙Σu ΣuεΣεu Σε
¸,
and the one-sided long run covariance by:
∆ = Σ+ Γ,(12)
with
∆ =∞Xj=0
E (wijw0i0) =
∙∆u ∆uε
∆εu ∆ε
¸,(13)
the OLS estimator is biased, that is:
T³bβOLS − β
´p−→ −3Ω−1ε Ωεu + 6Ω
−1ε ∆εu,(14)
and
√NT
³bβOLS − β´−√NδNT =⇒ N
¡0, 6Ω−1ε Ωu.ε
¢,(15)

31
where
Ωu.ε ≡ Ωu − ΩuεΩ−1ε Ωεu,(16)
and
δNTp−→ 6Ω−1ε
µ−12Ωεu +∆εu
¶.(17)
Equation (17) shows that ultimately the bias depends on the endogeneity of regressors,
accounted by Ωεu term, and the serial correlation of disturbances, captured by ∆εu term.
The FMOLS estimator, therefore, corrects for these drawbacks, transforming the
dependent variable and the residual properly. Defining
u+it = uit − ΩuεΩ−1ε εit,(18)
bu+it = uit − bΩuεbΩ−1ε εit,(19)
y+it = yit − ΩuεΩ−1ε ∆xit,(20)
and
by+it = yit − bΩuεbΩ−1ε ∆xit,(21)

32
where bΩs are consistent estimates of Ωs. The endogeneity correction is achieved transforming
(8) in the following way:
by+it = αi + x0itβ + uit − bΩuεbΩ−1ε ∆xit.(22)
The serial correlation is swept out using the term:
b∆+εu = b∆εu − b∆ε
bΩ−1ε bΩuε,(23)
where b∆s are kernel estimates of ∆s.
Hence the FMOLS estimator is given by:
bβFM =
"N,TXi,t
(xit − xi)(xit − xi)0#−1 " NX
i
ÃTXt
(xit − xi)by+it − T b∆+εu
!#,(24)
and it converges asymptotically to:
√NT
³bβFM − β´=⇒ N
¡0, 2Ω−1ε Ωu.ε
¢.(25)
7.2 Estimates of the bilateral FDI positions
Making use of the Eurostat dataset we obtain the FDI outward positions of United States,
Japan and European Union in the following regions: Africa, Asia and Latin America.
Moreover, assuming that the sum of the TRIAD’s FDI positions accounts for 100% of
the FDI inward positions in such regions, we derive the following shares:
regions United States Japan European Union Total
Africa 0.277934 0.016493 0.705573 1.000Asia 0.387114 0.292448 0.320438 1.000Latin America 0.520446 0.066946 0.412608 1.000

33
Finally, we impose that each TRIAD’s member invests in the countries belonging to
these regions according to such shares and we obtain the bilateral inward FDI positions for
each developing country in the panel simply applying the shares to the UNCTAD’s FDI figures.
7.3 Real business sector R&D
Following Coe and Helpman (1995) real business sector R&D expenditures are obtained
dividing the nominal expenditures by an R&D price index (PR) defined as follows:
PR = 0.5 ∗ P + 0.5 ∗W,
where P stands for the implicit deflator of the business sector output, obtained by the OECD
STAN dataset. Whereas W is an index of the average business sector wages (same source of
P ).
7.4 Initial conditions for the R&D capital stock
Following Griliches(1979):
R&DSTOCKt0
=R&DEXPENDITURE
t0
δ + g,
where δ, the depreciation rate, is equal to 0.05 and g is the average annual growth rate of the
business sector R&D expenditures over the period for which published R&D data are available.
TheR&DEXPENDITUREt0
is the first year for which the data are available andR&DSTOCKt0
is
the benchmark for the beginning of the period.

References
Aghion, P. and P. Howitt (1998), Endogenous Growth Theory, Cambridge, The MIT Press.
Alcalà, F. and A. Ciccone (2004), ”Trade and productivity”, The Quarterly Journal ofEconomics, Vol. 119, No. 2, pp. 613-46.
Anselin, L. (1988), Spatial Econometrics: Methods and Models, Dordrecht, Kluwer AcademicPublishers.
Baltagi, B. H. (2001), Econometric analysis of Panel Data, 2nd ed., Chichester, John Wiley &Sons.
Baltagi, B. H. and C. Kao (2000), ”Nonstationary panels, cointegration in panels and dynamicpanels: A survey”, Advanced in Econometrics, Vol.15.
Banerjee, A. (1999), ”Panel data unit roots and cointegration: An overview”, Oxford Bulletinof Economics and Statistics, Special Issue pp. 607-29.
Barro, R. and J. W. Lee (2000), ”International data on education attainment,updates andimplications”, NBER Working Paper No.7911.
Bayoumi, T., D. Coe and E. Helpman (1996), ”R&D spillovers and global growth”, CEPRDiscussion Paper No.1467.
Coe, T. and E. Helpman (1995), ”International R&D spillovers”, European Economic Review,Vol.39, pp. 859-87.
Coe, T., E. Helpman. and A. Hoffmaister (1997), ”North-south R&D spillovers”, EconomicJournal, Vol. 107, pp. 134-49.
Cohen, D. and M. Soto (2001), ”Growth and human capital: Good data, good results”, CEPRDiscussion Paper No.3025.
Collins, S. M. and B. P. Bosworth (1996), ”Economic growth in east asia: Accumulation versusassimilation”, Brooking Papers on Economic Activity, Vol. 2, 135-91.
Connolly, M. (2003), ”The dual nature of trade: measuring the impact on imitation andgrowth”, Journal of Development Economics, Vol. 72, No. 1, pp. 31-55.
Crispolti, V. and D. Marconi (2003), ”Technology transfer and economic growth in developingcountries”, Mimeo.
Griliches, Z (1979), ”Issues in assessing the contribution of R&D to productivity growth”, BellJournal of Economic, Vol. 10, 92-116.
Grossman, G. M. and E. Helpman (1991), Innovation and Growth in the Global Economy,Cambridge, The MIT Press .

35
Hanushek, E. and D. Kimko (2000), ”Schooling, labor-force quality, and the growth ofnations”, American Economic Review, Vol. 90, No.5, 1184-1208.
Jones, C. I. (1995), ”R&D based models of economic growth”, Journal of Political Economy,Vol 103, No.4, 759-83.
Kao, C. and M. H. Chiang (2000), ”On estimation and inference of a cointegrated regression inpanel data, Nonstationary Panels, Panel Cointegration and Dynamic Panels”, Advancesin Econometrics, Vol. 15 pp. 179-222.
Kao, C., Chiang, M.-H. and B. Chen (1999), ”International R&D spillovers: An applicationof estimation and inference in panel cointegration”, Oxford Bulletin of Economics andStatistics, Special Issue pp. 691-709.
Keller,W. (2002), ”International technology diffusion”, CEPR Discussion Paper No. 3133.
Mayer, J. (2001), ”Technology diffusion, human capital and economic growth in developingcountries”, UNCTAD Discussion Paper No. 154.
National Science board (2002), Science and Engineering Indicators 2002, Arlington, VA:National Science Foundation.
OECD (2001), ”Growth, technology transfer and foreign direct investment”, Global Forum onInternational Investment , Mexico City.
Pedroni, P. (2004), ”Panel cointegration: Asymptotic and finite sample properties of pooledtime series tests with an application to the purchasing power parity hypothesis”,Econometric Theory, Vol. 20, pp. 597-325.
Peretto, P. and S. Smulders (2002), ”Technological distance, growth and scale effects”,Economic Journal, Vol. 112, No. 481, pp. 603-24.
Pesaran, M. H. and Y. S. R. Shin (1997), ”Pooled estimation of long-run relationships indynamic heterogeneous panels”. Unpublished Manuscript.
Phillips, P. C. B. (1995), ”Fully modified least squares and vector autoregression”,Econometrica, Vol. 63, No.5, pp. 1023-78.
Phillips, P. C. B. and H. R. Moon (1999), ”Linear regression limit theory for nonstationarypanel data”, Econometrica, Vol. 67, No. 5, pp. 1057-11.
Phillips, P. C. B. and H. R. Moon (2000), ”Nonstationary panel data analysis: An overview ofsome recent developments”, Econometric Review, Vol. 19, No.3, pp. 263-86.
Saggi, K. (2000), ”Trade, foreign direct investment, and international technology transfer: Asurvey”, World Bank, Policy Research Paper No.2349.
Solow, R. (1956), ”A contribution to the theory of economic growth”, Quarterly Journal ofEconomics, Vol. 70, pp. 65-94.

36
Van Pottelsberghe de la Potterie, B. and F. Lichtenberg (1998), ”International R&D spillovers:A comment”, European Economic Review, Vol. 42, No. 8, pp. 1483-91.
Van Pottelsberghe de la Potterie, B. and F. Lichtenberg (2001), ”Does foreign direct investmenttransfer technology across borders?”, Review of Economics and Statistics, Vol. 83, No.3, pp. 490-97.
Xu, B. (2000), ”Multinational enterprises, technology diffusion and host countryproductivity”, Journal of Development Economics Vol. 62, No. 2, 477-93.
Xu, B. and J. Wang (1999), ”Capital goods trade and r&d spillovers in the OECD”, CanadianJournal of Economics Vol. 32, No. 5, pp. 1258-74.
Xu, B. and J. Wang (2001), ”Trade, FDI, and international technology diffusion”, Journal ofEconomic Integration, Vol. 15, No. 4, 585-601.

(*) Requests for copies should be sent to: Banca d’Italia – Servizio Studi – Divisione Biblioteca e pubblicazioni – Via Nazionale, 91 – 00184 Rome(fax 0039 06 47922059). They are available on the Internet www.bancaditalia.it.
RECENTLY PUBLISHED “TEMI” (*).
N. 539 – La crescita dell’economia italiana negli anni novanta tra ritardo tecnologico e rallentamento della produttività, by A. BASSANETTI, M. IOMMI, C. JONA-LASINIO and F. ZOLLINO (December 2004).
N. 540 – Cyclical sensitivity of fiscal policies based on real-time data, by L. FORNI and S. MOMIGLIANO (December 2004).
N. 541 – L’introduzione dell’euro e le politiche di prezzo: analisi di un campione di dati individuali, by E. GAIOTTI and F. LIPPI (February 2005).
N. 542 – How do banks set interest rates?, by L. GAMBACORTA (February 2005).
N. 543 – Maxmin portfolio choice, by M. TABOGA (February 2005).
N. 544 – Forecasting output growth and inflation in the euro area: are financial spreads useful?, by A. NOBILI (February 2005).
N. 545 – Can option smiles forecast changes in interest rates? An application to the US, the UK and the Euro Area, by M. PERICOLI (February 2005).
N. 546 – The role of risk aversion in predicting individual behavior, by L. GUISO and M. PAIELLA (February 2005).
N. 547 – Prices, product differentiation and quality measurement: a comparison between hedonic and matched model methods, by G. M. TOMAT (February 2005).
N. 548 – The Basel Committee approach to risk weights and external ratings: what do we learn from bond spreads?, by A. RESTI and A. SIRONI (February 2005).
N. 549 – Firm size distribution: do financial constraints explain it all? Evidence from survey data, by P. ANGELINI and A. GENERALE (June 2005).
N. 550 – Proprietà, controllo e trasferimenti nelle imprese italiane. Cosa è cambiato nel decennio 1993-2003?, by S. GIACOMELLI and S. TRENTO (June 2005).
N. 551 – Quota dei Profitti e redditività del capitale in Italia: un tentativo di interpretazione, by R. TORRINI (June 2005).
N. 552 – Hiring incentives and labour force participation in Italy, by P. CIPOLLONE, C. DI MARIA and A. GUELFI (June 2005).
N. 553 – Trade credit as collateral, by M. OMICCIOLI (June 2005).
N. 554 – Where do human capital externalities end up?, by A. DALMAZZO and G. DE BLASIO (June 2005).
N. 555 – Do capital gains affect consumption? Estimates of wealth effects from italian households’ behavior, by L. GUISO, M. PAIELLA and I. VISCO (June 2005).
N. 556 – Consumer price setting in Italy, by S. FABIANI, A. GATTULLI, R. SABBATINI and G. VERONESE (June 2005).
N. 557 – Distance, bank heterogeneity and entry in local banking markets, by R. FELICI and M. PAGNINI (June 2005).
N. 558 – International specialization models in Latin America: the case of Argentina, by P. CASELLI and A. ZAGHINI (June 2005).
N. 559 – Caratteristiche e mutamenti della specializzazione delle esportazioni italiane, by P. MONTI (June 2005).
N. 560 – Regulation, formal and informal enforcement and the development of the household loan market. Lessons from Italy, by L. CASOLARO, L. GAMBACORTA and L. GUISO (September 2005).
N. 561 – Testing the “Home market effect” in a multi-country world: a theory-based approach, by K. BEHRENS, A. R. LAMORGESE, G. I. P. OTTAVIANO and T. TABUCHI (September 2005).
N. 562 – Banks’ participation in the eurosystem auctions and money market integration, by G. BRUNO, M. ORDINE and A. SCALIA (September 2005).
N. 563 – Le strategie di prezzo delle imprese esportatrici italiane, by M. BUGAMELLI and R. TEDESCHI (November 2005).

"TEMI" LATER PUBLISHED ELSEWHERE
1999
L. GUISO and G. PARIGI, Investment and demand uncertainty, Quarterly Journal of Economics, Vol. 114 (1), pp. 185-228, TD No. 289 (November 1996).
A. F. POZZOLO, Gli effetti della liberalizzazione valutaria sulle transazioni finanziarie dell’Italia con l’estero, Rivista di Politica Economica, Vol. 89 (3), pp. 45-76, TD No. 296 (February 1997).
A. CUKIERMAN and F. LIPPI, Central bank independence, centralization of wage bargaining, inflation and unemployment: theory and evidence, European Economic Review, Vol. 43 (7), pp. 1395-1434, TD No. 332 (April 1998).
P. CASELLI and R. RINALDI, La politica fiscale nei paesi dell’Unione europea negli anni novanta, Studi e note di economia, (1), pp. 71-109, TD No. 334 (July 1998).
A. BRANDOLINI, The distribution of personal income in post-war Italy: Source description, data quality, and the time pattern of income inequality, Giornale degli economisti e Annali di economia, Vol. 58 (2), pp. 183-239, TD No. 350 (April 1999).
L. GUISO, A. K. KASHYAP, F. PANETTA and D. TERLIZZESE, Will a common European monetary policy have asymmetric effects?, Economic Perspectives, Federal Reserve Bank of Chicago, Vol. 23 (4), pp. 56-75, TD No. 384 (October 2000).
2000
P. ANGELINI, Are banks risk-averse? Timing of the operations in the interbank market, Journal of Money, Credit and Banking, Vol. 32 (1), pp. 54-73, TD No. 266 (April 1996).
F. DRUDI and R. GIORDANO, Default Risk and optimal debt management, Journal of Banking and Finance, Vol. 24 (6), pp. 861-892, TD No. 278 (September 1996).
F. DRUDI and R. GIORDANO, Wage indexation, employment and inflation, Scandinavian Journal of Economics, Vol. 102 (4), pp. 645-668, TD No. 292 (December 1996).
F. DRUDI and A. PRATI, Signaling fiscal regime sustainability, European Economic Review, Vol. 44 (10), pp. 1897-1930, TD No. 335 (September 1998).
F. FORNARI and R. VIOLI, The probability density function of interest rates implied in the price of options, in: R. Violi, (ed.) , Mercati dei derivati, controllo monetario e stabilità finanziaria, Il Mulino, Bologna, TD No. 339 (October 1998).
D. J. MARCHETTI and G. PARIGI, Energy consumption, survey data and the prediction of industrial production in Italy, Journal of Forecasting, Vol. 19 (5), pp. 419-440, TD No. 342 (December 1998).
A. BAFFIGI, M. PAGNINI and F. QUINTILIANI, Localismo bancario e distretti industriali: assetto dei mercati del credito e finanziamento degli investimenti, in: L.F. Signorini (ed.), Lo sviluppo locale: un'indagine della Banca d'Italia sui distretti industriali, Donzelli, TD No. 347 (March 1999).
A. SCALIA and V. VACCA, Does market transparency matter? A case study, in: Market Liquidity: Research Findings and Selected Policy Implications, Basel, Bank for International Settlements, TD No. 359 (October 1999).
F. SCHIVARDI, Rigidità nel mercato del lavoro, disoccupazione e crescita, Giornale degli economisti e Annali di economia, Vol. 59 (1), pp. 117-143, TD No. 364 (December 1999).
G. BODO, R. GOLINELLI and G. PARIGI, Forecasting industrial production in the euro area, Empirical Economics, Vol. 25 (4), pp. 541-561, TD No. 370 (March 2000).
F. ALTISSIMO, D. J. MARCHETTI and G. P. ONETO, The Italian business cycle: Coincident and leading indicators and some stylized facts, Giornale degli economisti e Annali di economia, Vol. 60 (2), pp. 147-220, TD No. 377 (October 2000).
C. MICHELACCI and P. ZAFFARONI, (Fractional) Beta convergence, Journal of Monetary Economics, Vol. 45, pp. 129-153, TD No. 383 (October 2000).
R. DE BONIS and A. FERRANDO, The Italian banking structure in the nineties: testing the multimarket contact hypothesis, Economic Notes, Vol. 29 (2), pp. 215-241, TD No. 387 (October 2000).
2001
M. CARUSO, Stock prices and money velocity: A multi-country analysis, Empirical Economics, Vol. 26 (4), pp. 651-72, TD No. 264 (February 1996).
P. CIPOLLONE and D. J. MARCHETTI, Bottlenecks and limits to growth: A multisectoral analysis of Italian industry, Journal of Policy Modeling, Vol. 23 (6), pp. 601-620, TD No. 314 (August 1997).
P. CASELLI, Fiscal consolidations under fixed exchange rates, European Economic Review, Vol. 45 (3), pp. 425-450, TD No. 336 (October 1998).
F. ALTISSIMO and G. L. VIOLANTE, Nonlinear VAR: Some theory and an application to US GNP and unemployment, Journal of Applied Econometrics, Vol. 16 (4), pp. 461-486, TD No. 338 (October 1998).
F. NUCCI and A. F. POZZOLO, Investment and the exchange rate, European Economic Review, Vol. 45 (2), pp. 259-283, TD No. 344 (December 1998).
L. GAMBACORTA, On the institutional design of the European monetary union: Conservatism, stability pact and economic shocks, Economic Notes, Vol. 30 (1), pp. 109-143, TD No. 356 (June 1999).
P. FINALDI RUSSO and P. ROSSI, Credit costraints in italian industrial districts, Applied Economics, Vol. 33 (11), pp. 1469-1477, TD No. 360 (December 1999).
A. CUKIERMAN and F. LIPPI, Labor markets and monetary union: A strategic analysis, Economic Journal, Vol. 111 (473), pp. 541-565, TD No. 365 (February 2000).
G. PARIGI and S. SIVIERO, An investment-function-based measure of capacity utilisation, potential output and utilised capacity in the Bank of Italy’s quarterly model, Economic Modelling, Vol. 18 (4), pp. 525-550, TD No. 367 (February 2000).
F. BALASSONE and D. MONACELLI, Emu fiscal rules: Is there a gap?, in: M. Bordignon and D. Da Empoli (eds.), Politica fiscale, flessibilità dei mercati e crescita, Milano, Franco Angeli, TD No. 375 (July 2000).
A. B. ATKINSON and A. BRANDOLINI, Promise and pitfalls in the use of “secondary" data-sets: Income inequality in OECD countries, Journal of Economic Literature, Vol. 39 (3), pp. 771-799, TD No. 379 (October 2000).
D. FOCARELLI and A. F. POZZOLO, The determinants of cross-border bank shareholdings: An analysis with bank-level data from OECD countries, Journal of Banking and Finance, Vol. 25 (12), pp. 2305-2337, TD No. 381 (October 2000).
M. SBRACIA and A. ZAGHINI, Expectations and information in second generation currency crises models, Economic Modelling, Vol. 18 (2), pp. 203-222, TD No. 391 (December 2000).
F. FORNARI and A. MELE, Recovering the probability density function of asset prices using GARCH as diffusion approximations, Journal of Empirical Finance, Vol. 8 (1), pp. 83-110, TD No. 396 (February 2001).
P. CIPOLLONE, La convergenza dei salari manifatturieri in Europa, Politica economica, Vol. 17 (1), pp. 97-125, TD No. 398 (February 2001).
E. BONACCORSI DI PATTI and G. GOBBI, The changing structure of local credit markets: Are small businesses special?, Journal of Banking and Finance, Vol. 25 (12), pp. 2209-2237, TD No. 404 (June 2001).
G. MESSINA, Decentramento fiscale e perequazione regionale. Efficienza e redistribuzione nel nuovo sistema di finanziamento delle regioni a statuto ordinario, Studi economici, Vol. 56 (73), pp. 131-148, TD No. 416 (August 2001).
2002
R. CESARI and F. PANETTA, Style, fees and performance of Italian equity funds, Journal of Banking and Finance, Vol. 26 (1), TD No. 325 (January 1998).
L. GAMBACORTA, Asymmetric bank lending channels and ECB monetary policy, Economic Modelling, Vol. 20 (1), pp. 25-46, TD No. 340 (October 1998).
C. GIANNINI, “Enemy of none but a common friend of all”? An international perspective on the lender-of-last-resort function, Essay in International Finance, Vol. 214, Princeton, N. J., Princeton University Press, TD No. 341 (December 1998).
A. ZAGHINI, Fiscal adjustments and economic performing: A comparative study, Applied Economics, Vol. 33 (5), pp. 613-624, TD No. 355 (June 1999).
F. ALTISSIMO, S. SIVIERO and D. TERLIZZESE, How deep are the deep parameters?, Annales d’Economie et de Statistique,.(67/68), pp. 207-226, TD No. 354 (June 1999).
F. FORNARI, C. MONTICELLI, M. PERICOLI and M. TIVEGNA, The impact of news on the exchange rate of the lira and long-term interest rates, Economic Modelling, Vol. 19 (4), pp. 611-639, TD No. 358 (October 1999).
D. FOCARELLI, F. PANETTA and C. SALLEO, Why do banks merge?, Journal of Money, Credit and Banking, Vol. 34 (4), pp. 1047-1066, TD No. 361 (December 1999).
D. J. MARCHETTI, Markup and the business cycle: Evidence from Italian manufacturing branches, Open Economies Review, Vol. 13 (1), pp. 87-103, TD No. 362 (December 1999).
F. BUSETTI, Testing for stochastic trends in series with structural breaks, Journal of Forecasting, Vol. 21 (2), pp. 81-105, TD No. 385 (October 2000).
F. LIPPI, Revisiting the Case for a Populist Central Banker, European Economic Review, Vol. 46 (3), pp. 601-612, TD No. 386 (October 2000).
F. PANETTA, The stability of the relation between the stock market and macroeconomic forces, Economic Notes, Vol. 31 (3), TD No. 393 (February 2001).
G. GRANDE and L. VENTURA, Labor income and risky assets under market incompleteness: Evidence from Italian data, Journal of Banking and Finance, Vol. 26 (2-3), pp. 597-620, TD No. 399 (March 2001).
A. BRANDOLINI, P. CIPOLLONE and P. SESTITO, Earnings dispersion, low pay and household poverty in Italy, 1977-1998, in D. Cohen, T. Piketty and G. Saint-Paul (eds.), The Economics of Rising Inequalities, pp. 225-264, Oxford, Oxford University Press, TD No. 427 (November 2001).
L. CANNARI and G. D’ALESSIO, La distribuzione del reddito e della ricchezza nelle regioni italiane, Rivista Economica del Mezzogiorno (Trimestrale della SVIMEZ), Vol. XVI (4), pp. 809-847, Il Mulino, TD No. 482 (June 2003).
2003
F. SCHIVARDI, Reallocation and learning over the business cycle, European Economic Review, , Vol. 47 (1), pp. 95-111, TD No. 345 (December 1998).
P. CASELLI, P. PAGANO and F. SCHIVARDI, Uncertainty and slowdown of capital accumulation in Europe, Applied Economics, Vol. 35 (1), pp. 79-89, TD No. 372 (March 2000).
P. ANGELINI and N. CETORELLI, The effect of regulatory reform on competition in the banking industry, Federal Reserve Bank of Chicago, Journal of Money, Credit and Banking, Vol. 35, pp. 663-684, TD No. 380 (October 2000).
P. PAGANO and G. FERRAGUTO, Endogenous growth with intertemporally dependent preferences, Contribution to Macroeconomics, Vol. 3 (1), pp. 1-38, TD No. 382 (October 2000).
P. PAGANO and F. SCHIVARDI, Firm size distribution and growth, Scandinavian Journal of Economics, Vol. 105 (2), pp. 255-274, TD No. 394 (February 2001).
M. PERICOLI and M. SBRACIA, A Primer on Financial Contagion, Journal of Economic Surveys, Vol. 17 (4), pp. 571-608, TD No. 407 (June 2001).
M. SBRACIA and A. ZAGHINI, The role of the banking system in the international transmission of shocks, World Economy, Vol. 26 (5), pp. 727-754, TD No. 409 (June 2001).
E. GAIOTTI and A. GENERALE, Does monetary policy have asymmetric effects? A look at the investment decisions of Italian firms, Giornale degli Economisti e Annali di Economia, Vol. 61 (1), pp. 29-59, TD No. 429 (December 2001).
L. GAMBACORTA, The Italian banking system and monetary policy transmission: evidence from bank level data, in: I. Angeloni, A. Kashyap and B. Mojon (eds.), Monetary Policy Transmission in the Euro Area, Cambridge, Cambridge University Press, TD No. 430 (December 2001).
M. EHRMANN, L. GAMBACORTA, J. MARTÍNEZ PAGÉS, P. SEVESTRE and A. WORMS, Financial systems and the role of banks in monetary policy transmission in the euro area, in: I. Angeloni, A. Kashyap and B. Mojon (eds.), Monetary Policy Transmission in the Euro Area, Cambridge, Cambridge University Press, TD No. 432 (December 2001).

F. SPADAFORA, Financial crises, moral hazard and the speciality of the international market: further evidence from the pricing of syndicated bank loans to emerging markets, Emerging Markets Review, Vol. 4 ( 2), pp. 167-198, TD No. 438 (March 2002).
D. FOCARELLI and F. PANETTA, Are mergers beneficial to consumers? Evidence from the market for bank deposits, American Economic Review, Vol. 93 (4), pp. 1152-1172, TD No. 448 (July 2002).
E.VIVIANO, Un'analisi critica delle definizioni di disoccupazione e partecipazione in Italia, Politica Economica, Vol. 19 (1), pp. 161-190, TD No. 450 (July 2002).
M. PAGNINI, Misura e Determinanti dell’Agglomerazione Spaziale nei Comparti Industriali in Italia, Rivista di Politica Economica, Vol. 3 (4), pp. 149-196, TD No. 452 (October 2002).
F. BUSETTI and A. M. ROBERT TAYLOR, Testing against stochastic trend and seasonality in the presence of unattended breaks and unit roots, Journal of Econometrics, Vol. 117 (1), pp. 21-53, TD No. 470 (February 2003).
2004
F. LIPPI, Strategic monetary policy with non-atomistic wage-setters, Review of Economic Studies, Vol. 70 (4), pp. 909-919, TD No. 374 (June 2000).
P. CHIADES and L. GAMBACORTA, The Bernanke and Blinder model in an open economy: The Italian case, German Economic Review, Vol. 5 (1), pp. 1-34, TD No. 388 (December 2000).
M. BUGAMELLI and P. PAGANO, Barriers to Investment in ICT, Applied Economics, Vol. 36 (20), pp. 2275-2286, TD No. 420 (October 2001).
A. BAFFIGI, R. GOLINELLI and G. PARIGI, Bridge models to forecast the euro area GDP, International Journal of Forecasting, Vol. 20 (3), pp. 447-460,TD No. 456 (December 2002).
D. AMEL, C. BARNES, F. PANETTA and C. SALLEO, Consolidation and Efficiency in the Financial Sector: A Review of the International Evidence, Journal of Banking and Finance, Vol. 28 (10), pp. 2493-2519, TD No. 464 (December 2002).
M. PAIELLA, Heterogeneity in financial market participation: appraising its implications for the C-CAPM, Review of Finance, Vol. 8, pp. 1-36, TD No. 473 (June 2003).
E. BARUCCI, C. IMPENNA and R. RENÒ, Monetary integration, markets and regulation, Research in Banking and Finance, (4), pp. 319-360, TD No. 475 (June 2003).
E. BONACCORSI DI PATTI and G. DELL’ARICCIA, Bank competition and firm creation, Journal of Money Credit and Banking, Vol. 36 (2), pp. 225-251, TD No. 481 (June 2003).
R. GOLINELLI and G. PARIGI, Consumer sentiment and economic activity: a cross country comparison, Journal of Business Cycle Measurement and Analysis, Vol. 1 (2), pp. 147-172, TD No. 484 (September 2003).
L. GAMBACORTA and P. E. MISTRULLI, Does bank capital affect lending behavior?, Journal of Financial Intermediation, Vol. 13 (4), pp. 436-457, TD No. 486 (September 2003).
F. SPADAFORA, Il pilastro privato del sistema previdenziale: il caso del Regno Unito, Rivista Economia Pubblica, (5), pp. 75-114, TD No. 503 (June 2004).
G. GOBBI and F. LOTTI, Entry decisions and adverse selection: an empirical analysis of local credit markets, Journal of Financial services Research, Vol. 26 (3), pp. 225-244, TD No. 535 (December 2004).
F. CINGANO and F. SCHIVARDI, Identifying the sources of local productivity growth, Journal of the European Economic Association, Vol. 2 (4), pp. 720-742, TD No. 474 (June 2003).
C. BENTIVOGLI and F. QUINTILIANI, Tecnologia e dinamica dei vantaggi comparati: un confronto fra quattro regioni italiane, in C. Conigliani (a cura di), Tra sviluppo e stagnazione: l’economia dell’Emilia-Romagna, Bologna, Il Mulino, TD No. 522 (October 2004).
E. GAIOTTI and F. LIPPI, Pricing behavior and the introduction of the euro:evidence from a panel of restaurants, Giornale degli Economisti e Annali di Economia, 2004, Vol. 63(3/4):491-526, TD No. 541 (February 2005).

2005
L. DEDOLA and F. LIPPI, The monetary transmission mechanism: evidence from the industries of 5 OECD countries, European Economic Review, 2005, Vol. 49(6): 1543-69, TD No. 389 (Decembre 2000).
G. DE BLASIO and S. DI ADDARIO, Do workers benefit from industrial agglomeration? Journal of regional Science, Vol. 45 n.4, pp. 797-827, TD No. 453 (October 2002).
M. OMICCIOLI, Il credito commerciale: problemi e teorie, in L. Cannari, S. Chiri e M. Omiccioli (a cura di), Imprese o intermediari? Aspetti finanziari e commerciali del credito tra imprese in Italia, Bologna, Il Mulino, TD No. 494 (June 2004).
L. CANNARI, S. CHIRI and M. OMICCIOLI, Condizioni del credito commerciale e differenzizione della clientela, in L. Cannari, S. Chiri e M. Omiccioli (a cura di), Imprese o intermediari? Aspetti finanziari e commerciali del credito tra imprese in Italia, Bologna, Il Mulino, TD No. 495 (June 2004).
P. FINALDI RUSSO and L. LEVA, Il debito commerciale in Italia: quanto contano le motivazioni finanziarie?, in L. Cannari, S. Chiri e M. Omiccioli (a cura di), Imprese o intermediari? Aspetti finanziari e commerciali del credito tra imprese in Italia, Bologna, Il Mulino, TD No. 496 (June 2004).
A. CARMIGNANI, Funzionamento della giustizia civile e struttura finanziaria delle imprese: il ruolo del credito commerciale, in L. Cannari, S. Chiri e M. Omiccioli (a cura di), Imprese o intermediari? Aspetti finanziari e commerciali del credito tra imprese in Italia, Bologna, Il Mulino, TD No. 497 (June 2004).
G. DE BLASIO, Credito commerciale e politica monetaria: una verifica basata sull’investimento in scorte, in L. Cannari, S. Chiri e M. Omiccioli (a cura di), Imprese o intermediari? Aspetti finanziari e commerciali del credito tra imprese in Italia, Bologna, Il Mulino, TD No. 498 (June 2004).
G. DE BLASIO, Does trade credit substitute bank credit? Evidence from firm-level data. Economic notes, Vol. 34 n.1, pp. 85-112, TD No. 498 (June 2004).
A. DI CESARE, Estimating Expectations of Shocks Using Option Prices, The ICFAI Journal of Derivatives Markets, Vol. II (1), pp. 42-53, TD No. 506 (July 2004).
M. BENVENUTI and M. GALLO, Perché le imprese ricorrono al factoring? Il caso dell'Italia, in L. Cannari, S. Chiri e M. Omiccioli (a cura di), Imprese o intermediari? Aspetti finanziari e commerciali del credito tra imprese in Italia, Bologna, Il Mulino, TD No. 518 (October 2004).
P. DEL GIOVANE and R. SABBATINI, L’euro e l’inflazione. Percezioni, fatti e analisi, Bologna, Il Mulino, TD No. 532 (December 2004).
FORTHCOMING
A. DALMAZZO and G. DE BLASIO, Production and consumption externalities of human capital: an empirical study for Italy. Journal of population economics, TD No. 554 (June 2005).