Embed Size (px)
DESCRIPTION
pp
Citation preview
Full Terms & Conditions of access and use can be found athttp://www.tandfonline.com/action/journalInformation?journalCode=lpte20
Download by: [Technical University of Crete] Date: 14 September 2015, At: 08:34
Polymer-Plastics Technology and Engineering
ISSN: 0360-2559 (Print) 1525-6111 (Online) Journal homepage: http://www.tandfonline.com/loi/lpte20
Controlled Degradation of Polypropylene: AComprehensive Experimental and TheoreticalInvestigation
C. Tzoganakis , Y. Tang , J. Vlachopoulos & A. E. Hamielec
To cite this article: C. Tzoganakis , Y. Tang , J. Vlachopoulos & A. E. Hamielec (1989)Controlled Degradation of Polypropylene: A Comprehensive Experimental and TheoreticalInvestigation, Polymer-Plastics Technology and Engineering, 28:3, 319-350, DOI:10.1080/03602558908048602
To link to this article: http://dx.doi.org/10.1080/03602558908048602
Published online: 04 Oct 2006.
Submit your article to this journal
Article views: 27
View related articles
Citing articles: 34 View citing articles
P0LYM.-PLAST. TECHNOL. ENG., 28(3), 319-350 (1989)
CONTROLLED DEGRADATION OF POLYPROPYLENE A COMPREHENSIVE EXPERIMENTAL AND THEORETICAL INVESTIGATION
c. TZOGANAKIS,* Y. TANG, J. VLACHOPOULOS, and A. E. HAMIELEC
Department of Chemical Engineering McMaster University Hamilton, Ontario, L8S 4L7 Canada
Abstract
Experimental and modeling studies of the free-radical-induced degrada- tion of polypropylene (PP) in the melt phase have been carried out. Experiments have been performed in a single-screw plasticating extruder using a peroxide as the free-radical source. Concentration of the per- oxide was in the range 0.01-0.6 wt%. Results in the form of melt flow index (MFI) values, viscosity curves, and molecular weight distribution (MWD) of the produced resins are presented here. Based on these results, a constitutive equation describing the shear viscosity of the melt as a function of shear rate, temperature, and molecular weight has been derived. The extensional viscosity of these resins has been determined as a function of strain rate using Cogswell’s analysis of converging flows. A previously developed kinetic model (plug flow) has been used to simulate the changes of the average molecular weights of the MWD, and a sensitivity analysis of this model has been carried out.
*Resent address: DuPont Canada Inc., Research Center, Kingston, Ontario, K7L 5A5 Canada.
319
Copyright 0 1989 by Marcel Dekker. Inc
Dow
nloa
ded
by [
Tec
hnic
al U
nive
rsity
of
Cre
te]
at 0
8:34
14
Sept
embe
r 20
15
320
1. INTRODUCTION
TZOGANAKIS ET AL.
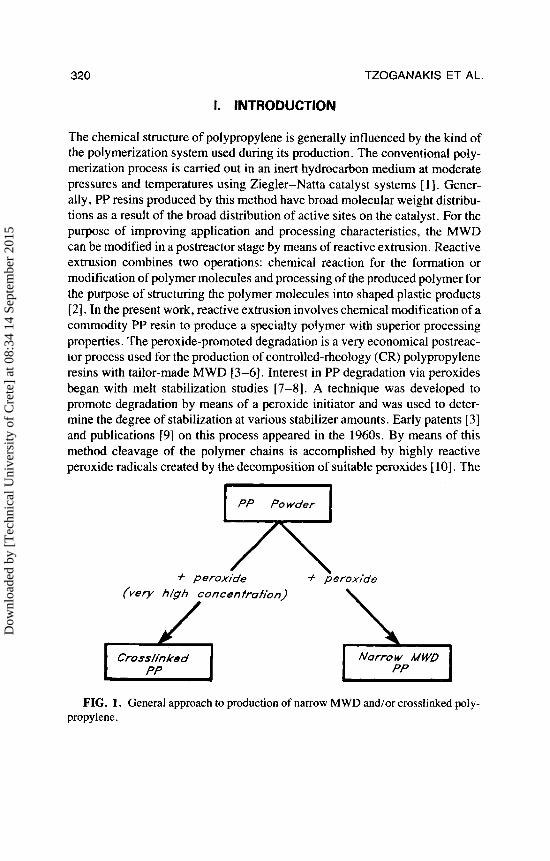
The chemical structure of polypropylene is generally influenced by the kind of the polymerization system used during its production. The conventional poly- merization process is canied out in an inert hydrocarbon medium at moderate pressures and temperatures using Ziegler-Natta catalyst systems [ 1 1 , Gener- ally, PP resins produced by this method have broad molecular weight distribu- tions as a result of the broad distribution of active sites on the catalyst. For the purpose of improving application and processing characteristics, the MWD can be modified in a postreactor stage by means of reactive extrusion. Reactive extrusion combines two operations: chemical reaction for the formation or modification of polymer molecules and processing of the produced polymer for the purpose of structuring the polymer molecules into shaped plastic products [ 2 ] . In the present work, reactive extrusion involves chemical modification of a commodity PP resin to produce a specialty polymer with superior processing properties. The peroxide-promoted degradation is a very economical postreac- tor process used for the production of controlled-rheology (CR) polypropylene resins with tailor-made MWD [3-61. Interest in PP degradation via peroxides began with melt stabilization studies [7-81. A technique was developed to promote degradation by means of a peroxide initiator and was used to deter- mine the degree of stabilization at various stabilizer amounts. Early patents [3] and publications [9] on this process appeared in the 1960s. By means of this method cleavage of the polymer chains is accomplished by highly reactive peroxide radicals created by the decomposition of suitable peroxides [ 101. The
FF Powder
+ peroxide ii + peroxide
(very high concentration)
Crosslinked &I Narrow MWD
FIG. 1. General approach to production of narrow MWD and/or crosslinked poly- propylene.
Dow
nloa
ded
by [
Tec
hnic
al U
nive
rsity
of
Cre
te]
at 0
8:34
14
Sept
embe
r 20
15
Initiation
Chain Scission
Transfer
Thermal Degradation
Termination
kd
I - 2Ro
k l
P + Ro4 Pr + P:-+ + R
k 2
Pn + P;,Pr + PY+ Pn.s
k4
P; + P+ Pn +Pr
(a)
Radical Attack Hydrogen Abstraction
CH CH-CH2-CH-CH2 + R ' -..--+"A CH2-C-CH2-CH-CH2 t R H I I I 2- I
CH3 CH3 CH3 CH3
Peroxide Radical Polymer Radical - -
J Degradation (&Scission)
CHZ=f-CHz - - C H ~ - ~ H . I CH3 CH3
(b) -- Polymer Radical Polyclefin
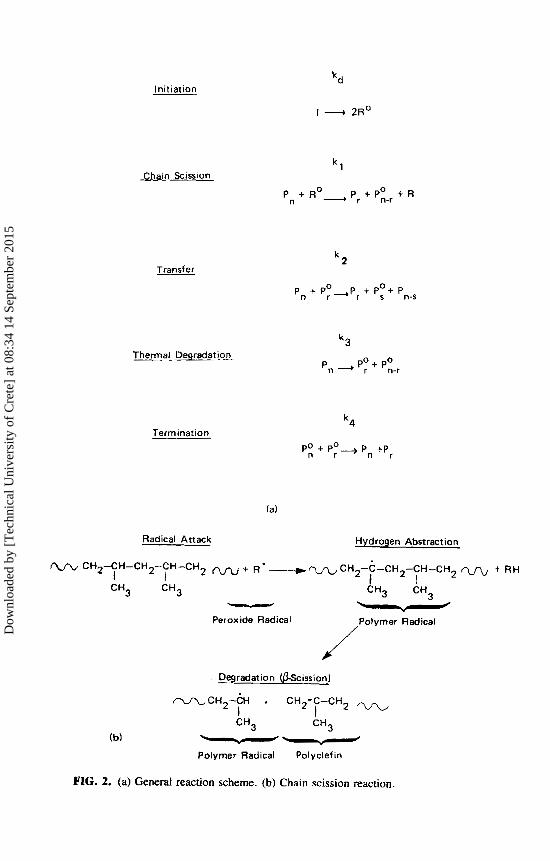
FIG. 2. (a) General reaction scheme. (b) Chain scission reaction.
Dow
nloa
ded
by [
Tec
hnic
al U
nive
rsity
of
Cre
te]
at 0
8:34
14
Sept
embe
r 20
15
322 TZOGANAKIS ET AL.
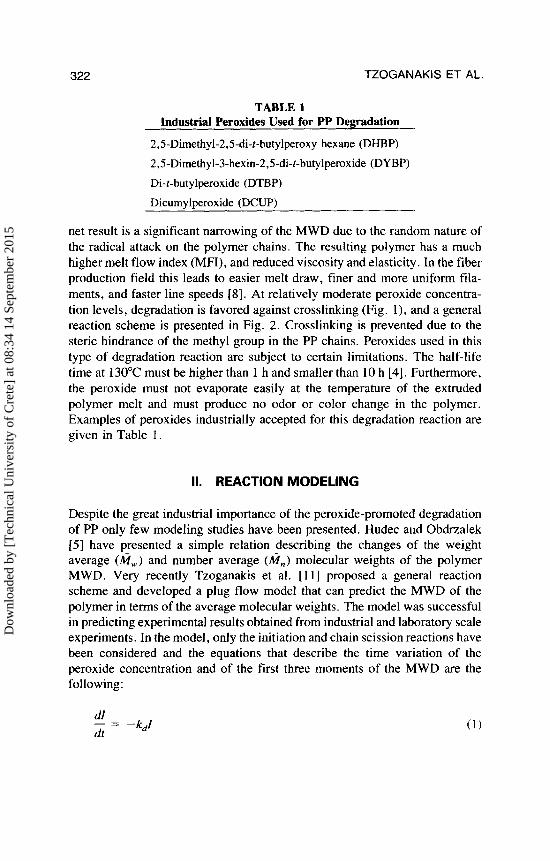
TABLE 1 Industrial Peroxides Used for PP Degradation
2,5-Dimethyl-2,5-di-r-butylperoxy hexane (DHRP) 2,5-Dimethyl-3-hexin-2,5-di-t-butylperoxide (DYBP) Di-t-butylperoxide (DTBP) Dicumylperoxide (DCUP)
net result is a significant narrowing of the MWD due to the random nature of the radical attack on the polymer chains. The resulting polymer has a much higher melt flow index (MFI), and reduced viscosity and elasticity. In the fiber production field this leads to easier melt draw, finer and more uniform fila- ments, and faster line speeds [S]. At relatively moderate peroxide concentra- tion levels, degradation is favored against crosslinking (Fig. l), and a general reaction scheme is presented in Fig. 2. Crosslinking is prevented due to the steric hindrance of the methyl group in the PP chains. Peroxides used in this type of degradation reaction are subject to certain limitations. The half-life time at 130°C must be higher than 1 h and smaller than 10 h [4]. Furthermore, the peroxide must not evaporate easily at the temperature of the extruded polymer melt and must produce no odor or color change in the polymer. Examples of peroxides industrially accepted for this degradation reaction are given in Table 1 .
II. REACTION MODELING
Despite the great industrial importance of the peroxide-promoted degradation of PP only few modeling studies have been presented. Hudec and Obdrzalek [5] have presented a simple relation describing the changes of the weight average (A?,) and number average ( f i n ) molecular weights of the polymer MWD. Very recently Tzoganakis et al. [ I l l proposed a general reaction scheme and developed a plug flow model that can predict the MWD of the polymer in terms of the average molecular weights. The model was successful in predicting experimental results obtained from industrial and laboratory scale experiments. In the model, only the initiation and chain scission reactions have been considered and the equations that describe the time variation of the peroxide concentration and of the first three moments of the MWD are the following:
dl dt - = -kdI
Dow
nloa
ded
by [
Tec
hnic
al U
nive
rsity
of
Cre
te]
at 0
8:34
14
Sept
embe
r 20
15
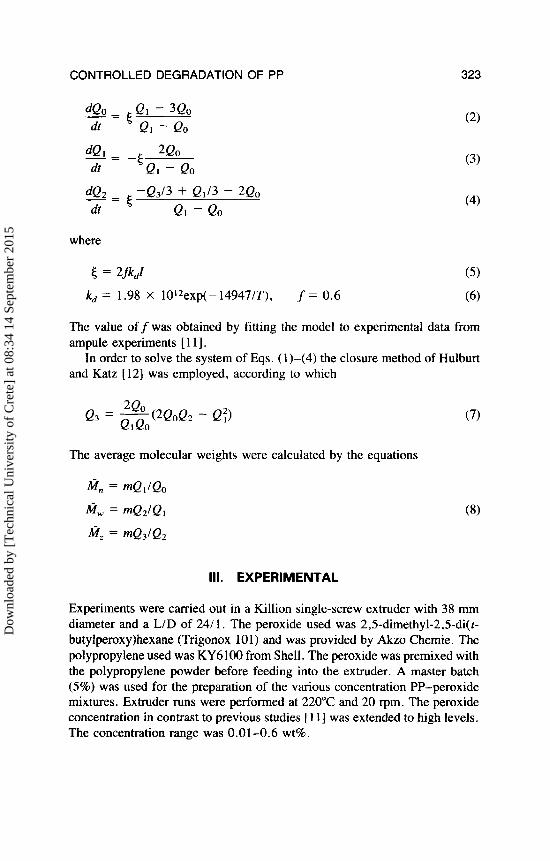
CONTROLLED DEGRADATION OF PP
dQ2 - -Q313 + Q1/3 - 2Qo -- dt Q I - QO
where
f = 0.6
The value off was obtained by fitting the model to experimental data from ampule experiments [ 1 11.
In order to solve the system of Eqs. (1)-(4) the closure method of Hulburt and Katz [ 12) was employed, according to which
The average molecular weights were calculated by the equations
111. EXPERIMENTAL
Experiments were carried out in a Killion single-screw extruder with 38 mm diameter and a LID of 241 1. The peroxide used was 2,5-dimethyl-2,5-di(t- buty1peroxy)hexane (Trigonox 101 j and was provided by Akzo Chemie. The polypropylene used was KY6100 from Shell. The peroxide was premixed with the polypropylene powder before feeding into the extruder. A master batch (5%) was used for the preparation of the various concentration PP-peroxide mixtures. Extruder runs were performed at 220°C and 20 rpm. The peroxide concentration in contrast to previous studies [ 1 1 ] was extended to high levels. The concentration range was 0.01-0.6 wt%.
Dow
nloa
ded
by [
Tec
hnic
al U
nive
rsity
of
Cre
te]
at 0
8:34
14
Sept
embe
r 20
15
324 TZOGANAKIS ET AL.
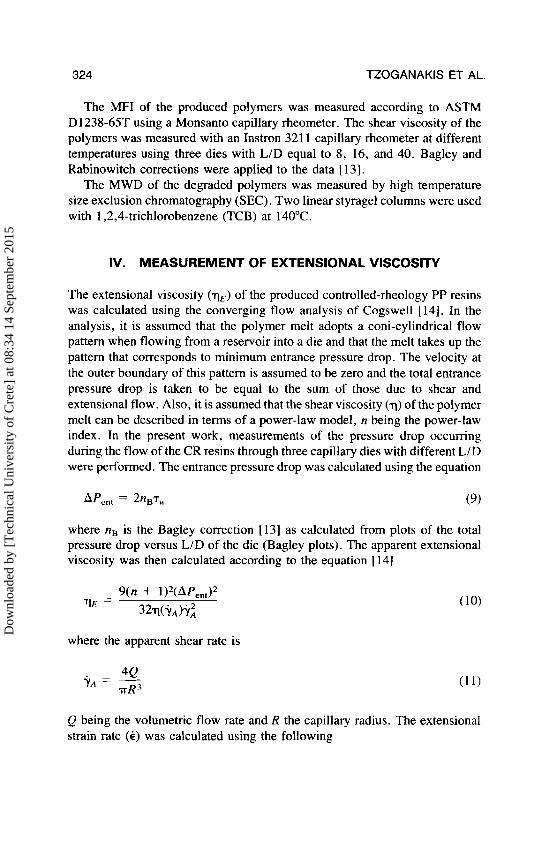
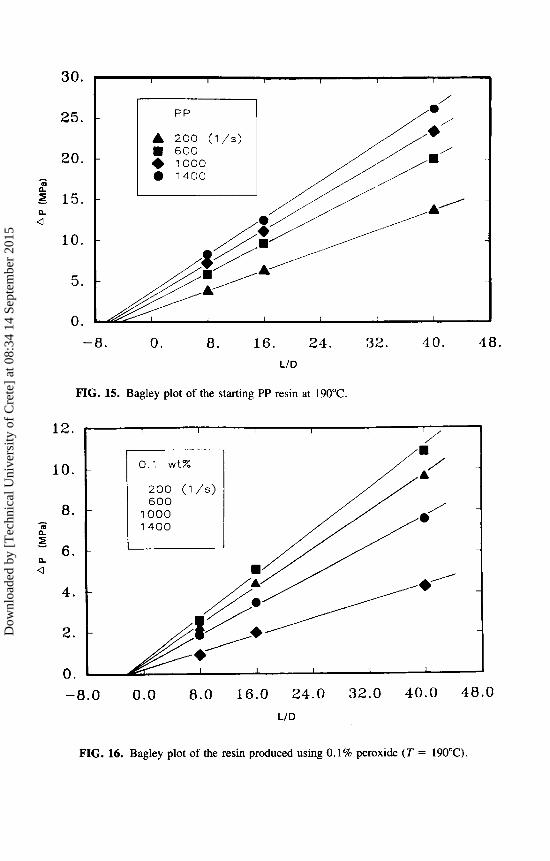
The MFI of the produced polymers was measured according to ASTM D1238-65T using a Monsanto capillary rheometer. The shear viscosity of the polymers was measured with an Instron 321 1 capillary rheometer at different temperatures using three dies with L/D equal to 8, 16, and 40. Bagley and Rabinowitch corrections were applied to the data [ 131.
The MWD of the degraded polymers was measured by high temperature size exclusion chromatography (SEC). Two linear styragel columns were used with 1,2,4-trichlorobenzene (TCB) at 140°C.
IV. MEASUREMENT OF EXTENSIONAL VISCOSITY
The extensional viscosity (qE) of the produced controlled-rheology PP resins was calculated using the converging flow analysis of Cogswell [14]. In the analysis, it is assumed that the polymer melt adopts a coni-cylindrical flow pattern when flowing from a reservoir into a die and that the melt takes up the pattern that corresponds to minimum entrance pressure drop. The velocity at the outer boundary of this pattern is assumed to be zero and the total entrance pressure drop is taken to be equal to the sum of those due to shear and extensional flow. Also, it is assumed that the shear viscosity (11) of the polymer melt can be described in terms of a power-law model, n being the power-law index. In the present work, measurements of the pressure drop occurring during the flow of the CR resins through three capillary dies with different L/D were performed. The entrance pressure drop was calculated using the equation
AP,,, = 2nB7, (9)
where nB is the Bagley correction [13] as calculated from plots of the total pressure drop versus L/D of the die (Bagley plots). The apparent extensional viscosity was then calculated according to the equation [ 141
where the apparent shear rate is
4Q Y A = 3
7TR
Q being the volumetric flow rate and R the capillary radius. The extensional strain rate (&) was calculated using the following
Dow
nloa
ded
by [
Tec
hnic
al U
nive
rsity
of
Cre
te]
at 0
8:34
14
Sept
embe
r 20
15
CONTROLLED DEGRADATION OF PP 325
In the past, Schroff et al. [15] have used the same approach and they have found quantitative agreement between experimental results and values pre- dicted by means of the forementioned procedure. Recently, Laun and Schuch [ 161 showed that calculations of the extensional viscosity of polymer melts using Cogswell’s simple method are in surprisingly good agreement with data from more accurate methods for the determination of polymer extensional viscosities.
V. RESULTS AND DISCUSSION
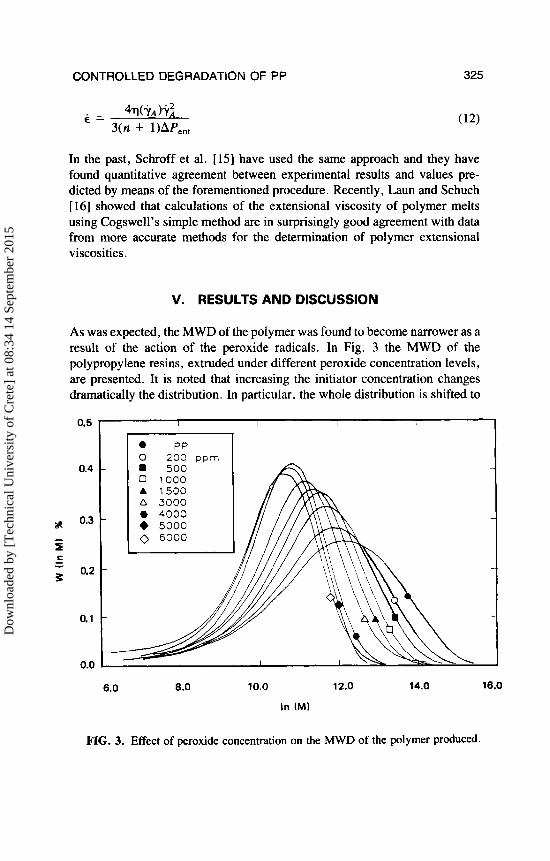
As was expected, the MWD of the polymer was found to become narrower as a result of the action of the peroxide radicals. In Fig. 3 the MWD of the polypropylene resins, extruded under different peroxide concentration levels, are presented. It is noted that increasing the initiator concentration changes dramatically the distribution. In particular, the whole distribution is shifted to
0.5
0.4
ai
0.0
6.0 8.0 10.0 12.0 14.0 16.0
In IM)
FIG. 3. Effect of peroxide concentration on the MWD of the polymer produced.
Dow
nloa
ded
by [
Tec
hnic
al U
nive
rsity
of
Cre
te]
at 0
8:34
14
Sept
embe
r 20
15

326 TZOGANAKIS ET AL.
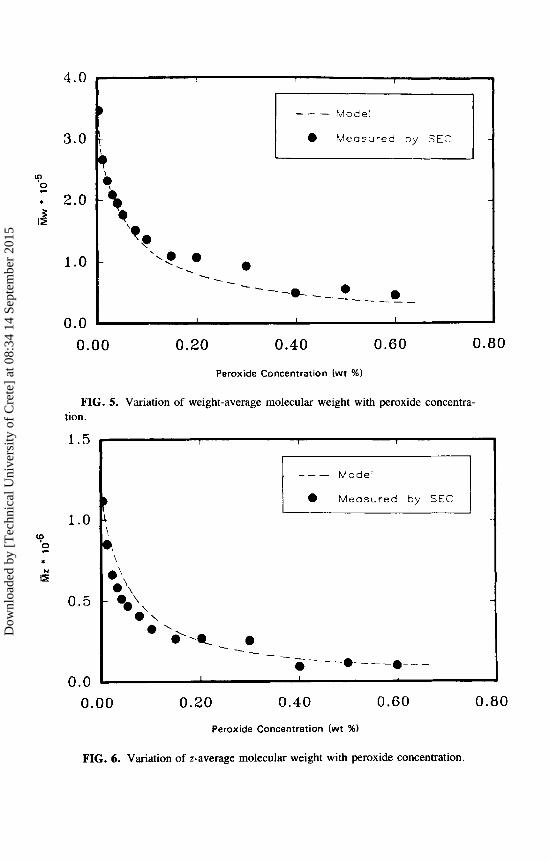
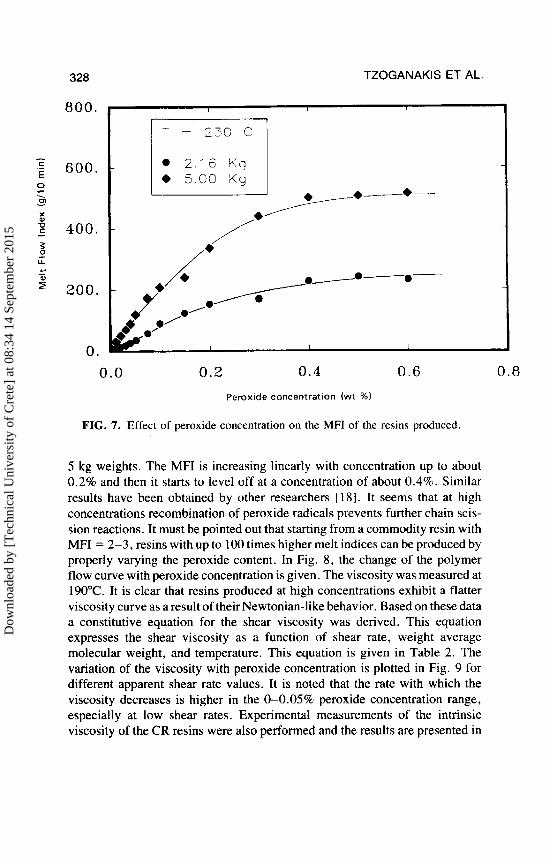
lower molecular weights and the high molecular weight tail is removed in a controlled fashion as we progressively step up to higher peroxide levels. An explanation of the elimination of the high molecular weight tail can be given if one considers the random nature of the degradation reaction. Since the peroxide radicals abstract preferentially the tertiary hydrogen atoms from the polymer chains, longer chains react with a faster rate because they contain a larger number of active sites (i.e., tertiary hydrogen atoms). As a result the polymer elasticity, which mainly is due to the long chains, drops significantly as it has been demonstrated by extrudate swell measurements of these controlled- rheology resins [ l l ] . In Figs. 4-6 the experimentally measured M,, A?,,,, and A?? are compared with the model predictions. It can be seen that there is good agreement. The modifications of the MWD, caused by the degradation process, have a pronounced effect on the rheological properties of the polymer. The free-radical-induced degradation affects to a great extent both the viscous and the elastic behavior of the polymer as opposed to shear degradation, which mainly affects the elastic one [ 171. The effect of the peroxide concentration on the MFI is shown in Fig. 7. The MFI was measured at 230°C using 2.16 kg and
0.0 0.2 0.4 0.6 0.0 Peroxide Concentration (wt%)
FIG. 4. Variation of number-average molecular weight with peroxide concentra- tion.
Dow
nloa
ded
by [
Tec
hnic
al U
nive
rsity
of
Cre
te]
at 0
8:34
14
Sept
embe
r 20
15
4.0
3.0
LD z * 2.0 3
15
1 .o
0.0
1.5
1.0 9 2
Is
*
0.5
0.0
I I I
Model
Measured by SEC I i \
i
0 0 - -- . --- . -0- --. - - - - - -
I I I 2
L 1 I I
Model
B Measured by SEC
I \ +, 0' .'\
- a@\,
\
0 \ 0' *-c\ 0
-0- - - -0- - - - a - - - - \
I I I
0.00 0.20 0.40 0.60 0.80
Peroxide Concentration (wt %)
FIG. 6. Variation of z-average molecular weight with peroxide concentration.
Dow
nloa
ded
by [
Tec
hnic
al U
nive
rsity
of
Cre
te]
at 0
8:34
14
Sept
embe
r 20
15
328
800 .
- .' 600. z
7 - 400.
E
. m
X 0)
I
- 5 U w -
200 .
0.
TZOGANAKIS ET AL.
T = 2.30 C
2.16 K g 6 5.00 K g
0.0 0.2 0.4 0 . 6 0.8
Peroxide concentration (wt 46)
FIG. 7. Effect of peroxide concentration on the MFI of the resins produced.
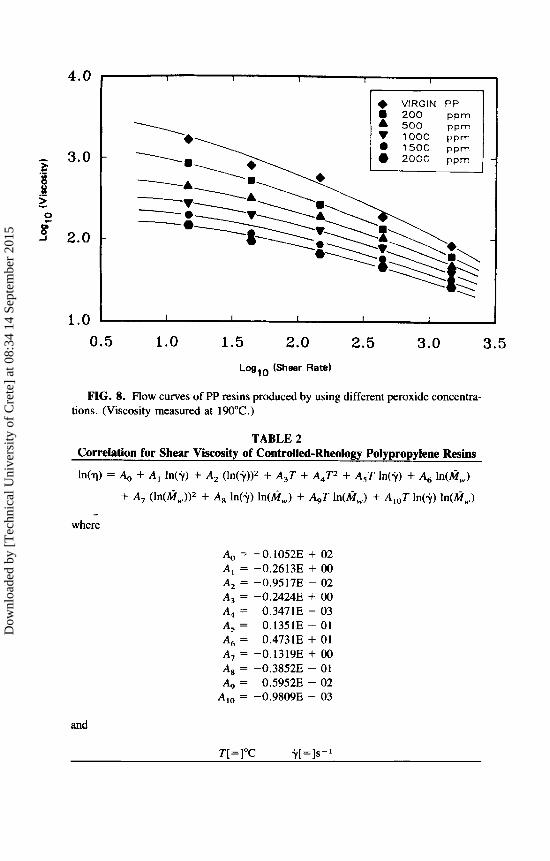
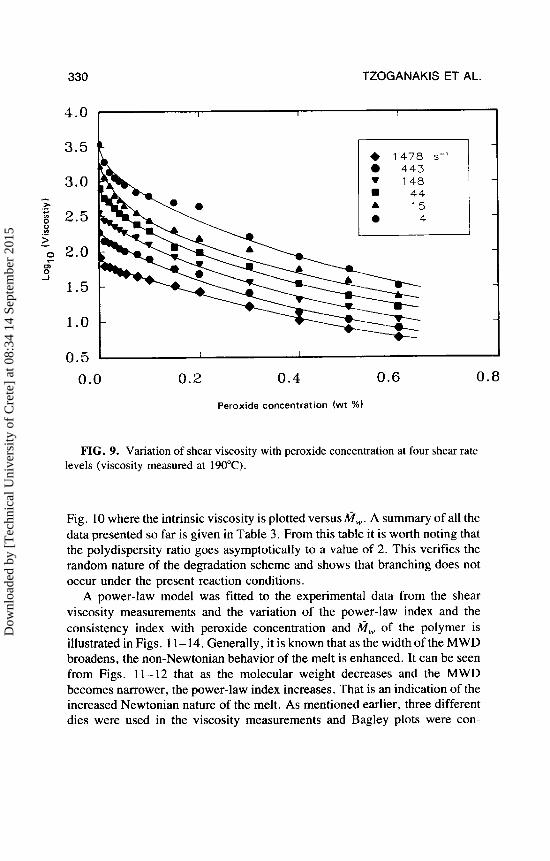
5 kg weights. The MFI is increasing linearly with concentration up to about 0.2% and then it starts to level off at a concentration of about 0.4%. Similar results have been obtained by other researchers [ lS] . It seems that at high concenti-ations recombination of peroxide radicals prevents further chain scis- sion reactions. It must be pointed out that starting from a commodity resin with MFI = 2-3, resins with up to 100 times higher melt indices can be produced by properly varying the peroxide content. In Fig. 8, the change of the polymer flow curve with peroxide concentration is given. The viscosity was measured at 190°C. It is clear that resins produced at high concentrations exhibit a flatter viscosity curve as a result of their Newtonian-like behavior. Based on these data a constitutive equation for the shear viscosity was derived. This equation expresses the shear viscosity as a function of shear rate, weight average molecular weight, and temperature. This equation is given in Table 2 . The variation of the viscosity with peroxide concentration is plotted in Fig. 9 for different apparent shear rate values. It is noted that the rate with which the viscosity decreases is higher in the 0-0.05% peroxide concentration range, especially at low shear rates. Experimental measurements of the intrinsic viscosity of the CR resins were also performed and the results are presented in
Dow
nloa
ded
by [
Tec
hnic
al U
nive
rsity
of
Cre
te]
at 0
8:34
14
Sept
embe
r 20
15
4.0
- 3.0 E .- .- x ; > - J 2.0
1 .o 0 .5 1.0 1.5 2.0 2.5 3.0 3.5
Loglo (Shear Rate)
FIG. 8. Flow curves of PP resins produced by using different peroxide concentra- tions. (Viscosity measured at 190°C.)
TABLE 2 Correlation for Shear Viscosity of Controlled-Rheology Polypropylene Resins
ln(q) = A, + A, In(?) + A, (ln(+)), + A,T + A,T2 + A,T In(+) + A, In(M,)
+ A, (ln(if,)I2 + A, In(+) In(M,) + A,T In(if,) + A,,T In(+) In(A?,) ~
where
A, = -0.1052E + 02 A, = -0.2613E + 00 A, = -0.9517E - 02 A, = -0.24248 -t- 00 A, = 0.3471E - 03 A, = 0.1351E - 01 A, = 0.4731E + 01 A, = -0.1319E + 00 A, = -0.3852E - 01 A, = 0.5952E - 02
A,, = -0.98098 - 03
and
T[=]"C ?[=Is-'
Dow
nloa
ded
by [
Tec
hnic
al U
nive
rsity
of
Cre
te]
at 0
8:34
14
Sept
embe
r 20
15
330 TZOGANAKIS ET AL.
3.5
3.0
2.5
2.0
1.5
1 .o
+ 1478 s-’ 443
m 44 148
A 15 4
0.5 I I I
0.0 0.2 0.4 0.6 0.8
Peroxide concentration (wt %)
FIG. 9. Variation of shear viscosity with peroxide concentration at four shear rate levels (viscosity measured at 190°C).
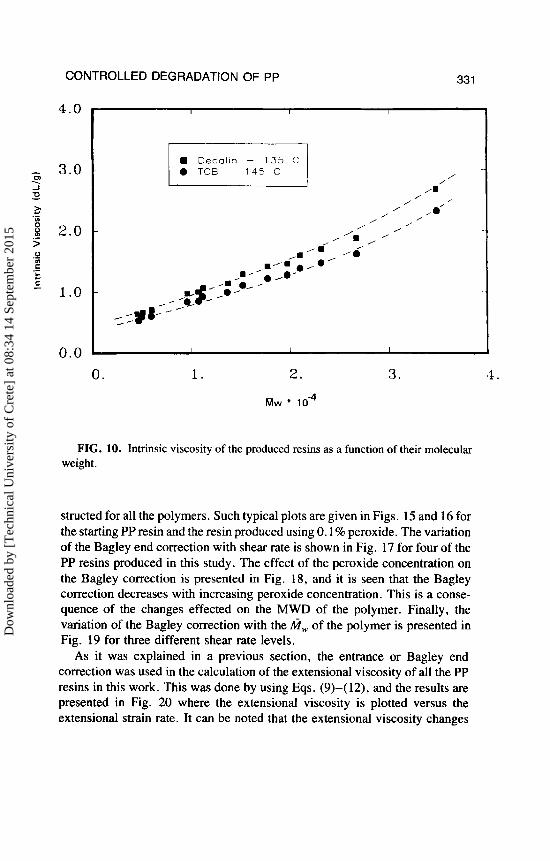
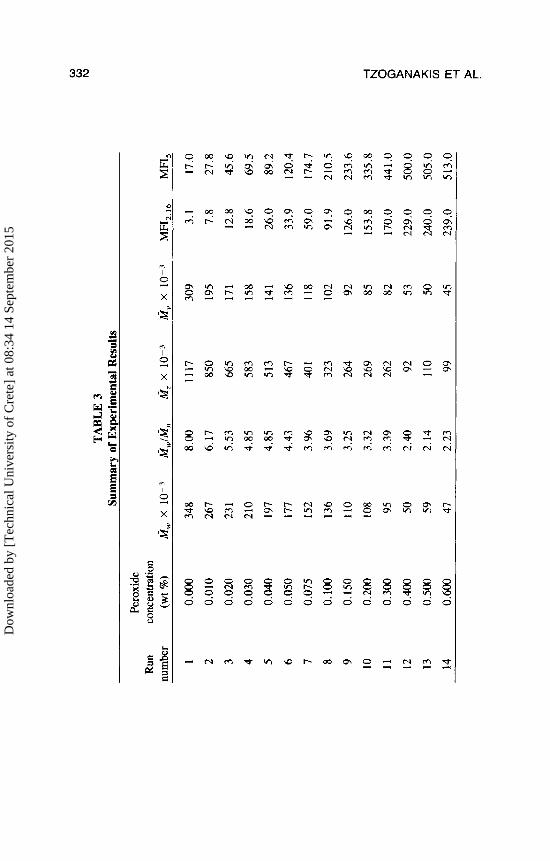
Fig. 10 where the intrinsic viscosity is plotted versus A?,,,. A summary of all the data presented so far is given in Table 3. From this table it is worth noting that the polydispersity ratio goes asymptotically to a value of 2 . This verifies the random nature of the degradation scheme and shows that branching does not occur under the present reaction conditions.
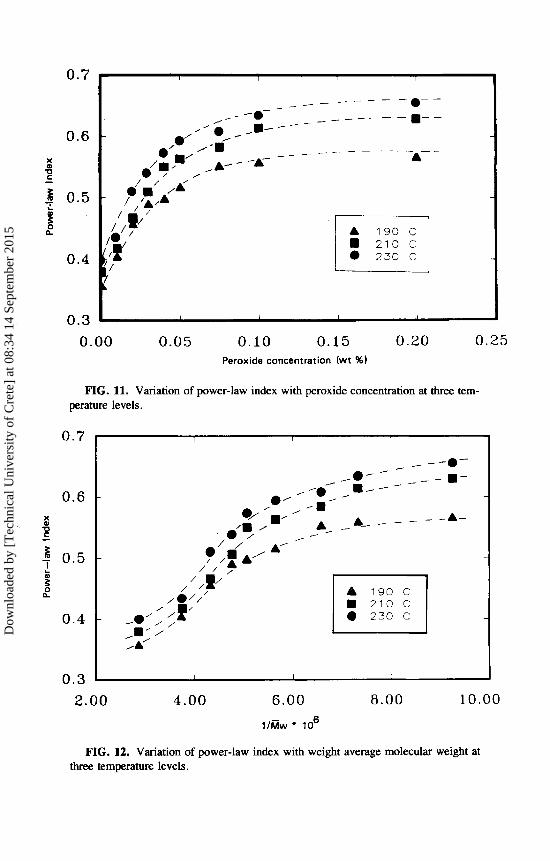
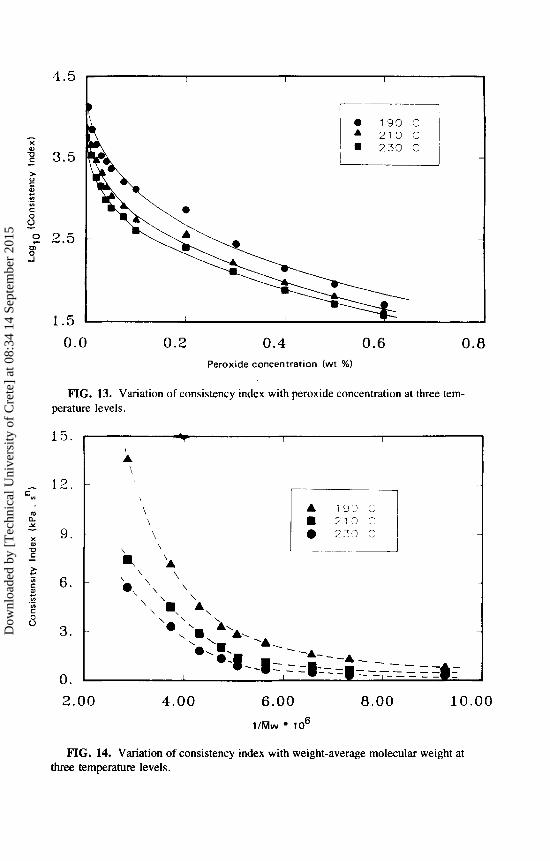
A power-law model was fitted to the experimental data from the shear viscosity measurements and the variation of the power-law index and the consistency index with peroxide concentration and of the polymer is illustrated in Figs. 11-14. Generally, it is known that as the width of the MWD broadens, the non-Newtonian behavior of the melt is enhanced. It can be seen from Figs. 11-12 that as the molecular weight decreases and the MWD becomes narrower, the power-law index increases. That is an indication of the increased Newtonian nature of the melt. As mentioned earlier, three different dies were used in the viscosity measurements and Bagley plots were con-
Dow
nloa
ded
by [
Tec
hnic
al U
nive
rsity
of
Cre
te]
at 0
8:34
14
Sept
embe
r 20
15
33 1 CONTROLLED DEGRADATION OF PP
4.0
- 3.0 Ol
J U
. - E t; .- .- 0 2.0 > u C
C
.- YI
.- L c
- 1.0
"." -
0 1. 3.
FIG. 10. Intrinsic viscosity of the produced resins as a function of their molecular weight.
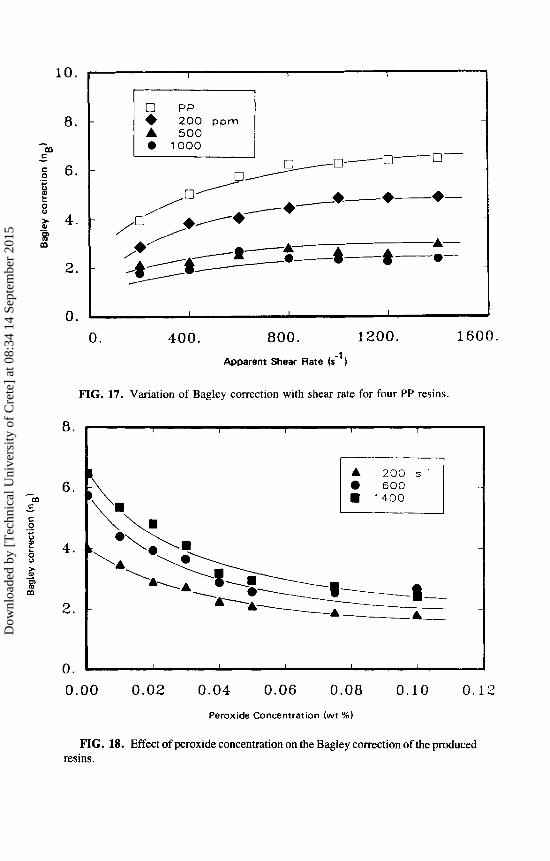
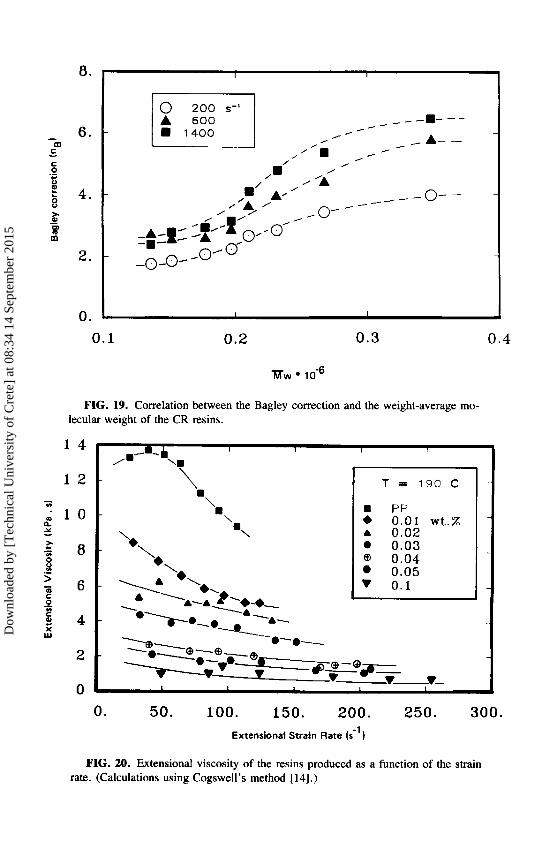
structed for all the polymers. Such typical plots are given in Figs. 15 and 16 for the starting PP resin and the resin produced using 0.1 % peroxide. The variation of the Bagley end correction with shear rate is shown in Fig. 17 for four of the PP resins produced in this study. The effect of the peroxide concentration on the Bagley correction is presented in Fig. 18, and it is seen that the Bagley correction decreases with increasing peroxide concentration. This is a conse- quence of the changes effected on the MWD of the polymer. Finally, the variation of the Bagley correction with the A?, of the polymer is presented in Fig. 19 for three different shear rate levels.
As it was explained in a previous section, the entrance or Bagley end correction was used in the calculation of the extensional viscosity of all the PP resins in this work. This was done by using Eqs. (9)-(12), and the results are presented in Fig. 20 where the extensional viscosity is plotted versus the extensional strain rate. It can be noted that the extensional viscosity changes
Dow
nloa
ded
by [
Tec
hnic
al U
nive
rsity
of
Cre
te]
at 0
8:34
14
Sept
embe
r 20
15
TA
BL
E 3
Su
mm
ary
of E
xper
imen
tal R
esul
ts
Pero
xide
Ru
n co
ncen
trat
ion
num
ber
(wt
%)
M,
x 10
-3
M,,,/M
n M
z X
lo-’
M
,, X
M
FI,
,b
MFI
,
1 2 3 4 5 6 7 8 9 10
11
12
13
14
O.OO
0
0.01
0
0.02
0
0.03
0
0.04
0 0.
050
0.07
5
0.10
0
0.15
0
0.20
0
0.30
0
0.40
0
0.50
0
0.60
0
348
267
23 1
210
197
177
152
136
110
108 95
50
59
47
8.00
6.17
5.53
4.85
4.85
4.43
3.96
3.69
3.25
3.32
3.39
2.40
2.14
2.23
1117
850
665
583
513
467
40 1
323
264
269
262 92
110 99
309
195
17 1
158
14 1
136
118
102 92
85
82
53
50
45
3.1
17.0
7.8
27.8
12.8
45
.6
18.6
69
.5
26.0
89
.2
33.9
12
0.4
59.0
17
4.7
91.9
21
0.5
126.
0 23
3.6
153.
8 33
5.8
170.
0 44
1.0
229.
0 50
0.0
240.
0 50
5.0
239.
0 51
3.0
w
w
Iu
m
4 F
Dow
nloa
ded
by [
Tec
hnic
al U
nive
rsity
of
Cre
te]
at 0
8:34
14
Sept
embe
r 20
15
0.7
0.6
0.4
0.3 0.00 0.05 0.10 0.15 0.20 0.25
Peroxide concentration (wt % I
FIG. 11. Variation of power-law index with peroxide concentration at three tem- perature levels.
0.7
0.6
T 0.5
0.4
0.3 2. 00 4.00 6.00 8.00 10.00
t m w * to6
FIG. 12. Variation of power-law index with weight average molecular weight at three temperature levels.
Dow
nloa
ded
by [
Tec
hnic
al U
nive
rsity
of
Cre
te]
at 0
8:34
14
Sept
embe
r 20
15
4.5
3 . 5
2.5
1.5
I I I
0.0 0.2 0.4 0.6 0.8 Peroxide concentration (wt %)
FIG. 13. Variation of consistency index with peroxide concentration at three tem- perature levels.
15.
12.
9.
6.
3.
0 .
7 I I
A \
2.00 4.00 6.00 8.00 10.00
lllvlw lo6
FIG. 14. Variation of consistency index with weight-average molecular weight at three temperature levels.
Dow
nloa
ded
by [
Tec
hnic
al U
nive
rsity
of
Cre
te]
at 0
8:34
14
Sept
embe
r 20
15
0 a
30.
25.
20.
15.
10.
5 .
0 . -8. 0. 8. 16. 24. 32. 40. 48.
L/D
FIG. 15. Bagley plot of the starting PP resin at 190°C.
12
10
8.
n a
4.
2.
0 .
-8.0 0.0 8.0 16.0 24.0 32.0 40.0 48.0 L/ D
FIG. 16. Bagley plot of the resin produced using 0.1% peroxide ( T = 190°C).
Dow
nloa
ded
by [
Tec
hnic
al U
nive
rsity
of
Cre
te]
at 0
8:34
14
Sept
embe
r 20
15
10.
8. -
m
6.
4.
2.
0 .
8.
6.
4.
2.
0 .
0. 400. 800. 1200. 1600.
Apparent Shear Rate (s-')
FIG. 17. Variation of Bagley correction with shear rate for four PP resins.
0.00 0.02 0.04 0.06 0.08 0.10 0.12
Peroxide Concentration (wt %)
FIG. 18. Effect of peroxide concentration on the Bagley correction of the produced resins.
Dow
nloa
ded
by [
Tec
hnic
al U
nive
rsity
of
Cre
te]
at 0
8:34
14
Sept
embe
r 20
15
8 .
6.
4.
2.
0. 0.1 0.2 0.3 0.4
mw lo+
FIG. 19. Correlation between the Bagley correction and the weight-average mo- lecular weight of the CR resins.
1 4
1 2
. l o - v)
2 Y .r” 8
> .- f z 6
E 4 0 I
w
2
0
,.-.-b I I I I
T = 190 C
rn PP . 0.01 w t . % A 0.02
0.03 @ 0.04
0.05 V 0.1
0. 50. 100. 150. 200. 250 . 300. Extensional Strain Rate (s-’)
FIG. 20. Extensional viscosity of the resins produced as a function of the strain rate. (Calculations using Cogswell’s method [ 141.)
Dow
nloa
ded
by [
Tec
hnic
al U
nive
rsity
of
Cre
te]
at 0
8:34
14
Sept
embe
r 20
15
338 TZOGANAKIS ET AL.
dramatically even at low peroxide levels. Here, it must be pointed out that by means of the present method, CR polypropylene resins which exhibit an elongational viscosity almost independent of strain rate can be produced. This is advantageous in fiber spinning, where development of weak spots can introduce large variations in the extensional strain that the melt experiences. This means that such resins will not tend to neck when subjected to simple extensions [ 191. As indicated by our preliminary laboratory experiments, when these resins are used in fiber spinning, draw resonance occurs at draw ratios considerably higher than those observed in the spinning of the starting PP.
VI. SENSITIVITY ANALYSIS
Although the predictions of the kinetic model were in good agreement with the experimental data, it is necessary to determine how perturbations or uncertain- ties of the model parameters affect the predictions. This is important because our knowledge of the parameter values may not be precise. The results of such a sensitivity analysis can be very useful in directing further research toward either more accurate estimation of the model parameters or better process control.
Generally, sensitivity analysis is concerned with fluctuations of the model predictions caused by deviations of system parameters from their nominal values. The purpose of the present analysis was to determine the effects of uncertainties in kd, f, T, and I , on the model predictions. The model equations (1)-(4) can be written in the following dimensionless vector form
where Y and p are defined as
and Dow
nloa
ded
by [
Tec
hnic
al U
nive
rsity
of
Cre
te]
at 0
8:34
14
Sept
embe
r 20
15
CONTROLLED DEGRADATION OF PP 339
with Qi,o being the value of the i" moment at time zero. The dimensionless variables were introduced to ease the numerical integration of the sensitivity equations. The sensitivity coefficient for the parameter pi and the model output Yi is defined as the first partial derivative of Yj with respect to pi
a Yi aPj
+.. = - , i , j = l , . . . , 4 'I
The matrix of the derivatives of Y with respect to p is called the sensitivity matrix. Sensitivity coefficients indicate the direction and the magnitude of change of the model outputs (Y) due to perturbations in the parameter values (p). A positive sensitivity coefficient indicates that a positive variation of the corresponding parameter causes an increase in the output variable while a negative coefficient indicates decrease in the output variable. Following the method of Atherton et al. [20] and Thomas et al. [21], the sensitivity equations that describe the time variation of the sensitivity coefficients can be derived by means of the formula:
The initial conditions for Eq. (18) are
0
6,
if pj is not an initial condition
if pi is an initial condition +.. =
rl
The full sensitivity equations are given in Appendix I along with the dimen- sionless form of the model equations. These equations are integrated along with the model equations to give the complete time history of the sensitivity matrix during the degradation reaction. The results are presented in the follow- ing normalized form
p.. = $3 lJ I' yi
for the purpose of demonstrating the relative influence of the parameters on the model outputs (predictions). Finally, the sensitivity of the average molecular weights on the parameter variations was calculated by means of the equations given in Appendix 11.
Dow
nloa
ded
by [
Tec
hnic
al U
nive
rsity
of
Cre
te]
at 0
8:34
14
Sept
embe
r 20
15
340 TZOGANAKIS ET AL.
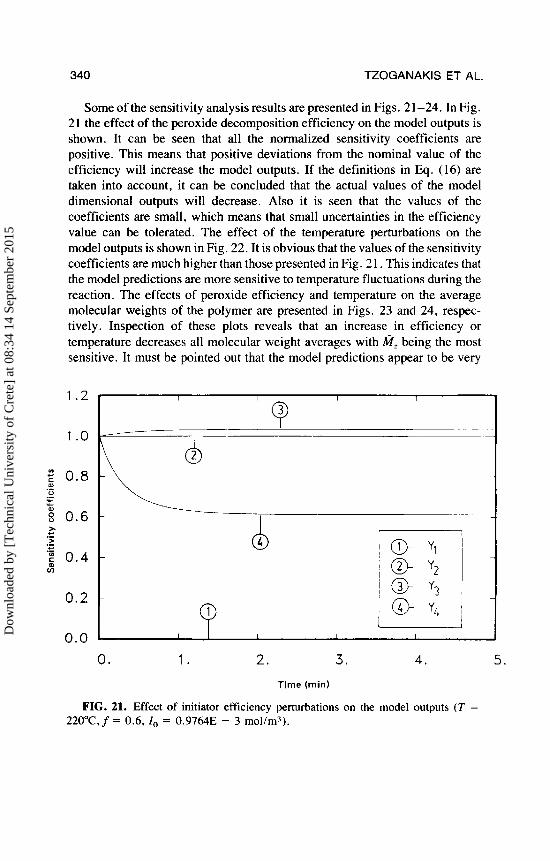
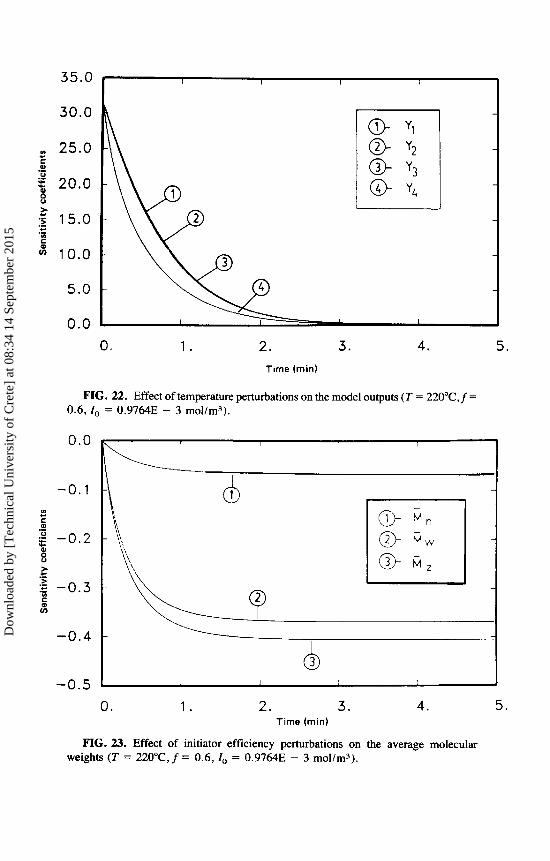
Some of the sensitivity analysis results are presented in Figs. 21-24. In Fig. 21 the effect of the peroxide decomposition efficiency on the model outputs is shown. It can be seen that all the normalized sensitivity coefficients are positive. This means that positive deviations from the nominal value of the efficiency will increase the model outputs. If the definitions in Eiq. (16) are taken into account, it can be concluded that the actual values of the model dimensional outputs will decrease. Also it is seen that the values of the coefficients are small, which means that small uncertainties in the efficiency value can be tolerated. The effect of the temperature perturbations on the model outputs is shown in Fig. 22. It is obvious that the values of the sensitivity coefficients are much higher than those presented in Fig. 2 1. This indicates that the model predictions are more sensitive to temperature fluctuations during the reaction. The effects of peroxide efficiency and temperature on the average molecular weights of the polymer are presented in Figs. 23 and 24, respec- tively. Inspection of these plots reveals that an increase in efficiency or temperature decreases all molecular weight averages with Mz being the most sensitive. It must be pointed out that the model predictions appear to be very
1.2
1 .o
2 0.8 .- 0 .- L
0.2
0.0
0 . 1 . 2 . 3. 4. 5 .
Time (min)
FIG. 21. Effect of initiator efficiency perturbations on the model outputs (T = 220°C,f = 0.6, I,, = 0.9764E - 3 mol/m3).
Dow
nloa
ded
by [
Tec
hnic
al U
nive
rsity
of
Cre
te]
at 0
8:34
14
Sept
embe
r 20
15
35.0
30.0
yI 25.0
g 20.0
t 8
E
0 .-
e 5 .- 15.0 >
c .- c i?J 10.0
5.0
0.0 0 . 1 . 2 . 3. 4. 5 .
Time (min)
FIG. 22. Effect of temperature perturbations on the model outputs (T = 220°C,f = 0.6, I . = 0.9764E - 3 mol/m3).
0.0
-0.1 UI c C .- g -0 .2 8
5 -0 .3 E
> c .-
0) v)
-0.4
-0.5
I
L 1 I 1
0 . 1 . 2. 3. 4. 5 . Time (min)
FIG. 23. Effect of initiator efficiency perturbations on the average molecular weights (T = 220"C,f = 0.6, I,, = 0.9764E - 3 molh3) .
Dow
nloa
ded
by [
Tec
hnic
al U
nive
rsity
of
Cre
te]
at 0
8:34
14
Sept
embe
r 20
15
342
0.0
- 1 .o v) c
.- 2 -2 .0 u .- r u-
-3 .0 c .- .E c v) .- v) 5 -4.0
-5 .0
-6.0
TZOGANAKIS ET AL.
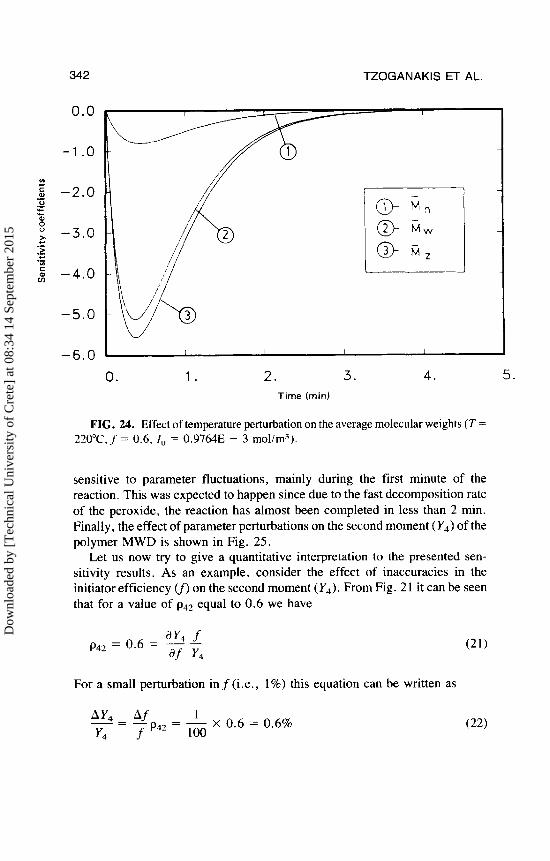
FIG. 24. Effect of temperature perturbation on the average molecular weights ( T = 220°C,f = 0.6, I , = 0.9764E - 3 mol/m3)).
sensitive to parameter fluctuations, mainly during the first minute of the reaction. This was expected to happen since due to the fast decomposition rate of the peroxide, the reaction has almost been completed in less than 2 min. Finally, the effect of parameter perturbations on the second moment ( Y4) of the polymer MWD is shown in Fig. 25.
Let us now try to give a quantitative interpretation to the presented sen- sitivity results. As an example, consider the effect of inaccuracies in the initiator efficiency cf) on the second moment (Y4). From Fig. 21 it can be seen that for a value of p42 equal to 0.6 we have
For a small perturbation in f (i.e., 1%) this equation can be written as
Dow
nloa
ded
by [
Tec
hnic
al U
nive
rsity
of
Cre
te]
at 0
8:34
14
Sept
embe
r 20
15
0 . 1 . 2 . 3. 4. 5 . Time (min)
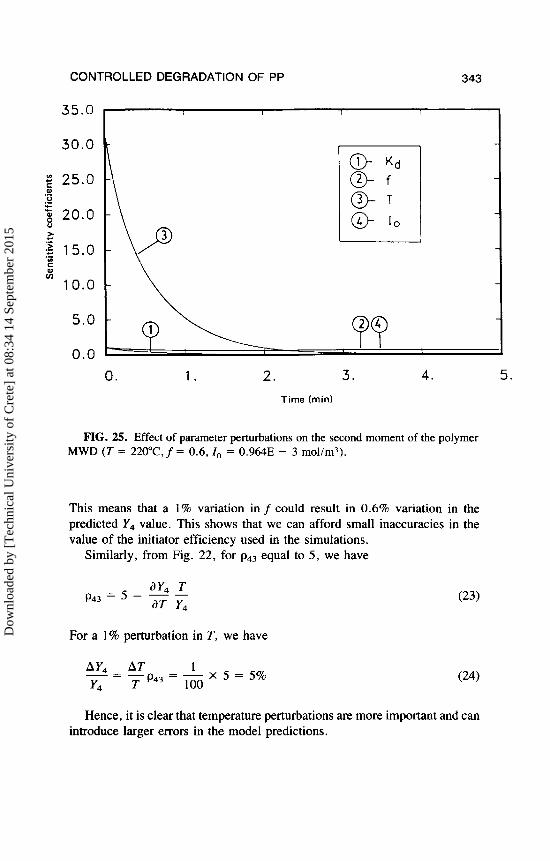
FIG. 25. Effect of parameter perturbations on the second moment of the polymer MWD ( T = 2 2 0 " C , f = 0.6, I , = 0.964E - 3 mourn3).
This means that a 1% variation in f could result in 0.6% variation in the predicted Y4 value. This shows that we can afford small inaccuracies in the value of the initiator efficiency used in the simulations.
Similarly, from Fig. 22, for p43 equal to 5, we have
d Y 4 T p d 3 = 5 = -- aT Y,
For a 1% perturbation in T, we have
- = - p , , = - X X = ~ % AY4 AT 1 y4 T 100
Hence, it is clear that temperature perturbations are more important and can introduce larger emrs in the model predictions.
Dow
nloa
ded
by [
Tec
hnic
al U
nive
rsity
of
Cre
te]
at 0
8:34
14
Sept
embe
r 20
15
344 TZOGANAKIS ET AL.
VII. CONCLUDING REMARKS
Some new results obtained during controlled degradation experiments of poly- propylene have been presented. The experiments were carried out in a single- screw extruder using a peroxide to promote chain scission. Peroxide concentra- tion levels were in the range 0.01-0.6 wt%, and it was verified that as peroxide increases, the molecular weight distribution of the polymer becomes narrower and it is shifted to lower molecular weights. As a result the melt flow index of the resin increases dramatically while the shear and elongational viscosities decrease considerably. Based on measurements of the MWD and of the shear viscosity of the resins at different temperatures, a correlation describing the shear viscosity as a function of shear rate, temperature, and weight average molecular weight was developed. By using the shear viscosity data and follow- ing Cogswell’s analysis of converging flows, the extensional viscosity of the produced CR resins was estimated as a function of strain rate. These estima- tions along with preliminary experimental results suggest that these PP resins exhibit better performance in fiber spinning.
A previously developed kinetic model was used successfully to predict the changes of the molecular weight distribution during the degradation reaction. A statistical sensitivity analysis of the model equations indicated that tempera- ture perturbations during the reaction can distort the model predictions, espe- cially during the first minute of the reaction, this being due to the very fast decomposition of the peroxide initiator.
Acknowledgments
Financial assistance from the Natural Sciences and Engineering Research Council of Canada is gratefully acknowledged. Also, the authors would like to thank Shell Canada for providing the polypropylene resin, Akzo Chemie for providing the peroxide, and Dr. J. Armonas of Modchrom, Inc., for the SEC measurements.
NOMENCLATURE
D
I
L
f’
kd
Die diameter, m Peroxide decomposition efficiency Peroxide concentration, mol/m? Peroxide decomposition rate constant, s- Die length, m
Dow
nloa
ded
by [
Tec
hnic
al U
nive
rsity
of
Cre
te]
at 0
8:34
14
Sept
embe
r 20
15
CONTROLLED DEGRADATION OF PP 345
Monomer molecular weight Number average molecular weight Viscosity average molecular weight Weight average molecular weight z-average average molecular weight Power-law index Bagley correction ifh moment of polymer distribution Volumetric flow rate, m3/s Die radius, m Time, s Temperature, K Dimensionless variables in equation (16)
Greek Letters
Apparent shear rate, s-1 Entrance pressure drop, Pa Extensional strain rate, s-l
Shear viscosity, Pa- s Extensional viscosity, Pa- s Normalized sensitivity coefficient Shear stress at the die wall, Pa Sensitivity coefficient
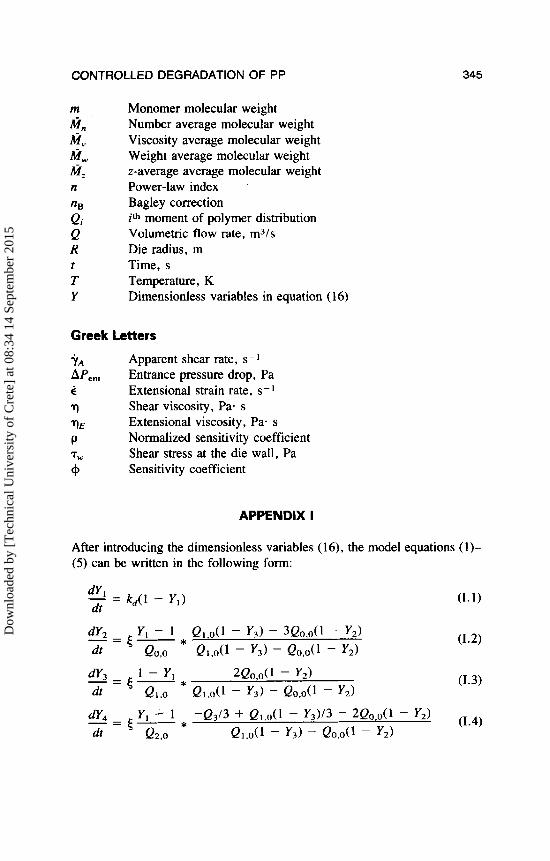
APPENDIX I
Dow
nloa
ded
by [
Tec
hnic
al U
nive
rsity
of
Cre
te]
at 0
8:34
14
Sept
embe
r 20
15
346 TZOGANAKIS ET AL.
where
5 = 2fk,l , (1.5)
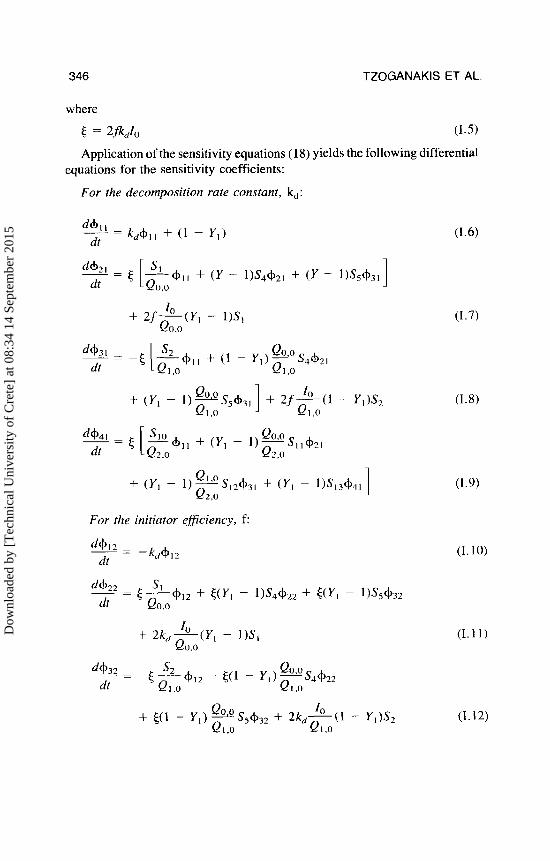
Application of the sensitivity equations (18) yields the following differential
For the decomposition rate constant, k,:
equations for the sensitivity coefficients:
For the initiator eflciency, f
-- d + i 2 - -kd+,* dt
QO 0
dt Qi.0 QI.O -- 432 - - + + I * - F,(l - Y I ) - s 4 4 2 2
Qo 0 10
Qi.0 Qi.0 + F,(1 - Y I ) -S5& + 2k,-(1
(1.9)
(1.10)
( 1 . 1 1 )
(1.12)
Dow
nloa
ded
by [
Tec
hnic
al U
nive
rsity
of
Cre
te]
at 0
8:34
14
Sept
embe
r 20
15
CONTROLLED DEGRADATION OF PP 347
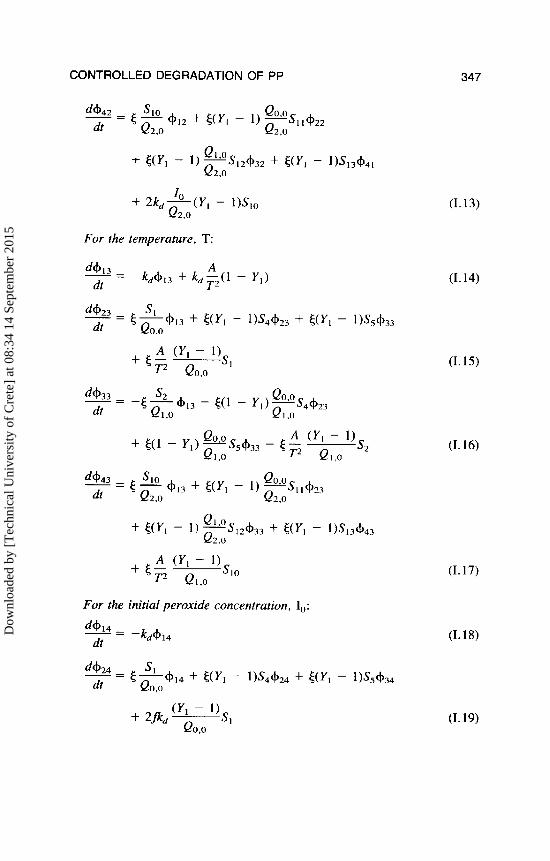
For the temperature, T:
(I. 14)
Dow
nloa
ded
by [
Tec
hnic
al U
nive
rsity
of
Cre
te]
at 0
8:34
14
Sept
embe
r 20
15
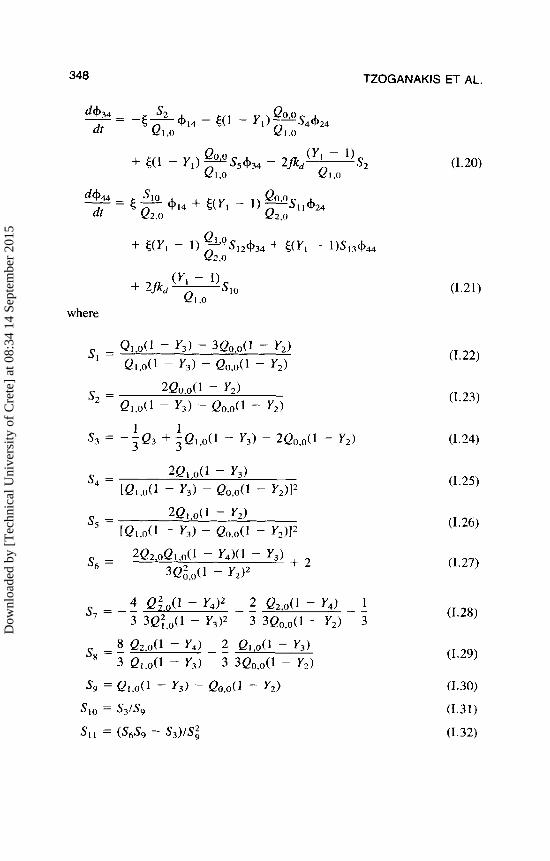
348 TZOGANAKIS ET AL.
where
(1.20)
(1.21)
(1.22)
(1.23)
(1.24)
(I. 25)
(1.26)
(1.27)
(1.28)
(1.29)
(1.30)
(1.31)
(1.32)
Dow
nloa
ded
by [
Tec
hnic
al U
nive
rsity
of
Cre
te]
at 0
8:34
14
Sept
embe
r 20
15

CONTROLLED DEGRADATION OF PP 349
APPENDIX I1
(1.33)
(1.34)
The average molecular weights of the polymer distribution can be calculated by the formulae:
(11.1)
(11.2)
(11.3)
The normalized sensitivity coefficients of the molecular weights are de-
(11.4)
(11.5)
(11.6)
(11.7)
(11.8)
Dow
nloa
ded
by [
Tec
hnic
al U
nive
rsity
of
Cre
te]
at 0
8:34
14
Sept
embe
r 20
15
350 TZOGANAKIS ET AL.
REFERENCES
121
131
141
I201 [211
H. P. Frank. Polypropylene, Gordon and Breach Science Publishers, New York, 1968. J. A. Biesenberger and D. H. Sebastian, Principles of Polymerization Engineer- ing, Wiley, New York, 1983. R . E. Green and E. T. Pieski, U.S. Patent 3,144,436 (1964), E. I . du Pont de Nemours Co. K. Babba, T. Shiota, K. Murakami, and K. Ono, Japanese Patent 7,379,X51 (1973), Surnitorno Chern. Co.: CA, 80 (1974). P. Hudec and L. Obdrzalek, Agnew. Makromol. Chem., 89, 41 (1980). H. G. Fritz and B. Stohrer, Intern. Polym. Proc., 1, 31 (1986). T. J. Henman, in Developments in Polymer Stubilisation--l ( G . Scott, ed.), Applied Science Publishers, London, 1979, p. 39. T. J . Henrnan, in Degradation and Stabilisation of Polyolefins (N. S. Allen, ed.), Applied Science Publishers, London, 1983, p. 29. M. Rado, Int. Chem. E n g . , 2 , 482 (1962). M. Dorn, Adv. Polym. Techn., 5 , 87 (1985). C. Tzoganakis, J. Vlachopoulos, and A. E. Hamielec, Polym. Eng. Sci. , 28. 170 (1988). H. M. Hulburt and S. Katz, Chem. Eng. Sci., 19, 555 (1964). C. D. Han, Rheology in Polymer Processing, Academic Press, New York, 1976. F. N. Cogswell, Polym. Eng. Sci., 12, 64 (1972). R . N. Schroff, L. V. Cancio, andM. Shida, Trans. Soc. Rheol., 21,429 (1977). H. M. Laun and H. Schuch, paper presented at the Winter Meeting of the Society of Rheology, Santa Monica, CA, 1987. G. Ritzau, 45th Annual Technical Conference of the SPE, 546, 1987. H. Westmijze, Akzo Chemie Netherlands, Personal communication, 1987. W. Minoshima, J. L. White, and J . E. Spruiell, Polym. Eng. Sci., 20, 1166 (1980). R. W. Atherton, R. B. Schainker, and E. R. Ducot, AIChE J . , 21,441 (1975). I. M. Thomas and C. Kiparissides, J. Appl. Polym. Sci., 29, 2195 (1984).
Dow
nloa
ded
by [
Tec
hnic
al U
nive
rsity
of
Cre
te]
at 0
8:34
14
Sept
embe
r 20
15