Embed Size (px)
Citation preview
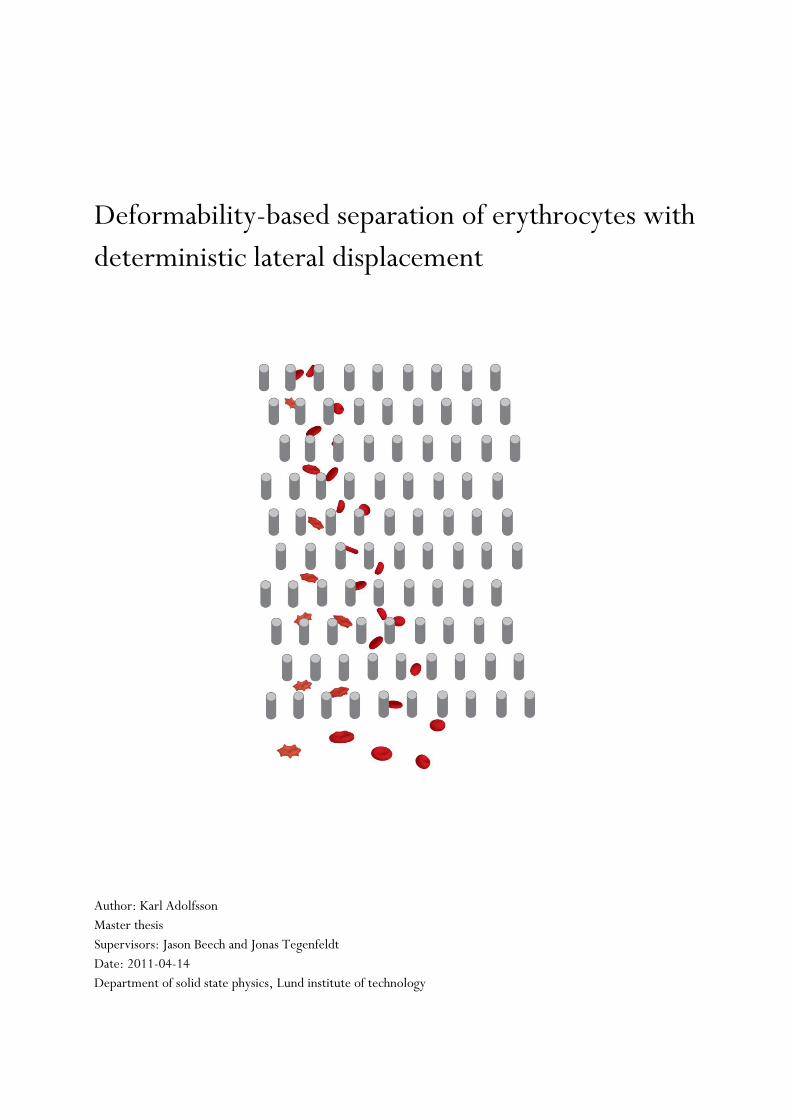
Deformability-based separation of erythrocytes with
deterministic lateral displacement
Author: Karl Adolfsson
Master thesis
Supervisors: Jason Beech and Jonas Tegenfeldt
Date: 2011-04-14
Department of solid state physics, Lund institute of technology

2
Acknowledgements I would like to thank Jason Beech, for showing me what it means to be a scientist, helping me whenever I asked
(which was very often) and for inspiring me with his interesting ideas. Also, I want to thank Jonas Tegenfeldt for
the much appreciated guidance and for letting me be a part of his research group and Stefan Holm who paved the
way for me and was always eager to help.
More people I feel have helped me:
The bio group at solid state physics, for letting me practice rhetorics and the interesting discussions.
Bo Baldetorp, department of oncology, for teaching us basic flow cytometry and for letting us use their FACS
and lastly; Karin Lindström and my family for supporting me.

3
Keywords
Deterministic lateral displacement, erythrocyte, red blood cells, deformability, microfluidics, cell sorting,
anemia, blood disorders, diagnostics, biophysics, cell morphology, hematology, rheology.
Summary
Discocytes and erythrocytes with (artificially induced) disease related morphologies were introduced in
deterministic lateral displacement (DLD) devices of different depths and at varying shear rates, in order to
evaluate DLD as a blood diagnostics tool.
Comparison with flow cytometry (FACS) results for corresponding erythrocyte morphologies indicate that the
DLD can be used to study some equivalent cell indices and furthermore; DLD is able to discriminate based on
parameters not visible in the FACS. Also, static velocity field particle simulations are presented as a tool to
estimate some aspects of particle behavior in DLD devices.
4
Contents 1 Introduction . . . . . . . . . . . . . . . . . . . . . . . . . . . . . . . . . . . . . . . . . . . . . . . . . . . . . 5
1.1 Abbreviations and constants . . . . . . . . . . . . . . . . . . . . . . . . . . . . . . . . . . . . . . . . . . . . . . . . . . . . . .6
2 Overview of the field . . . . . . . . . . . . . . . . . . . . . . . . . . . . . . . . . . . . . . . . . . .7-9 2.1 Components . . . . . . . . . . . . . . . . . . . . . . . . . . . . . . . . . . . . . . . . . . . . . . . . . . . . . . . . . . . . . . . 7-8
2.1.1 Separation . . . . . . . . . . . . . . . . . . . . . . . . . . . . . . . . . . . . . . . . . . . . . . . . . . . . 7-8
2.2 Materials and fabrication . . . . . . . . . . . . . . . . . . . . . . . . . . . . . . . . . . . . . . . . . . . . . . . . . . . . . . . . .8
2.2.1 PDMS . . . . . . . . . . . . . . . . . . . . . . . . . . . . . . . . . . . . . . . . . . . . . . . . . . . . . . . . .8
2.2.2 PLL-PEG . . . . . . . . . . . . . . . . . . . . . . . . . . . . . . . . . . . . . . . . . . . . . . . . . . . . . . .8
2.3 Bio-applications . . . . . . . . . . . . . . . . . . . . . . . . . . . . . . . . . . . . . . . . . . . . . . . . . . . . . . . . . . . . . . 9
3 Theory . . . . . . . . . . . . . . . . . . . . . . . . . . . . . . . . . . . . . . . . . . . . . . . . . . . . . . . . 10-17 3.1 Fundamental blood characteristics . . . . . . . . . . . . . . . . . . . . . . . . . . . . . . . . . . . . . . . . . . . . . . . . .10
3.1.1 Blood pathology . . . . . . . . . . . . . . . . . . . . . . . . . . . . . . . . . . . . . . . . . . . . . . . . 11
3.1.2 Bilayer-couple theory . . . . . . . . . . . . . . . . . . . . . . . . . . . . . . . . . . . . . . . . . . . 10-11
3.2 Deterministic lateral displacement . . . . . . . . . . . . . . . . . . . . . . . . . . . . . . . . . . . . . . . . . . . . . . 12-15
3.3 Experimental setup and method. . . . . . . . . . . . . . . . . . . . . . . . . . . . . . . . . . . . . . . . . . . . . . . . . 15-16
3.3.1 Fabrication process . . . . . . . . . . . . . . . . . . . . . . . . . . . . . . . . . . . . . . . . . . . . . . . 15
3.3.2 Material. . . . . . . . . . . . . . . . . . . . . . . . . . . . . . . . . . . . . . . . . . . . . . . . . . . . . . . 15
3.3.3 Cell handling. . . . . . . . . . . . . . . . . . . . . . . . . . . . . . . . . . . . . . . . . . . . . . . . . . . .16
3.3.4 Data evaluation. . . . . . . . . . . . . . . . . . . . . . . . . . . . . . . . . . . . . . . . . . . . . . . . . . 16
3.3.5 DLD experiments. . . . . . . . . . . . . . . . . . . . . . . . . . . . . . . . . . . . . . . . . . . . . . . . 17
3.3.6 FACS experiments. . . . . . . . . . . . . . . . . . . . . . . . . . . . . . . . . . . . . . . . . . . . . . . .17
4 Results . . . . . . . . . . . . . . . . . . . . . . . . . . . . . . . . . . . . . . . . . . . . . . . . . . . . . . . . 18-25 4.1 Erythrocyte morphologies. . . . . . . . . . . . . . . . . . . . . . . . . . . . . . . . . . . . . . . . . . . . . . . . . . . . . 18-19
4.2 DLD results. . . . . . . . . . . . . . . . . . . . . . . . . . . . . . . . . . . . . . . . . . . . . . . . . . . . . . . . . . . . . . .20-23
4.2.1 Discocytes. . . . . . . . . . . . . . . . . . . . . . . . . . . . . . . . . . . . . . . . . . . . . . . . . . .20, 23
4.2.2 Echinocytes and stomatocytes. . . . . . . . . . . . . . . . . . . . . . . . . . . . . . . . . . . . . .21-23
4.3 FACS results. . . . . . . . . . . . . . . . . . . . . . . . . . . . . . . . . . . . . . . . . . . . . . . . . . . . . . . . . . . . . . 24-25
5 Discussion. . . . . . . . . . . . . . . . . . . . . . . . . . . . . . . . . . . . . . . . . . . . . . . . . . . . .26-33
5.1 Discocytes. . . . . . . . . . . . . . . . . . . . . . . . . . . . . . . . . . . . . . . . . . . . . . . . . . . . . . . . . . . . . . . . 26-27
5.2 Induced morphologies. . . . . . . . . . . . . . . . . . . . . . . . . . . . . . . . . . . . . . . . . . . . . . . . . . . . . . . 27-29
5.3 Comparison with FACS. . . . . . . . . . . . . . . . . . . . . . . . . . . . . . . . . . . . . . . . . . . . . . . . . . . . . . .29-30
5.4 Finite element simulations. . . . . . . . . . . . . . . . . . . . . . . . . . . . . . . . . . . . . . . . . . . . . . . . . . . . .30-31
5.5 Conclusions. . . . . . . . . . . . . . . . . . . . . . . . . . . . . . . . . . . . . . . . . . . . . . . . . . . . . . . . . . . . . . .31-32
5.6 Outlook. . . . . . . . . . . . . . . . . . . . . . . . . . . . . . . . . . . . . . . . . . . . . . . . . . . . . . . . . . . . . . . . . 32-33
6 References . . . . . . . . . . . . . . . . . . . . . . . . . . . . . . . . . . . . . . . . . . . . . . . . . . . . 34-36
7 Appendix. . . . . . . . . . . . . . . . . . . . . . . . . . . . . . . . . . . . . . . . . . . . . . . . . . . . . .37-40
7.1 Lab schemes. . . . . . . . . . . . . . . . . . . . . . . . . . . . . . . . . . . . . . . . . . . . . . . . . . . . . . . . . . . . . . .37-39
7.2 Matlab coding. . . . . . . . . . . . . . . . . . . . . . . . . . . . . . . . . . . . . . . . . . . . . . . . . . . . . . . . . . . . . . . .40
5
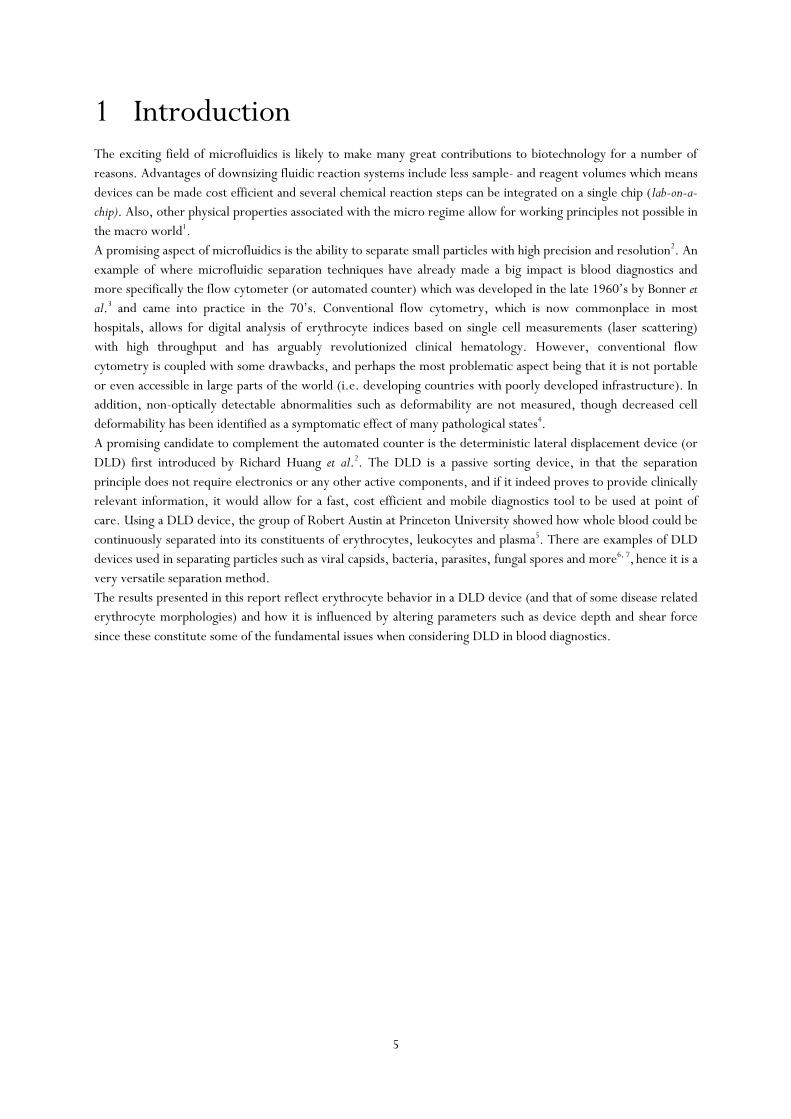
1 Introduction The exciting field of microfluidics is likely to make many great contributions to biotechnology for a number of
reasons. Advantages of downsizing fluidic reaction systems include less sample- and reagent volumes which means
devices can be made cost efficient and several chemical reaction steps can be integrated on a single chip (lab-on-a-
chip). Also, other physical properties associated with the micro regime allow for working principles not possible in
the macro world1.
A promising aspect of microfluidics is the ability to separate small particles with high precision and resolution2. An
example of where microfluidic separation techniques have already made a big impact is blood diagnostics and
more specifically the flow cytometer (or automated counter) which was developed in the late 1960’s by Bonner et
al.3 and came into practice in the 70’s. Conventional flow cytometry, which is now commonplace in most
hospitals, allows for digital analysis of erythrocyte indices based on single cell measurements (laser scattering)
with high throughput and has arguably revolutionized clinical hematology. However, conventional flow
cytometry is coupled with some drawbacks, and perhaps the most problematic aspect being that it is not portable
or even accessible in large parts of the world (i.e. developing countries with poorly developed infrastructure). In
addition, non-optically detectable abnormalities such as deformability are not measured, though decreased cell
deformability has been identified as a symptomatic effect of many pathological states4.
A promising candidate to complement the automated counter is the deterministic lateral displacement device (or
DLD) first introduced by Richard Huang et al.2. The DLD is a passive sorting device, in that the separation
principle does not require electronics or any other active components, and if it indeed proves to provide clinically
relevant information, it would allow for a fast, cost efficient and mobile diagnostics tool to be used at point of
care. Using a DLD device, the group of Robert Austin at Princeton University showed how whole blood could be
continuously separated into its constituents of erythrocytes, leukocytes and plasma5. There are examples of DLD
devices used in separating particles such as viral capsids, bacteria, parasites, fungal spores and more6, 7, hence it is a
very versatile separation method.
The results presented in this report reflect erythrocyte behavior in a DLD device (and that of some disease related
erythrocyte morphologies) and how it is influenced by altering parameters such as device depth and shear force
since these constitute some of the fundamental issues when considering DLD in blood diagnostics.
6
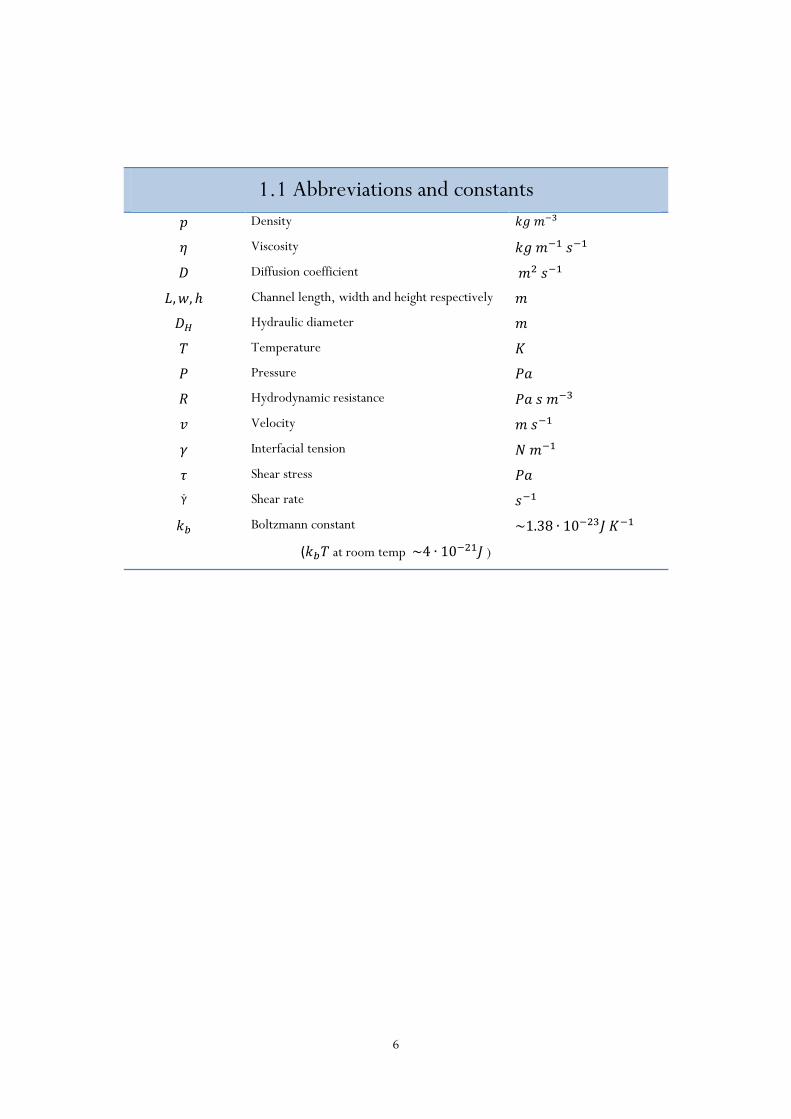
1.1 Abbreviations and constants
Density
Viscosity
Diffusion coefficient
Channel length, width and height respectively
Hydraulic diameter
Temperature
Pressure
Hydrodynamic resistance
Velocity
Interfacial tension
Shear stress
Shear rate
Boltzmann constant
( at room temp )
7
2 Overview of the field The developments and possibilities of microfluidics have inspired many to try to create cheaper, faster and more
portable means for diagnostics and bio-applications in general. In this microfluidic regime, different physical
properties have led to a new way of thinking where laminarity, diffusion and interfacial forces are fundamental
building blocks which can be used to create complex biological or chemical systems which many believe will
revolutionize the field of biotechnology.
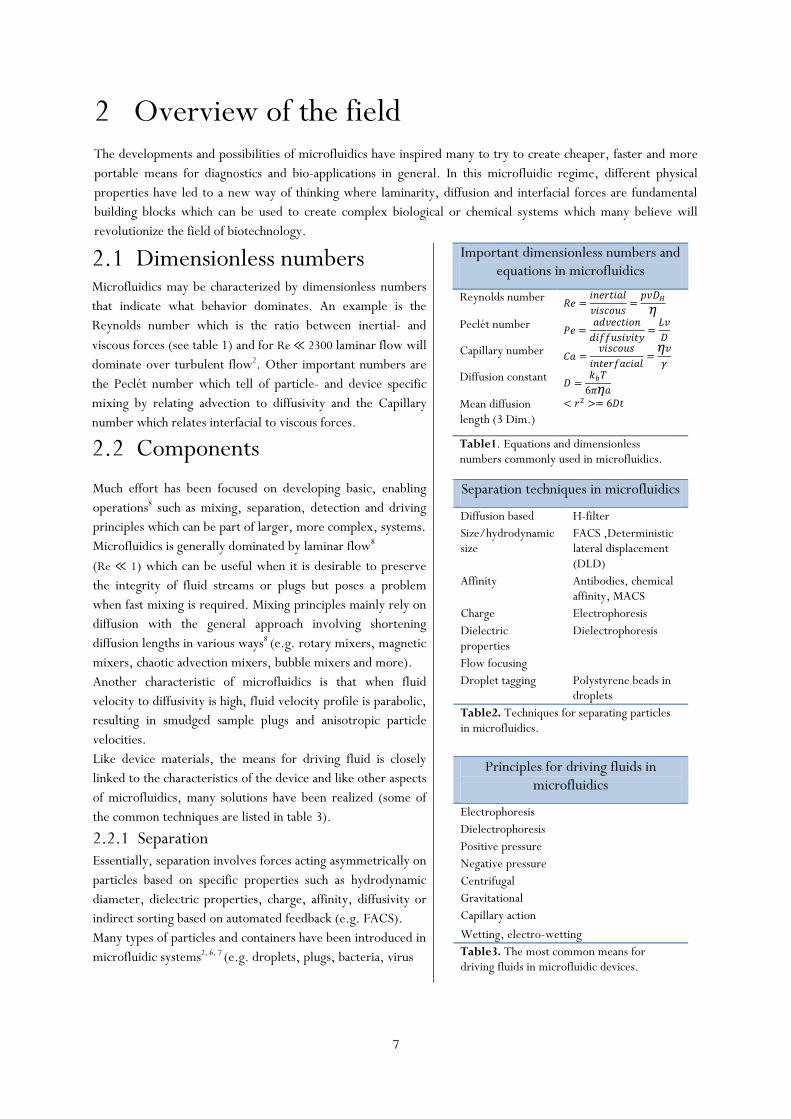
2.1 Dimensionless numbers Microfluidics may be characterized by dimensionless numbers
that indicate what behavior dominates. An example is the
Reynolds number which is the ratio between inertial- and
viscous forces (see table 1) and for Re 2300 laminar flow will
dominate over turbulent flow2. Other important numbers are
the Peclét number which tell of particle- and device specific
mixing by relating advection to diffusivity and the Capillary
number which relates interfacial to viscous forces.
2.2 Components
Important dimensionless numbers and equations in microfluidics
Reynolds number
Peclét number
Capillary number
Diffusion constant
Mean diffusion length (3 Dim.)
Table1. Equations and dimensionless numbers commonly used in microfluidics.
Much effort has been focused on developing basic, enabling
operations8 such as mixing, separation, detection and driving
principles which can be part of larger, more complex, systems.
Microfluidics is generally dominated by laminar flow8
(Re 1) which can be useful when it is desirable to preserve
the integrity of fluid streams or plugs but poses a problem
when fast mixing is required. Mixing principles mainly rely on
diffusion with the general approach involving shortening
diffusion lengths in various ways8 (e.g. rotary mixers, magnetic
mixers, chaotic advection mixers, bubble mixers and more).
Another characteristic of microfluidics is that when fluid
velocity to diffusivity is high, fluid velocity profile is parabolic,
resulting in smudged sample plugs and anisotropic particle
velocities.
Like device materials, the means for driving fluid is closely
linked to the characteristics of the device and like other aspects
of microfluidics, many solutions have been realized (some of
the common techniques are listed in table 3).
2.2.1 Separation Essentially, separation involves forces acting asymmetrically on
particles based on specific properties such as hydrodynamic
diameter, dielectric properties, charge, affinity, diffusivity or
indirect sorting based on automated feedback (e.g. FACS).
Many types of particles and containers have been introduced in
microfluidic systems2, 6, 7 (e.g. droplets, plugs, bacteria, virus
Separation techniques in microfluidics
Diffusion based H-filter
Size/hydrodynamic size
FACS ,Deterministic lateral displacement (DLD)
Affinity Antibodies, chemical affinity, MACS
Charge Electrophoresis
Dielectric properties
Dielectrophoresis
Flow focusing
Droplet tagging Polystyrene beads in droplets
Table2. Techniques for separating particles in microfluidics.
Principles for driving fluids in microfluidics
Electrophoresis
Dielectrophoresis
Positive pressure
Negative pressure
Centrifugal
Gravitational
Capillary action
Wetting, electro-wetting
Table3. The most common means for driving fluids in microfluidic devices.
8
capsules, various cell types and more) hence many different separation techniques have been introduced and the
technique of choice depends on the setup. Interestingly separation techniques are exceptionally diverse and some
common means of separation8 are listed in table 2.
2.3 Materials and fabrication Initially, silicon was the most commonly used device material, mainly because its use in microelectronics and
consequently being a well-known material for micro fabrication. As an alternative, Xia and Whitesides proposed
soft lithography with polydimethylsiloxane (PDMS) i.e. using a silicon master to produce multiple identical
moldings in an elastomer9. This resulted in cheaper devices, less susceptible to breakage, and generally better
suited for many applications. Soft lithography is currently one of the most common approaches for the reasons
mentioned and due to the fact that PDMS is permeable to gas which is often desirable when dealing with
biological samples such as cells. The pursuit of cheap and simple working-principles is an apparent trait of the
microfluidics field and a prominent example of this mentality is the “paper-based” devices used in pregnancy tests
which are now commonplace in supermarkets.
2.3.1 PDMS Normally 10:1 PDMS to curing agent is mixed, poured on to a master and baked in 80 ℃ for about an hour.
After the curing process, it is often treated with oxygen plasma to create superficial Si-OH groups which promote
PDMS to glass (or PDMS) attachment and produce a hydrophilic surface.
Polydimethylsiloxane is an elastomer with many useful properties, such as gas permeability (as mentioned),
transparency in the visible range (which allows for optical evaluation) and shrinkage of less than 1% after curing9.
Another interesting feature of PDMS is its elastic nature, which allows for very dynamic device designs19. There
are however some limitations in terms of width-to-height ratios to prevent channels from collapsing (due to its
elastic/soft nature) and is therefore not suitable for all device designs.
2.3.2 PLL-PEG To prevent cells and other complex samples from sticking to PDMS, a large compound known as poly-L-lysine-
grafted poly-ethylene-glycol (PLL-PEG) is often used to coat the inner walls10. Adhesion to the electronegative
surface (normally induced with oxygen plasma treatment) is facilitated by attraction of protonated amine
functional groups of the lysine side chains in the poly-L-lysine backbone. The poly-ethylene-glycol serves as an
anti-sticking agent by distancing sample molecules from the walls (i.e. as a polymer brush).
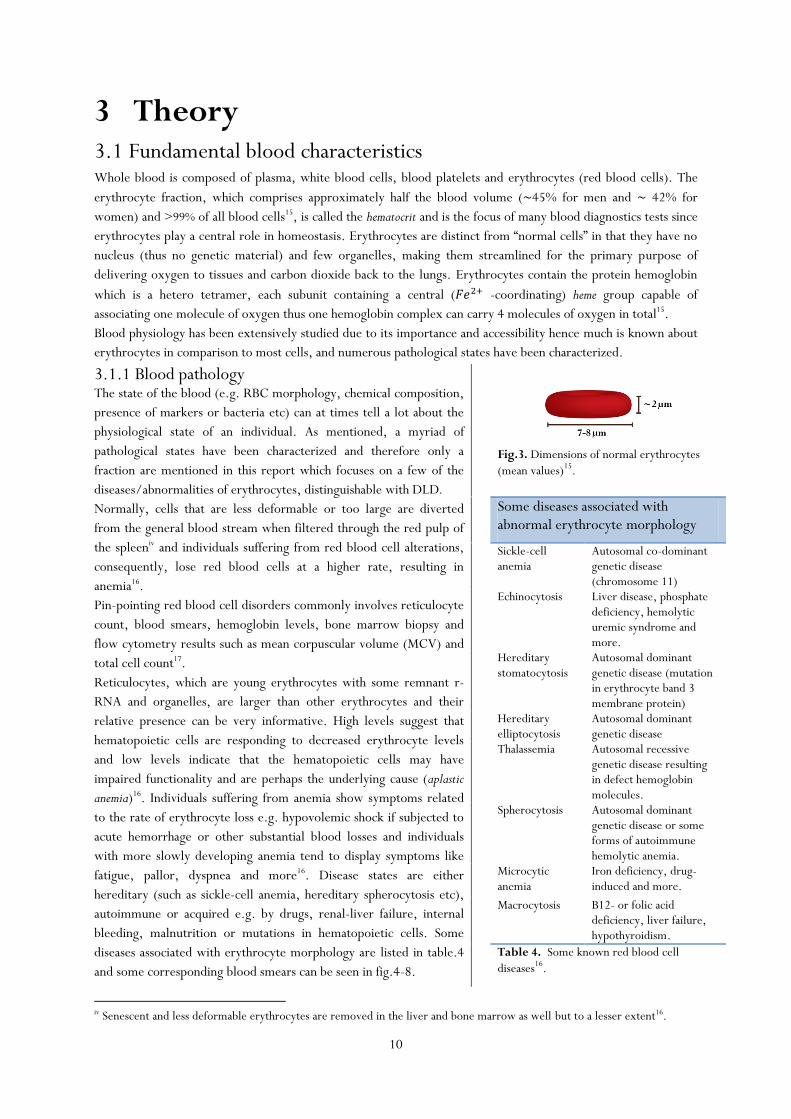
2.4 Bio applications of microfluidics Many believe microfluidics will have a very big impact on diagnostics, in
particular, which is consequently the focus of many research groups2, 7, 11.
Much optimism is due to the possibilities in terms of portability and low
costs in combination with new diagnostic principles. In developing
countries where there is an unmet need for cheap diagnostics tools, these
kinds of devices could prove particularly useful. Today, one of the most
well-known diagnostics tools involving microfluidics is perhaps the flow
cytometer3 (and variations such as fluorescence activated cell sorting or
FACS) which is found in large hospitals. Though it is normally not
regarded as a microfluidics device in the current sense because of the
complex and expensive setup which is difficult to implement in a
portable format. That being said, microfluidics has yet to establish as a
commercially successful industry in the biotech field.
For practical reasons, diagnostics is predominantly focused on easily
Fig.1 An example of digital microfluidics (top)i and a microfluidic device with many valves and inlets (bottom)ii .
iCourtesy of asst. prof. Manu Prakash Stanford university. iiCourtesy of Folch lab, University of Washington, Seattle.
9
accessible entities such as blood and excretional substances though future systems might be more versatile. Many
groups focus on blood because it is easily accessible and holds many parameters of clinical relevance.
Many methods involve separation without the use of specific markers2, 7 (i.e. antibodies) which make devices
cheaper and more versatile (though markers could of course be used as well).
Cell viability of isolated cells is especially valuable in order to study pharmaceutical effects on a specific cancerous
species12 and because microfluidics commonly involve in vivo like shear conditions, this kind of viable-cell-
diagnostics hold great promise. Toner et al. have shown how rare (metastatic) circulating tumor cells (CTCs)
could be detected at concentrations as low as 5 cells /ml whole blood, while maintaining viability using antibody-
coated micro pillars in a laminar flow micro array13.
Devices capable of detecting foreign bodies such as bacteria, virus and parasites have also been proposed. Holm
and Beech et al. recently showed how sleeping sickness parasites (trypanosomes) could be isolated from whole
blood based on hydrodynamic size with DLD14.
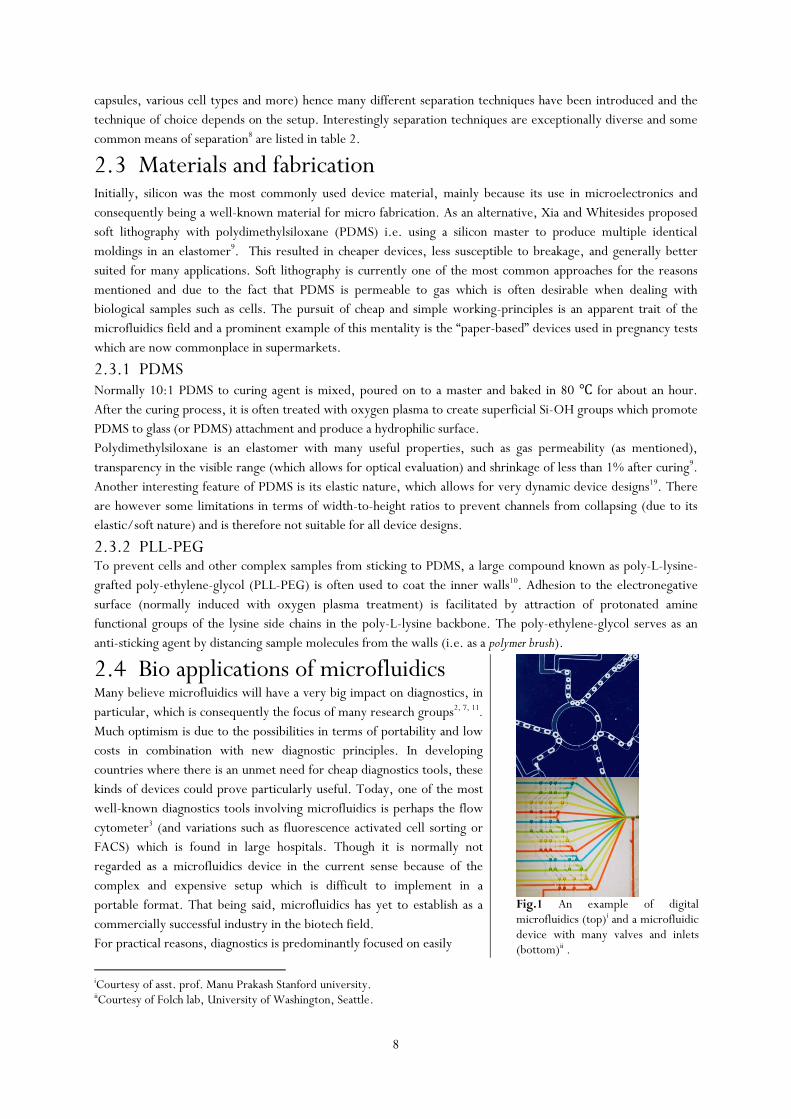
Other promising areas of microfluidics is digital sequencing of genomes and proteomics8, 11 where droplet fluidics
(or digital microfluidics) in particular, is considered promising for cyclic reactions such as these (e.g. PCR) which
involve many steps and high demand on precise quantities, fast thermal relaxation and sample integrity. Current
techniques allow for formation of highly uniform droplets in the femtoliter regime at very high frequencies.
Fig.2 Fluorescent polystyrene beads trapped in water-in-oil-dropletsiii.
iii An earlier project the author worked with in the experimental biophysics course (TEK265) at LTH.
10
3 Theory 3.1 Fundamental blood characteristics Whole blood is composed of plasma, white blood cells, blood platelets and erythrocytes (red blood cells). The
erythrocyte fraction, which comprises approximately half the blood volume ( 45% for men and 42% for
women) and >99% of all blood cells15, is called the hematocrit and is the focus of many blood diagnostics tests since
erythrocytes play a central role in homeostasis. Erythrocytes are distinct from “normal cells” in that they have no
nucleus (thus no genetic material) and few organelles, making them streamlined for the primary purpose of
delivering oxygen to tissues and carbon dioxide back to the lungs. Erythrocytes contain the protein hemoglobin
which is a hetero tetramer, each subunit containing a central ( -coordinating) heme group capable of
associating one molecule of oxygen thus one hemoglobin complex can carry 4 molecules of oxygen in total15.
Blood physiology has been extensively studied due to its importance and accessibility hence much is known about
erythrocytes in comparison to most cells, and numerous pathological states have been characterized.
iv Senescent and less deformable erythrocytes are removed in the liver and bone marrow as well but to a lesser extent16.
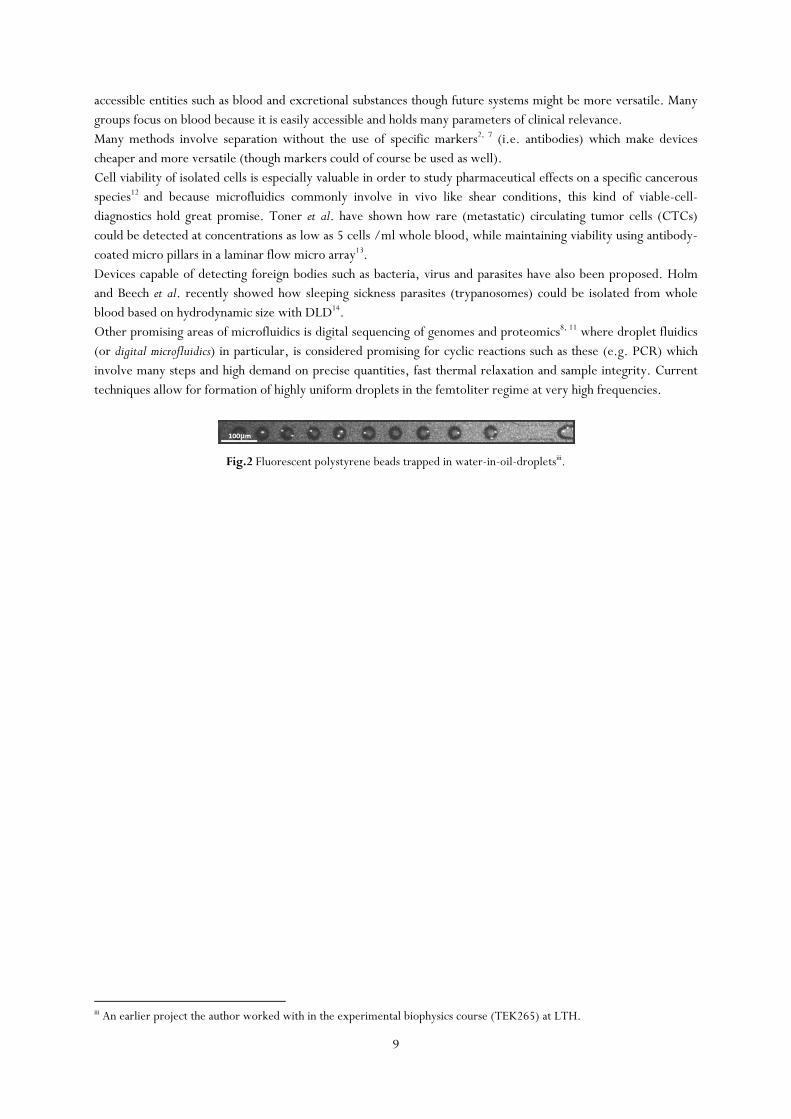
3.1.1 Blood pathology The state of the blood (e.g. RBC morphology, chemical composition,
presence of markers or bacteria etc) can at times tell a lot about the
physiological state of an individual. As mentioned, a myriad of
pathological states have been characterized and therefore only a
fraction are mentioned in this report which focuses on a few of the
diseases/abnormalities of erythrocytes, distinguishable with DLD.
Normally, cells that are less deformable or too large are diverted
from the general blood stream when filtered through the red pulp of
the spleeniv and individuals suffering from red blood cell alterations,
consequently, lose red blood cells at a higher rate, resulting in
anemia16.
Pin-pointing red blood cell disorders commonly involves reticulocyte
count, blood smears, hemoglobin levels, bone marrow biopsy and
flow cytometry results such as mean corpuscular volume (MCV) and
total cell count17.
Reticulocytes, which are young erythrocytes with some remnant r-
RNA and organelles, are larger than other erythrocytes and their
relative presence can be very informative. High levels suggest that
hematopoietic cells are responding to decreased erythrocyte levels
and low levels indicate that the hematopoietic cells may have
impaired functionality and are perhaps the underlying cause (aplastic
anemia)16. Individuals suffering from anemia show symptoms related
to the rate of erythrocyte loss e.g. hypovolemic shock if subjected to
acute hemorrhage or other substantial blood losses and individuals
with more slowly developing anemia tend to display symptoms like
fatigue, pallor, dyspnea and more16. Disease states are either
hereditary (such as sickle-cell anemia, hereditary spherocytosis etc),
autoimmune or acquired e.g. by drugs, renal-liver failure, internal
bleeding, malnutrition or mutations in hematopoietic cells. Some
diseases associated with erythrocyte morphology are listed in table.4
and some corresponding blood smears can be seen in fig.4-8.
Fig.3. Dimensions of normal erythrocytes
(mean values)15.
Some diseases associated with abnormal erythrocyte morphology
Sickle-cell anemia
Autosomal co-dominant genetic disease (chromosome 11)
Echinocytosis Liver disease, phosphate deficiency, hemolytic uremic syndrome and more.
Hereditary stomatocytosis
Autosomal dominant genetic disease (mutation in erythrocyte band 3 membrane protein)
Hereditary elliptocytosis
Autosomal dominant genetic disease
Thalassemia Autosomal recessive genetic disease resulting in defect hemoglobin molecules.
Spherocytosis Autosomal dominant genetic disease or some forms of autoimmune hemolytic anemia.
Microcytic anemia
Iron deficiency, drug-induced and more.
Macrocytosis B12- or folic acid deficiency, liver failure, hypothyroidism.
Table 4. Some known red blood cell
diseases16.
11
v American society of hematology image bank (ASH image bank).
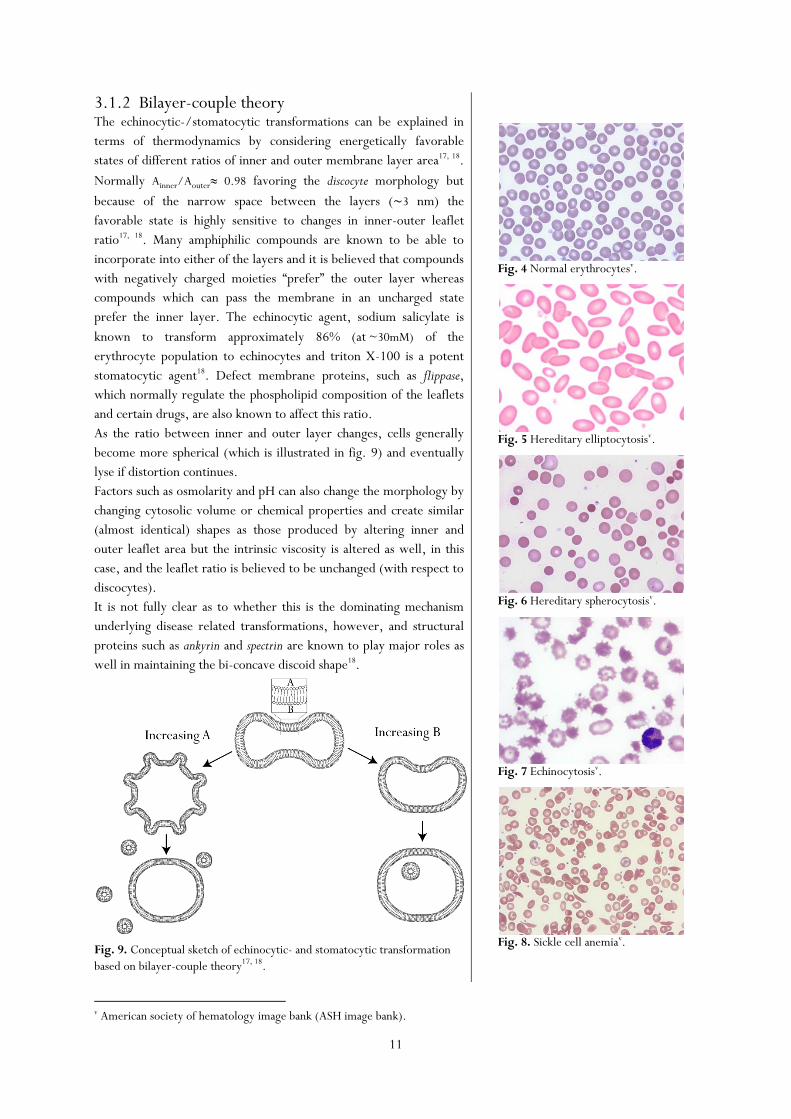
3.1.2 Bilayer-couple theory The echinocytic-/stomatocytic transformations can be explained in
terms of thermodynamics by considering energetically favorable
states of different ratios of inner and outer membrane layer area17, 18.
Normally Ainner/Aouter≈ 0.98 favoring the discocyte morphology but
because of the narrow space between the layers ( 3 nm) the
favorable state is highly sensitive to changes in inner-outer leaflet
ratio17, 18. Many amphiphilic compounds are known to be able to
incorporate into either of the layers and it is believed that compounds
with negatively charged moieties “prefer” the outer layer whereas
compounds which can pass the membrane in an uncharged state
prefer the inner layer. The echinocytic agent, sodium salicylate is
known to transform approximately 86% (at ~30mM) of the
erythrocyte population to echinocytes and triton X-100 is a potent
stomatocytic agent18. Defect membrane proteins, such as flippase,
which normally regulate the phospholipid composition of the leaflets
and certain drugs, are also known to affect this ratio.
As the ratio between inner and outer layer changes, cells generally
become more spherical (which is illustrated in fig. 9) and eventually
lyse if distortion continues.
Factors such as osmolarity and pH can also change the morphology by
changing cytosolic volume or chemical properties and create similar
(almost identical) shapes as those produced by altering inner and
outer leaflet area but the intrinsic viscosity is altered as well, in this
case, and the leaflet ratio is believed to be unchanged (with respect to
discocytes).
It is not fully clear as to whether this is the dominating mechanism
underlying disease related transformations, however, and structural
proteins such as ankyrin and spectrin are known to play major roles as
well in maintaining the bi-concave discoid shape18.
Fig. 9. Conceptual sketch of echinocytic- and stomatocytic transformation
based on bilayer-couple theory17, 18.
Fig. 4 Normal erythrocytesv.
Fig. 5 Hereditary elliptocytosisv.
Fig. 6 Hereditary spherocytosisv.
Fig. 7 Echinocytosisv.
Fig. 8. Sickle cell anemiav.
12
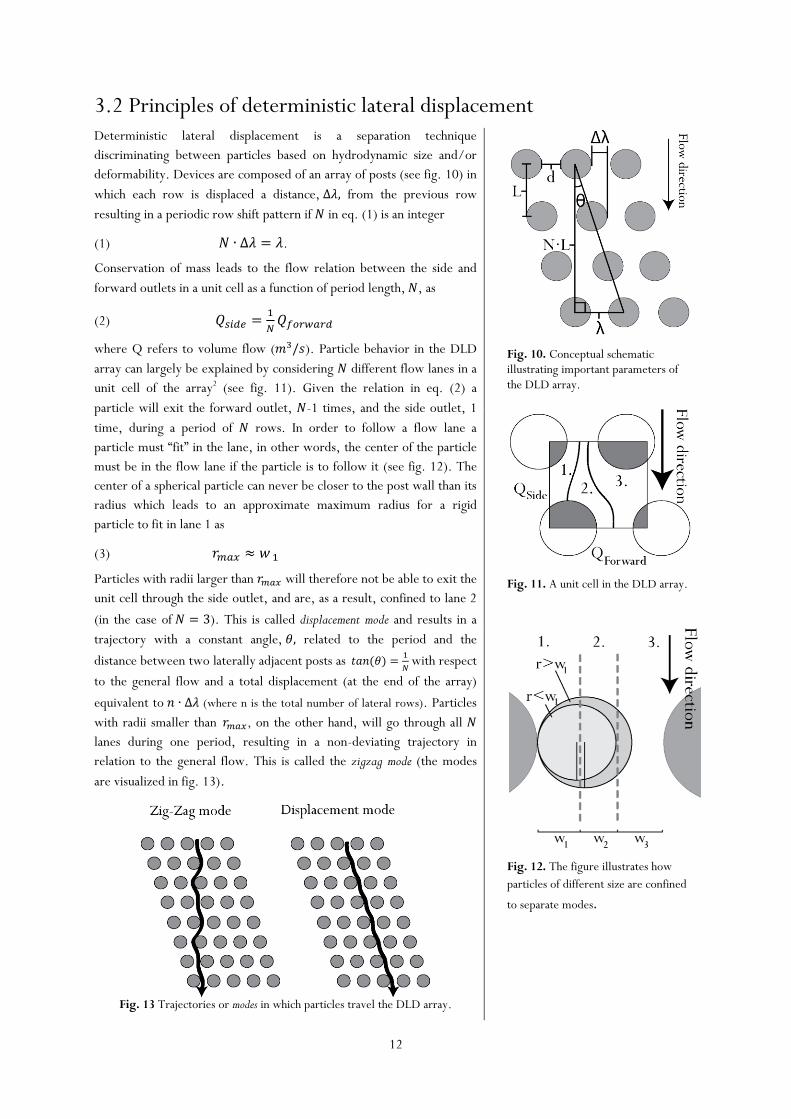
3.2 Principles of deterministic lateral displacement Deterministic lateral displacement is a separation technique
discriminating between particles based on hydrodynamic size and/or
deformability. Devices are composed of an array of posts (see fig. 10) in
which each row is displaced a distance, from the previous row
resulting in a periodic row shift pattern if in eq. (1) is an integer
(1) .
Conservation of mass leads to the flow relation between the side and
forward outlets in a unit cell as a function of period length, , as
(2)
where Q refers to volume flow ( ). Particle behavior in the DLD
array can largely be explained by considering different flow lanes in a
unit cell of the array2 (see fig. 11). Given the relation in eq. (2) a
particle will exit the forward outlet, -1 times, and the side outlet, 1
time, during a period of rows. In order to follow a flow lane a
particle must “fit” in the lane, in other words, the center of the particle
must be in the flow lane if the particle is to follow it (see fig. 12). The
center of a spherical particle can never be closer to the post wall than its
radius which leads to an approximate maximum radius for a rigid
particle to fit in lane 1 as
(3)
Particles with radii larger than will therefore not be able to exit the
unit cell through the side outlet, and are, as a result, confined to lane 2
(in the case of ). This is called displacement mode and results in a
trajectory with a constant angle, related to the period and the
distance between two laterally adjacent posts as
with respect
to the general flow and a total displacement (at the end of the array)
equivalent to (where n is the total number of lateral rows). Particles
with radii smaller than , on the other hand, will go through all
lanes during one period, resulting in a non-deviating trajectory in
relation to the general flow. This is called the zigzag mode (the modes
are visualized in fig. 13).
Fig. 13 Trajectories or modes in which particles travel the DLD array.
Fig. 10. Conceptual schematic illustrating important parameters of the DLD array.
Fig. 11. A unit cell in the DLD array.
Fig. 12. The figure illustrates how
particles of different size are confined
to separate modes.

13
When dealing with irregular and/or deformable particles such as cells,
many parameters influence the effective radius (or hydrodynamic radius)
and in some cases it may change along the array (due to repeated plastic
deformation). These factors may, in some cases, complicate separation
in heterogeneous samples but can actually be utilized to discriminate
between subpopulations when studying a seemingly homogenous
population and it is the main topic of this report.
Soft particles deform when subjected to shear stress which, in the
DLD, is largest between two laterally adjacent posts since shear
stress
. Depending on the Young’s modulus of a particle it will,
to various extents, appear smaller in the DLD because the
hydrodynamic radius decreases as it deforms (fig. 15 and fig. 16.B)
Fig. 15. Illustrates how the parabolic flow profile, which relates to the
geometry as * (
)
+, is linked to the viscous drag acting on
a particle.
Fig. 14. Illustrates flow lanes along the array
Irregular particles can be affected by the parabolic flow profile in the DLD in different ways depending on which
mode a particle is in; if in displacement mode, particles tend to rotate continuously (or flip) due to asymmetric
viscous drag as depicted in fig. 16A but if the particle is in zigzag mode it will not rotate in the same sense because
the effective shear (that the particle experiences) is changing continuously as it passes between flow lanes. Rigid
sphere-like particles are likely to flip in displacement mode as well but this cannot be seen due to the symmetric
nature of a (homochromatic) sphere.
Fig. 16. Illustrates how the parabolic flow profile results in asymmetric viscous drag acting on: (A) an irregular particle (B) a
soft particle.

14
If the particle is deformable (and in displacement mode) components of both deformation and flipping influence
its behavior in the DLD and shear rate, deformability and relaxation time determines what behavior is
dominating. As mentioned, flipping is mostly observed in displacement mode because the net rotational force
acting on a particle travelling through all lanes during a period in zig-zag mode is zero. If the period length, N, is
very high one might expect to see flipping as well but the particle would change rotational direction after
approximately N/2 rows.
Device designs often involve many sections associated with different critical radii through the length of the array
(a chirped device) which consequently allows for distinction between many different particle sizes2. Normally it is
crucial to have quite a good idea about what size ranges and critical radii to use for a given particle type in order to
create a device from which relevant results can be drawn. However, it has been shown that devices composed
entirely out of polydimethylsiloxane (PDMS) can be stretched to change the dynamic range19.
The critical radius, which constitute the threshold value between displacement mode and zig-zag mode (as
mentioned), has recently been estimated by John A. Davis based on experimental data of a range of different
devices20, resulting in
(4)
where is the critical diameter, d, the gap between laterally adjacent posts and , the period.
3.2.1 Erythrocytes in the DLD Conventional blood diagnostics involve automated counters (flow cytometry) in order to measure erythrocyte
indices. Flow cytometry setups are expensive and the practice is time consuming, considering sample transport to
labs and queues for processing, but is often necessary to assess the many possible causes that manifests as anemia
and makes diagnostics non trivial.
The morphologic distributions of erythrocyte populations are often more informative than a simple “presence or
non-presence” or elevated/decreased levels of a marker of interest. Single cell measurements, like flow
cytometry, require that individual cells are measured independently and a separation principle with high
resolution and high throughput without compromising cell membrane integrity is essential.
Many physical properties of red blood cells have already been
studied because these are closely related to cell function, but
because deformability is influenced by a wide range of parameters
and intricate interactions involving many structural proteins,
membrane dynamics of RBCs is still not fully understood. Many
simulation-models have been proposed to deal with the complex
dynamics21, 22.
In contrast to some microfluidics devices, the DLD does not rely
on diffusion to work (which the name implies) and diffusion
rather impairs resolution. Diffusion in the DLD is not necessarily
trivial and is believed to be anisotropic with respect to flow mode
of particles resulting in asymmetric distribution broadening23 and
consequently something one would like to minimize. For large
particles such as cells, and at realistic fluid flows, diffusion
doesn’t influence the outcome to any significant extent. A simple
Matlab-simulation (Matlab R2009b, the Mathworks, Inc.,
Natick, Massachusetts, United States) of diffusion for a 5 micron
particle in different modes can be seen in fig.17.
As mentioned, the DLD separates particles based on
hydrodynamic radius and assymetric particles tend to align so that
the smallest geometrical dimension is measured which in the case
Fig.17. Simple Matlab-simulation (Intel Pentium 4 CPU 3.60 GHz, 1GB RAM) to study diffusion
for 5μm particles (after 2∙103 posts with 10μm gaps) in different DLD modes, assuming anisotropic diffusion. Diffusion time in displacement mode is set equivalent to the time a particle spends between two rows and conversely diffusion time in zig zag mode is set as the total amount of time a particle spends in the array.
15
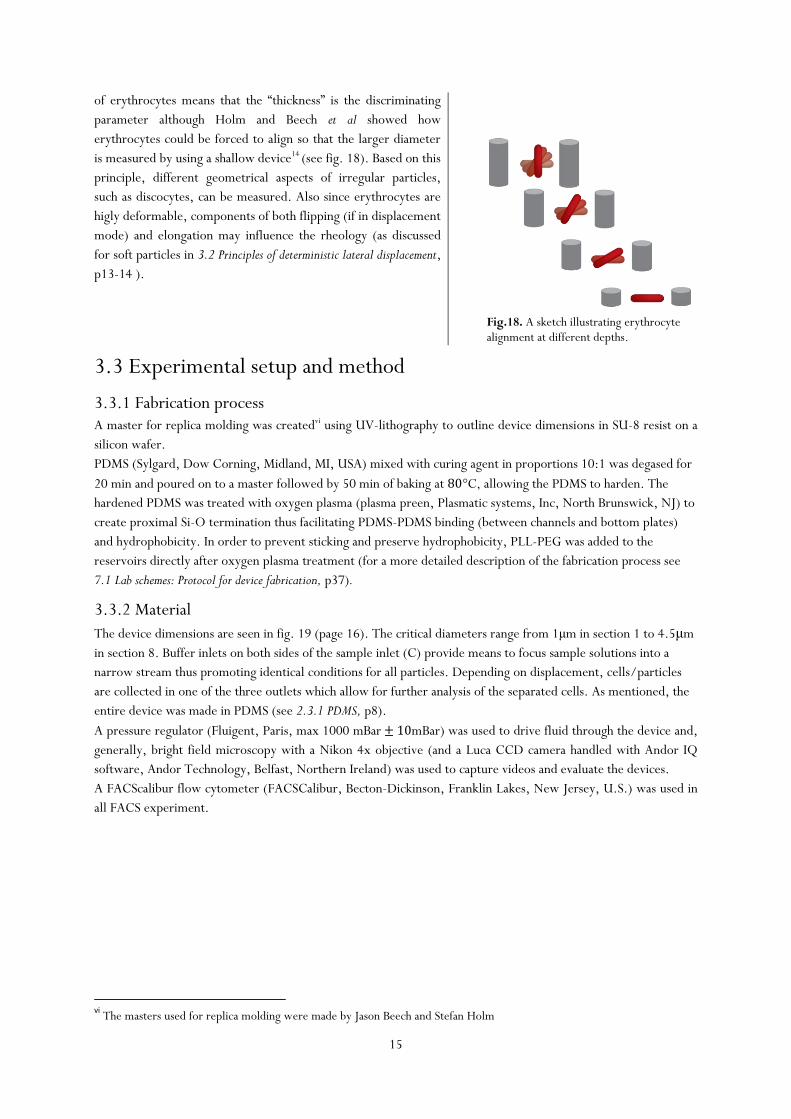
of erythrocytes means that the “thickness” is the discriminating
parameter although Holm and Beech et al showed how
erythrocytes could be forced to align so that the larger diameter
is measured by using a shallow device14 (see fig. 18). Based on this
principle, different geometrical aspects of irregular particles,
such as discocytes, can be measured. Also since erythrocytes are
higly deformable, components of both flipping (if in displacement
mode) and elongation may influence the rheology (as discussed
for soft particles in 3.2 Principles of deterministic lateral displacement,
p13-14 ).
Fig.18. A sketch illustrating erythrocyte alignment at different depths.
3.3 Experimental setup and method
3.3.1 Fabrication process A master for replica molding was createdvi using UV-lithography to outline device dimensions in SU-8 resist on a
silicon wafer.
PDMS (Sylgard, Dow Corning, Midland, MI, USA) mixed with curing agent in proportions 10:1 was degased for
20 min and poured on to a master followed by 50 min of baking at C, allowing the PDMS to harden. The
hardened PDMS was treated with oxygen plasma (plasma preen, Plasmatic systems, Inc, North Brunswick, NJ) to
create proximal Si-O termination thus facilitating PDMS-PDMS binding (between channels and bottom plates)
and hydrophobicity. In order to prevent sticking and preserve hydrophobicity, PLL-PEG was added to the
reservoirs directly after oxygen plasma treatment (for a more detailed description of the fabrication process see
7.1 Lab schemes: Protocol for device fabrication, p37).
3.3.2 Material
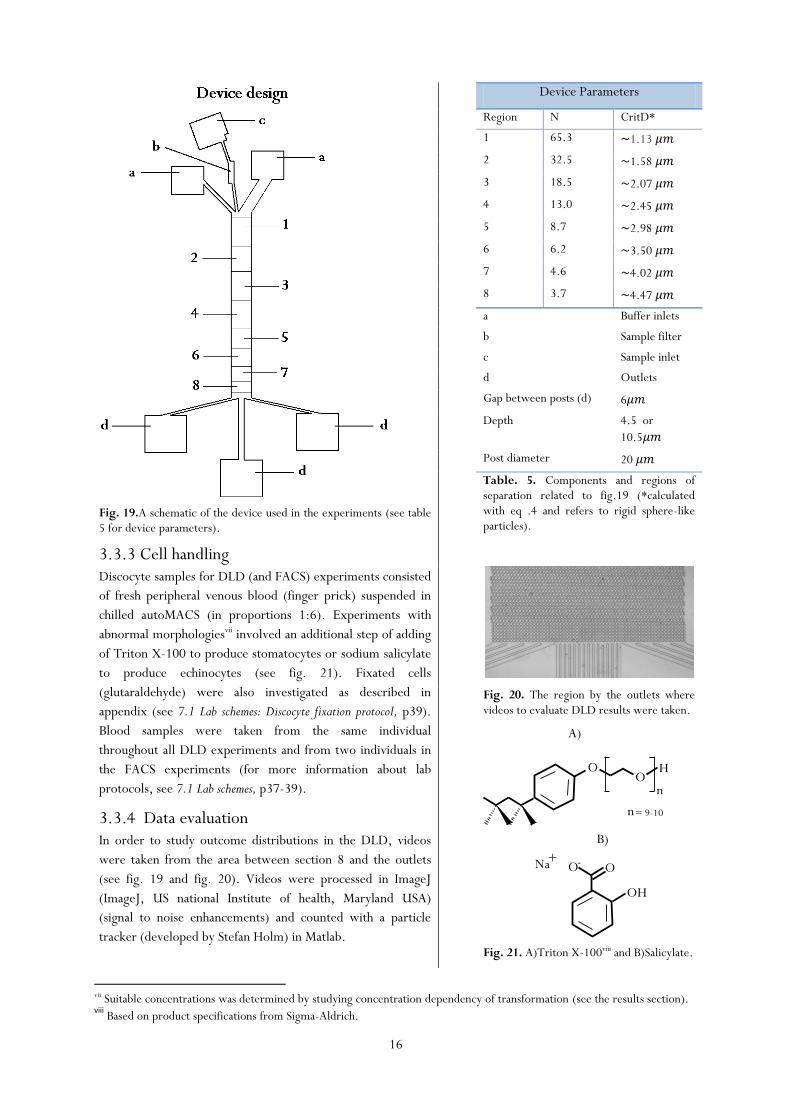
The device dimensions are seen in fig. 19 (page 16). The critical diameters range from 1μm in section 1 to 4.5μm
in section 8. Buffer inlets on both sides of the sample inlet (C) provide means to focus sample solutions into a
narrow stream thus promoting identical conditions for all particles. Depending on displacement, cells/particles
are collected in one of the three outlets which allow for further analysis of the separated cells. As mentioned, the
entire device was made in PDMS (see 2.3.1 PDMS, p8).
A pressure regulator (Fluigent, Paris, max 1000 mBar mBar) was used to drive fluid through the device and,
generally, bright field microscopy with a Nikon 4x objective (and a Luca CCD camera handled with Andor IQ
software, Andor Technology, Belfast, Northern Ireland) was used to capture videos and evaluate the devices.
A FACScalibur flow cytometer (FACSCalibur, Becton-Dickinson, Franklin Lakes, New Jersey, U.S.) was used in
all FACS experiment.
vi The masters used for replica molding were made by Jason Beech and Stefan Holm
16
vii Suitable concentrations was determined by studying concentration dependency of transformation (see the results section). viii
Based on product specifications from Sigma-Aldrich.
Fig. 19.A schematic of the device used in the experiments (see table 5 for device parameters).
3.3.3 Cell handling Discocyte samples for DLD (and FACS) experiments consisted
of fresh peripheral venous blood (finger prick) suspended in
chilled autoMACS (in proportions 1:6). Experiments with
abnormal morphologiesvii involved an additional step of adding
of Triton X-100 to produce stomatocytes or sodium salicylate
to produce echinocytes (see fig. 21). Fixated cells
(glutaraldehyde) were also investigated as described in
appendix (see 7.1 Lab schemes: Discocyte fixation protocol, p39).
Blood samples were taken from the same individual
throughout all DLD experiments and from two individuals in
the FACS experiments (for more information about lab
protocols, see 7.1 Lab schemes, p37-39).
3.3.4 Data evaluation In order to study outcome distributions in the DLD, videos
were taken from the area between section 8 and the outlets
(see fig. 19 and fig. 20). Videos were processed in ImageJ
(ImageJ, US national Institute of health, Maryland USA)
(signal to noise enhancements) and counted with a particle
tracker (developed by Stefan Holm) in Matlab.
Device Parameters
Region N CritD*
1 65.3 1.13
2 32.5 1.58
3 18.5 2.07
4 13.0 2.45
5 8.7 2.98
6 6.2 3.50
7 4.6 4.02
8 3.7 4.47
a Buffer inlets
b Sample filter
c Sample inlet
d Outlets
Gap between posts (d) 6
Depth 4.5 or
10.5
Post diameter 20
Table. 5. Components and regions of separation related to fig.19 (*calculated with eq .4 and refers to rigid sphere-like particles).
Fig. 20. The region by the outlets where videos to evaluate DLD results were taken.
Fig. 21. A)Triton X-100viii and B)Salicylate.
OO
H
n
OH
OO-Na+
A)
B)
n= 9-10
17
3.3.5 DLD experiments
(See Appendices for detailed descriptions of experimental protocols)
Cell samples containing erythrocytes of different morphologies (see 3.3.3 Cell handling, p16) were prepared from
fresh peripheral venous blood just before experiments were conducted. Because of the strong influence of buffer
composition on morphology, experiments were carried out one erythrocyte species at a time. Before each
measurement, PLL-PEG was driven through the device to avoid sticking of plasma proteins and blood cells.
Shear-dependent displacement was studied by varying pressure from 100 mbar (from 200 mbar in the 4.5 micron
device) to 1100 mbar and results from devices with identical parameters but of different depths (4.5 micron and
10.5 micron) was compared.
3.3.6 FACS experiments Erythrocytes with morphologies identical to those used in the DLD experiments (with the exception of one
additional sample containing fixated discocytes), were prepared in quantities of cells in 1 ml samples to avoid
saturation and ensure single cell measurements (general FACS protocols, as were used in these experiments, can be found in
the literature and are not presented here).
18
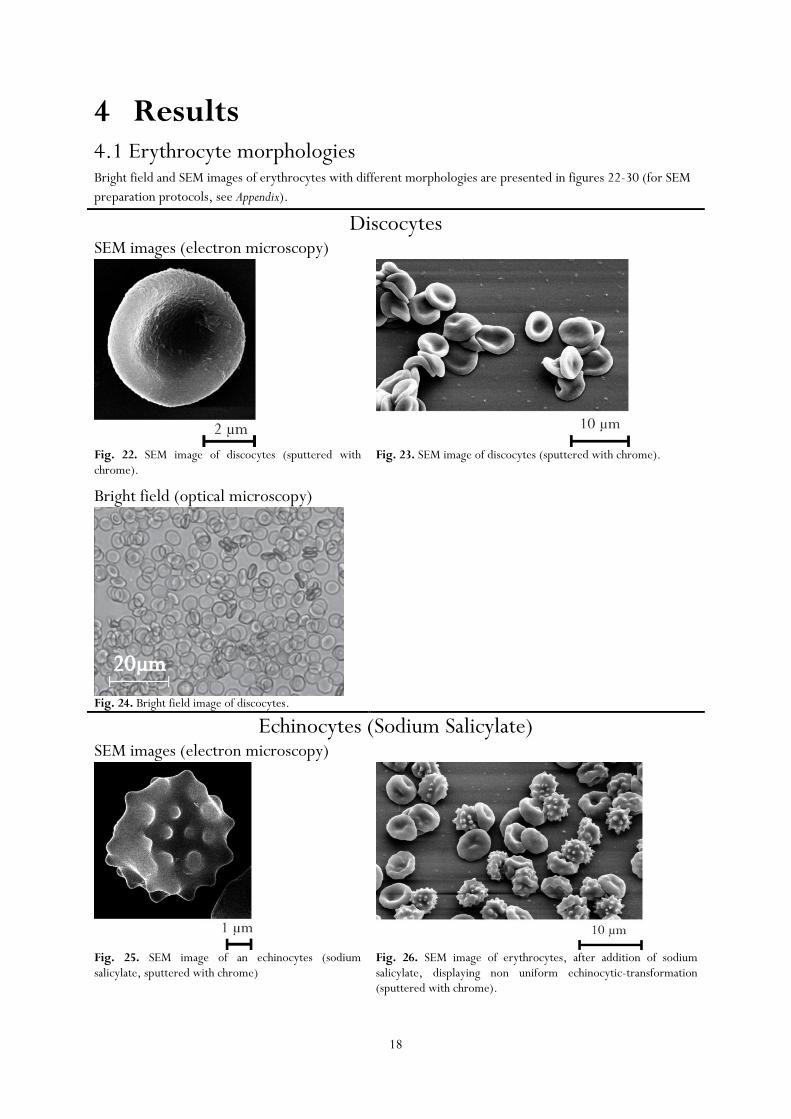
4 Results 4.1 Erythrocyte morphologies Bright field and SEM images of erythrocytes with different morphologies are presented in figures 22-30 (for SEM
preparation protocols, see Appendix).
Discocytes SEM images (electron microscopy)
Fig. 22. SEM image of discocytes (sputtered with chrome).
Fig. 23. SEM image of discocytes (sputtered with chrome).
Bright field (optical microscopy)
Fig. 24. Bright field image of discocytes.
Echinocytes (Sodium Salicylate) SEM images (electron microscopy)
Fig. 25. SEM image of an echinocytes (sodium salicylate, sputtered with chrome)
Fig. 26. SEM image of erythrocytes, after addition of sodium salicylate, displaying non uniform echinocytic-transformation (sputtered with chrome).
19
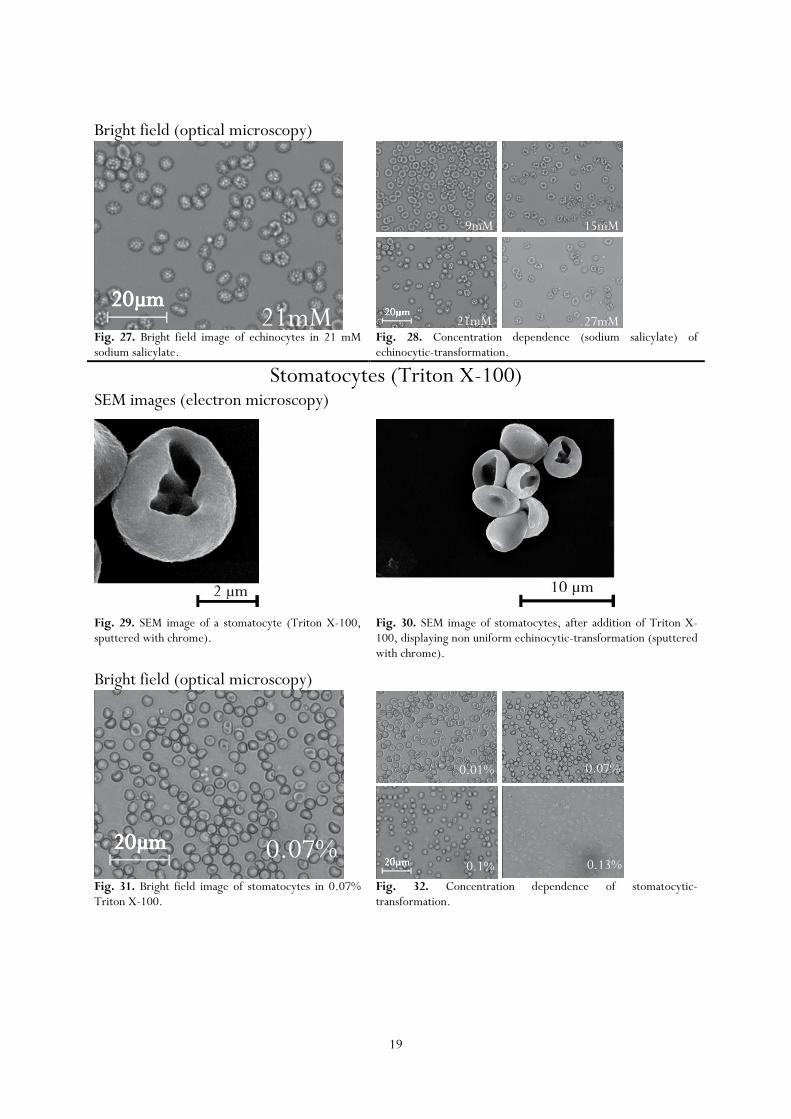
Bright field (optical microscopy)
Fig. 27. Bright field image of echinocytes in 21 mM sodium salicylate.
Fig. 28. Concentration dependence (sodium salicylate) of echinocytic-transformation.
Stomatocytes (Triton X-100) SEM images (electron microscopy)
Fig. 29. SEM image of a stomatocyte (Triton X-100, sputtered with chrome).
Fig. 30. SEM image of stomatocytes, after addition of Triton X-100, displaying non uniform echinocytic-transformation (sputtered with chrome).
Bright field (optical microscopy)
Fig. 31. Bright field image of stomatocytes in 0.07% Triton X-100.
Fig. 32. Concentration dependence of stomatocytic-transformation.
21mM
9mM 15mM
21mM 27mM
0.07%0.13%0.1%
0.07%0.01%
20
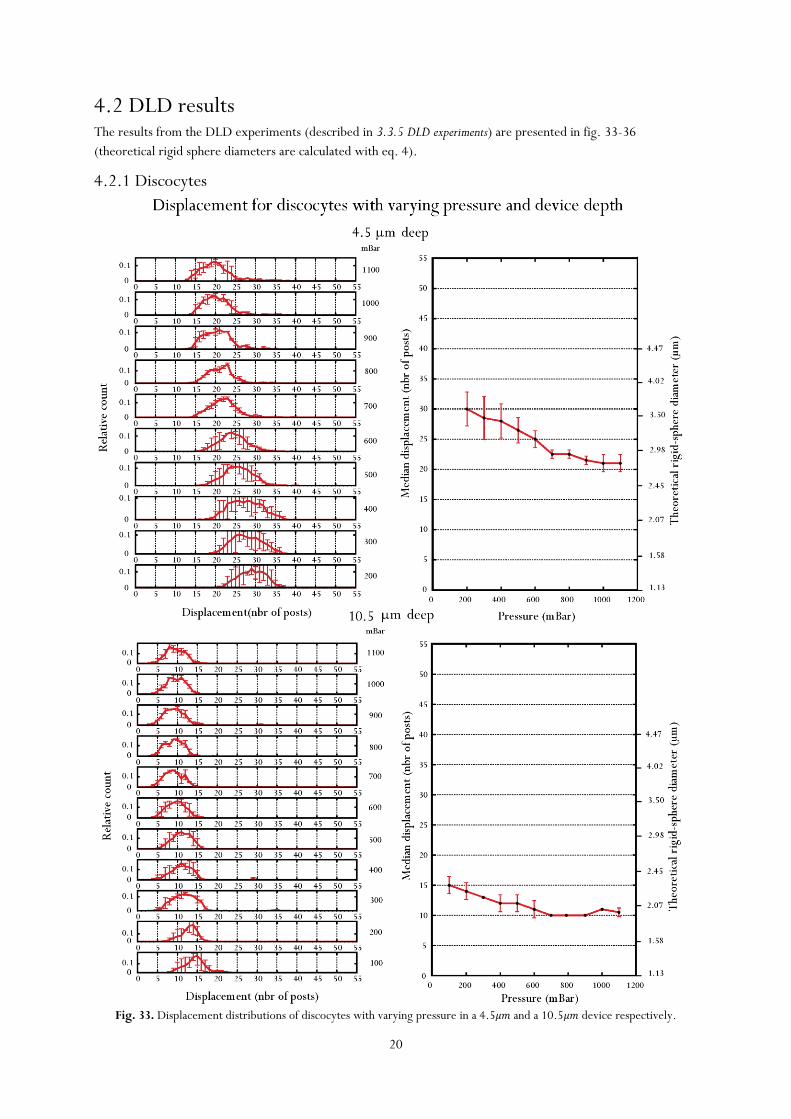
4.2 DLD results The results from the DLD experiments (described in 3.3.5 DLD experiments) are presented in fig. 33-36
(theoretical rigid sphere diameters are calculated with eq. 4).
4.2.1 Discocytes
Fig. 33. Displacement distributions of discocytes with varying pressure in a 4.5 and a 10.5 device respectively.
21
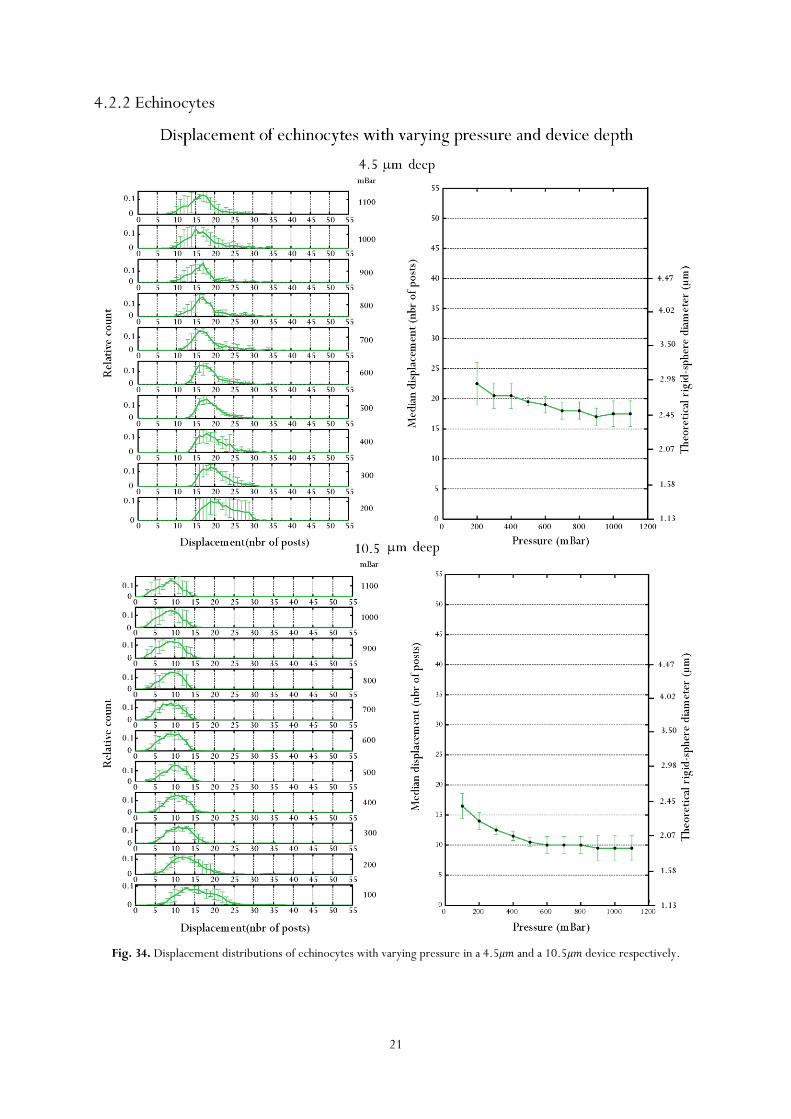
4.2.2 Echinocytes
Fig. 34. Displacement distributions of echinocytes with varying pressure in a 4.5 and a 10.5 device respectively.
22
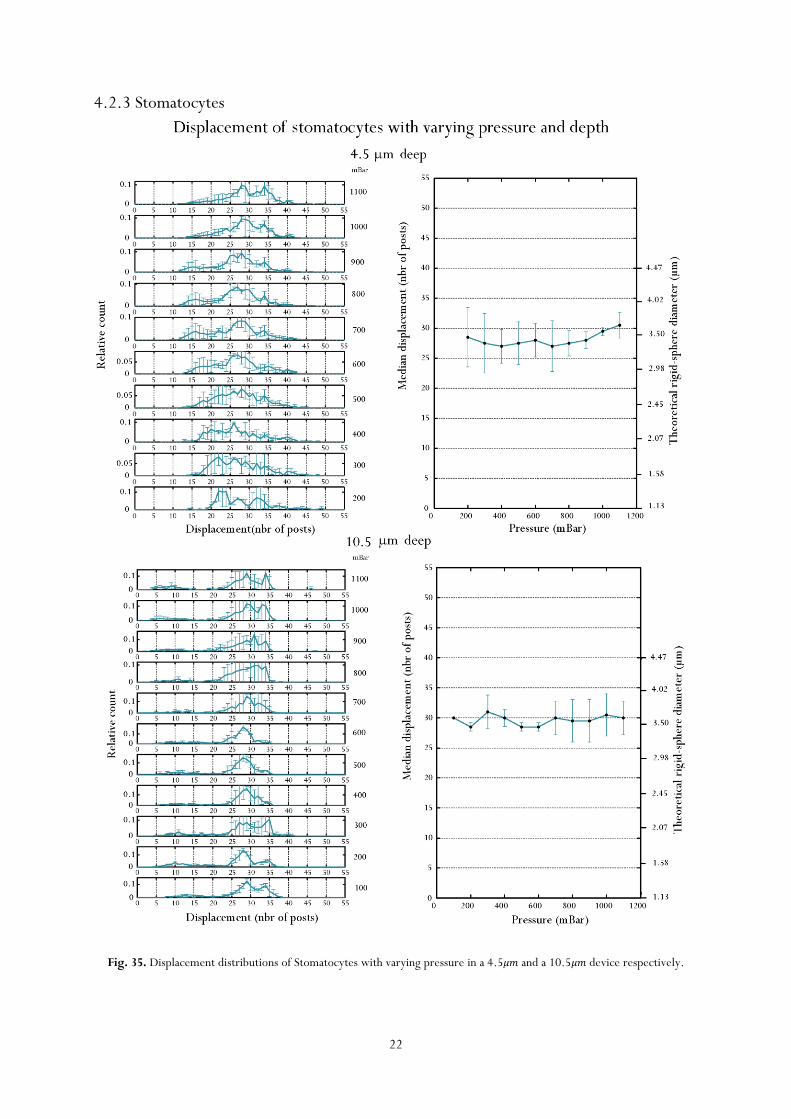
4.2.3 Stomatocytes
Fig. 35. Displacement distributions of Stomatocytes with varying pressure in a 4.5 and a 10.5 device respectively.
23
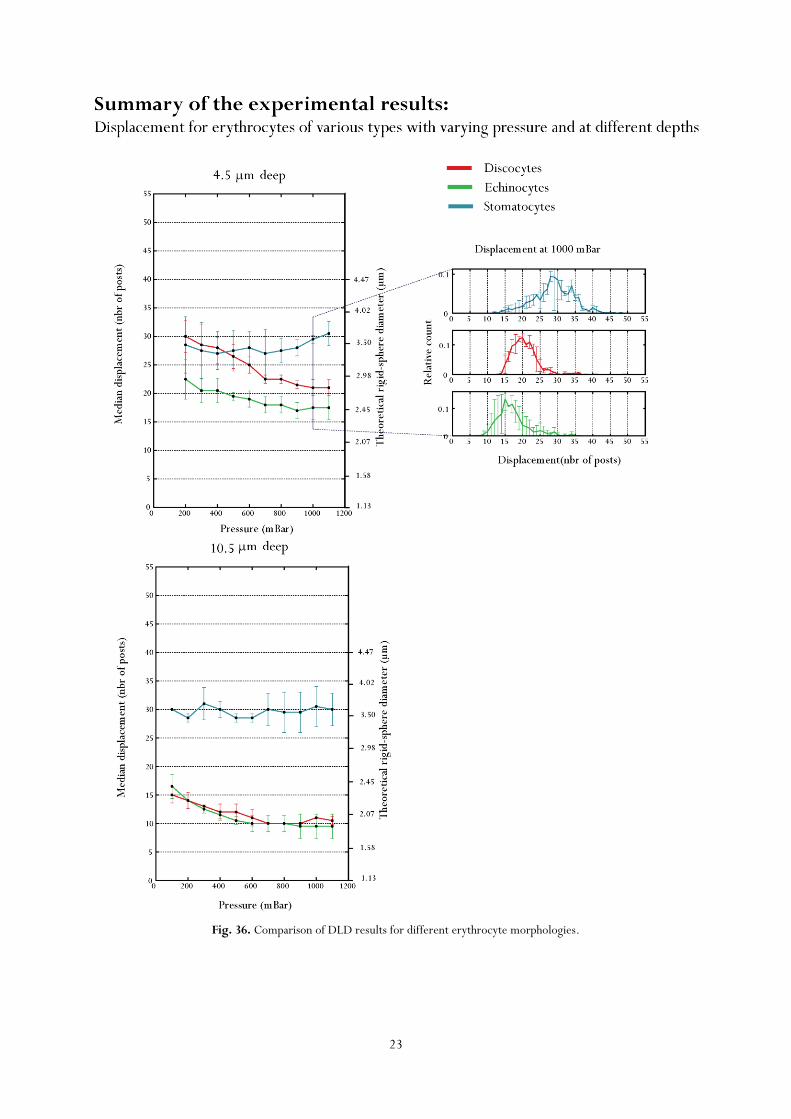
Fig. 36. Comparison of DLD results for different erythrocyte morphologies.
24
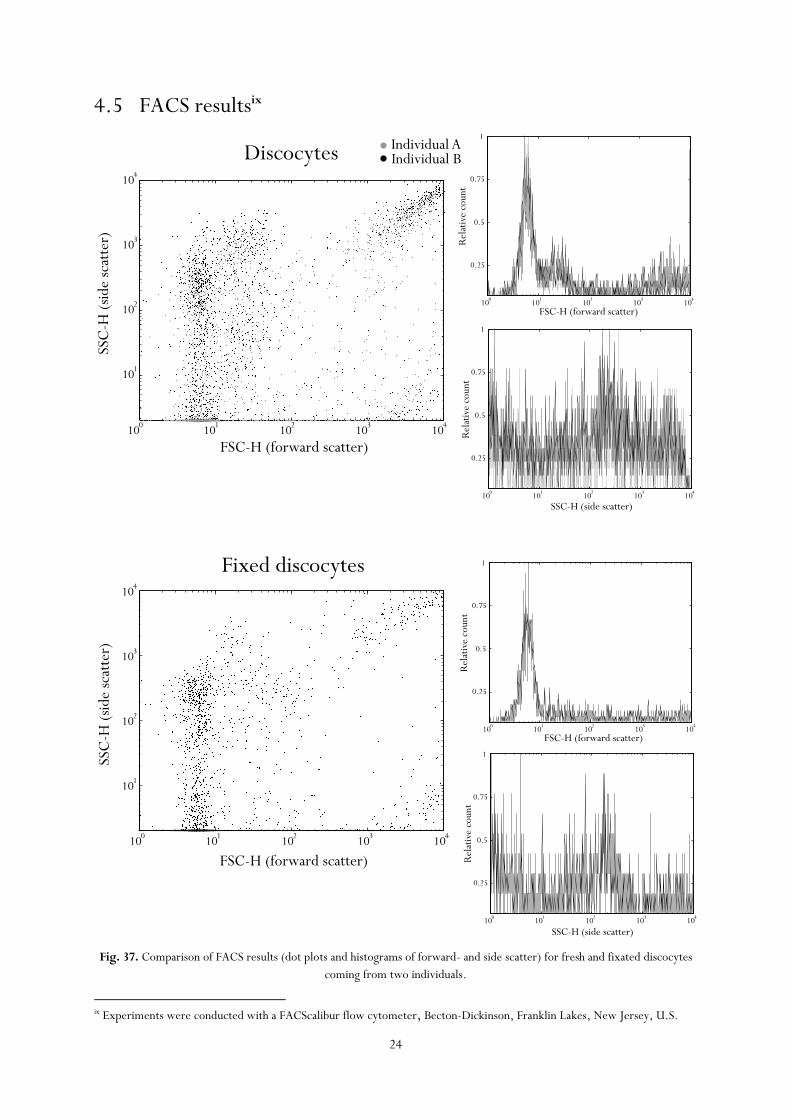
4.5 FACS resultsix
Fig. 37. Comparison of FACS results (dot plots and histograms of forward- and side scatter) for fresh and fixated discocytes
coming from two individuals.
ix Experiments were conducted with a FACScalibur flow cytometer, Becton-Dickinson, Franklin Lakes, New Jersey, U.S.
100
101
102
103
104
101
102
103
104
SSC
-H(s
ide
scat
ter)
FSC-H (forward scatter)
Discocytes
100
101
102
103
104
101
102
103
104
SSC
-H(s
ide
scat
ter)
FSC-H (forward scatter)
Fixed discocytes
Individual AIndividual B
100
101
102
103
104
0.25
0.5
0.75
1
SSC-H (side scatter)
Rel
ativ
eco
unt
100
101
102
103
104
0.25
0.5
0.75
1
FSC-H (forward scatter)
Rel
ativ
eco
unt
100
101
102
103
104
0.25
0.5
0.75
1
SSC-H (side scatter)
Rel
ativ
eco
unt
100
101
102
103
104
0.25
0.5
0.75
1
FSC-H (forward scatter)
Rel
ativ
eco
unt
25
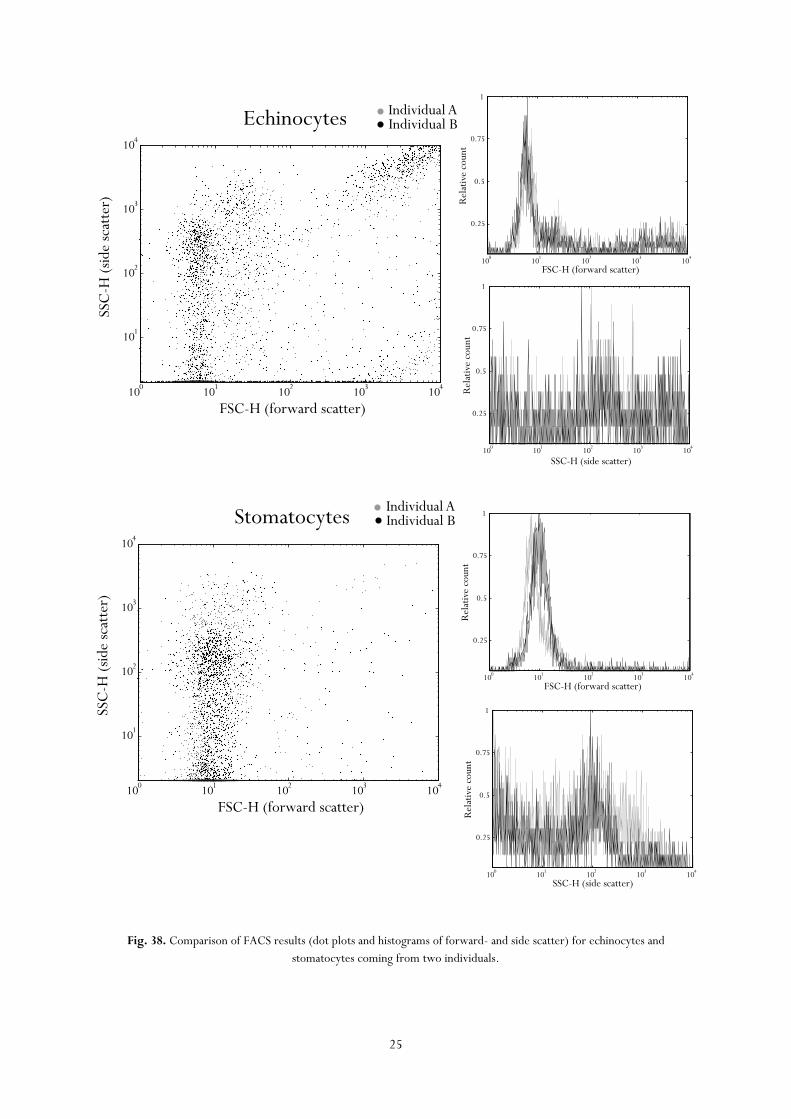
Fig. 38. Comparison of FACS results (dot plots and histograms of forward- and side scatter) for echinocytes and
stomatocytes coming from two individuals.
100
101
102
103
104
101
102
103
104
SSC
-H(s
ide
scat
ter)
FSC-H (forward scatter)
Echinocytes Individual AIndividual B
100
101
102
103
104
0.25
0.5
0.75
1
FSC-H (forward scatter)
Rel
ativ
eco
unt
100
101
102
103
104
0.25
0.5
0.75
1
SSC-H (side scatter)R
elat
ive
coun
t
100
101
102
103
104
101
102
103
104
SSC
-H(s
ide
scat
ter)
FSC-H (forward scatter)
Stomatocytes
100
101
102
103
104
0.25
0.5
0.75
1
FSC-H (forward scatter)
Rel
ativ
eco
unt
100
101
102
103
104
0.25
0.5
0.75
1
SSC-H (side scatter)
Rel
ativ
eco
unt
Individual AIndividual B
26
5 Discussion 5.1 Discocytes In fig. 36 median displacements of all morphologies are compared. Highest separation was obtained in a
deep device at 1000 mBar and the relative distributions are also shown. The results from fig. 33 show a
pronounced pressure (or rather shear-) dependency which suggests that deformability strongly influence discocyte
displacement in the DLD. This seems highly likely, based on observations of erythrocyte rheology and especially
considering stomatocytes (which are known to be less deformable24) do no exhibit shear dependency in the DLD,
or at least not in this regime (see fig. 35 and 36). Not taking deformability into account, one would expect the
discocytes to appear significantly smaller than the echinocytes and the stomatocytes in the deep device since
discocyte thickness is around 2 and the more spherical echinocytes and stomatocytes should appear larger as a
result. This is also the case in comparison to stomatocytes but not with echinocytes, it seems, since they exhibit
almost identical results in the deep device. The results are beneficial in the context of blood diagnostics because
the fact that echinocytes appear smaller in the shallow device and stomatocytes appear larger (than discocytes) it
renders both these morphologies detectable as opposed to a situation where both morphologies appear larger.
Due to the difference in depth, and consequently resistance, between the devices (of different depth), shear rate
differs considerably. Knowing the shear ratio between the deep and shallow devices at a given pressure is
necessary, in order to compare outcome in response to different shear, and it can be roughly estimated since all
parameters except the channel height, , are identical
(
)
(
)
Velocity measurements from recorded particles lead to a shear ratio of approximately . Note that this is a crude
estimate since particle velocity depends on mode (and lane if in zig-zag mode). A displacement-shear graph based
on the average value of the two estimations can be seen in fig. 39 below and fig. 42, 43.
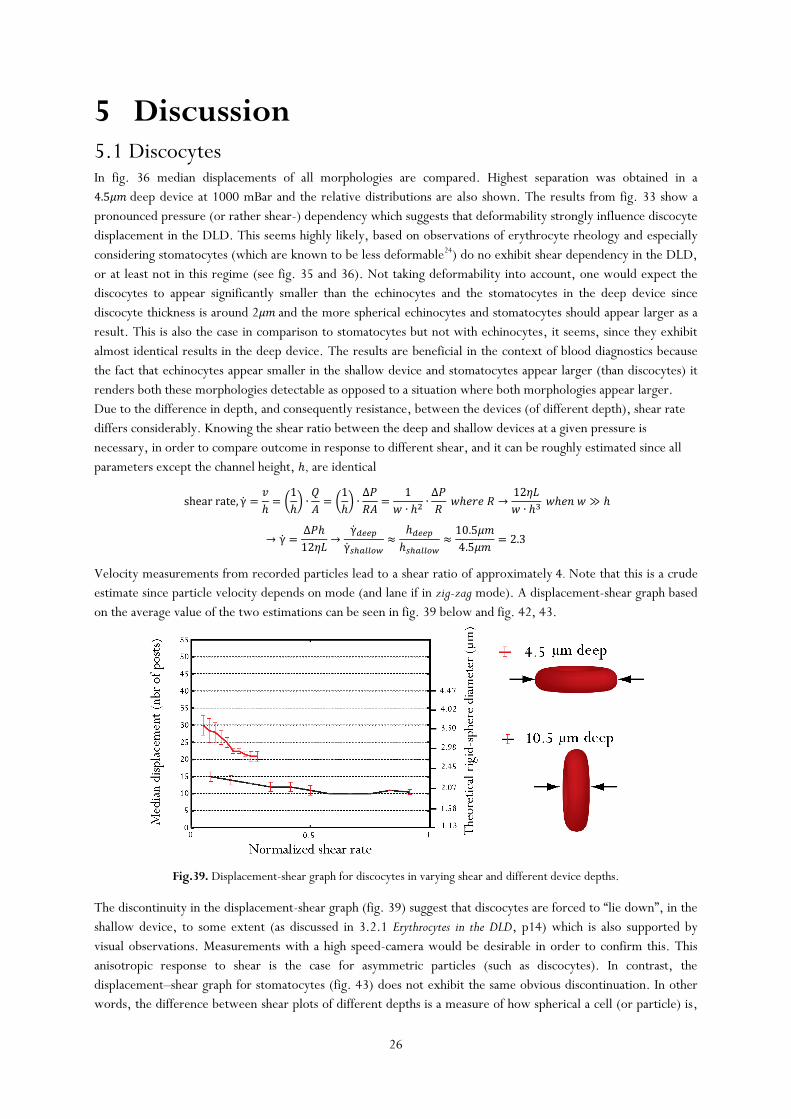
Fig.39. Displacement-shear graph for discocytes in varying shear and different device depths.
The discontinuity in the displacement-shear graph (fig. 39) suggest that discocytes are forced to “lie down”, in the
shallow device, to some extent (as discussed in 3.2.1 Erythrocytes in the DLD, p14) which is also supported by
visual observations. Measurements with a high speed-camera would be desirable in order to confirm this. This
anisotropic response to shear is the case for asymmetric particles (such as discocytes). In contrast, the
displacement–shear graph for stomatocytes (fig. 43) does not exhibit the same obvious discontinuation. In other
words, the difference between shear plots of different depths is a measure of how spherical a cell (or particle) is,

27
provided that the Young’s modulus is isotropic. This may be equivalent to the spherical index25 associated with flow
cytometry (which is essentially the ratio of two scatter peaks resulting from differently oriented erythrocytes) and
would be very interesting to investigate further.
Rheinhart et al. showed how echinocytes (induced with sodium salicylate) are more deformable than discocytes
(and results in higher blood viscosity)24 and stomatocytes were less deformable than discocytes. The explanation
given was that excess cell membrane renders erythrocytes more deformable which supports our view that
deformability analysis in the DLD (by varying shear) may give a measure of the ratio between leaflets in the bi-
layer and consequently indicate the extent of echinocytosis or stomatocytosis.
Micro filter resistance measurements, as used in the mentioned article (Rheinhart et al.24), is perhaps the most
common approach to determine deformability of cells (i.e. ectacytometry) even though filters are prone to clog26,
resulting in altered pore sizes and consequently altered resistance. The DLD does not clog as easily and is based on
an individualistic principle which means that subpopulations based on deformability can be distinguished as
opposed to filtering resistance measurements based on bulk behavior. Scatter analysis with sheath flow focusing
has been proposed27 to assess deformability, as well, but this
technique is far less versatile and not as simple as DLD.
A number of factors influence deformability such as; cytosolic
viscosity (influenced by osmolarity and more), rigidity of the cell
membrane, inner supportive structures (e.g. cytoskeleton) and
the viscosity of the buffer. The relative influence of parameters
may even change depending on shear rate and strength, cell
orientation or after plastic deformation. In other words, cell
rheology in the DLD (and in microfluidics in general), is quite
complex and consequently difficult to deal with analytically.
Efforts were made to separate deformability from morphology as
an outcome determinant by trying to conduct identical
experiments with discocytes fixated in glutaraldehyde. The fixated
cells clustered together and were stickier than non-fixated cells
which made it impossible to conduct experiments due to clogging
as seen in fig. 40 and fig. 41. It would perhaps be feasible if cells
were sonicated in advance and if the gap between posts, d, was
made larger.
The (non-fixated) discocytes constitute the only, clinically,
reliable population evaluated in the report since no altering
chemicals were added and the cells were kept in an in vivo like
milieu. This being said, it is our belief that much of the
discriminating properties of the DLD, when dealing with
erythrocytes, can be understood by studying DLD outcome for
cells with altered membrane morphology and deformability.
Fig. 40. Clogged DLD filter with fixated
discocytes (10.5 deep device).
Fig. 41. Clogged array with fixated
discocytes (10.5 deep device).
5. 2 Induced morphologies Using hypotonic or hypertonic buffers to facilitate morphology alterations was thought to add too many unknown
variables since in vivo osmolarity in disease states are commonly isotonic (approximately 300 mOsm/l)15.
Therefore echinocytic- and stomatocytic agents were used in order to produce as clinically relevant morphologies
as possible (without having access to pathologic blood) as discussed in 3.1.2 Bilayer-couple theory on page 11.
Unfortunately, osmolarity measurements were never carried out because osmometers were not available but
calculations (neglecting cross-reactivity) suggest in vivo like osmolarity. There are however disease states where
osmolarity alterations occur and these are normally coupled to renal-liver failure and thus osmolarity induced
shapes would be interesting to study in the DLD as well.
28
In the echinocyte and stomatocyte samples, a small but significant subpopulation of discocytes are present and this
fraction of the population always seem to remain as discocytes (see 4.1 Erythrocyte morphologies). This may explain
apparent subpopulations in the displacement distributions of these morphologies. The concentration dependency
of echinocytic transformation (as seen in fig. 28) indicate that the transformation is not uniform either, that is,
some cells are affected at lower concentrations than others suggesting that there are subpopulations which are
more susceptible to echinocytic or stomatocytic transformation (as seen in fig. 32). A possible explanation to
these discrepancies may involve a subpopulation known as reticulocytes, which are young erythrocytes (with
some remnant organelles and r-RNA18) and it is possible that these cells respond differently to these chemicals
based on their distinct features. If this is the case, the reticulocyte fraction could be detected in the DLD by
adding, for example triton X-100 and would provide valuable information of the bodily response to anemia.
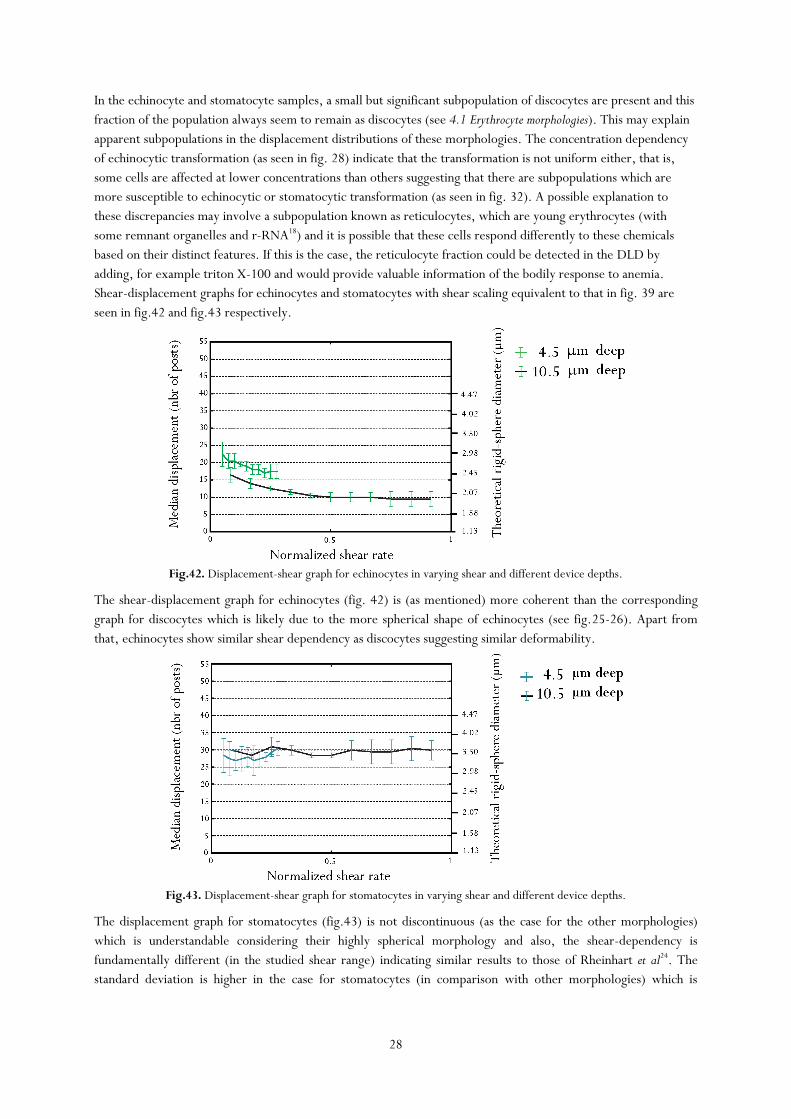
Shear-displacement graphs for echinocytes and stomatocytes with shear scaling equivalent to that in fig. 39 are
seen in fig.42 and fig.43 respectively.
Fig.42. Displacement-shear graph for echinocytes in varying shear and different device depths.
The shear-displacement graph for echinocytes (fig. 42) is (as mentioned) more coherent than the corresponding
graph for discocytes which is likely due to the more spherical shape of echinocytes (see fig.25-26). Apart from
that, echinocytes show similar shear dependency as discocytes suggesting similar deformability.
Fig.43. Displacement-shear graph for stomatocytes in varying shear and different device depths.
The displacement graph for stomatocytes (fig.43) is not discontinuous (as the case for the other morphologies)
which is understandable considering their highly spherical morphology and also, the shear-dependency is
fundamentally different (in the studied shear range) indicating similar results to those of Rheinhart et al24. The
standard deviation is higher in the case for stomatocytes (in comparison with other morphologies) which is
29
interesting as it is indicating an underlying heterogeneity in the sample, but arguably makes the results less
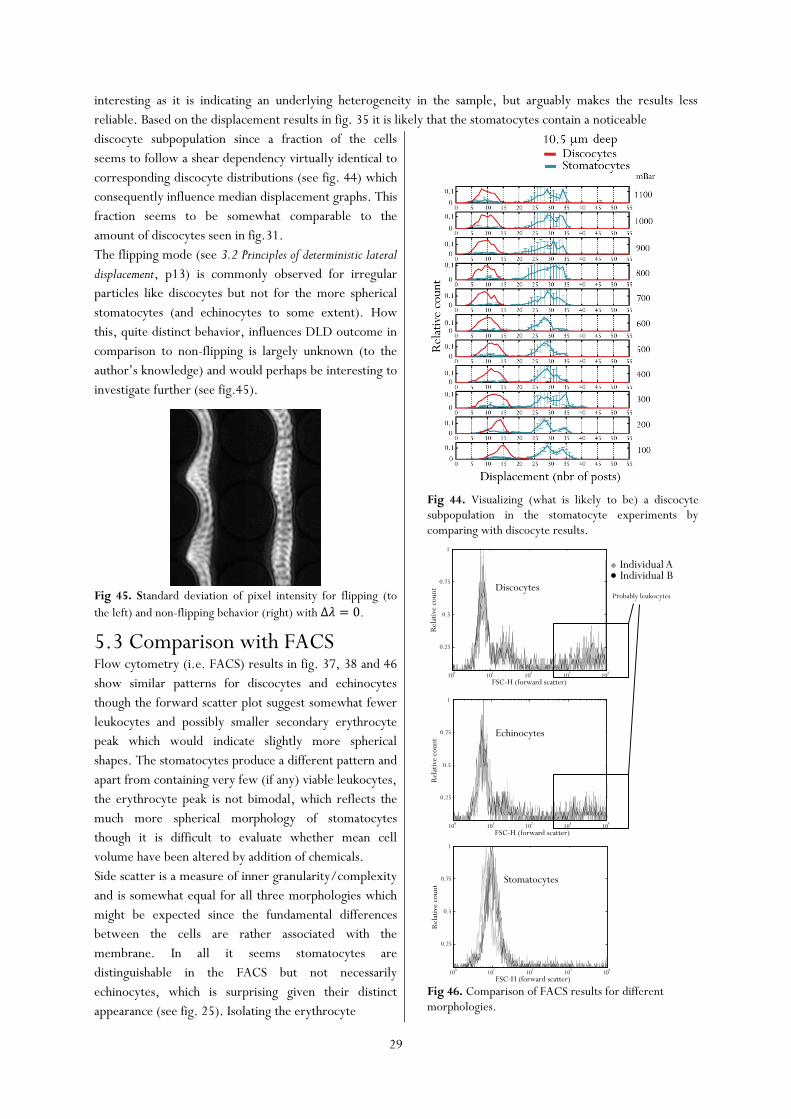
reliable. Based on the displacement results in fig. 35 it is likely that the stomatocytes contain a noticeable
discocyte subpopulation since a fraction of the cells
seems to follow a shear dependency virtually identical to
corresponding discocyte distributions (see fig. 44) which
consequently influence median displacement graphs. This
fraction seems to be somewhat comparable to the
amount of discocytes seen in fig.31.
The flipping mode (see 3.2 Principles of deterministic lateral
displacement, p13) is commonly observed for irregular
particles like discocytes but not for the more spherical
stomatocytes (and echinocytes to some extent). How
this, quite distinct behavior, influences DLD outcome in
comparison to non-flipping is largely unknown (to the
author’s knowledge) and would perhaps be interesting to
investigate further (see fig.45).
Fig 45. Standard deviation of pixel intensity for flipping (to
the left) and non-flipping behavior (right) with .
5.3 Comparison with FACS Flow cytometry (i.e. FACS) results in fig. 37, 38 and 46
show similar patterns for discocytes and echinocytes
though the forward scatter plot suggest somewhat fewer
leukocytes and possibly smaller secondary erythrocyte
peak which would indicate slightly more spherical
shapes. The stomatocytes produce a different pattern and
apart from containing very few (if any) viable leukocytes,
the erythrocyte peak is not bimodal, which reflects the
much more spherical morphology of stomatocytes
though it is difficult to evaluate whether mean cell
volume have been altered by addition of chemicals.
Side scatter is a measure of inner granularity/complexity
and is somewhat equal for all three morphologies which
might be expected since the fundamental differences
between the cells are rather associated with the
membrane. In all it seems stomatocytes are
distinguishable in the FACS but not necessarily
echinocytes, which is surprising given their distinct
appearance (see fig. 25). Isolating the erythrocyte
Fig 44. Visualizing (what is likely to be) a discocyte subpopulation in the stomatocyte experiments by comparing with discocyte results.
Fig 46. Comparison of FACS results for different morphologies.
100
101
102
103
104
0.25
0.5
0.75
1
FSC-H (forward scatter)
Rel
ativ
eco
unt
100
101
102
103
104
0.25
0.5
0.75
1
FSC-H (forward scatter)
Rel
ativ
eco
unt
100
101
102
103
104
0.25
0.5
0.75
1
FSC-H (forward scatter)
Rel
ativ
eco
unt
Probably leukocytes
Stomatocytes
Echinocytes
Discocytes
Individual AIndividual B
30
fraction when analyzing scatter plots from FACS proved surprisingly difficult and a hematologist with FACS
experience should probably be involved in future FACS experiments to make the comparison with FACS more
informative.
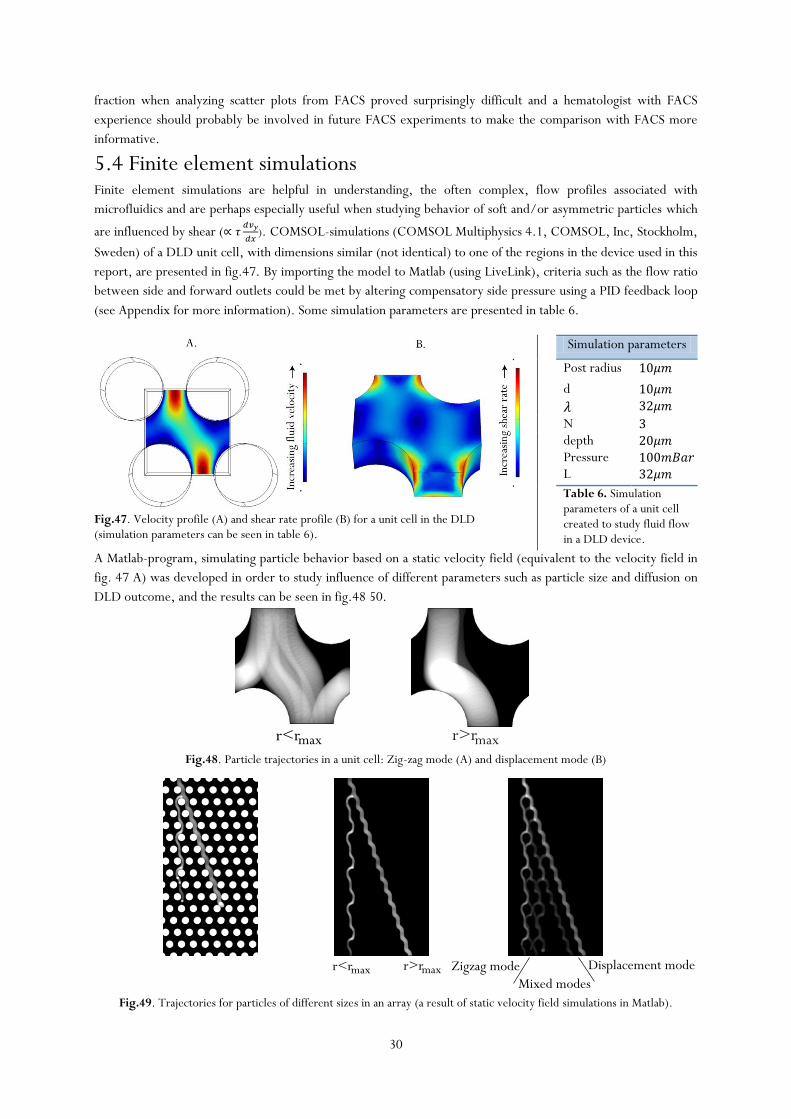
5.4 Finite element simulations Finite element simulations are helpful in understanding, the often complex, flow profiles associated with
microfluidics and are perhaps especially useful when studying behavior of soft and/or asymmetric particles which
are influenced by shear (
). COMSOL-simulations (COMSOL Multiphysics 4.1, COMSOL, Inc, Stockholm,
Sweden) of a DLD unit cell, with dimensions similar (not identical) to one of the regions in the device used in this
report, are presented in fig.47. By importing the model to Matlab (using LiveLink), criteria such as the flow ratio
between side and forward outlets could be met by altering compensatory side pressure using a PID feedback loop
(see Appendix for more information). Some simulation parameters are presented in table 6.
Fig.47. Velocity profile (A) and shear rate profile (B) for a unit cell in the DLD (simulation parameters can be seen in table 6).
Simulation parameters
Post radius
d
N
depth
Pressure
L
Table 6. Simulation parameters of a unit cell created to study fluid flow in a DLD device.
A Matlab-program, simulating particle behavior based on a static velocity field (equivalent to the velocity field in
fig. 47 A) was developed in order to study influence of different parameters such as particle size and diffusion on
DLD outcome, and the results can be seen in fig.48 50.
Fig.48. Particle trajectories in a unit cell: Zig-zag mode (A) and displacement mode (B)
Fig.49. Trajectories for particles of different sizes in an array (a result of static velocity field simulations in Matlab).
r<rmax r>rmax
r<rmax r>rmaxMixed modes
Displacement modeZigzag mode
31
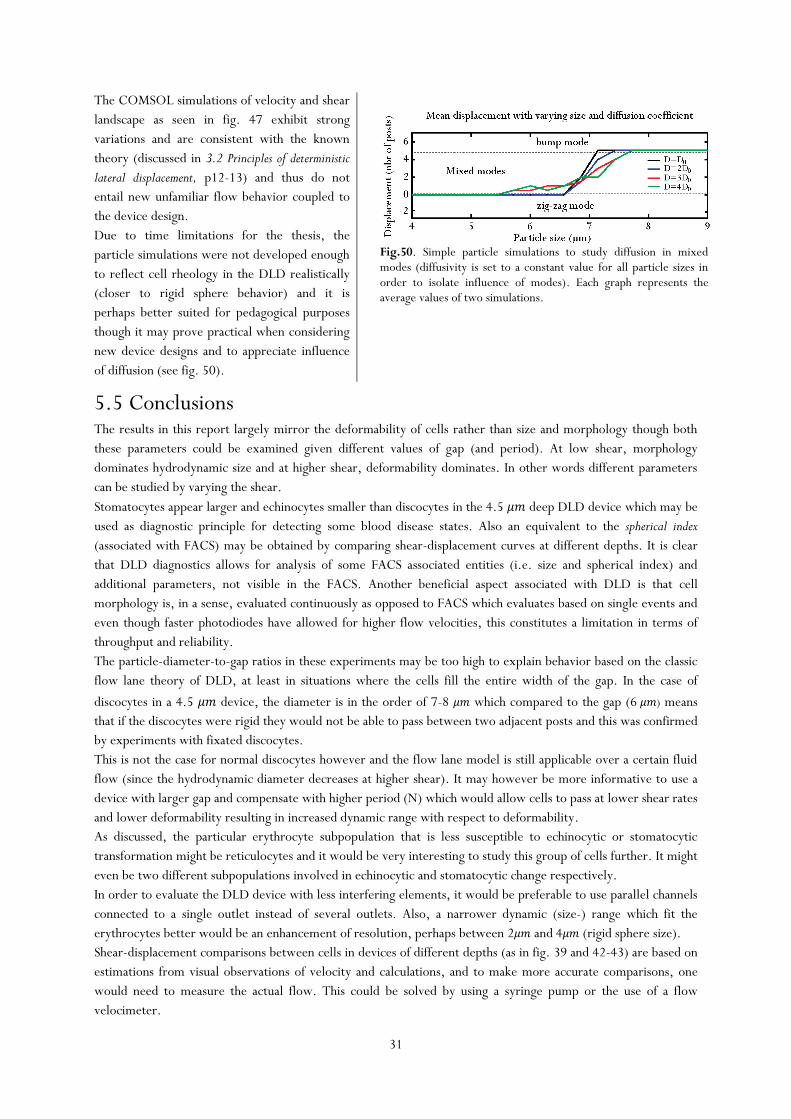
The COMSOL simulations of velocity and shear
landscape as seen in fig. 47 exhibit strong
variations and are consistent with the known
theory (discussed in 3.2 Principles of deterministic
lateral displacement, p12-13) and thus do not
entail new unfamiliar flow behavior coupled to
the device design.
Due to time limitations for the thesis, the
particle simulations were not developed enough
to reflect cell rheology in the DLD realistically
(closer to rigid sphere behavior) and it is
perhaps better suited for pedagogical purposes
though it may prove practical when considering
new device designs and to appreciate influence
of diffusion (see fig. 50).
Fig.50. Simple particle simulations to study diffusion in mixed modes (diffusivity is set to a constant value for all particle sizes in order to isolate influence of modes). Each graph represents the average values of two simulations.
5.5 Conclusions The results in this report largely mirror the deformability of cells rather than size and morphology though both
these parameters could be examined given different values of gap (and period). At low shear, morphology
dominates hydrodynamic size and at higher shear, deformability dominates. In other words different parameters
can be studied by varying the shear.
Stomatocytes appear larger and echinocytes smaller than discocytes in the 4.5 deep DLD device which may be
used as diagnostic principle for detecting some blood disease states. Also an equivalent to the spherical index
(associated with FACS) may be obtained by comparing shear-displacement curves at different depths. It is clear
that DLD diagnostics allows for analysis of some FACS associated entities (i.e. size and spherical index) and
additional parameters, not visible in the FACS. Another beneficial aspect associated with DLD is that cell
morphology is, in a sense, evaluated continuously as opposed to FACS which evaluates based on single events and
even though faster photodiodes have allowed for higher flow velocities, this constitutes a limitation in terms of
throughput and reliability.
The particle-diameter-to-gap ratios in these experiments may be too high to explain behavior based on the classic
flow lane theory of DLD, at least in situations where the cells fill the entire width of the gap. In the case of
discocytes in a 4.5 device, the diameter is in the order of 7-8 which compared to the gap (6 ) means
that if the discocytes were rigid they would not be able to pass between two adjacent posts and this was confirmed
by experiments with fixated discocytes.
This is not the case for normal discocytes however and the flow lane model is still applicable over a certain fluid
flow (since the hydrodynamic diameter decreases at higher shear). It may however be more informative to use a
device with larger gap and compensate with higher period (N) which would allow cells to pass at lower shear rates
and lower deformability resulting in increased dynamic range with respect to deformability.
As discussed, the particular erythrocyte subpopulation that is less susceptible to echinocytic or stomatocytic
transformation might be reticulocytes and it would be very interesting to study this group of cells further. It might
even be two different subpopulations involved in echinocytic and stomatocytic change respectively.
In order to evaluate the DLD device with less interfering elements, it would be preferable to use parallel channels
connected to a single outlet instead of several outlets. Also, a narrower dynamic (size-) range which fit the
erythrocytes better would be an enhancement of resolution, perhaps between 2 and 4 (rigid sphere size).
Shear-displacement comparisons between cells in devices of different depths (as in fig. 39 and 42-43) are based on
estimations from visual observations of velocity and calculations, and to make more accurate comparisons, one
would need to measure the actual flow. This could be solved by using a syringe pump or the use of a flow
velocimeter.
32
Because of the complex nature of hydrodynamic size, when it comes to cells, it would be desirable to study
parameters influencing hydrodynamic size independently. An interesting experiment would hence be to involve a
fixation step (crossing streams) perhaps in a parallel DLD array which would facilitate cell separation independent
of deformability. Also, rigid sphere, tracer-particles would be helpful when comparing experimental results
between different DLD device designs.
However, the FACS machine does more than morphology evaluations and can sort based on fluorescence (i.e.
fluorescently labeled protein-specific antibodies) and estimate inner granularity.
These features have not yet been coupled to deterministic lateral displacement and a similar setup is probably
feasible though the fundamental strength of the DLD lies in that it can discriminate not only based on size but
morphology and deformability influencing particles hydrodynamic diameter. More statistics than presented in this
report would of course be necessary to confirm clinical relevance of these parameters and experiments would
require actual diseased blood rather than artificial states.
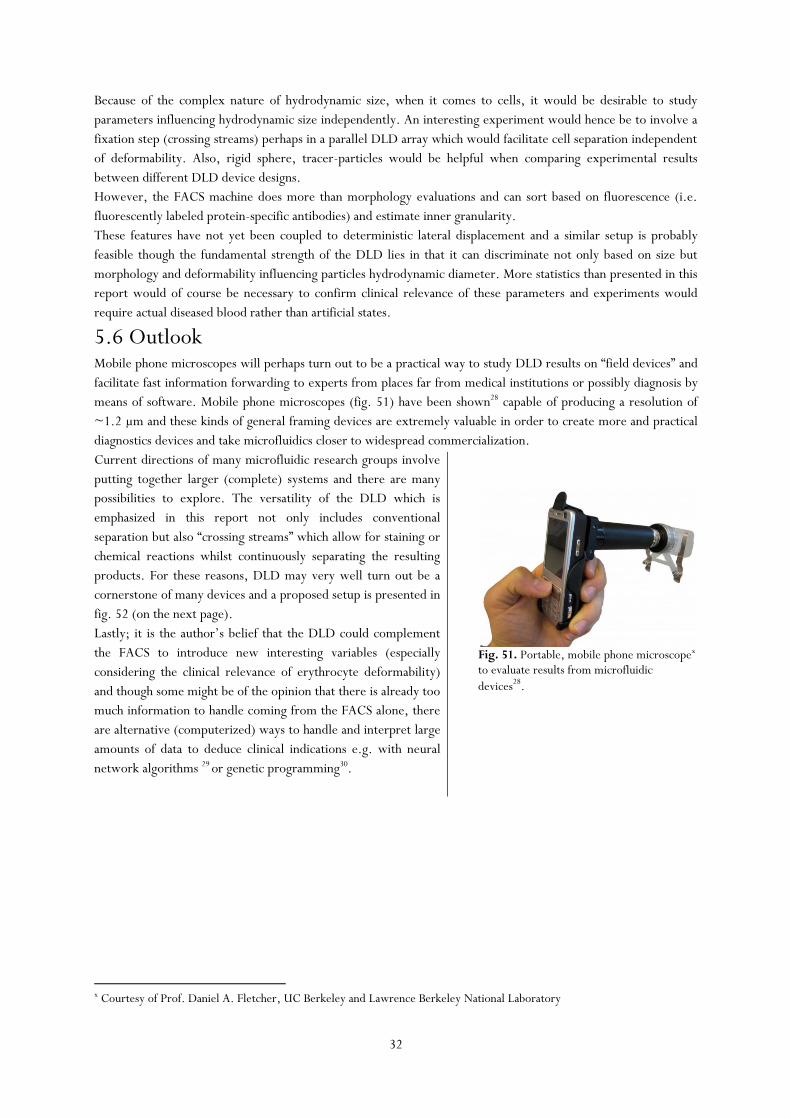
5.6 Outlook Mobile phone microscopes will perhaps turn out to be a practical way to study DLD results on “field devices” and
facilitate fast information forwarding to experts from places far from medical institutions or possibly diagnosis by
means of software. Mobile phone microscopes (fig. 51) have been shown28 capable of producing a resolution of
~1.2 µm and these kinds of general framing devices are extremely valuable in order to create more and practical
diagnostics devices and take microfluidics closer to widespread commercialization.
Current directions of many microfluidic research groups involve
putting together larger (complete) systems and there are many
possibilities to explore. The versatility of the DLD which is
emphasized in this report not only includes conventional
separation but also “crossing streams” which allow for staining or
chemical reactions whilst continuously separating the resulting
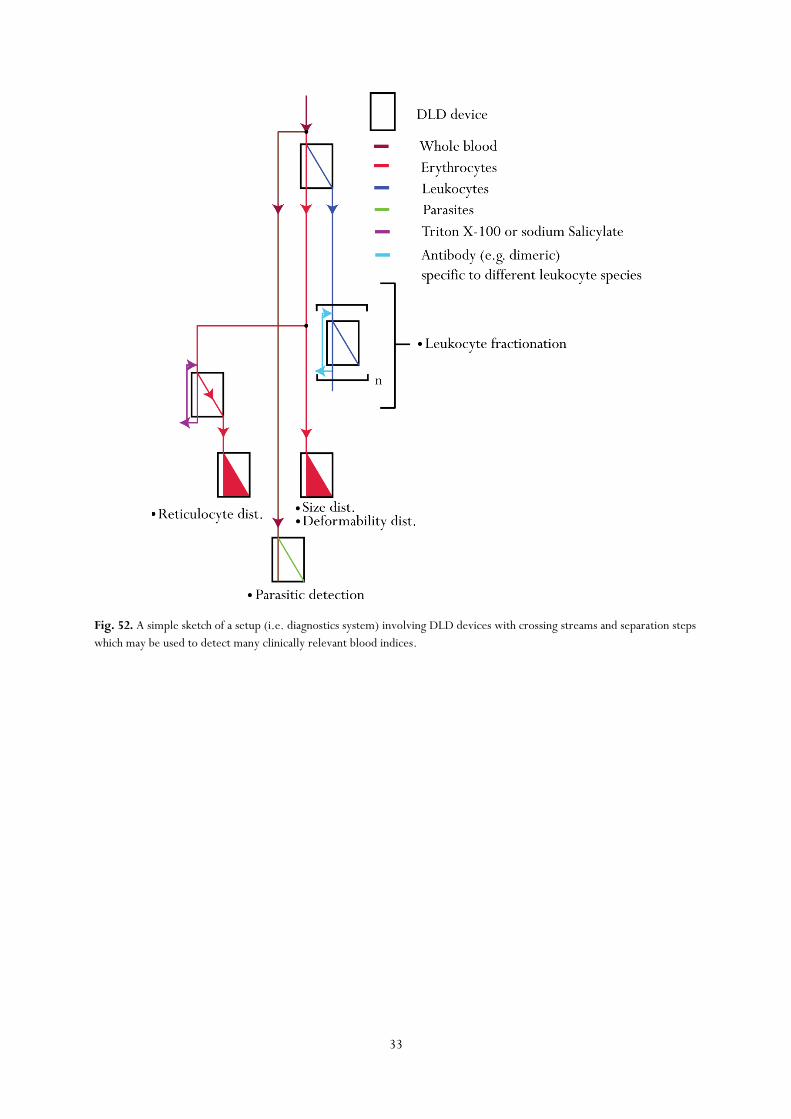
products. For these reasons, DLD may very well turn out be a
cornerstone of many devices and a proposed setup is presented in
fig. 52 (on the next page).
Lastly; it is the author’s belief that the DLD could complement
the FACS to introduce new interesting variables (especially
considering the clinical relevance of erythrocyte deformability)
and though some might be of the opinion that there is already too
much information to handle coming from the FACS alone, there
are alternative (computerized) ways to handle and interpret large
amounts of data to deduce clinical indications e.g. with neural
network algorithms 29 or genetic programming30.
Fig. 51. Portable, mobile phone microscopex to evaluate results from microfluidic
devices28.
x Courtesy of Prof. Daniel A. Fletcher, UC Berkeley and Lawrence Berkeley National Laboratory
33
Fig. 52. A simple sketch of a setup (i.e. diagnostics system) involving DLD devices with crossing streams and separation steps
which may be used to detect many clinically relevant blood indices.
34
6 References 1 Harold Craighead
Future lab-on-a-chip technologies for interrogating individual molecules
Nature, Vol 442, 27 July 2006; DOI: 10.1038/nature05061
2 Lotien Richard Huang, Edward C. Cox, Robert H. Austin, James C. Sturm
Continuous particle separation through deterministic lateral displacement
Science, no 304, 2004, p 987, DOI: 10.1126/science.1094567
3 Leonard A. Herzenberg, David Parks, Bita Sahaf, Omar Perez, Mario Roederer and Leonore A. Herzenberg
The History and Future of the Fluorescence Activated Cell Sorter and Flow Cytometry:A View from Stanford
Clinical Chemistry 48, No. 10, 2002, p1819–1827
4 E Ch. Mokken , M. Kedaria , Ch. P. Henny , M.R. Hardeman , and A.W. Gelb
The clinical importance of erythrocyte deformability, a hemorrheological parameter
Annals of hematology, 2004, Vol. 64, Nr 3, p113-122, DOI: 10.1007/BF01697397
5 John A. Davis , David W. Inglis, Keith J. Morton, David A. Lawrence, Lotien R. Huang, Stephen Y. Chou,
James C. Sturm and Robert H. Austin
Deterministic hydrodynamics: Taking blood apart
PNAS, October 2006 vol. 103 no. 40, p14779-14784, DOI:10.1073/pnas.0605967103
6 David W. Inglis, Nick Herman, and Graham Vesey
Highly accurate deterministic lateral displacement device and its application to purification of fungal spores
Biomicrofluidics, 2010 June; 4(2): 024109, DOI: 10.1063/1.3430553.
7 Siyang Zheng, Raylene Yung, Yu-Chong Tail, Harvey Kasdan
Deterministic lateral displacement MEMS device for continuous blood separation
18th IEEE International Conference on MEMS, 2005, p 851-854, DOI:10.1109/MEMSYS.2005.1454063
8 David Erickson and Dongqing Li
Integrated microfluidic devices
Analytica Chimica Acta, April 2004, Vol. 507, Issue 1, p11-26, DOI:10.1016/j.aca.2003.09.019
9 Younan Xia and George M. Whitesides
Soft lithography
Annu. Rev. Mater. Sci., 1998, (28), p153-184, DOI: 10.1002/(SICI)1521-3773(19980316)37:5<550
10 Stephanie Vande Vondele, Janos Vörös, Jeffrey A. Hubbell
RGD-grafted poly-l-lysine-graft-(polyethylene glycol) copolymers block non-specific protein adsorption while promoting cell
adhesion
Biotechnology and Bioengineering, Volume 82, June 2003, Issue 7, p784–790, DOI: 10.1002/bit.10625
11 Helene Andersson and Albert van den Berg
Microfluidic devices for cellomics: a review
Sensors and Actuators, July 2003, Vol. 92, Issue 3(15), p315-325, DOI:10.1016/S0925-4005(03)00266-1

35
12 Toru Kojima, Yuuri Hashimoto, Yuichi Watanabe, Shunsuke Kagawa, Futoshi Uno,Shinji Kuroda, Hiroshi
Tazawa, Satoru Kyo, Hiroyuki Mizuguchi, Yasuo Urata, Noriaki Tanaka and Toshiyoshi Fujiwara
A simple biological imaging system for detecting viable human circulating tumor cells
J Clin Invest., October 2009, Vol. 119(10), p3172–3181, DOI: 10.1172/JCI38609.
13 Sunitha Nagrath, Lecia V. Sequist, Shyamala Maheswaran, Daphne W. Bell, Daniel Irimia, Lindsey Ulkus,
Matthew R. Smith, Eunice L. Kwak, Subba Digumarthy, Alona Muzikansky, Paula Ryan, Ulysses J. Balis, Ronald
G. Tompkins, Daniel A. Haber & Mehmet Toner
Isolation of rare circulating tumour cells in cancer patients by microchip technology
Nature, December 2007, Vol.450, p1235-1239, DOI:10.1038/nature06385
14 Stefan Holm, Jason Beech, Michael P. Barrett and Jonas Tegenfeldt
Separation of parasites from human blood using deterministic lateral displacement
Lab-chip, 2011, DOI: 10.1039/C0LC00560F.
15 Milo et al. Nucl. Acids Res., 2010, 38 (suppl 1): D750-D753.
URL: http://bionumbers.hms.harvard.edu/
16 Thomas E. Andreoli , Charles C. J. Carpenter, Robert C. Griggs, Joseph Loscalzo
Cecil essentials of medicine
Saunders, 2004, 6th ed., p431-460, ISBN: 0721601472
17 Michael P. Sheetz and S. J. Singer
Biological Membranes as Bilayer Couples. A Molecular Mechanism of Drug-Erythrocyte Interactions
PNAS, November 1974, vol. 71 no. 11, p4457-4461
18 Yoshihito Yawata
Cell membrane: the red blood cell as a model
Wiley-VCH, 2003, p220-250, ISBN10: 3527304630
19 Jason P. Beech and Jonas O. Tegenfeldt
Tuneable separation in elastomeric microfluidics devices
Lab Chip, 2008, 8, p657-659, DOI: 10.1039/B719449H
20John Alan Davis
Microfluidic Separation of Blood Components through Deterministic Lateral Displacement
Doctoral dissertation, Princeton University, Sep.2008, p24
21Khaled Khairy and Jonathon Howard
Minimum-energy vesicle and cell shapes calculated using spherical harmonics parameterization
Soft Matter, 2011, Advance Article, DOI: 10.1039/c0sm01193b
22Gerald Lim H. W., Michael Wortis and Ranjan Mukhopadhyay
Stomatocyte–discocyte–echinocyte sequence of the human red blood cell: Evidence for the bilayer– couple hypothesis from
membrane mechanics
PNAS, December 2002, vol. 99 no. 26, p16766-16769, DOI: 10.1073/pnas.202617299
23 Martin Heller and Henrik Bruus
36
A theoretical analysis of the resolution due to diffusion and size dispersion of particles in deterministic lateral displacement
device
J. Micromech. Microeng, 2008, Vol. 18, 075030 (6pp), DOI:10.1088/0960-1317/18/7/07503
24 WH Reinhart and S Chien
Red cell rheology in stomatocyte-echinocyte transformation: roles of cell geometry and cell shape
Blood, 1986, Vol.67, p1110-1118, PMID: 3955230
25 M Piagnerelli, K Zouaoui Boudjeltia, D Brohee, et al
Assessment of erythrocyte shape by flow cytometry technique
J Clin Pathol, June 2006, Vol. 60, p549-554, DOI: 10.1136/jcp.2006.037523
26 Reinhart WH, Usami S, Schmalzer EA, Lee MM, Chien S.
Evaluation of red blood cell filterability test: influences of pore size, hematocrit level, and flow rate.
J Lab Clin Med. Oct 1984,Vol.104(4),p501-516, PMID: 6481214
27 Georgios S. Stamatakos, Dido Yova, and Nikolaos K. Uzunoglu
Integral equation model of light scattering by an oriented monodisperse system of triaxial dielectric ellipsoids: application in
ectacytometry
Applied Optics, 1997, Vol. 36, Issue 25, p6503-6512, DOI:10.1364/AO.36.006503
28 Breslauer DN, Maamari RN, Switz NA, Lam WA, Fletcher DA,
Mobile Phone Based Clinical Microscopy for Global Health Applications.
PLoS ONE, 2009, 4(7): e6320, DOI:10.1371/journal.pone.0006320
29 Forsström JJ, Dalton KJ.
Artificial neural networks for decision support in clinical medicine.
Ann Med., Oct 1995, Vol. 27(5), p509-517, PMID: 8541025
30 Kentala E, Laurikkala J, Pyykkö I, Juhola M.
Discovering diagnostic rules from a neurotologic database with genetic algorithms.
Ann Otol Rhinol Laryngol., Oct 1999. Vol. 108(10), p948-954, PMID: 10526849
31 J. G. G. Dobbe, M. R. Hardeman, G. J. Streekstra, J. Strackee, C. Ince, and C. A. Grimbergen
Analyzing Red Blood Cell-Deformability Distributions
Blood Cells, Molecules, and Diseases, May/June 2002, Vol. 28(3), p 373–384, DOI:10.1006/bcmd.2002.0528
32 Barbara J. Bain
Blood cells: a practical guide
Wiley-Blackwell, June 2006, p20-74, ISBN: 9781405142656
33 Robert S. Hillman, Kenneth A. Ault, Henry M. Rinder
Hematology in clinical practice: a guide to diagnosis and management
McGraw-Hill Professional, 2005, 4th ed., p 13-15, ISBN: 0-07-144035-6
34 Jason P. Beech, Peter Jönsson and Jonas O. Tegenfeldt.
Tipping the balance of deterministic lateral displacement devices using dielectrophoresis
Lab chip, Sep 2009, 9(18), p2698-706; DOI: 10.1039/B823275J
37
7 Appendix
7.1 Lab schemes
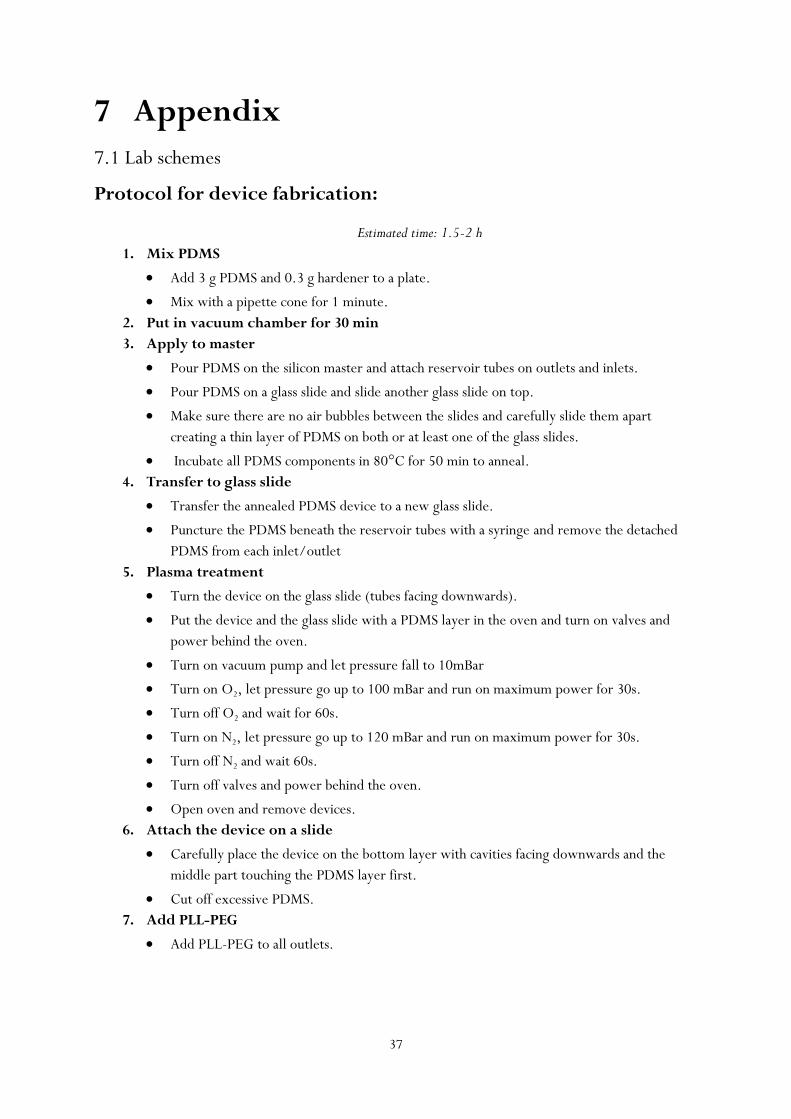
Protocol for device fabrication:
Estimated time: 1.5-2 h
1. Mix PDMS
Add 3 g PDMS and 0.3 g hardener to a plate.
Mix with a pipette cone for 1 minute.
2. Put in vacuum chamber for 30 min 3. Apply to master
Pour PDMS on the silicon master and attach reservoir tubes on outlets and inlets.
Pour PDMS on a glass slide and slide another glass slide on top.
Make sure there are no air bubbles between the slides and carefully slide them apart
creating a thin layer of PDMS on both or at least one of the glass slides.
Incubate all PDMS components in 80°C for 50 min to anneal.
4. Transfer to glass slide
Transfer the annealed PDMS device to a new glass slide.
Puncture the PDMS beneath the reservoir tubes with a syringe and remove the detached
PDMS from each inlet/outlet
5. Plasma treatment
Turn the device on the glass slide (tubes facing downwards).
Put the device and the glass slide with a PDMS layer in the oven and turn on valves and
power behind the oven.
Turn on vacuum pump and let pressure fall to 10mBar
Turn on O2, let pressure go up to 100 mBar and run on maximum power for 30s.
Turn off O2 and wait for 60s.
Turn on N2, let pressure go up to 120 mBar and run on maximum power for 30s.
Turn off N2 and wait 60s.
Turn off valves and power behind the oven.
Open oven and remove devices.
6. Attach the device on a slide
Carefully place the device on the bottom layer with cavities facing downwards and the
middle part touching the PDMS layer first.
Cut off excessive PDMS.
7. Add PLL-PEG
Add PLL-PEG to all outlets.
38
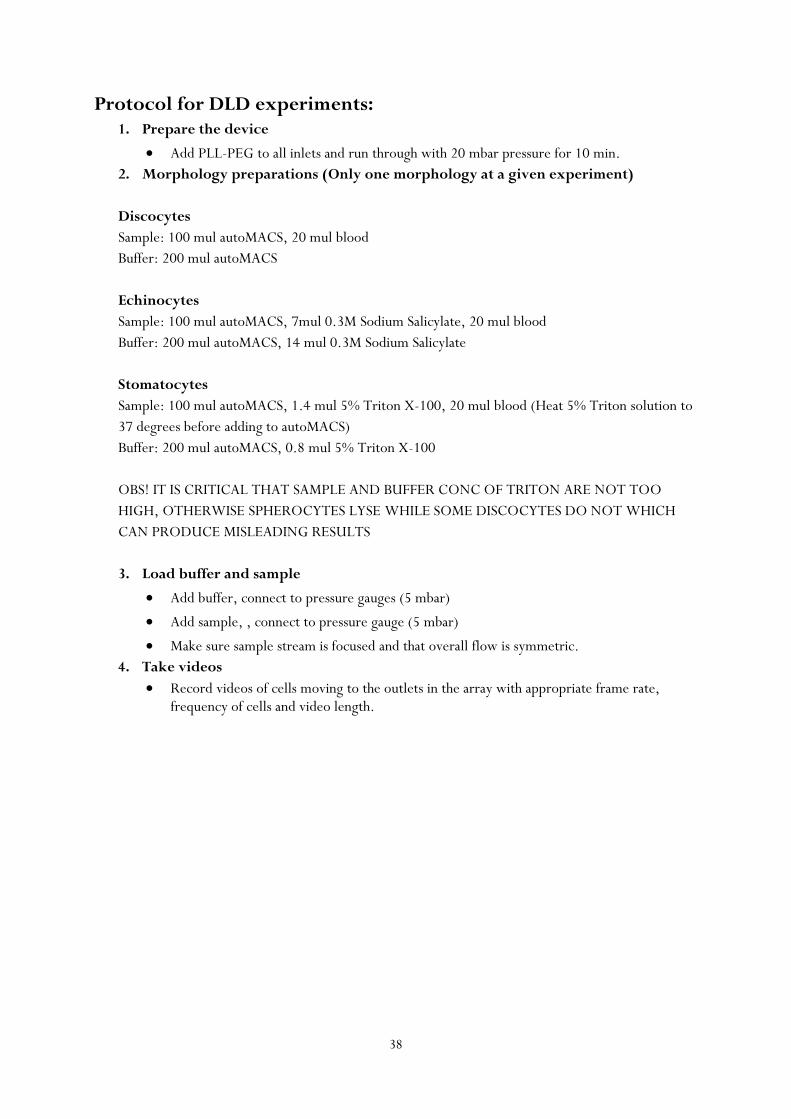
Protocol for DLD experiments: 1. Prepare the device
Add PLL-PEG to all inlets and run through with 20 mbar pressure for 10 min.
2. Morphology preparations (Only one morphology at a given experiment)
Discocytes
Sample: 100 mul autoMACS, 20 mul blood
Buffer: 200 mul autoMACS
Echinocytes
Sample: 100 mul autoMACS, 7mul 0.3M Sodium Salicylate, 20 mul blood
Buffer: 200 mul autoMACS, 14 mul 0.3M Sodium Salicylate
Stomatocytes
Sample: 100 mul autoMACS, 1.4 mul 5% Triton X-100, 20 mul blood (Heat 5% Triton solution to
37 degrees before adding to autoMACS)
Buffer: 200 mul autoMACS, 0.8 mul 5% Triton X-100
OBS! IT IS CRITICAL THAT SAMPLE AND BUFFER CONC OF TRITON ARE NOT TOO
HIGH, OTHERWISE SPHEROCYTES LYSE WHILE SOME DISCOCYTES DO NOT WHICH
CAN PRODUCE MISLEADING RESULTS
3. Load buffer and sample
Add buffer, connect to pressure gauges (5 mbar)
Add sample, , connect to pressure gauge (5 mbar)
Make sure sample stream is focused and that overall flow is symmetric.
4. Take videos
Record videos of cells moving to the outlets in the array with appropriate frame rate, frequency of cells and video length.
39
Discocyte fixation protocol
Add 20µl of blood from a finger prick to 180µl of PBS (find out info) chilled in ice, in a 1.5ml eppendorf tube.
Centrifuge at 600g and 4˚C for 10 minutes.
Remove the supernatant and replace with 180µl of chilled PBS.
Repeat 2. and 3.
Repeat 2.
Add 20µl of 25% glutaraldehyde stock solution to 180µl of chilled PBS.
Remove supernatant and replace with 180µl of the 2.5% glutaraldehyde solution.
Leave at room temp for 1 hour.
Centrifuge at 600g and 4˚C for 5 minutes.
Remove the supernatant and replace with 180µl of chilled PBS.
Repeat 9. and 10. twice.
Preparation for SEM (by Jason Beech)
Centrifuge at 600g and 4˚C for 5 minutes.
Remove supernatant and replace with 100ul 50% etoh and wait ~5mins
Centrifuge at 600g and 4˚C for 5 minutes.
Remove supernatant and replace with 100ul 70% etoh and wait ~5mins
Centrifuge at 600g and 4˚C for 5 minutes.
Remove supernatant and replace with 100ul 90% etoh and wait ~5mins
Centrifuge at 600g and 4˚C for 5 minutes.
Remove supernatant and replace with 100ul 100% etoh and wait ~5mins
Place drop of solution (~2ul) on a polisine slide and allow to dry. Sputter on chrome layer (~10nm?)

40
7.2 Matlab
Due to the extensive amount of coding associated with flow simulations with COMSOL-Matlab LiveLink and
particle simulations in Matlab, it is not presented here but can be accessed by sending an email to


![ERYTHROCYTES [RBCs]](https://img.pdfslide.us/doc/110x75/56813dc0550346895da78963/erythrocytes-rbcs-56ea22b2e2743.jpg)