Embed Size (px)
Citation preview
Defect Prediction Guided Search-Based Software TestingAnjana Perera
Faculty of Information Technology
Monash University
Melbourne, Australia
Aldeida Aleti
Faculty of Information Technology
Monash University
Melbourne, Australia
Marcel Böhme
Faculty of Information Technology
Monash University
Melbourne, Australia
Burak Turhan
Faculty of Information Technology
Monash University
Melbourne, Australia
ABSTRACTToday, most automated test generators, such as search-based soft-
ware testing (SBST) techniques focus on achieving high code cov-
erage. However, high code coverage is not sufficient to maximise
the number of bugs found, especially when given a limited testing
budget. In this paper, we propose an automated test generation tech-
nique that is also guided by the estimated degree of defectiveness
of the source code. Parts of the code that are likely to be more de-
fective receive more testing budget than the less defective parts. To
measure the degree of defectiveness, we leverage Schwa, a notable
defect prediction technique.
We implement our approach into EvoSuite, a state of the art
SBST tool for Java. Our experiments on the Defects4J benchmark
demonstrate the improved efficiency of defect prediction guided
test generation and confirm our hypothesis that spending more
time budget on likely defective parts increases the number of bugs
found in the same time budget.
CCS CONCEPTS• Software and its engineering → Software testing and de-bugging; Search-based software engineering.
KEYWORDSsearch-based software testing, automated test generation, defect
prediction
ACM Reference Format:Anjana Perera, Aldeida Aleti, Marcel Böhme, and Burak Turhan. 2020. De-
fect Prediction Guided Search-Based Software Testing. In 35th IEEE/ACMInternational Conference on Automated Software Engineering (ASE ’20), Sep-tember 21–25, 2020, Virtual Event, Australia. ACM, New York, NY, USA,
13 pages. https://doi.org/10.1145/3324884.3416612
Permission to make digital or hard copies of all or part of this work for personal or
classroom use is granted without fee provided that copies are not made or distributed
for profit or commercial advantage and that copies bear this notice and the full citation
on the first page. Copyrights for components of this work owned by others than the
author(s) must be honored. Abstracting with credit is permitted. To copy otherwise, or
republish, to post on servers or to redistribute to lists, requires prior specific permission
and/or a fee. Request permissions from [email protected].
ASE ’20, September 21–25, 2020, Virtual Event, Australia© 2020 Copyright held by the owner/author(s). Publication rights licensed to ACM.
ACM ISBN 978-1-4503-6768-4/20/09. . . $15.00
https://doi.org/10.1145/3324884.3416612
1 INTRODUCTIONSoftware testing is a crucial step in improving software quality.
Finding effective test cases, however, is a complex task, which is be-
coming even more difficult with the increasing size and complexity
of software systems. Automated software testing makes this labour
intensive task easier for humans by automatically generating test
cases for a software system. In particular, search based software
testing (SBST) techniques [36] have been very successful in auto-
matically generating test cases, and are widely used not only in
academia, but also in the industry (e.g., Facebook [4, 44]).
SBST techniques use searchmethods such as genetic algorithms [1,
50] to find high quality test cases for a particular system. These
methods focus on code coverage, and research shows that SBST
methods are very effective at achieving high coverage [2, 49, 51, 52].
They can even cover more code than the manually written test
cases [28, 58]. However, a test suite with high code coverage does
not necessarily imply effective bug detection by the test suite. In-
deed, previous studies show that SBST methods are not as effective
in finding real bugs [3, 59]. Even EvoSuite [19] – a state of the
art SBST tool – could only find on average 23% of the bugs from
the Defects4J dataset [39], which contains 357 bugs from 5 java
projects [59]. Ideally, SBST techniques should aim at generating
test cases that reveal bugs, however this is a difficult task since
during the search for test cases it is not possible to assess if a test
case has found a bug (e.g., semantic bugs). In this paper, we aim
to enhance SBST techniques by incorporating information from
a defect prediction algorithm to inform the search process of the
areas in the software system that are likely to be defective. Thus,
the SBST technique, while it cannot tell whether the test cases it
produces are indeed finding bugs, it is able to generate more test
cases for the defective areas, and as a result, increases the likelihood
of finding the bugs.
Defect prediction algorithms [42] estimate the likelihood that
a file [13, 14, 42], class [8] or method/function [10, 32, 37] in a
software system is defective. These methods are very effective at
identifying the location of bugs in software [10, 47, 54]. As a result of
their efficacy, defect prediction models are used to help developers
focus their limited testing effort on components that are the most
likely to be defective [13]. In addition, defect prediction has been
used to inform a test case prioritisation strategy, G-clef [54], of the
classes that are likely to be buggy, and found it is promising. Our

ASE ’20, September 21–25, 2020, Virtual Event, Australia Anjana Perera, Aldeida Aleti, Marcel Böhme, and Burak Turhan
work is the first to use defect prediction for improving automated
test case generation.
We introduce defect prediction guided SBST (SBST𝐷𝑃𝐺 ), which
uses information from a defect predictor to focus the search towards
the defective areas in software rather than spending the available
computational resources (i.e., time budget) to cover non-defective
areas. We employ Schwa [14, 54] as the defect prediction approach,
which calculates the defect scores based on the change history of
the Java classes. Next, a budget allocation algorithm, called Budget
Allocation Based on Defect Scores (BADS) allocates the time budget
for each class based on the predictions given by the defect predictor.
At a high level, it follows the basic and intuitive rule; highly likely
to be defective classes get a higher time budget allocated and less
likely to be defective classes get a lower time budget. Finally, we
use 𝐷𝑦𝑛𝑎𝑀𝑂𝑆𝐴 [52], a state of the art SBST algorithm, to generate
test suites for each class in the project by spending the allocated
time budgets.
Real-world projects are usually very large and there can be even
more than 1,000 classes in a project. Hence, it takes significant
amount of resources (e.g., time) to run these test generation tools
for each class in the project. At the same time, the available compu-
tational resources are often limited in practice [11]. Therefore, it
is necessary to optimally utilise the available resources (e.g., time
budget) to generate test suites for the projects with maximal bug
detection. Existing SBST approaches allocate the available time
budget equally for each class in the project [23, 24]. Usually, most
classes are clean, hence we argue that this is a sub-optimal strategy.
Our proposed approach addresses this by allocating the available
time budget to each class in the project based on the class level
defect prediction information.
We evaluate how our approach performs in terms of the effi-
ciency in finding real bugs compared to the state of the art. Second,
we examine if our approach finds more unique bugs. This is partic-
ularly important to investigate, as it will reveal if using information
from the defect prediction can help SBST reveal bugs that cannot
be found otherwise. We evaluate SBST𝐷𝑃𝐺 on 434 reported real
bugs from 6 open source java projects in the Defects4J dataset. Our
empirical evaluation demonstrates that in a resource constrained
environment, when given a tight time budget, SBST𝐷𝑃𝐺 is signif-
icantly more efficient than the state of the art SBST with a large
effect size. In particular, SBST𝐷𝑃𝐺 finds up to 13.1% more bugs
on average compared to the baseline approach. In addition, our
approach is also able to expose more unique bugs which cannot be
found by the state-of-the-art approach.
In summary, the contribution of this paper is a novel approach
that combines defect prediction and SBST to improve the bug de-
tection capability of SBST by focusing the search more towards the
defective areas in software. In addition, we present an empirical
evaluation involving 434 real bugs from 6 open source java projects
(which took roughly 34,600 hours) that demonstrates the efficiency
of our proposed solution. Finally, the source code of our proposed
technique and the scripts for post processing the results are publicly
available here: https://github.com/SBST-DPG
2 RELATEDWORK2.1 Search Based Software TestingSearch based software testing (SBST) is an effective strategy for
achieving high code coverage [51–53]. Shamshiri et al. [59] and
Almasi et al. [3] studied the bug detection performance of SBST on
open source and industrial software respectively. While EvoSuite
[19], which we consider as the state of the art SBST tool given its
maturity, found more bugs than the other techniques used in their
studies, overall the results show that the bug detection is still a
significant challenge for SBST. Particularly, EvoSuite found only an
average of 23% bugs from the Defects4J dataset [59]. It is clear that
using only the 100% branch coverage criterion was not sufficient
to search for test cases that can detect the bugs. In contrast, we
use defect prediction information to focus the search to extensively
explore the search space for test cases in defective areas.
Gay [31] studied the effect of combining coverage criteria on the
bug detection performance of SBST, and found that multiple cover-
age criteria outperform a single criterion. However, the authors did
not recommend a general strategy to select which criteria to com-
bine, since their selection strategies also produced many ineffective
combinations. Our work is the first approach that focuses on in-
forming SBST of the defective areas to spend more search resources
to such areas. Thus, we believe our approach will further improve
the bug detection capability of the single criterion or combination
of criteria.
2.2 Defect PredictionPrevious work on defect prediction have considered a wide range of
metrics such as code size [45], code complexity [61], object-oriented
[8], organisational [47] and change history [46] to predict future
defects in a software project. Graves et al. [34] showed that the
number of changes and particularly the recent changes to the code
are effective indicators of future defects. Kim et al. [40] followed the
observation that bugs occur in software change history as bursts,
hence they argue that recent changes to the code and recent faults
in the code are likely to introduce bugs in the future.
Rahman et al. [56] proposed a simple approach, which was even-
tually implemented by the Google Engineering team [42, 43], that
orders files by the number of bug fix commits in a file, and found out
that its performance is quite similar to the more complex approach
FixCache [40]. Furthermore, they showed that the files that have
been recently involved in a bug fix are likely to contain further
bugs. Paterson et al. [54] used an enhanced version of this approach
as the defect predictor to inform a test case prioritisation strategy
of the classes that are likely to be buggy, and found it is promising.
In particular, they used Schwa [14], which predicts defects in pro-
grams by using three metrics; recent changes, recent bug fixes, and
recent new authors [47] to the code.
2.3 Budget Allocation ProblemSearch based software test generation tools like EvoSuite generate
test suites for each class in the project separately. This is done
by running a search method such as genetic algorithm (GA) for
each class to maximise statement, branch, and method coverage,
or a combination of the three. One of the crucial parameters that

Defect Prediction Guided Search-Based Software Testing ASE ’20, September 21–25, 2020, Virtual Event, Australia
has to be tuned is the time budget for each class, which is used as
a stopping criterion for the GA. Allocating a higher time budget
allows the search method to extensively explore the search space
of possible test inputs, thus increasing the probability of finding
the optimum.
For small projects, it is feasible to run automated test generation
individually for each class in the project. Real-world projects, how-
ever, are usually very large, e.g., a modern car has millions of lines
of code and thousands of classes [9], and they require a significant
amount of resources (e.g., time) to run the test generation tools
for each class in the project. Even in an open source project like
Apache Commons Math [16], there are around 800 classes. In a
project like this, it would take at least 13-14 hours to run automated
test generation with spending just one minute per each class. At the
same time, the available computational resources are often limited
in practice [11]. Therefore this raises the question, ‘How should we
optimally utilise the available computational resources (e.g., time
budget) to generate test suites for the whole project with maximal
bug detection?’.
Previous work on bug detection performance of SBST [3, 31, 59]
allocated a fix time budget to test generation for each buggy class.
Since the buggy classes are not known prior to running tests, in
practice all the classes in the project have to be allocated the same
time budget. Usually, most classes are not buggy, hence we argue
that this is a sub-optimal strategy. Our approach solves this problem
by allocating time budget to classes based on the information given
by a defect predictor.
Campos et al. [11] proposed a budget allocation based on the
complexity of the classes in order to maximise the branch coverage.
In particular, they used number of branches in a class as a proxy to
the complexity of the class. In contrast, the scope of this research
is to maximise the number of bugs detection.
Contrary to the previous works [3, 11, 31, 59] that considered
test suite generation for a regression testing scenario, we focus on
generating tests to find bugs not only limited to regressions, but
also the bugs that are introduced to the system at various times.
3 DEFECT PREDICTION GUIDEDSEARCH-BASED SOFTWARE TESTING
Defect Prediction Guided SBST (SBST𝐷𝑃𝐺 ) (see Figure 1) uses defect
scores of each class produced by a defect predictor to focus the
search towards the defective areas of a program. Existing SBST
approaches allocate the available time budget equally for each class
in the project [23, 24, 52, 59]. Usually, most classes are not buggy,
hence we argue that this is a sub-optimal strategy. Ideally, valuable
resources should be spent in testing classes that are likely to be
buggy, hence we employ a defect predictor, known as Schwa [14],
to calculate the likelihood that a class in a project is defective.
Our approach has three main modules: i) Defect Predictor (DP), ii)
Budget Allocation Based on Defect Scores (BADS), and iii) Search-
Based Software Testing (SBST).
3.1 Defect PredictorThe defect predictor gives a probability of defectiveness (defect
score) for each class in the project. The vector s represents thisoutput. In our implementation of SBST𝐷𝑃𝐺 , we choose (a) the level
of granularity of the defect predictor to be the class level, and (b)
the Schwa [14] as the defect predictor module.
Paterson et al. [54] successfully applied Schwa as the defect
predictor in G-clef to inform a test case prioritisation strategy of the
classes that are likely to be buggy. Certainly other defect prediction
approaches proposed in the literature (e.g., FixCache [40], Change
Bursts [48]) would also be suitable for the task at hand. A strength
of Schwa is its simplicity, and that it does not require training
a classifier which makes it easy to apply to an industrial setting
where training data is not always available (like the one we study).
In addition, Schwa can be considered as an enhancement of a tool
implemented by the Google Engineering team [42, 43].
Schwa uses the following threemeasureswhich have been shown
to be effective at producing defect predictions in the literature (see
Section 2.2); i) Revisions - timestamps of revisions (recent changes
are likely to introduce faults), ii) Fixes - timestamps of bug fix
commits (recent bug fixes are likely to introduce new faults), and
iii)Authors - timestamps of commits by new authors (recent changes
by the new authors are likely to introduce faults). The Schwa tool
extracts this information through mining a version control system
such as Git [33]. The tool is readily available to use as a python
package at Pypi [29]. Therefore, given the robustness of this tool
and its approach, we decide to use it as the defect predictor module
in our approach.
Schwa [30] starts with extracting the three metrics; Revisions(𝑅𝑐 ), Fixes (𝐹𝑐 ), and Authors (𝐴𝑐 ) for all classes 𝑐 ∈ 𝐶 in the project.
For each timestamp, it calculates a time weighted risk (TWR) [42]
using the Equation (1).
𝑇𝑊𝑅(𝑡𝑖 ) =1
1 + exp(−12𝑡𝑖 + 2 + (1 −𝑇𝑅) ∗ 10)(1)
The quantity 𝑡𝑖 is the timestamp normalised between 0 and 1,
where 0 is the normalised timestamp of the oldest commit under
consideration and 1 is the normalised timestamp of the latest com-
mit. The number of commits that Schwa tracks back in version
history of the project (𝑛) is a configurable parameter and it can
take values from one commit to all the commits. The parameter
𝑇𝑅 ∈ [0, 1] is called the Time Range and it allows to change the
importance given to the older commits. The time weighted risk
formula scores recent timestamps higher than the older ones (see
Figure 2).
Once Schwa calculated the TWRs, it aggregates these TWRs per
each metric, and calculates a weighted sum 𝑠𝑐 for each class 𝑐 ∈ 𝐶in the project as in Equation (2).
𝑠𝑐 = 𝑤𝑟 ∗∑𝑡𝑖 ∈𝑅𝑐
𝑇𝑊𝑅(𝑡𝑖 ) +𝑤 𝑓 ∗∑𝑡𝑖 ∈𝐹𝑐
𝑇𝑊𝑅(𝑡𝑖 )
+𝑤𝑎 ∗∑𝑡𝑖 ∈𝐴𝑐
𝑇𝑊𝑅(𝑡𝑖 )(2)
The sum
∑𝑡𝑖 ∈𝑅𝑐 𝑇𝑊𝑅(𝑡𝑖 ) is the total of the time weighted risks
of the Revisions metric for class 𝑐 . Similarly,
∑𝑡𝑖 ∈𝐹𝑐 𝑇𝑊𝑅(𝑡𝑖 ) and∑
𝑡𝑖 ∈𝐴𝑐𝑇𝑊𝑅(𝑡𝑖 ) are the sums of the TWRs of the Fixes and Authors
metrics for class 𝑐 ∈ 𝐶 . The quantities𝑤𝑟 ,𝑤 𝑓 , and𝑤𝑎 are weights
that modify the TWR sum of each metric and their sum is equal to
1. The weighted sum, 𝑠𝑐 , is called the score of class 𝑐 ∈ 𝐶 .

ASE ’20, September 21–25, 2020, Virtual Event, Australia Anjana Perera, Aldeida Aleti, Marcel Böhme, and Burak Turhan
ProjectSchwa:DefectPredictor
DefectScores
TimeBudgets
EvoSuite:SBST TestSuite
BudgetAllocationBasedon
DefectScores(BADS)
Figure 1: Defect Prediction Guided SBST Overview
0.0 0.2 0.4 0.6 0.8 1.0
0.0
0.2
0.4
0.6
0.8
1.0
Normalised Timestamp
Tim
e W
eig
hte
d R
isk
Figure 2: Time Weighted Risk (𝑇𝑅 = 0.4)
Finally, the Schwa tool estimates the probability 𝑝 (𝑐) of that aclass 𝑐 is defective as given in Equation (3).
𝑝 (𝑐) = 1 − exp(−𝑠𝑐 ) (3)
In this paper, we refer to this probability of defectiveness 𝑝 (𝑐)as the defect score of class 𝑐 ∈ 𝐶 .
3.2 Budget Allocation Based on Defect ScoresBudget Allocation Based on Defect Scores (BADS) takes the defect
scores (s = {𝑝 (𝑐) |𝑐 ∈ 𝐶}) as input and decides on how to allocate the
available time budget to each class based on these scores, producing
a vector t as output. Ideally, all the defective classes in the project
should get more time budget while non-defective classes can be
left out from test generation. However, the defect predictor only
gives an estimation of the probability of defectiveness. Therefore,
BADS allocates more time budget to the highly likely to be defective
classes than to the less likely to be defective classes. This way we
expect SBST to get higher time budget to extensively explore for
test cases in defective classes rather than in non-defective ones.
3.2.1 Exponential Time Budget Allocation Based on Defect Scores.Algorithm 1 illustrates the proposed time budget allocation algo-
rithm of BADS, where s is the set of defect scores of the classes, 𝑇is the total time budget for the project, 𝑡min is the minimum time
budget to be allocated for each class, 𝑇𝐷𝑃 is the time spent by the
defect predictor module, and 𝑒𝑎 , 𝑒𝑏 , and 𝑒𝑐 are parameters of the
exponential function that define the shape of the exponential curve.
t is the set of time budgets allocated for the classes.
Algorithm 1: Exponential Time Budget Allocation Based
on Defect Scores
Input :The set of all the classes 𝐶 , where 𝑁 = |𝐶 |: s = {𝑠1, 𝑠2, . . . , 𝑠𝑁 }
:𝑇, 𝑡𝑚𝑖𝑛,𝑇𝐷𝑃
:𝑒𝑎, 𝑒𝑏 , 𝑒𝑐Output : t = {𝑡1, 𝑡2, . . . , 𝑡𝑁 }
1 r← Assign-Rank(s)2 r
′ ← Normalise-Rank(r)3 w
′ ← ∅4 for all 𝑐𝑖 ∈ 𝐶 do5 𝑤 ′
𝑖← 𝑒𝑎 + 𝑒𝑏 ∗ exp(𝑒𝑐 ∗ 𝑟 ′𝑖 )
6 w← Normalise-Weight(w′)
7 t← ∅8 for all 𝑐𝑖 ∈ 𝐶 do9 𝑡𝑖 ← 𝑤𝑖 ∗ (𝑇 − 𝑁 ∗ 𝑡min −𝑇𝐷𝑃 ) + 𝑡min
10
The defect scores assignment in Figure 3 is a good example of
the usual defect score distribution by a defect predictor. Usually,
there are only a few classes which are actually buggy. Allocating
higher time budgets for these classes would help maximise the bug
detection of the test generation tool. Following this observation
and the results of our pilot runs, we use an exponential function
(line 5 in Algorithm 1) to highly favour the budget allocation for
the few highly likely to be defective classes.
Moreover, there is relatively higher number of classes which are
moderately likely to be defective (e.g., 0.5 < defect score < 0.8). It is
also important to ensure there is sufficient time budget allocated
for these classes. Otherwise, neglecting test generation for these
classes could negatively affect bug detection of the test generation
tool. We introduce a minimum time budget, 𝑡min, to all the classes
because we want to ensure that every class gets a budget allocated
regardless of the defectiveness predicted by the defect predictor.
The exponential function in Algorithm 1 together with 𝑡min allow
an adequate time budget allocation for the moderately likely to be
defective classes.
Upon receiving the defect scores (s), BADS assigns ranks (r) forall the classes according to the defect scores. Next, the Normalise-
Rank function normalises the ranks in the range [0,1], where the
rank of the most likely to be defective class is 0 and the least likely to

Defect Prediction Guided Search-Based Software Testing ASE ’20, September 21–25, 2020, Virtual Event, Australia
Defect Score
Freq
uenc
y
0.0 0.2 0.4 0.6 0.8 1.0
050
100
150
Figure 3: Distribution of the defect scores assigned by Schwafor the classes in Chart-9 bug from Defects4J.
be defective class is 1. Then, each class gets a weight (𝑤′𝑖) assigned
based on its normalised rank by the exponential function. The
amount of time budget allocated to class 𝑐𝑖 is proportional to 𝑤′𝑖.
The parameters 𝑒𝑎 , 𝑒𝑏 , and 𝑒𝑐 have to be carefully selected such
that the weights are almost equal and significantly small for the
lower-ranked classes, and the difference between the weights of
adjacently ranked classes rapidly increases towards the highly-
ranked classes. The Normalise-Weight function normalises the
weights to the range [0,1], ensuring the summation is equal to
1, and produces the normalised weights vector w. Finally, BADS
allocates time budget for each class from the remaining available
time budget, 𝑇 − 𝑁 ∗ 𝑡min −𝑇𝐷𝑃 , based on its normalised weight
(line 9 in Algorithm 1) .
3.2.2 The 2-Tier Approach. According to the defect predictor out-
come, almost all the classes in the project get non-zero defect scores
attached to them. This gives the impression that all these classes can
be defective with at least a slight probability. However, in reality,
this does not hold true. For a given project version, there are only
a few defective classes. A defect predictor is likely to predict that
clean classes are also defective with a non-zero probability. While
the exponential function disfavours the budget allocation for these
less likely to be defective classes, 𝑡min guarantees a minimum time
budget allocated to them. If we decrease 𝑡min in order to make the
budget allocation negligible for the likely to be clean classes, then
it would risk a sufficient time budget allocation for the moderately
likely to be defective classes.
We propose the 2-Tier approach which divides the project into
two tiers following the intuition that only a set of classes are de-
fective in a project. BADS sorts the classes into two tiers before
the weights assignment, such that the highly likely to be defective
classes are in the first tier and the less likely to be defective classes
are in the second tier. This allows to further discriminate the less
likely to be defective classes, and favour the highly likely to be
defective classes by simply allocating only a smaller fraction of
the total time budget to the second tier and allocating the rest to
the first tier. Section 4.4.3 provides more details on the parameter
selection of the 2-Tier approach.
3.3 Search Based Software TestingWe use EvoSuite [19] as the search-based software testing (SBST)
module in our defect prediction guided SBST approach. EvoSuite
is an automated test generation framework that generates JUnit
test suites for Java classes. It was first proposed by Fraser and
Arcuri [19] in 2011, since then it has gained growing interest in
the SBST community [6, 51, 52, 57, 59]. Its effectiveness has been
evaluated on open source and as well as industrial software projects
in terms of the code coverage [23, 51–53, 57] and bug detection
[3, 59]. Furthermore, EvoSuite won 6 out of 7 of the SBST unit
testing tool competitions [12, 21, 22, 25–27]. To date, EvoSuite is
actively maintained, and its source code and releases are readily
available to use at GitHub [15] and their website [18]. Therefore,
given the maturity of EvoSuite, we decide to use it as the SBST
module in our approach.
More recently, Panichella et al. [52] developed a new search al-
gorithm, 𝐷𝑦𝑛𝑎𝑀𝑂𝑆𝐴 (Dynamic Many-Objective Sorting Algorithm),
as an extension to EvoSuite, which stands as the current state of
the art. It has been shown to be effective at achieving high branch,
statement and strong mutation coverage than the previous ver-
sions of EvoSuite ([20, 51, 57]) [52]. Moreover, 𝐷𝑦𝑛𝑎𝑀𝑂𝑆𝐴 was
the search algorithm of EvoSuite, which won the unit testing tool
competition at SBST 2019 [12]. Therefore, we use 𝐷𝑦𝑛𝑎𝑀𝑂𝑆𝐴 as
the search algorithm in EvoSuite.
4 DESIGN OF EXPERIMENTSWe evaluate our approach in terms of its efficiency in finding bugs,
and the effectiveness in revealing unique bugs, i.e., bugs that cannot
be found by the benchmark approach. Our first research question
is:
RQ1: Is SBST𝐷𝑃𝐺 more efficient in finding bugs compared to the stateof the art?
To answer this research question, we run a set of experiments where
we compare our approach against the baseline method discussed
in Section 4.3. All methods are employed to generate test cases
for Defects4J [38], which is a well-studied benchmark of buggy
programs described in Section 4.2. Once the test cases are generated,
we check if they find the bugs in the programs, and report the
results as the mean and median over 20 runs. To check for statistical
significance of the differences and the effect size, we employ two-
tailed non-parametric Mann-Whitney U-Test with the significance
level (𝛼) 0.05 [5] and Vargha and Delaney’s 𝐴12 statistic [60]. We
also plot the results as boxplots to visualise their distribution.
In addition, to analyse the effectiveness of the proposed approach,
we seek to answer the following research question:
RQ2: Does SBST𝐷𝑃𝐺 find more unique bugs?
To answer this research question, we analyse the results from
the experiments in more detail. While the first research question
focuses on the overall efficiency, in the second research question we
aim to understand if SBST𝐷𝑃𝐺 is capable of revealing more unique
bugs which can not be exposed by the baseline method. Part of the
efficiency of our proposed method, however, could be due to its
robustness, which is measured by the success rate, hence we also
report how often a bug is found over 20 runs.
ASE ’20, September 21–25, 2020, Virtual Event, Australia Anjana Perera, Aldeida Aleti, Marcel Böhme, and Burak Turhan
4.1 Time BudgetIn real world scenario, total time budget reserved for test gener-
ation for a project depends on how it is used in the industry. For
example, a project having hundreds of classes and running SBST 1-2
minutes per class takes several hours to finish test generation. If an
organisation wants to adapt SBST in their continuous integration
(CI) system [17], then it has to share the resources and schedules
with the processes already in the system; regression testing, code
quality checks, project builds etc. In such case, it is important that
SBST uses minimal resources possible, such that it does not idle
other jobs in the system due to resource limitations.
Panichella et al. [52] showed that DynaMOSA is capable of con-
verging to the final branch coverage quickly, sometimes with a
lower time budget like 20 seconds. This is particularly important
since faster test generation allows more frequent runs and thereby
it makes SBST suitable to fit into the CI/CD pipeline. Therefore, we
decide that 30 seconds per class is an adequate time budget for test
generation and 15 seconds per class is a tight time budget in a usual
resource constrained environment. We conduct experiments for 2
cases of total time budgets (𝑇 ); 15 ∗ 𝑁 and 30 ∗ 𝑁 seconds.
4.2 Experimental SubjectsWe use the Defects4J dataset [38, 39] as our benchmark. It contains
434 real bugs from 6 real-world open source Java projects. We re-
move 4 bugs from the original dataset [38] since they are not repro-
ducible under Java 8, which is required by EvoSuite. The projects
are JFreeChart (26 bugs), Closure Compiler (174 bugs), Apache
commons-lang (64 bugs), Apache commons-math (106 bugs), Mock-
ito (38 bugs) and Joda-Time (26 bugs). For each bug, the Defects4J
benchmark gives a buggy version and a fixed version of the pro-
gram. The difference between these two versions of the program is
the applied patch to fix the bug, which indicates the location of the
bug. The Defects4J benchmark also provides a high-level interface
to perform tasks like running the generated tests against the other
version of the program (buggy/fixed) to check if the tests are able
to find the bug, fixing the flaky test suites etc. [38].
Defects4J is widely used for research on automated unit test
generation [59], automated program repair [41], fault localisation
[55], test case prioritisation [54], etc. Thismakes Defects4J a suitable
benchmark for evaluating our approach, as it allows us to compare
our results to existing work.
4.3 Baseline SelectionWeuse the current state of the art SBST algorithm,𝐷𝑦𝑛𝑎𝑀𝑂𝑆𝐴 [52],
with equal time budget allocation, SBST𝑛𝑜𝐷𝑃𝐺 , as our baseline for
comparison. Previous work on bug detection capability of SBST
allocated an equal time budget for all the classes [3, 31, 59]. Even
though, Campos et al. [11] proposed a budget allocation targeting
the maximum branch coverage, we do not consider this as a baseline
in our work as we focus on bug detection instead. Our intended
application scenario is generating tests to find bugs not only limited
to regressions, but also the bugs that are introduced to the system
in different times. Hence, we consider generating tests to all of the
classes in the project regardless of whether they have been changed
or not. Therefore, in equal budget allocation, total time budget is
equally allocated to all the classes in a project.
4.4 Parameter SettingsThere are 3 modules in our approach. Each module has various
parameters to be configured, and the following subsections outline
the parameters and their chosen values in our experiments.
4.4.1 Schwa. Schwa has 5 parameters to be configured; 𝑤𝑟 , 𝑤 𝑓 ,
𝑤𝑎 , 𝑇𝑅, and 𝑛. We choose the default parameter values used in
Schwa [30] as follows: 𝑤𝑟 = 0.25, 𝑤 𝑓 = 0.5, 𝑤𝑎 = 0.25, and 𝑇𝑅 =
0.4. Our preliminary experiments with 𝑛 = 50, 100, 500, 1000 and
𝑎𝑙𝑙 𝑐𝑜𝑚𝑚𝑖𝑡𝑠 suggest that 𝑛 = 500 gives most accurate predictions.
4.4.2 EvoSuite. Arcuri and Fraser [7] showed that parameter tun-
ing of search algorithms is an expensive and long process, and the
default values give reasonable results when compared to tuned
parameters. Therefore, we use the default parameter values used in
EvoSuite in previous work [20, 52] except for the following param-
eters.
Coverage criteria:Weuse branch coverage since it performs better
among the other single criteria [31]. Gay [31] found some multiple
criteria combinations to be effective on bug detection than single
criterion. However, they did not recommend a strategy to com-
bine multiple criteria as their strategies also produced ineffective
combinations. Therefore, we decide to use only single criterion.
Assertion strategy: As Shamshiri et al. [59] mentioned, mutation-
based assertion filtering can be computationally expensive and lead
to timeouts sometimes. Therefore, we use all possible assertions as
the assertion strategy.
Given a coverage criterion (e.g., branch coverage), 𝐷𝑦𝑛𝑎𝑀𝑂𝑆𝐴
explores the search space of possible test inputs until it finds test
cases that cover all of the targets (e.g., branches) or the time runs
out (i.e., time budget). These are known as stopping criteria. This
way, if the search achieves 100% coverage before the timeout, any re-
maining time budget will be wasted. At the same time, 𝐷𝑦𝑛𝑎𝑀𝑂𝑆𝐴
aims at generating only one test case to cover each target in the
system under test (SUT), since its objective is to maximise the cov-
erage criterion given. This also helps in minimising the test suite
produced. However, when it comes to finding bugs in the SUT, just
covering the bug does not necessarily imply that the particular test
case can discover the bug. Hence, we find that using 100% coverage
as a stopping criterion and aiming at finding only one test case for
each target deteriorate the bug detection capability of 𝐷𝑦𝑛𝑎𝑀𝑂𝑆𝐴.
Therefore, in our approach, we configure 𝐷𝑦𝑛𝑎𝑀𝑂𝑆𝐴 to generate
more than one test case for each target in the SUT, retain all these
test cases, disable test suite minimisation and remove 100% cover-
age from the stopping criteria. By doing this, we compromise the
test suite size in order to increase the bug detection capability of
SBST.
4.4.3 BADS. Following the results of our pilot runs, we use the
default threshold of 0.5 to allocate the classes into the two tiers. In
particular, the top half of the classes (ranked in descending order
according to defect scores) are allocated in the first tier (𝑁1) and
the rest are in the second tier (𝑁2). 𝑁1 and 𝑁2 are the number of
classes in the first and second tiers respectively.Our preliminary results also suggest that allocating 90% and 10%
of the total time budget (𝑇 ) to the first tier (𝑇1) and the second tier(𝑇2) sufficiently favours the highly likely to be defective classes,
while not leaving out the less likely to be defective classes from test

Defect Prediction Guided Search-Based Software Testing ASE ’20, September 21–25, 2020, Virtual Event, Australia
generation. In particular, we choose 𝑇1 = 27 ∗ 𝑁1 and 𝑇2 = 3 ∗ 𝑁2
seconds at𝑇 = 15∗𝑁 and𝑇1 = 54∗𝑁1 and𝑇2 = 6∗𝑁2 seconds at𝑇 =
30 ∗𝑁 . We choose 15 and 30 seconds as 𝑡𝑚𝑖𝑛 for the first tier (𝑡min1)
at 𝑇 = 15 ∗ 𝑁 and 𝑇 = 30 ∗ 𝑁 respectively. The rationale behind
choosing these values for 𝑡min1is that it guarantees the classes in
the first tier at least get a time budget of the equal budget allocation
(i.e., budget allocation without defect prediction guidance). For 𝑡𝑚𝑖𝑛
of the second tier (𝑡min2), we assign 3 and 6 seconds at 𝑇 = 15 ∗ 𝑁
and 𝑇 = 30 ∗ 𝑁 because we believe 𝑇2 is not enough to go for an
exponential allocation.
The parameters for the exponential function are as follows: 𝑒𝑎 =
0.02393705, 𝑒𝑏 = 0.9731946, and 𝑒𝑐 = −10.47408. The rationale
behind choosing the parameter values for the exponential function
is as follows. The exponential curve is almost flat and equal to 0
for the values in the 𝑥 axis from 0.5 to 1 (see Figure 4). Then, after
𝑥 = 0.5, it starts increasing towards 𝑥 = 0. Finally, at 𝑥 = 0, the
output is equal to 1.
0.0 0.2 0.4 0.6 0.8 1.0
0.0
0.2
0.4
0.6
0.8
1.0
Normalised Rank
Weig
ht
(befo
re N
orm
alisati
on
)
Figure 4: Exponential Function of BADS. 𝑒𝑎 = 0.02393705, 𝑒𝑏 =
0.9731946, and 𝑒𝑐 = −10.47408
4.5 PrototypeWe implement the Defect Prediction Guided SBST approach in a
prototype tool in order to empirically evaluate it. The prototyped
tool is available to download from here: https://github.com/SBST-
DPG/sbst-dpg
4.6 Experimental ProtocolAs we mentioned earlier, to answer RQ1 and RQ2, we conduct
experiments for 𝑇 = 15 ∗ 𝑁 and 30 ∗ 𝑁 seconds.
In SBST𝐷𝑃𝐺 , Schwa uses current versions of the repositories
of the projects. For each bug, Schwa predicts the defectiveness of
the classes at the commit just before the bug fixing commit. For
each bug in Defects4J, there is a buggy version and a fixed version
of the project. We take each buggy version of the projects, and
then generate test suites only for the buggy class(es) of that project
version using the two approaches. To take the randomness of SBST
into account, we repeat each test generation run 20 times, and carry
out statistical tests when necessary. Consequently, we have to run
a total of 2 (approaches) ∗ 511 (buggy classes) ∗ 20 (repetitions) ∗ 2(time budgets) = 40,880 test generations. We collect the generated
test suites after each test generation run. Next, we use the fix testsuite interface in Defects4J to remove the flaky tests from each test
suite [59]. Then, we execute each resulting test suite against the
respective buggy and fixed versions to check if it finds the bug or
not using the run bug detection interface. If the test suite is not
compilable or there is at least one failing test case when the test
suite is run against the buggy version, then it is marked as Broken.If not, it will be run against the fixed version. Then, if at least one
test case fails, the test suite is marked as Fail (i.e., test suite findsthe bug). If all the test cases pass, then the test suite is marked as
Pass (i.e., test suite does not find the bug).
5 RESULTSWe present the results for each research question following the
method described in Section 4. While the main aim is to evaluate
if our approach is more efficient than the state of the art, we also
focus on explaining its strengths and weaknesses.
Table 1: Mean and median number of bugs found by the 2approaches against different total time budgets.
Mean Median
p-value 𝐴12T (s)
SBST𝐷𝑃𝐺 SBST𝑛𝑜𝐷𝑃𝐺 SBST𝐷𝑃𝐺 SBST𝑛𝑜𝐷𝑃𝐺
15 ∗ 𝑁 151.45 133.95 150.5 134.0 <0.0001 0.9430 ∗ 𝑁 171.45 166.9 170 167.5 0.0671 0.67
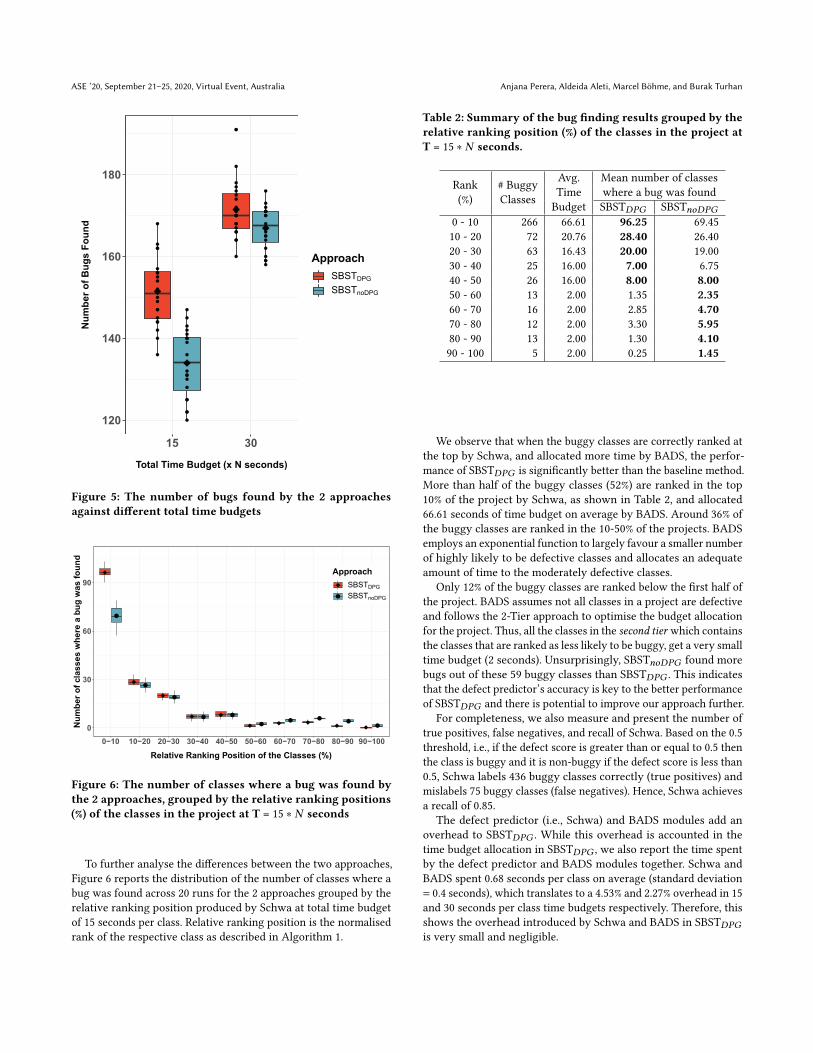
RQ1. Is SBST𝐷𝑃𝐺 efficient in finding bugs?As described in Section 4, we perform 20 runs for each SBST ap-
proach and each buggy program in Defects4J and report the results
as boxplots in Figure 5. As we can see, overall, our proposed method
SBST𝐷𝑃𝐺 finds more bugs than the baseline approach for both 15
and 30 seconds time budgets.
We also report the means, medians and the results from the sta-
tistical analysis in Table 1. SBST𝑛𝑜𝐷𝑃𝐺 finds 133.95 bugs on average
at total time budget of 15 seconds per class. SBST𝐷𝑃𝐺 outperforms
SBST𝑛𝑜𝐷𝑃𝐺 , and finds 151.45 bugs on average, which is an average
improvement of 17.5 (+13.1%) more bugs than SBST𝑛𝑜𝐷𝑃𝐺 . The dif-
ference of the number of bugs found by SBST𝐷𝑃𝐺 and SBST𝑛𝑜𝐷𝑃𝐺
is statistically significant according to the Mann-Whitney U-Test
(p-value < 0.0001) with a large effect size (𝐴12 = 0.94). Thus, we can
conclude that SBST𝐷𝑃𝐺 is more efficient than SBST𝑛𝑜𝐷𝑃𝐺 .
At total time budget of 30 seconds per class, SBST𝐷𝑃𝐺 finds more
bugs than the SBST𝑛𝑜𝐷𝑃𝐺 . According to the Mann-Whitney U-Test,
the difference between SBST𝐷𝑃𝐺 and SBST𝑛𝑜𝐷𝑃𝐺 is not statistically
significant, with a p-value of 0.067. However the effect size of 0.67
suggests that SBST𝐷𝑃𝐺 finds more bugs than SBST𝑛𝑜𝐷𝑃𝐺 67% of
the time, which is significant given how difficult it is to find failing
test cases [35].
In summary, defect prediction guided SBST (SBST𝐷𝑃𝐺 )
is significantly more efficient than SBST without defect
prediction guidance (SBST𝑛𝑜𝐷𝑃𝐺 ) when they are given a
tight time budget in a usual resource constrained scenario.
When there is sufficient time budget SBST𝐷𝑃𝐺 is more
effective than SBST𝑛𝑜𝐷𝑃𝐺 67% of the time.
ASE ’20, September 21–25, 2020, Virtual Event, Australia Anjana Perera, Aldeida Aleti, Marcel Böhme, and Burak Turhan
●
●
●
●
●
●
●
●
●
●
●
●
●
●
●
●
●
●
●
●●
●
●
●
●
●
●
●
●
●●
●
●
●
●
●
●
●
●
●
●
●
●
●
●
●
●
●
●
●
●
●
●
●
●
●
●
●
●
●
●
●
●
●
●
●
●
●
●
●
●
●
●
●
●
●
●
●
●
●
●
120
140
160
180
15 30
Total Time Budget (x N seconds)
Nu
mb
er
of
Bu
gs F
ou
nd
Approach
SBSTDPG
SBSTnoDPG
Figure 5: The number of bugs found by the 2 approachesagainst different total time budgets
●
●
●
● ●
●● ●
●●0
30
60
90
0−10 10−20 20−30 30−40 40−50 50−60 60−70 70−80 80−90 90−100
Relative Ranking Position of the Classes (%)
Nu
mb
er
of
cla
sses w
here
a b
ug
was f
ou
nd
Approach
●
SBSTDPG
SBSTnoDPG
Figure 6: The number of classes where a bug was found bythe 2 approaches, grouped by the relative ranking positions(%) of the classes in the project at T = 15 ∗ 𝑁 seconds
To further analyse the differences between the two approaches,
Figure 6 reports the distribution of the number of classes where a
bug was found across 20 runs for the 2 approaches grouped by the
relative ranking position produced by Schwa at total time budget
of 15 seconds per class. Relative ranking position is the normalised
rank of the respective class as described in Algorithm 1.
Table 2: Summary of the bug finding results grouped by therelative ranking position (%) of the classes in the project atT = 15 ∗ 𝑁 seconds.
Rank
(%)
# Buggy
Classes
Avg.
Time
Budget
Mean number of classes
where a bug was found
SBST𝐷𝑃𝐺 SBST𝑛𝑜𝐷𝑃𝐺
0 - 10 266 66.61 96.25 69.45
10 - 20 72 20.76 28.40 26.40
20 - 30 63 16.43 20.00 19.00
30 - 40 25 16.00 7.00 6.75
40 - 50 26 16.00 8.00 8.0050 - 60 13 2.00 1.35 2.3560 - 70 16 2.00 2.85 4.7070 - 80 12 2.00 3.30 5.9580 - 90 13 2.00 1.30 4.1090 - 100 5 2.00 0.25 1.45
We observe that when the buggy classes are correctly ranked at
the top by Schwa, and allocated more time by BADS, the perfor-
mance of SBST𝐷𝑃𝐺 is significantly better than the baseline method.
More than half of the buggy classes (52%) are ranked in the top
10% of the project by Schwa, as shown in Table 2, and allocated
66.61 seconds of time budget on average by BADS. Around 36% of
the buggy classes are ranked in the 10-50% of the projects. BADS
employs an exponential function to largely favour a smaller number
of highly likely to be defective classes and allocates an adequate
amount of time to the moderately defective classes.
Only 12% of the buggy classes are ranked below the first half of
the project. BADS assumes not all classes in a project are defective
and follows the 2-Tier approach to optimise the budget allocation
for the project. Thus, all the classes in the second tier which containsthe classes that are ranked as less likely to be buggy, get a very small
time budget (2 seconds). Unsurprisingly, SBST𝑛𝑜𝐷𝑃𝐺 found more
bugs out of these 59 buggy classes than SBST𝐷𝑃𝐺 . This indicates
that the defect predictor’s accuracy is key to the better performance
of SBST𝐷𝑃𝐺 and there is potential to improve our approach further.
For completeness, we also measure and present the number of
true positives, false negatives, and recall of Schwa. Based on the 0.5
threshold, i.e., if the defect score is greater than or equal to 0.5 then
the class is buggy and it is non-buggy if the defect score is less than
0.5, Schwa labels 436 buggy classes correctly (true positives) and
mislabels 75 buggy classes (false negatives). Hence, Schwa achieves
a recall of 0.85.
The defect predictor (i.e., Schwa) and BADS modules add an
overhead to SBST𝐷𝑃𝐺 . While this overhead is accounted in the
time budget allocation in SBST𝐷𝑃𝐺 , we also report the time spent
by the defect predictor and BADS modules together. Schwa and
BADS spent 0.68 seconds per class on average (standard deviation
= 0.4 seconds), which translates to a 4.53% and 2.27% overhead in 15
and 30 seconds per class time budgets respectively. Therefore, this
shows the overhead introduced by Schwa and BADS in SBST𝐷𝑃𝐺
is very small and negligible.

Defect Prediction Guided Search-Based Software Testing ASE ’20, September 21–25, 2020, Virtual Event, Australia
Table 3: Success rate for eachmethod at 15∗𝑁 total time budget. Bug IDs that were found by only one approach are highlightedwith different colours; SBST𝐷𝑃𝐺 and SBST𝑛𝑜𝐷𝑃𝐺 .
Bug ID SBST𝐷𝑃𝐺 SBST𝑛𝑜𝐷𝑃𝐺
Lang-1 1 0.45
Lang-4 0.9 1
Lang-5 0 0.2
Lang-7 1 1
Lang-8 0.1 0.1
Lang-9 0.95 1
Lang-10 0.95 0.8
Lang-11 0.8 0.95
Lang-12 0.2 0.8
Lang-14 0.05 0
Lang-17 0.05 0
Lang-18 0.5 0.3
Lang-19 0.05 0.7
Lang-20 0.8 0.4
Lang-21 0.1 0.1
Lang-22 0.55 0.8
Lang-23 1 0.95
Lang-27 0.8 0.75
Lang-28 0.05 0.05
Lang-32 1 1
Lang-33 1 1
Lang-34 1 0.9
Lang-35 1 0.3
Lang-36 1 1
Lang-37 0.65 0.2
Lang-39 1 0.95
Lang-41 0.7 1
Lang-44 0.85 0.65
Lang-45 1 1
Lang-46 0.5 1
Lang-47 0.95 0.9
Lang-49 0.55 0.4
Lang-50 0.3 0.3
Lang-51 0.1 0.05
Lang-52 1 1
Lang-53 0.3 0.15
Lang-54 0.05 0.05
Lang-55 0.05 0
Lang-57 1 1
Lang-58 0 0.05
Lang-59 1 0.95
Lang-60 0.75 0.3
Lang-61 1 0.25
Lang-65 1 0.95
Math-1 1 1
Math-2 0 0.1
Math-3 0.55 1
Math-4 1 1
Math-5 0.45 0.95
Math-6 1 1
Bug ID SBST𝐷𝑃𝐺 SBST𝑛𝑜𝐷𝑃𝐺
Math-9 0.7 0.6
Math-10 0.1 0
Math-11 0.95 1
Math-14 1 1
Math-16 0 0.05
Math-21 0.05 0.45
Math-22 1 1
Math-23 0.95 0.8
Math-24 0.9 0.85
Math-25 0.1 0
Math-26 1 1
Math-27 0.6 0.65
Math-28 0.05 0
Math-29 0.9 1
Math-32 1 1
Math-33 0.45 0.35
Math-35 1 1
Math-36 0.2 0.1
Math-37 1 1
Math-40 1 0.95
Math-41 0.25 0.4
Math-42 0.95 0.95
Math-43 0.45 0.55
Math-45 0 0.3
Math-46 1 1
Math-47 1 0.95
Math-48 0.65 0.75
Math-49 0.8 0.75
Math-50 0.75 0.3
Math-51 0.35 0.25
Math-52 0.65 0.6
Math-53 1 1
Math-55 1 1
Math-56 1 0.9
Math-59 1 1
Math-60 0.95 0.95
Math-61 1 1
Math-63 1 0.4
Math-64 0.05 0
Math-65 0.25 0.25
Math-66 1 1
Math-67 1 1
Math-68 1 1
Math-70 1 1
Math-71 0.6 0.35
Math-72 0.5 0.45
Math-73 0.75 1
Math-75 1 0.9
Math-76 0.15 0.05
Math-77 1 1
Bug ID SBST𝐷𝑃𝐺 SBST𝑛𝑜𝐷𝑃𝐺
Math-78 0.6 0.6
Math-79 0.15 0.05
Math-80 0.3 0
Math-81 0.15 0
Math-83 0.9 1
Math-84 0.15 0
Math-85 1 1
Math-86 0.95 0.85
Math-87 0.95 1
Math-88 0.75 0.7
Math-89 1 1
Math-90 1 1
Math-92 1 1
Math-93 0.35 0.25
Math-94 0.35 0
Math-95 1 1
Math-96 1 1
Math-97 1 1
Math-98 1 0.85
Math-100 1 1
Math-101 0.2 1
Math-102 0.75 0.5
Math-103 1 1
Math-104 0.5 0.4
Math-105 1 1
Math-106 0.15 0
Time-1 1 1
Time-2 0.85 1
Time-3 0.15 0.05
Time-4 0 0.3
Time-5 1 1
Time-6 1 0.8
Time-7 0.15 0
Time-8 1 0.7
Time-9 1 1
Time-10 0.1 0.1
Time-11 1 1
Time-12 1 0.55
Time-13 0.5 0.05
Time-14 0 0.95
Time-15 0.4 0.3
Time-16 0.15 0
Time-17 1 0.55
Time-22 0 0.25
Time-23 0 0.2
Time-24 0 0.45
Time-26 0.1 0.05
Time-27 0.15 0.5
Chart-1 0.2 0.05
Chart-2 0.05 0
Bug ID SBST𝐷𝑃𝐺 SBST𝑛𝑜𝐷𝑃𝐺
Chart-3 0.9 0.15
Chart-4 0.85 0.3
Chart-5 0.35 1
Chart-6 0.8 1
Chart-7 0.3 0.25
Chart-8 1 1
Chart-10 1 1
Chart-11 0.2 1
Chart-12 0.9 0.5
Chart-13 0.9 0.2
Chart-14 1 1
Chart-15 1 0.9
Chart-16 1 1
Chart-17 1 1
Chart-18 1 1
Chart-19 1 0.15
Chart-20 0.5 0.1
Chart-21 0.55 0.05
Chart-22 1 1
Chart-23 1 1
Chart-24 0 1
Mockito-2 1 1
Mockito-17 1 1
Mockito-29 0.85 0.95
Mockito-35 1 1
Closure-6 0.05 0
Closure-7 0.35 0.1
Closure-9 0.6 0.15
Closure-12 0.3 0.1
Closure-19 0 0.1
Closure-21 0.9 0.35
Closure-22 0.5 0.5
Closure-26 0.5 0.4
Closure-27 0.25 0.1
Closure-28 1 1
Closure-30 1 0.95
Closure-33 1 0.5
Closure-34 0.05 0
Closure-39 1 0.6
Closure-41 0.1 0
Closure-43 0.05 0
Closure-46 1 1
Closure-48 0.1 0
Closure-49 0.45 0.5
Closure-52 0.4 0.1
Closure-54 1 0.8
Closure-56 0.95 1
Closure-60 0.1 0
Closure-65 0.9 0.45
Closure-72 0.2 0.3
Bug ID SBST𝐷𝑃𝐺 SBST𝑛𝑜𝐷𝑃𝐺
Closure-73 1 1
Closure-77 0.7 0.25
Closure-78 0.05 0
Closure-79 1 0.85
Closure-80 0.2 0
Closure-81 0.35 0
Closure-82 1 1
Closure-86 0.15 0
Closure-89 0.05 0
Closure-91 0.15 0
Closure-94 0.25 0
Closure-104 0.95 0.5
Closure-106 1 0.95
Closure-108 0.8 0.2
Closure-110 0.95 1
Closure-112 0.1 0
Closure-113 0.25 0.05
Closure-114 0 0.1
Closure-115 0.3 0.25
Closure-116 0.2 0.1
Closure-117 0.4 0.05
Closure-119 0.25 0
Closure-120 0.2 0.1
Closure-121 0.55 0.2
Closure-122 0.05 0
Closure-123 0.15 0.1
Closure-125 0.45 0
Closure-128 0.15 0.1
Closure-129 0.2 0.05
Closure-131 0.15 0.9
Closure-137 0.95 1
Closure-139 0.15 0.05
Closure-140 0.85 0.25
Closure-141 0.3 0
Closure-144 0.3 0.1
Closure-146 0.15 0
Closure-150 0.45 0.1
Closure-151 1 1
Closure-160 0.55 0.05
Closure-164 0.35 0.45
Closure-165 0.95 0.8
Closure-167 0.35 0
Closure-169 0 0.05
Closure-170 0.2 0.2
Closure-171 0.9 0.05
Closure-172 0.65 0.15
Closure-173 1 0.5
Closure-174 1 1
Closure-175 0.75 0.15
Closure-176 0.1 0.1
RQ2. Does SBST𝐷𝑃𝐺 find more unique bugs?To investigate how our approach performs against each bug, we
present an overview of the success rates for each SBST method at
total time budget of 15 seconds per class in Table 3. Success rate is
the ratio of runs where the bug was detected. Due to space limita-
tion, we omit the entries for bugs where none of the approaches
were able to find the bug. We also highlight the bugs that were
detected by only one approach. As can be seen from Table 3, our
approach outperforms the benchmark in terms of the success rates
for most of the bugs.
This observation can be confirmed with the summary of the
results which we report in Table 4. What is particularly interesting
to observe from the more granular representation of the results
in Table 3 is the high number of bugs where our approach has
100% success rate, which means that SBST𝐷𝑃𝐺 finds the respective
Table 4: Summary of the bug finding results at T = 15 ∗ 𝑁 .
Bugs
found
Unique
bugs
Bugs found
in every run
Bugs found
more often
SBST𝐷𝑃𝐺 236 35 84 127SBST𝑛𝑜𝐷𝑃𝐺 215 14 76 47
bugs in all the runs. This is an indication of the robustness of our
approach.
Certain bugs are harder to find than others. Out of the 20 runs
for each SBST approach, if a bug is only detected by one of the
approaches, we call it a unique bug. The reason why we pay special
attention to unique bugs is because they are an indication of the
ASE ’20, September 21–25, 2020, Virtual Event, Australia Anjana Perera, Aldeida Aleti, Marcel Böhme, and Burak Turhan
ability of the testing technique to discover what cannot be discov-
ered otherwise in the given time budget, which is an important
strength [35]. SBST𝐷𝑃𝐺 found 236 bugs altogether, which is 54.38%
of the total bugs, whereas SBST𝑛𝑜𝐷𝑃𝐺 found only 215 (49.54%) bugs.
SBST𝐷𝑃𝐺 found 35 unique bugs that SBST𝑛𝑜𝐷𝑃𝐺 could not find in
any of the runs. On the other hand, SBST𝑛𝑜𝐷𝑃𝐺 found only 14 such
unique bugs. 30 out of these 35 bugs have buggy classes ranked in
the top 10% of the project by Schwa, and the other 5 bugs in 10-50%
of the project. We observe similar results at total time budget of 30
seconds per class as well, where SBST𝐷𝑃𝐺 found 32 unique bugs,
while SBST𝑛𝑜𝐷𝑃𝐺 was only able to find 13 unique bugs.
SBST𝐷𝑃𝐺 found 127 bugs more times than SBST𝑛𝑜𝐷𝑃𝐺 , while
for SBST𝑛𝑜𝐷𝑃𝐺 , this is only 47. 92 out of these 127 bugs have buggy
classes ranked in the top 10% of the project and the other 35 bugs
in 10-50% of the project.
If we consider a bug as found only if all the runs by an approach
find the bug (success rate = 1.00), then the number of bugs found
by SBST𝐷𝑃𝐺 and SBST𝑛𝑜𝐷𝑃𝐺 become 84 and 76. There are 27 bugs
which only SBST𝐷𝑃𝐺 detected them in all of the runs.
In summary, SBST𝐷𝑃𝐺 finds 35 more unique bugs com-
pared to the benchmark approach. Furthermore, it finds
a large number of bugs more frequently than the base-
line. Thus, this suggests that the superior performance of
SBST𝐷𝑃𝐺 is supported by both its capability of finding
new bugs which are not exposed by the baseline and the
robustness of the approach.
We pick Math-94 and Time-8 bugs and investigate the tests
generated by the 2 approaches. Figure 7a shows the buggy code
snippet of MathUtils class from Math-94. The if condition at
line 412 is placed to check if either u or v is zero. This is a classicexample of a bug due to an integer overflow. Assume the method
is called with the following inputs MathUtils.𝑔𝑐𝑑(1073741824,1032). Then, the if condition at line 412 is expected to be evaluatedto false since both u(1073741824) and v(1032) are non-zeros.
However, the multiplication of u and v causes an integer overflow
to zero, and the if condition at line 412 is evaluated to true. Figure7b shows the same code snippet of MathUtils class after the patch
is applied. To detect this bug, a test should not only cover the truebranch of the if condition at line 412, but also pass the non-zero
arguments u and v such that their multiplication causes an integer
overflow to zero.
The fitness function for the true branch of the if condition at
line 412 is 𝑢 ∗ 𝑣/(𝑢 ∗ 𝑣 + 1), and it tends to reward the test inputs
u and v whose multiplication is closer to zero more than the ones
whose multiplication is closer to causing an integer overflow to zero.
For an example, suppose we have two individuals 𝑢 = 2, 𝑣 = 3 and
𝑢 = 12085, 𝑣 = 1241 in the current generation. The fitness of the first
and second individualswill be 6/(6+1) and 14997485/(14997485+1).Thus, the first individual is considered fitter when compared with
the second one, while the second one is closer to detect the bug
than the first one. Therefore in a situation like this, we can increase
the chances of detecting the bug by allowing the search method
to extensively explore the search space of possible test inputs and
generate more than one test case (test inputs) for such branches.
SBST𝑛𝑜𝐷𝑃𝐺 generated 30.75 test cases on average that cover the
true branch of the if condition at line 412, yet it was not able to
detect the bug in any of the runs. Schwa ranked Math-94 bug in the
top 10% of the project and BADS allocated 37 seconds time budget
to the search. Then, SBST𝐷𝑃𝐺 generated 49.8 test cases on average
that cover the said branch. As a result, it was able to find the bug
in 7 runs out of 20. Allocating a higher time budget increases the
likelihood of detecting the bug since it allows the search method to
explore the search space extensively to find the test inputs that can
detect the bug.
411 public static int gcd(int u, int v) {
412 if (u * v == 0) {
413 return (Math.abs(u) + Math.abs(v));
414 }
415 ...
416 }
(a) Buggy code
411 public static int gcd(int u, int v) {
412 if ((u == 0) || (v == 0)) {
413 return (Math.abs(u) + Math.abs(v));
414 }
415 ...
416 }
(b) Fixed code
Figure 7: MathUtils class from Math-94
Figure 8a shows the buggy code snippet of DateTimeZone class
from Time-8. The forOffsetHoursMinutes method takes two in-
teger inputs hoursOffset and minutesOffset, and returns the
DateTimeZone object for the offset specified by the two inputs.
If the method forOffsetHoursMinutes is called with the inputs
hoursOffset=0 and minutesOffset=-15, then it is expected to
return a DateTimeZone object for the offset −00 : 15. However, theif condition at line 279 is evaluated to true and the method throws
an IllegalArgumentException instead. Figure 8b shows the same
code snippet after the patch is applied. To detect this bug, a test
case has to execute the if conditions at lines 273 and 276 to false;that is hoursOffset ≠ 0 or minutesOffset ≠ 0 and hoursOffset∈ [−23, 23], and then it has to execute the if condition at line 279
to true with a minutesOffset ∈ [−59,−1]. Moreover, there is a
new condition introduced at line 282 in the fixed code to check if
the hoursOffset is positive when the minutesOffset is negative
(see Figure 8b). Thus, this adds another constraint to the possible
test inputs that can detect the bug, which is hoursOffset ≤ 0.
Therefore, it is evident that it is hard not only to find the right test
inputs to detect the bug, but also to find test inputs to at least cover
the buggy code.
As it was the case in Math-94, just covering the buggy code (truebranch of the if condition at line 279) is not sufficient to detect
the Time-8 bug. For an example, test inputs hoursOffset=-4 andminutesOffset=-150 cover the buggy code, however they cannot
detect the bug. Therefore, the search method needs more resources
to generate more test cases that cover the buggy code such that it
eventually finds the right test cases that can detect the bug.
Our investigation into the tests generated by the 2 approaches
shows that the baseline, SBST𝑛𝑜𝐷𝑃𝐺 , covered the buggy code in
90% of the runs. SBST𝑛𝑜𝐷𝑃𝐺 generated 25.78 test cases on average
that cover the buggy code and it was able to detect the bug in 14
runs out of 20. Whereas, SBST𝐷𝑃𝐺 allocated 75 seconds time budget
to the search as Schwa ranked the bug in the top 10% of the project
and generated 109.8 test cases on average that cover the buggy
code. As a result, it was able to detect the bug in all of the runs
(success rate = 1.00). Therefore, this again confirms the importance

Defect Prediction Guided Search-Based Software Testing ASE ’20, September 21–25, 2020, Virtual Event, Australia
272 public static DateTimeZone forOffsetHoursMinutes(int hoursOffset , int
minutesOffset) throws IllegalArgumentException {
273 if (hoursOffset == 0 && minutesOffset == 0) {
274 return DateTimeZone.UTC;
275 }
276 if (hoursOffset < -23 || hoursOffset > 23) {
277 throw new IllegalArgumentException("Hours out of range: " + hoursOffset);
278 }
279 if (minutesOffset < 0 || minutesOffset > 59) {
280 throw new IllegalArgumentException("Minutes out of range: " + minutesOffset);
281 }
282 int offset = 0;
283 ...
284 }
(a) Buggy code272 public static DateTimeZone forOffsetHoursMinutes(int hoursOffset , int
minutesOffset) throws IllegalArgumentException {
273 if (hoursOffset == 0 && minutesOffset == 0) {
274 return DateTimeZone.UTC;
275 }
276 if (hoursOffset < -23 || hoursOffset > 23) {
277 throw new IllegalArgumentException("Hours out of range: " + hoursOffset);
278 }
279 if (minutesOffset < -59 || minutesOffset > 59) {
280 throw new IllegalArgumentException("Minutes out of range: " + minutesOffset);
281 }
282 if (hoursOffset > 0 && minutesOffset < 0) {
283 throw new IllegalArgumentException("Positive hours must not have negative
minutes: " + minutesOffset);
284 }
285 int offset = 0;
286 ...
287 }
(b) Fixed code
Figure 8: DateTimeZone class from Time-8
of focusing the search more into the buggy classes to increase the
likelihood of detecting the bug.
6 THREATS TO VALIDITYInternal Validity.As outlined in Section 4.4.2, we configure𝐷𝑦𝑛𝑎-𝑀𝑂𝑆𝐴 to generate more than one test case for each target in the
SUT, retain all these test cases and disable test suite minimisation.
By doing this, we expect to compromise the test suite size in order
to maximise the bug detection of SBST. To investigate the bene-
fit of configuring 𝐷𝑦𝑛𝑎𝑀𝑂𝑆𝐴 in this way, we also run the same
set of experiments using 𝐷𝑦𝑛𝑎𝑀𝑂𝑆𝐴 with test suite minimisation
and equal budget allocation, SBST𝑂 . We compare its performance
against SBST𝑛𝑜𝐷𝑃𝐺 . SBST𝑂 finds 85.75 and 93.45 bugs on average
at total time budget of 15 and 30 seconds per class. SBST𝑛𝑜𝐷𝑃𝐺 out-
performs SBST𝑂 with an average improvement of 48.2 (+56.2%) and
73.45 (+78.6%) more bugs in each case, which are statistically sig-
nificant according to the Mann-Whitney U-Test (p-value < 0.0001)
with a large effect size (𝐴12 = 1.00). However, this huge improve-
ment comes with a price, i.e., SBST𝑛𝑜𝐷𝑃𝐺 produces large test suites.
This can be problematic if the developers have to insert the test
oracles manually to the generated tests. Thus, we identify this as
a potential threat to internal validity and future works need to be
done on adapting appropriate test suite minimisation techniques
to SBST𝐷𝑃𝐺 .
To encounter the randomised nature of GA used in 𝐷𝑦𝑛𝑎𝑀𝑂𝑆𝐴,
we run the experiments for 20 times and carry out sound statistical
tests; two-tailed non-parametric Mann-Whitney U-Test [5] and
Vargha and Delaney’s 𝐴12 statistic [60].
The parameter configurations for Schwa and BADS are either
the default values or based on the results of the pilot runs. We
believe the performance of SBST𝐷𝑃𝐺 can be further improved by
fine-tuning the parameters of Schwa and BADS.
We employ an exponential function to allocate time budgets for
classes based on the defect scores. As opposed to an exponential
allocation, a direct mapping (i.e., linear budget allocation) would
have been simple and straight-forward. However, as described in
Section 3.2.1, there are only a few number of classes which are
actually buggy (i.e., highly likely to be defective) and they need to
be allocated more time budget to maximise the bug detection of the
test generation tool. Thus, we believe a linear allocation approach
is not able to largely favour these small number of classes like the
exponential allocation approach does.
External Validity.We use 434 real bugs from Defects4J dataset
that are drawn from 6 open source projects. These projects may
not represent all program characteristics; especially in industrial
projects. Although, Defects4J has been widely used in the literature
[41, 54, 55, 59] as a benchmark. Future work needs to be done on
applying SBST𝐷𝑃𝐺 on other bugs datasets.
EvoSuite generates JUnit test suites for Java programs. Thus, we
may not be able to generalise the conclusions to other programming
languages. However, the concept we introduced in this research is
not language dependent and can be applied to other programming
languages as well.
7 CONCLUSIONWe introduce defect prediction guided SBST (SBST𝐷𝑃𝐺 ) that com-
bines class level defect prediction and Search-Based Software Test-
ing to efficiently find bugs in a resource constrained environment.
SBST𝐷𝑃𝐺 employs a budget allocation algorithm, Budget Allocation
Based on Defect Scores (BADS), to allocate time budgets for classes
based on their likelihood of defectiveness. We validate our approach
against 434 real bugs from Defects4J dataset. Our empirical eval-
uation demonstrates that in a resource constrained environment,
when given a tight time budget, SBST𝐷𝑃𝐺 is significantly more
efficient than the state of the art approach with a large effect size.
In particular, SBST𝐷𝑃𝐺 finds 13.1% more bugs on average compared
to the state of the art SBST approach when they are given a tight
time budget of 15 seconds per class. Further analysis of the re-
sults finds that the superior performance of SBST𝐷𝑃𝐺 is supported
by its ability to find more unique bugs which otherwise remain
undetected.
We aim to extend our work in the following directions as future
work; i) employ a defect predictor which uses different features to
produce predictions, ii) adapt an appropriate test suite minimisation
strategy to address the generation of larger test suites, and iii)
validate SBST𝐷𝑃𝐺 against other bugs datasets.
ACKNOWLEDGEMENTSThis work was partially funded by the Australian Research Coun-
cil (ARC) through a Discovery Early Career Researcher Award
(DE190100046).
ASE ’20, September 21–25, 2020, Virtual Event, Australia Anjana Perera, Aldeida Aleti, Marcel Böhme, and Burak Turhan
REFERENCES[1] Aldeida Aleti and Lars Grunske. 2015. Test data generation with a Kalman filter-
based adaptive genetic algorithm. Journal of Systems and Software 103 (2015),343–352.
[2] Aldeida Aleti, Irene Moser, and Lars Grunske. 2017. Analysing the fitness land-
scape of search-based software testing problems. Automated Software Engineering24, 3 (2017), 603–621.
[3] M Moein Almasi, Hadi Hemmati, Gordon Fraser, Andrea Arcuri, and Janis Bene-
felds. 2017. An industrial evaluation of unit test generation: Finding real faults
in a financial application. In Proceedings of the 39th International Conference onSoftware Engineering: Software Engineering in Practice Track. IEEE Press, 263–272.
[4] Nadia Alshahwan, Xinbo Gao, Mark Harman, Yue Jia, Ke Mao, Alexander Mols,
Taijin Tei, and Ilya Zorin. 2018. Deploying search based software engineering
with Sapienz at Facebook. In International Symposium on Search Based SoftwareEngineering. Springer, 3–45.
[5] Andrea Arcuri and Lionel Briand. 2014. A Hitchhiker’s guide to statistical tests
for assessing randomized algorithms in software engineering. Software Testing,Verification and Reliability 24, 3 (2014), 219–250.
[6] Andrea Arcuri, José Campos, and Gordon Fraser. 2016. Unit test generation
during software development: Evosuite plugins for maven, intellij and jenkins. In
2016 IEEE International Conference on Software Testing, Verification and Validation(ICST). IEEE, 401–408.
[7] Andrea Arcuri and Gordon Fraser. 2013. Parameter tuning or default values? An
empirical investigation in search-based software engineering. Empirical SoftwareEngineering 18, 3 (2013), 594–623.
[8] Victor R Basili, Lionel C. Briand, and Walcélio L Melo. 1996. A validation of
object-oriented design metrics as quality indicators. IEEE Transactions on softwareengineering 22, 10 (1996), 751–761.
[9] Manfred Broy, Ingolf H Kruger, Alexander Pretschner, and Christian Salzmann.
2007. Engineering automotive software. Proc. IEEE 95, 2 (2007), 356–373.
[10] Bora Caglayan, Burak Turhan, Ayse Bener, Mayy Habayeb, Andriy Miransky,
and Enzo Cialini. 2015. Merits of organizational metrics in defect prediction:
an industrial replication. In Proceedings of the 37th International Conference onSoftware Engineering-Volume 2. IEEE Press, 89–98.
[11] José Campos, Andrea Arcuri, Gordon Fraser, and Rui Abreu. 2014. Continuous test
generation: enhancing continuous integration with automated test generation. In
Proceedings of the 29th ACM/IEEE international conference on Automated softwareengineering. ACM, 55–66.
[12] José Campos, Annibale Panichella, and Gordon Fraser. 2019. EvoSuiTE at the
SBST 2019 tool competition. In Proceedings of the 12th International Workshop onSearch-Based Software Testing. IEEE Press, 29–32.
[13] Hoa Khanh Dam, Trang Pham, Shien Wee Ng, Truyen Tran, John Grundy, Aditya
Ghose, Taeksu Kim, and Chul-Joo Kim. 2019. Lessons learned from using a deep
tree-based model for software defect prediction in practice. In Proceedings of the16th International Conference on Mining Software Repositories. IEEE Press, 46–57.
[14] Paulo André Faria de Freitas. 2015. Software Repository Mining Analytics to
Estimate Software Component Reliability. (2015).
[15] EvoSuite. 2019. EvoSuite - automated generation of JUnit test suites for Java
classes. https://github.com/EvoSuite/evosuite Last accessed on: 29/11/2019.
[16] The Apache Software Foundation. 2019. Apache Commons Math. https:
//github.com/apache/commons-math Last accessed on: 19/09/2019.
[17] Martin Fowler and Matthew Foemmel. 2006. Continuous integration.
[18] Gordon Fraser. 2018. EvoSuite - Automatic Test Suite Generation for Java. http:
//www.evosuite.org/ Last accessed on: 19/09/2019.
[19] Gordon Fraser and Andrea Arcuri. 2011. Evolutionary generation of whole test
suites. In 2011 11th International Conference on Quality Software. IEEE, 31–40.[20] Gordon Fraser and Andrea Arcuri. 2012. Whole test suite generation. IEEE
Transactions on Software Engineering 39, 2 (2012), 276–291.
[21] G. Fraser and A. Arcuri. 2013. EvoSuite at the SBST 2013 Tool Competition.
In 2013 IEEE Sixth International Conference on Software Testing, Verification andValidation Workshops. 406–409. https://doi.org/10.1109/ICSTW.2013.53
[22] Gordon Fraser and Andrea Arcuri. 2014. EvoSuite at the Second Unit Testing
Tool Competition. In Future Internet Testing, Tanja E.J. Vos, Kiran Lakhotia, and
Sebastian Bauersfeld (Eds.). Springer International Publishing, Cham, 95–100.
[23] Gordon Fraser and Andrea Arcuri. 2014. A large-scale evaluation of automated
unit test generation using evosuite. ACM Transactions on Software Engineeringand Methodology (TOSEM) 24, 2 (2014), 8.
[24] Gordon Fraser and Andrea Arcuri. 2015. 1600 faults in 100 projects: automatically
finding faults while achieving high coverage with evosuite. Empirical SoftwareEngineering 20, 3 (2015), 611–639.
[25] Gordon Fraser and Andrea Arcuri. 2016. EvoSuite at the SBST 2016 tool compe-
tition. In 2016 IEEE/ACM 9th International Workshop on Search-Based SoftwareTesting (SBST). IEEE, 33–36.
[26] Gordon Fraser, José Miguel Rojas, and Andrea Arcuri. 2018. Evosuite at the
SBST 2018 Tool Competition. In Proceedings of the 11th International Workshopon Search-Based Software Testing (SBST ’18). ACM, New York, NY, USA, 34–37.
https://doi.org/10.1145/3194718.3194729
[27] Gordon Fraser, José Miguel Rojas, José Campos, and Andrea Arcuri. 2017. Evo-
Suite at the SBST 2017 Tool Competition. In Proceedings of the 10th InternationalWorkshop on Search-Based Software Testing (SBST ’17). IEEE Press, Piscataway,
NJ, USA, 39–41. https://doi.org/10.1109/SBST.2017..6
[28] Gordon Fraser, Matt Staats, Phil McMinn, Andrea Arcuri, and Frank Padberg.
2013. Does automated white-box test generation really help software testers?. In
Proceedings of the 2013 International Symposium on Software Testing and Analysis.ACM, 291–301.
[29] Andre Freitas. 2015. Schwa. https://pypi.org/project/Schwa Last accessed on
16/09/2019.
[30] André Freitas. 2015. schwa. https://github.com/andrefreitas/schwa Last accessed
on 16/09/2019.
[31] Gregory Gay. 2017. Generating effective test suites by combining coverage criteria.
In International Symposium on Search Based Software Engineering. Springer, 65–82.
[32] Emanuel Giger, Marco D’Ambros, Martin Pinzger, and Harald C Gall. 2012.
Method-level bug prediction. In Proceedings of the 2012 ACM-IEEE InternationalSymposium on Empirical Software Engineering and Measurement. IEEE, 171–180.
[33] Git. 2019. Git. https://git-scm.com Last accessed on: 19/09/2019.
[34] Todd L Graves, Alan F Karr, James S Marron, and Harvey Siy. 2000. Predicting
fault incidence using software change history. IEEE Transactions on softwareengineering 26, 7 (2000), 653–661.
[35] Andrew Habib and Michael Pradel. 2018. How many of all bugs do we find? a
study of static bug detectors. In Proceedings of the 33rd ACM/IEEE InternationalConference on Automated Software Engineering. 317–328.
[36] Mark Harman, Yue Jia, and Yuanyuan Zhang. 2015. Achievements, open problems
and challenges for search based software testing. In 2015 IEEE 8th InternationalConference on Software Testing, Verification and Validation (ICST). IEEE, 1–12.
[37] Hideaki Hata, Osamu Mizuno, and Tohru Kikuno. 2012. Bug prediction based on
fine-grained module histories. In 2012 34th international conference on softwareengineering (ICSE). IEEE, 200–210.
[38] Rene Just. 2019. Defects4J - A Database of Real Faults and an Experimental In-
frastructure to Enable Controlled Experiments in Software Engineering Research.
https://github.com/rjust/defects4j Last accessed on: 02/10/2019.
[39] René Just, Darioush Jalali, and Michael D Ernst. 2014. Defects4J: A database of
existing faults to enable controlled testing studies for Java programs. In Proceed-ings of the 2014 International Symposium on Software Testing and Analysis. ACM,
437–440.
[40] Sunghun Kim, Thomas Zimmermann, E James Whitehead Jr, and Andreas Zeller.
2007. Predicting faults from cached history. In Proceedings of the 29th internationalconference on Software Engineering. IEEE Computer Society, 489–498.
[41] Xuan Bach D Le, David Lo, and Claire Le Goues. 2016. History driven program
repair. In 2016 IEEE 23rd International Conference on Software Analysis, Evolution,and Reengineering (SANER), Vol. 1. IEEE, 213–224.
[42] Chris Lewis, Zhongpeng Lin, Caitlin Sadowski, Xiaoyan Zhu, Rong Ou, and
E James Whitehead Jr. 2013. Does bug prediction support human developers?
findings from a google case study. In Proceedings of the 2013 International Confer-ence on Software Engineering. IEEE Press, 372–381.
[43] Chris Lewis and Rong Ou. 2011. Bug Prediction at Google. http://google-
engtools.blogspot.com/2011/12/ Last accessed on: 16/09/2019.
[44] KeMao, Mark Harman, and Yue Jia. 2016. Sapienz: Multi-objective automated test-
ing for Android applications. In Proceedings of the 25th International Symposiumon Software Testing and Analysis. 94–105.
[45] Tim Menzies, Jeremy Greenwald, and Art Frank. 2006. Data mining static code
attributes to learn defect predictors. IEEE transactions on software engineering 33,
1 (2006), 2–13.
[46] Nachiappan Nagappan and Thomas Ball. 2005. Use of relative code churn mea-
sures to predict system defect density. In Proceedings of the 27th internationalconference on Software engineering. ACM, 284–292.
[47] Nachiappan Nagappan, BrendanMurphy, and Victor Basili. 2008. The influence of
organizational structure on software quality. In 2008 ACM/IEEE 30th InternationalConference on Software Engineering. IEEE, 521–530.
[48] Nachiappan Nagappan, Andreas Zeller, Thomas Zimmermann, Kim Herzig, and
Brendan Murphy. 2010. Change bursts as defect predictors. In 2010 IEEE 21stInternational Symposium on Software Reliability Engineering. IEEE, 309–318.
[49] Carlos Oliveira, Aldeida Aleti, Lars Grunske, and Kate Smith-Miles. 2018. Map-
ping the effectiveness of automated test suite generation techniques. IEEE Trans-actions on Reliability 67, 3 (2018), 771–785.
[50] Carlos Oliveira, Aldeida Aleti, Yuan-Fang Li, and Mohamed Abdelrazek. 2019.
Footprints of Fitness Functions in Search-Based Software Testing. In Proceedingsof the Genetic and Evolutionary Computation Conference (GECCO ’19). Associationfor Computing Machinery, 1399–1407. https://doi.org/10.1145/3321707.3321880
[51] Annibale Panichella, Fitsum Meshesha Kifetew, and Paolo Tonella. 2015. Refor-
mulating branch coverage as a many-objective optimization problem. In 2015IEEE 8th international conference on software testing, verification and validation(ICST). IEEE, 1–10.
[52] Annibale Panichella, Fitsum Meshesha Kifetew, and Paolo Tonella. 2017. Au-
tomated test case generation as a many-objective optimisation problem with

Defect Prediction Guided Search-Based Software Testing ASE ’20, September 21–25, 2020, Virtual Event, Australia
dynamic selection of the targets. IEEE Transactions on Software Engineering 44, 2
(2017), 122–158.
[53] Annibale Panichella, Fitsum Meshesha Kifetew, and Paolo Tonella. 2018. A large
scale empirical comparison of state-of-the-art search-based test case generators.
Information and Software Technology 104 (2018), 236–256.
[54] David Paterson, Jose Campos, Rui Abreu, GregoryMKapfhammer, Gordon Fraser,
and Phil McMinn. 2019. An Empirical Study on the Use of Defect Prediction
for Test Case Prioritization. In 2019 12th IEEE Conference on Software Testing,Validation and Verification (ICST). IEEE, 346–357.
[55] Spencer Pearson, José Campos, René Just, Gordon Fraser, Rui Abreu, Michael D
Ernst, Deric Pang, and Benjamin Keller. 2017. Evaluating and improving fault
localization. In Proceedings of the 39th International Conference on Software Engi-neering. IEEE Press, 609–620.
[56] Foyzur Rahman, Daryl Posnett, Abram Hindle, Earl Barr, and Premkumar De-
vanbu. 2011. BugCache for inspections: hit or miss?. In Proceedings of the 19thACM SIGSOFT symposium and the 13th European conference on Foundations ofsoftware engineering. ACM, 322–331.
[57] José Miguel Rojas, Mattia Vivanti, Andrea Arcuri, and Gordon Fraser. 2017. A
detailed investigation of the effectiveness of whole test suite generation. EmpiricalSoftware Engineering 22, 2 (2017), 852–893.
[58] Urko Rueda, Tanja EJ Vos, and ISWB Prasetya. 2015. Unit Testing Tool
Competition–Round Three. In 2015 IEEE/ACM 8th International Workshop onSearch-Based Software Testing. IEEE, 19–24.
[59] Sina Shamshiri, Rene Just, Jose Miguel Rojas, Gordon Fraser, Phil McMinn, and
Andrea Arcuri. 2015. Do automatically generated unit tests find real faults?
an empirical study of effectiveness and challenges (t). In 2015 30th IEEE/ACMInternational Conference on Automated Software Engineering (ASE). IEEE, 201–211.
[60] András Vargha and Harold D Delaney. 2000. A critique and improvement of
the CL common language effect size statistics of McGraw and Wong. Journal ofEducational and Behavioral Statistics 25, 2 (2000), 101–132.
[61] Thomas Zimmermann, Rahul Premraj, and Andreas Zeller. 2007. Predicting
defects for eclipse. In Third International Workshop on Predictor Models in SoftwareEngineering (PROMISE’07: ICSE Workshops 2007). IEEE, 9–9.