Embed Size (px)
Citation preview
1
Declaration
I hereby declare that this submission is my own work and that, to the best
of my knowledge and belief, it contains no material previously published or
written by another person nor material which to a substantial extent has
been accepted for the award of any other degree or diploma of the
University or other institute of higher learning, except where due
acknowledgment has been made in the text.
December 30th, 2013
Pietro Antonello Rinaldi
A copy of the thesis will be available at
http://www.dispaa.unifi.it/mdswitch.html
Dichiarazione
Con la presente affermo che questa tesi è frutto del mio lavoro e che, per
quanto io ne sia a conoscenza, non contiene materiale precedentemente
pubblicato o scritto da altra persona né materiale che è stato utilizzato per
l’ottenimento di qualunque altro titolo o diploma dell’Università o altro
istituto di apprendimento, a eccezione del caso in cui ciò venga
riconosciuto nel testo
30 dicembre 2013
Pietro Antonello Rinaldi
Una copia della tesi sarà disponibile presso DISPAA, sez. Patologia Vegetale ed
Entomologia.
http://www.dispaa.unifi.it/mdswitch.html
2
TABLE OF CONTENTS
Riassunto 5
Summary 7
Chapter 1. The pathogen 9
1.1 Taxonomy and nomenclature: Phyllosticta ampelicida or Guignardia
bidwellii?
11
1.2 Morphological characteristics of the fungus 12
1.3 Symptoms of the disease 14
1.4 Cycle and epidemiology 19
1.4a Ascocarp ontogeny 20
1.4b Stages of pycnidia development and infection 20
1.5 Conidic infection process 21
1.6 Phytotoxic metabolites 24
1.7 Control 26
1.7.1 Cultural practices in the control of black rot 26
1.7.2 Chemical control of black rot 27
References 30
Chapter 2. Genetic variability of Phyllosticta ampelicida (syn. Guignardia
bidwellii), the agent of Black rot disease of grapevine
35
Abstract 37
1 Introduction 37
3
2 Materials and methods 40
2.1 Phyllosticta ampelicida isolation and DNA extraction for phylogenetic analysis 40
2.2 DNA extraction for the nuclear microsatellites (nSSR) analyses 41
3 Results 44
3.1 ITS Neighbor joining tree 44
3.2 -tubulin Neighbor-Joining tree 45
3.3 Calmodulin Neighbor-Joining tree 45
3.4 Multi locus Neighbor-Joining tree 46
3.5 Genetic variability as revealed using nuclear microsatellites (nSSR) 47
4 Discussion 48
References 67
Chapter 3. Genetic variability and atypical symptoms development in
black rot of grapevine: a case study in a Tuscan vineyard
70
Abstract 72
1 Introduction 73
2 Materials and methods 75
2.1 Study site and symptomatic sample collection for nuclear microsatellite
analysis (2011 growth season)
75
2.2 Analysis of the spatial genetic structure of the pathogen population 75
2.3 Tissue sampling and pathogen identification 77
4
2.4 Field surveys on disease symptoms (2012 growth season) - Clusters with
uncertain symptoms
77
2.5 Molecular analysis on berries with uncertain symptoms (2012 growth season)
78
3 Results 79
3.1 Microsatellite analysis of the P. ampelicida population (2011 growth
season)
79
3.2 Tissue sampling and pathogen identification (2012 growth season) 82
3.3 Field surveys on disease symptoms (2012 growth season) - Clusters with
uncertain symptoms
83
3.4 Molecular analyses on the clusters with uncertain symptoms (2012
growth season)
85
4 Discussion 86
References 90
Ringraziamenti 93
5
RIASSUNTO
Parole chiave
Marciume nero, Regione ITS1-ITS2, tubulina, calmodulina, microsatelliti nucleari,
variabilità genetica, sintomi atipici.
Scopo: Lo scopo di questo studio è stato quello di valutare la variabilità genetica di
Phyllosticta ampelicida e di attribuire i sintomi atipici della malattia su grappolo, di
aspetto molto simile a quelli imputabili ad altri patogeni della vite, al vero agente
causale.
Metodi e risultati. Lo studio della variabilità genetica del fungo Phyllosticta
ampelicida, è stato effettuato realizzando una collezione di isolati del fungo, da
materiale infetto rappresentato prevalentemente da acini mummificati provenienti
dal Nord America, dalle principali aree viticole Europee e da tutte le regioni italiane
dove la malattia è presente. Sono stati così raccolti 46 ceppi del patogeno. Da essi è
stato estratto il DNA e confrontate le sequenze parziali della regione ITS1-ITS2, e dei
geni -tubulina e calmodulina. Ne è risultato che la maggior parte dei ceppi appartiene
a due cluster ben definiti. La distanza genetica che intercorre tra il patogeno isolato da
piante del genere Vitis e quello da Parthenocissus è tale da confermare l’ipotesi
avanzata in altri studi che quella che era semplicemente definita Phyllostica
ampelicida è una “specie complessa” all’interno della quale si stanno distinguendo
due, forse 3 specie diverse.
L’analisi dei microsatelliti nucleari (nSSR) messi a punto presso i Laboratori dell’ETH
Plant Pathology, Institute of Integrative Biology di Zurigo, è stata realizzata sul DNA del
fungo estratto da 421 campioni di materiale infetto, provenienti dalle aree prima
citate. I risultati ottenuti hanno permesso di individuare 56 aplotipi diversi nelle
popolazioni americana, francese e toscana, ovvero in quelle con la più elevata
variabilità genetica. Gli aplotipi toscani sono risultati quelli più simili geneticamente
agli aplotipi americani.
L’analisi con gli nSSR per valutare la presenza di Plasmopara viticola e Phyllosticta
ampelicida nel DNA estratto da grappoli con sintomi atipici, ha confermato come in
ambienti con clima di tipo mediterraneo, il marciume nero della vite, o black rot, possa
comparire con sintomi diversi da quelli riscontrati in ambienti con climi più freschi ed
umidi, con la completa assenza delle tipiche fruttificazioni picnidiche.
6
Conclusioni: Sebbene il fungo sia presente in Europa fin dal 1885, è solo di recente che
si sono notati improvvisi attacchi del patogeno con perdite di produzione. L’ipotesi
dell’evoluzione di nuovi ceppi più virulenti può essere in accordo con la variabilità
genetica del fungo evidenziata dal presente studio. Recenti forti attacchi della malattia
e una sua vasta diffusione in Europa sono stati osservati in Portogallo, Toscana, in
Sardegna a partire dal 2010. Gli aplotipi i riscontrati in queste ultime due aree sono
quelli geneticamente più vicini a quelli provenienti dal Nord America, luogo di origine
del patogeno. Si è inoltre provato che i sintomi della malattia possono essere confusi
con quelli provocati da altri patogeni, aspetto che è in questi ambienti piuttosto
frequente. L’errata diagnosi e le conseguenti errate strategie di lotta possono
contribuire a provocare l’aumento dell’inoculo del patogeno che nel tempo causa le
improvvise esplosioni della malattia.
Significato e impatto dello studio. Questa ricerca affronta aspetti importanti nella
conoscenza di un patogeno di crescente importanza sulla vite e che è stato poco
studiato in Europa. Lo studio della variabilità della popolazione di P. ampelicida a
livello Europeo (in riferimento anche a quella Nord Americana) e a livello locale
all’interno di un singolo vigneto, è stato realizzato mediante l’impiego congiunto di
nSSR e del confronto di sequenze parziali della regione ITS1-ITS2, e dei geni -tubulina
e calmodulina. I risultati ottenuti dimostrano che gli aplotipi americani formano un
gruppo diverso da quelli europei e che quelli intermedi tra loro sono stati trovati in un
ambiente con clima di tipo mediterraneo in cui il patogeno, pur presente fin dalla fine
del 19° secolo, solo dal 2010, ha fatto registrare improvvise epidemie della malattia. Lo
studio offre strumenti per valutare future prospettive sulle possibili evoluzioni del
patogeno quali lo sviluppo di nuovi ceppi più adattabili alle differenti condizioni
ambientali che caratterizzano le nuove aree di diffusione nel sud dell’Europa. Il lavoro
contribuisce inoltre, tramite l’applicazione di tecniche di biologia molecolare, alla
caratterizzazione di sintomi della malattia precedentemente non descritti in quanto
non comuni in ambienti con clima fresco umido.
7
SUMMARY
Keywords
Black rot, ITS1 - ITS2 region, - tubulin, calmodulin, nuclear microsatellites, genetic
variability, atypical symptoms .
Aims: The purpose of this study is to evaluate the genetic variability of Phyllosticta
ampelicida and to assign the atypical symptoms of the disease on grape bunches, very
similar to those ascribed to other pathogens of grapevine, to the real causal agent.
Methods and results: The study of the genetic variability of the fungus Phyllosticta
ampelicida, was carried out on 46 strains of the pathogen. The strains were obtained
by isolating from infected material - mainly mummified berries from North America,
the major European wine-growing areas and from all Italian regions where the disease
is present. From them DNA was extracted and the partial sequences of ITS1 - ITS2
region, and - tubulin and calmodulin genes were compared. The main part of the
strains grouped in two clusters. The genetic distance recorded between the pathogen
isolated on plants of the genus Vitis and Parthenocissus confirmed the hypothesis
advanced in other studies that what was simply called Phyllostica ampelicida is infact a
“species complex”.
The analysis of nuclear microsatellite (nSSR) developed in the laboratories of ETH Plant
Pathology , Institute of Integrative Biology, Zurich, was carried out on the fungal DNA
extracted from 421 samples of infected samples, collected in all wine-growing areas of
North America and in Europe. Fifty six different haplotypes were identified. The
American, French, Tuscan populations, were the ones with the highest genetic
variability. On the other hand the Tuscan haplotypes were the ones closer to the
American ones.
In order to check the presence of Plasmopara viticola and/or Phyllosticta ampelicida
DNA extracted from clusters with atypical symptoms were analysed by nSSR. The
results obtained confirmed that in environments with Mediterranean-type climate,
black rot disease may occur with symptoms that differ from those found in areas with
more fresh and humid climate.
Conclusions. Although the fungus is present in Europe since 1885, only recently
sudden outbreaks of the disease with severe economic losses were observed also in
South European areas with a Mediterranean climate. The genetic variability of the
population of the pathogen detected in the present study allows to hypothesize the
evolution of new virulent strains. Actually, the latest outbreaks of the disease in
8
Europe were observed in Tuscany (where for the first time the disease had been
reported in Italy in 1891), in Sardinia and in Portugal, starting from 2010. Haplotypes
found here are genetically closer to those from North America, the origin site of the
pathogen. The possibility that the disease symptoms are confused with those caused
by other pathogens is also frequent and it was sconfirmed to be possible in this paper.
The incorrect diagnosis and subsequent incorrect control strategies may result in an
increase of the pathogen inoculum causing sudden bursts of the disease.
Significance and Impact of the Study: This research adds relevant informations in the
knowledge of a pathogen that is gaining an increasing importance on grapevine and
which was not very much studied in Europe. The study of the genetic variability of the
European population of P. ampelicida (with reference to the North American one) and
of a local population at a vineyard level was carried out through the combined use of
nSSR and comparison of partial sequences of the ITS1 - ITS2 region, and -tubulin and
calmodulin genes. The data obtained show that the American haplotypes form a group
different from the European ones and those intermediate between them were found
in areas with a Mediterranean climate in which the pathogen, despite having been
present since the end of the 19th century, only since 2010 caused sudden outbreaks of
the disease. The study carried out gives tools to evaluate future perspectives on the
evolution of the pathogen in the future, such as the possible development of new
strains more adaptable to the different southern European environment. Furthermore
the molecular techniques applied in this research work allowed to characterize some
unusual symptoms, which had not been described previously as not common in
environments with a cool and wet climate.

9
Chapter 1
THE PATHOGEN
______________________________________________________________________

10
11
Chapter 1: The Pathogen
1.1 Taxonomy and nomenclature: Phyllosticta ampelicida or Guignardia bidwellii?
The fungal agent of black rot of grapevine has been usually referred to according to
the teleomorph name, Guignardia bidwellii(Ellis) Viala & Ravaz. The anamorph form is
recognized to be Phyllosticta ampelicida (Engelm.) Aa. Up to recently, according to the
dual classification system, both names have been applied to the pathogen to
distinguish the two reproductive forms of the fungus. A recent overview on the genus
Phyllosticta by Wikee et al. (2013) proposed the use of a single name i.e. Phyllosticta
ampelicida. The opinion of the authors was enforced by two considerations: the first
was that Phyllosticta is the oldest name and therefore has a priority over Guignardia,
the second that there are more species of Phyllosticta than Guignardia, so Guignardia
species should be treated as synonyms of Phyllosticta species. This is in accordance
with the recent reorganization in the rules on fungal nomenclature, the “one fungus
one name” approach. This approach states that a single organism or biological species
should have only one name, independently of the morphology or its reproductive
structures (Hawksworth et al., 2011; Wingfield et al., 2012).
The genus Phyllosticta was introduced for the first time in 1818 by Person with P.
convallariae and it includes plant pathogenic species that cause diseases of significant
economical importance in many hosts, some of which are considered quarantine pests
in some countries. Following Wikee et al. (2013), the two genera, Phoma and
Phyllosticta, induced for many years a general misunderstanding among the
researchers, as the two genera comprised pycnidial fungi characterized by unicellular
hyaline conidia. In 1935 Grove regarded Phyllosticta as a parasite, while Phoma as
saprobe or wound parasite. The classification was further revised in 1922 by Seaver,
who studied the fungal spore size on host plants, and in 1935 by Grove who, according
to the taxonomic practices of the twentieth century, separated the species belonging
to the genus Phyllosticta according to the host preference and arranged them
alphabetically, coupling the name of the genus with the host genera.
The genus Guignardia was for the first time introduced by Viala & Ravaz in 1892 to
replace the initial Laestadia name and later, in 1957, Petrak collocated G.bidwellii in
the Botryosphaeria genus, calling the fungus Botryosphaeria bidwellii. In 1974
Punithalingam, on the basis of morphological characters (Botryospheria has larger
ascomata, larger ascospores and multilocular stroma), suggested that all the taxa with
Phyllosticta morphology had to be called Guignardia. Only in 2006, with the aid of
molecular tools, the Phyllosticta genus was placed in Botryosphaeriales (Schoch et al.,
2006).
12
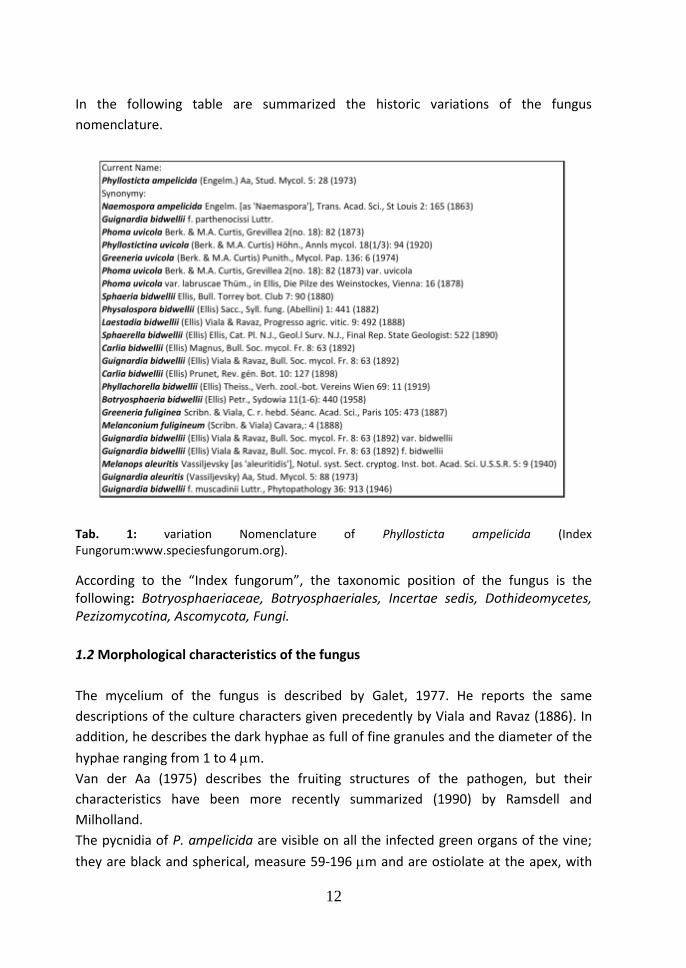
In the following table are summarized the historic variations of the fungus
nomenclature.
Tab. 1: variation Nomenclature of Phyllosticta ampelicida (Index Fungorum:www.speciesfungorum.org).
According to the “Index fungorum”, the taxonomic position of the fungus is the following: Botryosphaeriaceae, Botryosphaeriales, Incertae sedis, Dothideomycetes, Pezizomycotina, Ascomycota, Fungi.
1.2 Morphological characteristics of the fungus
The mycelium of the fungus is described by Galet, 1977. He reports the same
descriptions of the culture characters given precedently by Viala and Ravaz (1886). In
addition, he describes the dark hyphae as full of fine granules and the diameter of the
hyphae ranging from 1 to 4 m.
Van der Aa (1975) describes the fruiting structures of the pathogen, but their
characteristics have been more recently summarized (1990) by Ramsdell and
Milholland.
The pycnidia of P. ampelicida are visible on all the infected green organs of the vine;
they are black and spherical, measure 59-196 m and are ostiolate at the apex, with
13
holoblastic conidiogenous cells with percurrent proliferation. The conidia (7.1-14.6 x
5.3-9.3m) (Fig. 1) are aseptate, ellipsoid, hyaline and rounded at the end. They are
surrounded by a mucillaginous hyaline sheath-like layer 0.5 m thick, which probably
is related to the adhesion of the conidia to the substrates. On the apex is present an
appendage 5 to 12 m long, while at the basal end is visible a scare, which is the site
where the conidium was originally attached to the conidiogenous cell in the pycnidium
(Kuo KC et al.,1996). Unknown is the function of the appendage, and different are the
hypothesis proposed for its use: it anchors the conidium to the host surface, it guides
the conidium in the passive movements in the water drops, it is a sensorial structure.
Probably, as suggested by Kuo and Hoch (1995), the appendage has adhesive
properties. They noted that it is continuous with the sheath, which plays a role in the
adhesion of the spores to the host.
The sexual stage, G. bidwellii, forms black and spherical pseudothecia on the fungal
stroma on overwintering berries. Pseudotecia are separated, have a diameter ranging
from 61 to 199 m and present a flat or papillate ostiole at the apex. The oval
ascospores measure 10.6-18.4 x 4.8-9.0 m and are hyaline, unicellular and not
septate (Fig. 1). The asci are bitunicate, have a cylindrical or clavate shape and each
one carries 8 ascospore, which size is 36-56 x 12-17 m.
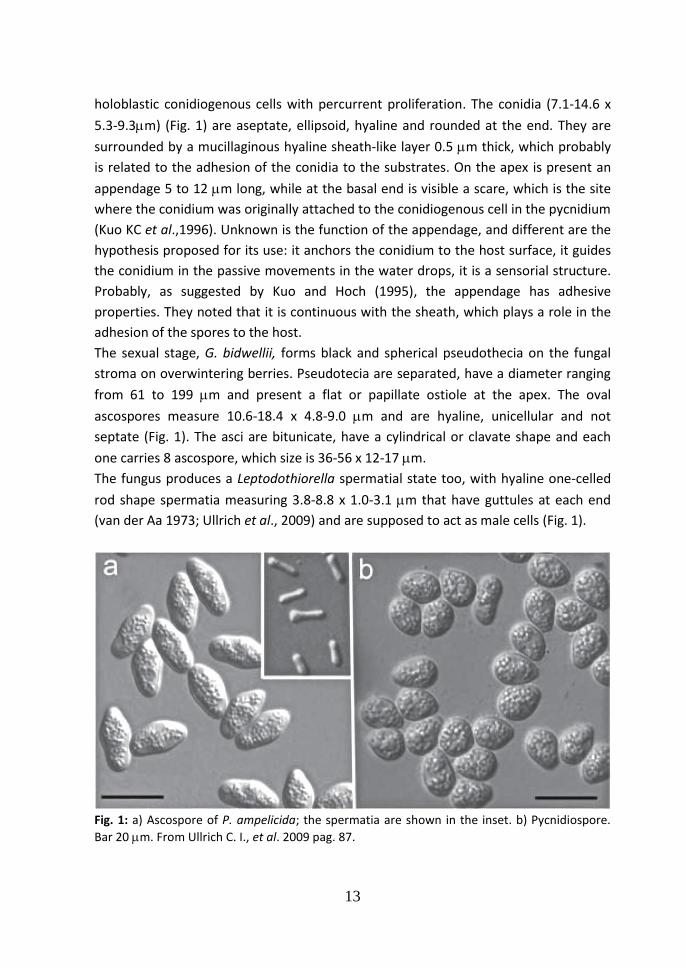
The fungus produces a Leptodothiorella spermatial state too, with hyaline one-celled
rod shape spermatia measuring 3.8-8.8 x 1.0-3.1 m that have guttules at each end
(van der Aa 1973; Ullrich et al., 2009) and are supposed to act as male cells (Fig. 1).
Fig. 1: a) Ascospore of P. ampelicida; the spermatia are shown in the inset. b) Pycnidiospore.
Bar 20 m. From Ullrich C. I., et al. 2009 pag. 87.
14
1.3 Symptoms of the disease
All the green tissues of the vines can be infected by the fungus during the growing
season. On the young shoots, petioles, peduncles, green rachises and the tendrils too,
the final aspect of the lesions is that of black cankers. On these organs, at the
beginning, the symptoms appear like a whitish spot on a depressed tissue area. If the
weather is favorable to the disease, within two days the lesions turn brown, evolve
into a black superficial canker and the first pycnidia of the fungus appear (Fig. 2). The
first symptoms on the young leaves appear as spots, which are of a very light brown
color during the very first stages of the disease. Subsequently, the tissue dries and the
spot becomes surrounded with a darker brown margin. Within two days, with
favorable weather condition, the pycnidia appear on the surface of the necrotic spot
of the fungus disposed in a circle (Fig. 3). The diameter of the spot ranges from 1
millimeter to 1 centimeter, depending on the age of the leaf (Fig. 3 & 4). Young leaves
are more susceptible to the infection than the older ones. In 1996, Kuo and Hoch
demonstrated that conidia cannot infect grape leaves from the sixth or older node
from the tip of the shoot. At this date is still not clear which are the mechanisms
underlying the resistance of older leaves. Different factors are hypothesized to be
involved: the cuticle, because of its thickness in old leaves, can hinder the penetration
of the hyphae, or a biological response of the plant to the pathogen could be
responsible for the resistance (Ullrich, 2009). In case of a severe attack the spots can
join together provoking the complete collapse of the leaf (Fig. 5). Studies conducted
on different hosts of the genus Vitis in U.S.A., Switzerland and Germany (Ferrin et al.,
1978; Jermini et al., 1996; Hoffman et al. 2002) have shown that the clusters are
susceptible to the disease from six until ten weeks after bloom, depending on weather
conditions and grape variety. The first observation conducted in a Mediterranean
environment (Rossi, 2012) demonstrated that the clusters can be seriously damaged
by early attacks of the pathogen. Cankers on the young clusters, their rachises and
peduncles, before and during the bloom, can cause drying of part or of all of them,
causing severe economic losses (Fig. 6).
Small buds and 1 mm diam. berries can be damaged and can show the symptoms of
the disease. On the small berries (1-3 mm diameter) the disease appears as a whitish
to a very light brown depressed spot, which finally extend to the whole berry that
dries up (Fig. 7). On berries bigger than 1 cm diam., the initial lesion is as above
described, then evolves in a brownish spot which comprises half a berry, subsequently
shrivels assuming a reddish dark purple color, then finally dries, becoming dark purple
15
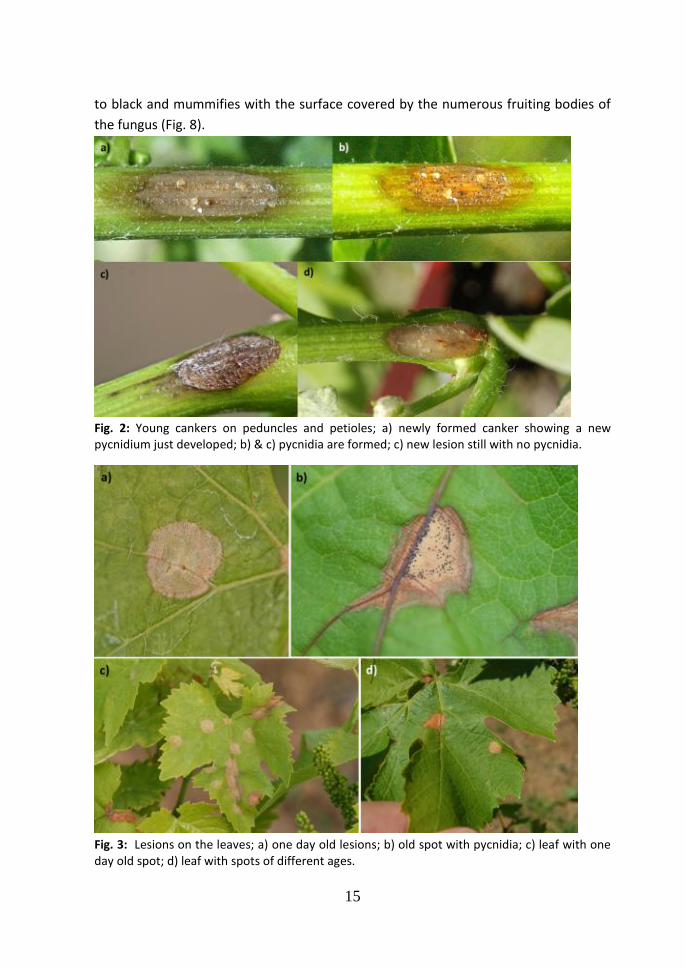
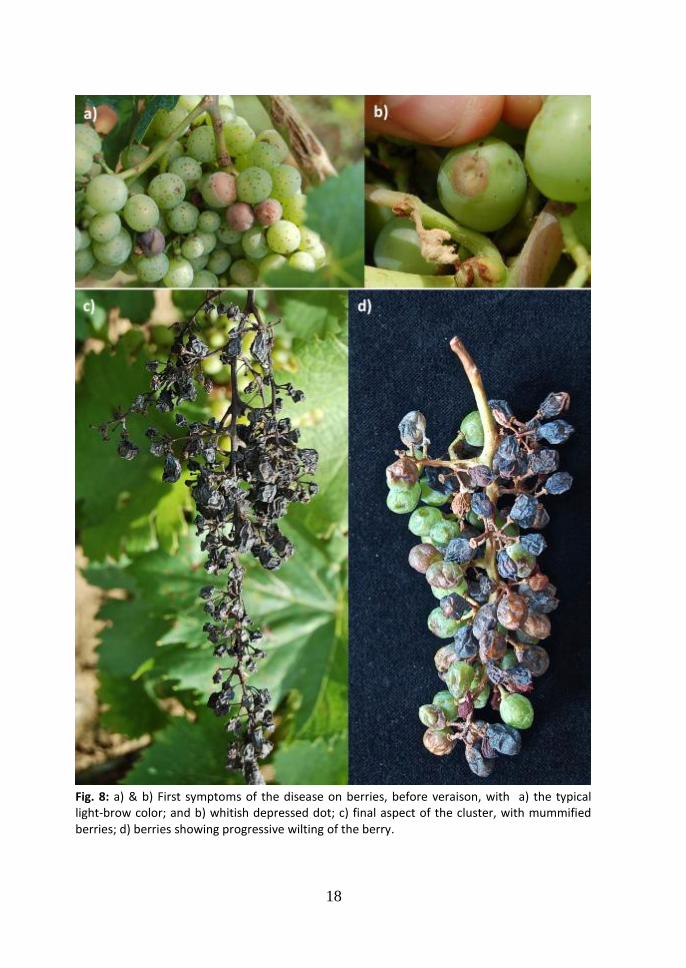
to black and mummifies with the surface covered by the numerous fruiting bodies of
the fungus (Fig. 8).
Fig. 2: Young cankers on peduncles and petioles; a) newly formed canker showing a new pycnidium just developed; b) & c) pycnidia are formed; c) new lesion still with no pycnidia.
Fig. 3: Lesions on the leaves; a) one day old lesions; b) old spot with pycnidia; c) leaf with one day old spot; d) leaf with spots of different ages.
16
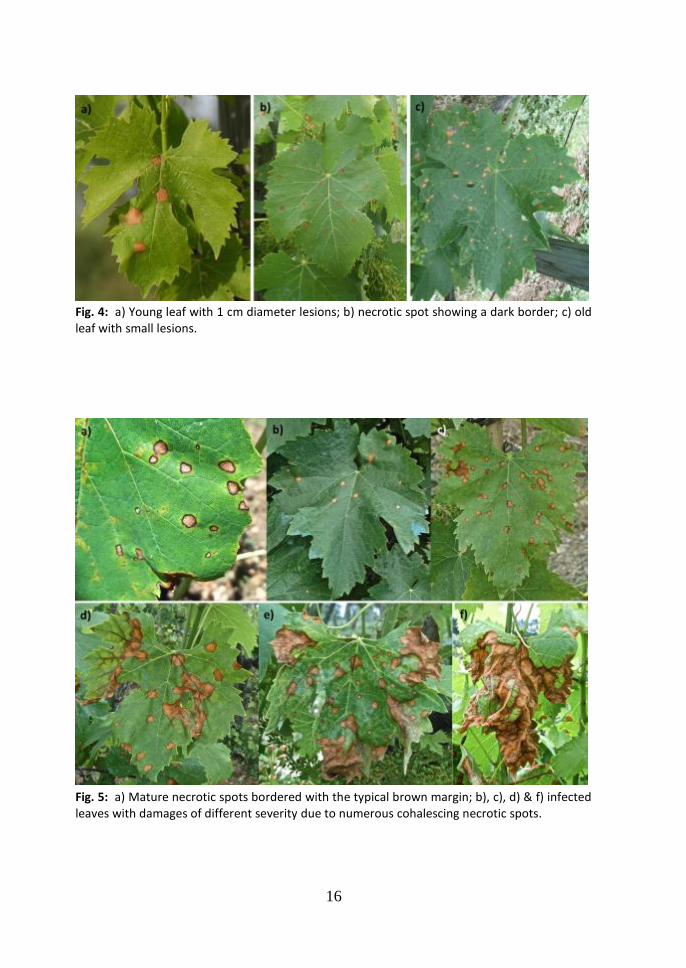
Fig. 4: a) Young leaf with 1 cm diameter lesions; b) necrotic spot showing a dark border; c) old leaf with small lesions.
Fig. 5: a) Mature necrotic spots bordered with the typical brown margin; b), c), d) & f) infected leaves with damages of different severity due to numerous cohalescing necrotic spots.
17
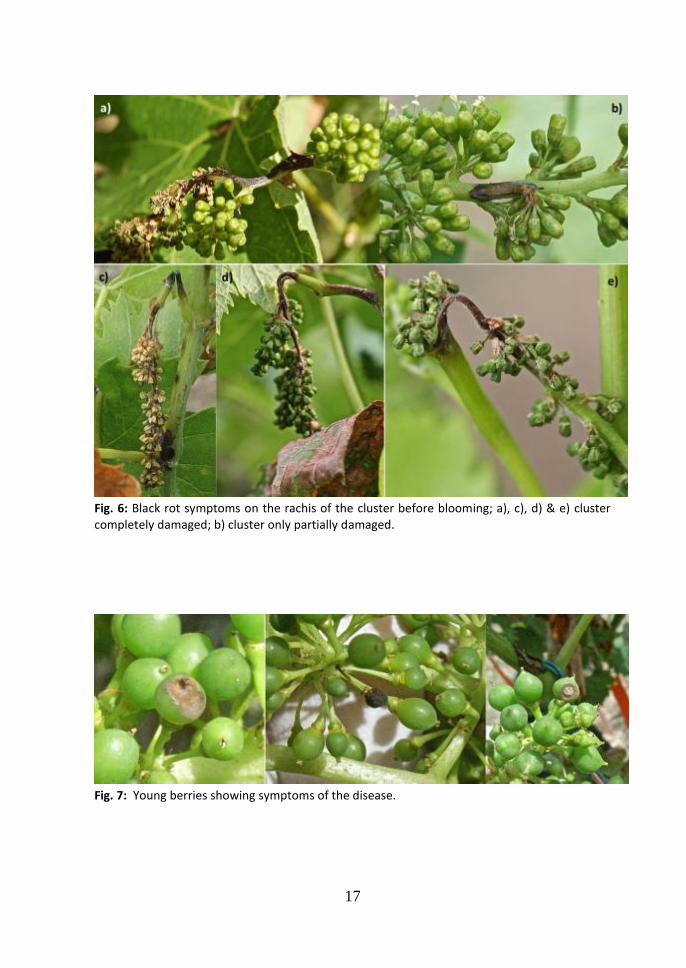
Fig. 6: Black rot symptoms on the rachis of the cluster before blooming; a), c), d) & e) cluster completely damaged; b) cluster only partially damaged.
Fig. 7: Young berries showing symptoms of the disease.
18
Fig. 8: a) & b) First symptoms of the disease on berries, before veraison, with a) the typical light-brow color; and b) whitish depressed dot; c) final aspect of the cluster, with mummified berries; d) berries showing progressive wilting of the berry.
19
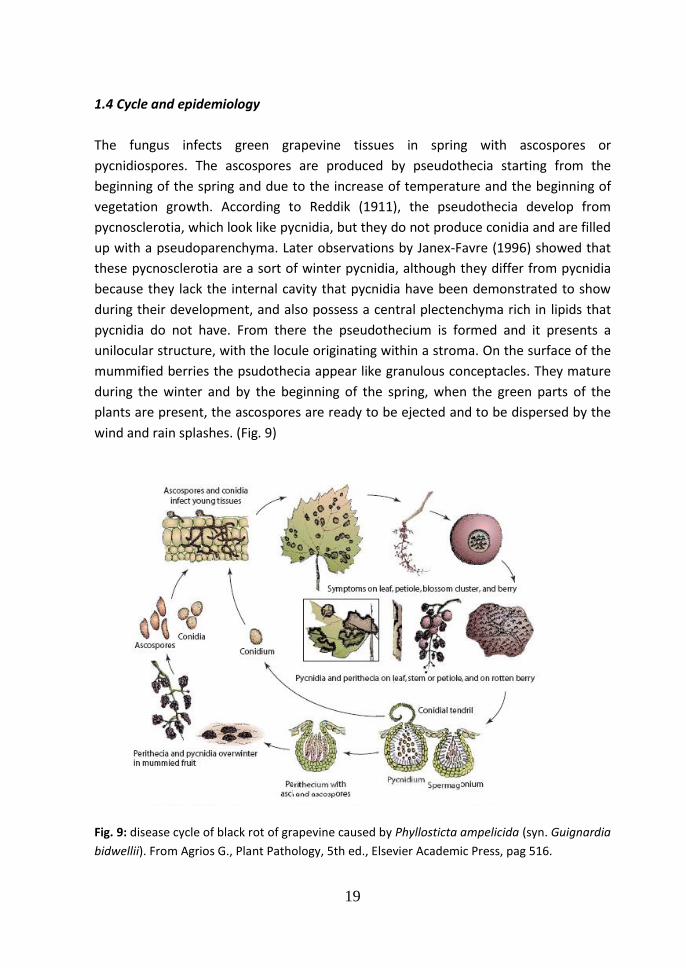
1.4 Cycle and epidemiology
The fungus infects green grapevine tissues in spring with ascospores or
pycnidiospores. The ascospores are produced by pseudothecia starting from the
beginning of the spring and due to the increase of temperature and the beginning of
vegetation growth. According to Reddik (1911), the pseudothecia develop from
pycnosclerotia, which look like pycnidia, but they do not produce conidia and are filled
up with a pseudoparenchyma. Later observations by Janex-Favre (1996) showed that
these pycnosclerotia are a sort of winter pycnidia, although they differ from pycnidia
because they lack the internal cavity that pycnidia have been demonstrated to show
during their development, and also possess a central plectenchyma rich in lipids that
pycnidia do not have. From there the pseudothecium is formed and it presents a
unilocular structure, with the locule originating within a stroma. On the surface of the
mummified berries the psudothecia appear like granulous conceptacles. They mature
during the winter and by the beginning of the spring, when the green parts of the
plants are present, the ascospores are ready to be ejected and to be dispersed by the
wind and rain splashes. (Fig. 9)
Fig. 9: disease cycle of black rot of grapevine caused by Phyllosticta ampelicida (syn. Guignardia
bidwellii). From Agrios G., Plant Pathology, 5th ed., Elsevier Academic Press, pag 516.
20
1.4a Ascocarp ontogeny.
The development of the ascocarp occurs in 5 stages and it has been studied
thoroughly by Janex-Favreet al., 1996.
1 The young carpocentrum. The differentiation of a conical carpocentrum develops
in the centre of a stromatic primordial structure.
2 The ascogonial apparatus. The ascogonial subglobular cells differentiate in the
lower part of the carpocentrum. The multicellular trichogynes grow intercellularly
in a longitudinal direction toward the apex of the stroma. Sometime their tips,
growing between the superficial stromatic cells, emerge at the surface.
3 The formation of the locule. During this stage, from the carpocentrum, the future
ascal locule and the surrounding perilocule develop. The locule includes
pseudoparaphyses and some fertile cells, the ascogonial cells. A stromatic layer
surrounds locule and perilocule.
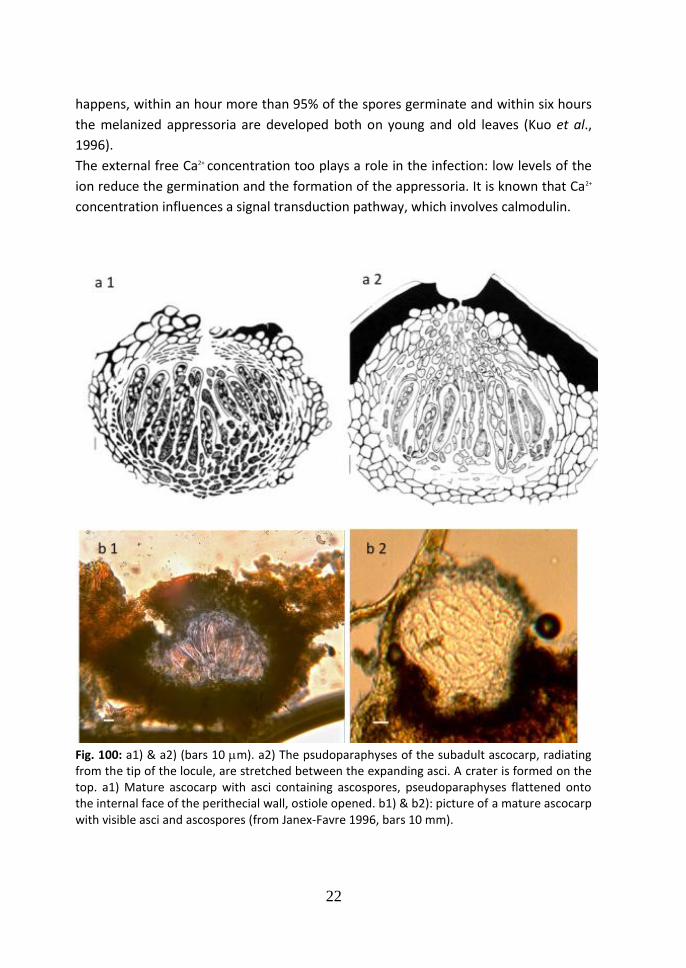
4 The subadult ascocarp. Numerous asci are developed in the locule at different
times (Fig. 10). They grow longitudinally among sterile filaments and at maturity
they appear subcylindrical and bitunicate. They contain eight ovoid unicellular
ascospores with a granular cytoplasm. The interascal pseudoparaphyses are
squeezed by the growing asci from the top to the bottom of the ascal locule. The
subhymenial cap on the top of the ascal locule becomes thinner, tending to
disappear in the axial part. Slowly, in the upper part, the stromatic layer is
deteriorated, and a little crater is formed. The remaining stromatic tissue
represents the ascocarp wall (Fig. 10 a1 & a2).
5 The mature ascocarp. In this last stage, the asci produce the ascospores, the
ostiole broadens, the interascal filament is no more present and the
pseudoparaphyses appear flattened on the internal face of the perithecial walls.
The ascospores, first released from the asci in the ascal locule, are ejected through
the ostiole until the crater disappears and finally the whole asci are expelled for
the degradation of the lining cells of the ostiole (Fig. 10 b1 & b2).
Once ejected from perithecia, free water is necessary for the ascospore germination,
so the rain is to be considered the unavoidable event to begin the infection. A rain of
0.03 cm is enough to discharge the ascospores (Ferrin et al., 1977), which germinate in
6 hours at optimum temperature of 27 °C.
1.4b Stages of pycnidia development and infection
The infections caused by pycnidiospores were more deeply studied. Pycnidia can
overwinter on the surface of green tissues infected during the previous season: canes,
21
petioles, tendrils (Becker et al.,1996) and also mummified berries (Reddik, 1911 and
Ferrin et al., 1978). Their development is completed in four phases as in vitro trials
have demonstrated (Janex-Favre et al., 1993).
1. The primordial nodule.
A spherical paraplectenchymatous primordial nodule is developed by the
division of the cells in the superficial layer of the mycelium.
2. The massive pycnidial primordium.
The differentiation of the fertile nucleus from the primordial nodule begins,
while the basal inflated cells are disposed into radial lines and this
arrangement continues in acropetal direction until the whole fertile center is
interested and becomes oval.
3. The formation and extension of the pycnidial cavity.
The formation of the cavity begins and a primordial form of conidiogenous
filaments is clearly visible. The young pycnidium grows, but the structure
organization remains unchanged, with an ovoid form and a neck not
morphologically differentiated (Fig. 11).
4. The conidiogenesis and the opening of the pycnidium.
Formation of the conidia is carried out by holoblastic conidiogenous cells with
percurrent proliferation through the following steps:
a) swelling of the tip of the filaments;
b) nuclear division of the basal cells;
c) one nucleus passes into the swollen tip of the filament;
d) formation of a separation set and formation of the conidium.
The original nucleus of the conidia can remain single or going through division (about
50% of conidia are bi- or tri-nucleate).
During the release of the conidia a white cirrhus is visible on the top of the pycnidium,
consisting of conidia held in a mucillagenous exudate produced by conidiogenous cells.
1.5 Conidic infection process
For the conidia, rainfall and a firm adhesion to the host surface are the two main
events necessary for the infection, which requires only 0.25 cm of rain and has the
most favorable condition with rain that lasts at least 1 hour. Rain events longer than 3
hours reduce the infections, because the spores are washed away from the surfaces.
As for the necessary conditions for the attachment of the conidia to the leaf surface,
trials conducted on the hydrophobic leaf surfaces have demonstrated that the
attachment time is lower than 0.03 sec if the surface is first acidified. When this
22
happens, within an hour more than 95% of the spores germinate and within six hours
the melanized appressoria are developed both on young and old leaves (Kuo et al.,
1996).
The external free Ca2+ concentration too plays a role in the infection: low levels of the
ion reduce the germination and the formation of the appressoria. It is known that Ca2+
concentration influences a signal transduction pathway, which involves calmodulin.
Fig. 100: a1) & a2) (bars 10 m). a2) The psudoparaphyses of the subadult ascocarp, radiating from the tip of the locule, are stretched between the expanding asci. A crater is formed on the top. a1) Mature ascocarp with asci containing ascospores, pseudoparaphyses flattened onto the internal face of the perithecial wall, ostiole opened. b1) & b2): picture of a mature ascocarp with visible asci and ascospores (from Janex-Favre 1996, bars 10 mm).
23
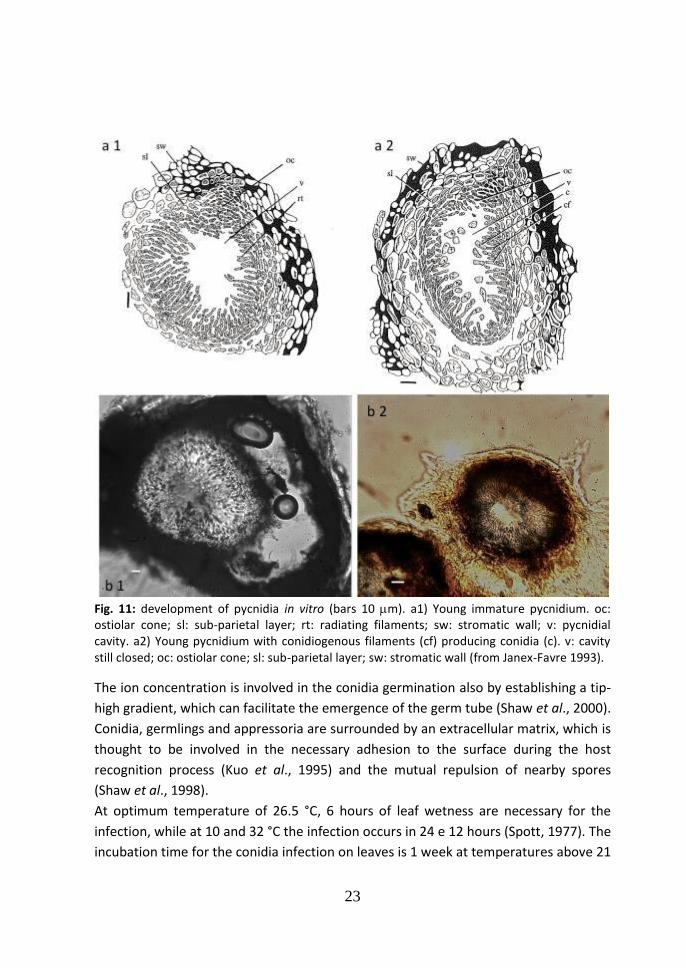
Fig. 11: development of pycnidia in vitro (bars 10 m). a1) Young immature pycnidium. oc: ostiolar cone; sl: sub-parietal layer; rt: radiating filaments; sw: stromatic wall; v: pycnidial cavity. a2) Young pycnidium with conidiogenous filaments (cf) producing conidia (c). v: cavity still closed; oc: ostiolar cone; sl: sub-parietal layer; sw: stromatic wall (from Janex-Favre 1993).
The ion concentration is involved in the conidia germination also by establishing a tip-
high gradient, which can facilitate the emergence of the germ tube (Shaw et al., 2000).
Conidia, germlings and appressoria are surrounded by an extracellular matrix, which is
thought to be involved in the necessary adhesion to the surface during the host
recognition process (Kuo et al., 1995) and the mutual repulsion of nearby spores
(Shaw et al., 1998).
At optimum temperature of 26.5 °C, 6 hours of leaf wetness are necessary for the
infection, while at 10 and 32 °C the infection occurs in 24 e 12 hours (Spott, 1977). The
incubation time for the conidia infection on leaves is 1 week at temperatures above 21
24
°C and two weeks at 15 °C, while the pycnidia appear on the leaf spots after 3 or 5.5
days respectively at 21 and 15°C (Spotts, 1980). The fungus colonizes the leaves
subcuticularly and, after germination, the spores form appressoria, which penetrate
the cuticle by penetration pegs. In the first stage of the germination process, the
pycnospores are binucleate and are divided by mitosis in four nuclei before the
development of the septum that separates them and the germ tube from the
apressoria. Three of the four nuclei migrate into the appressoria, while the remaining
one is lastly degraded in the pycnidiospore (Shaw et al., 1998).
Trials conducted in Germany (Ullrich et al., 2009) demonstrated that the pathogen can
infect both the adaxial and abaxial leaf surfaces penetrating the cuticle instead
through the open stomata. The hyphae grows between the cuticle and the anticlinal
cells walls, remaining near the vascular bundles and after, when the cuticle is
separated from the leaf tissues during the development of the infection, it stays firmly
anchored to it. The main source of nutrients for the pathogen supposedly comes from
the vascular bundles and not by penetrating the epidermal or mesophyll cells. After
the infections, symptoms are visible only on young leaves, while old leaves remain
symptomless. To better explain the phenomenon of aged related resistance, Kuo KC
(1996) proposed to use the terms “expanding” and “nonexpanding” for young and old
leaves. In his trials no symptoms appeared on inoculated and fully expanded leaves,
while necrotic lesions were noticed on not fully expanded leaves. The diameters of the
spots decreased from the “nonexpanded” to the “expanded” leaves. The penetration
of the pathogen within the expanded leaves was less than 30 m and, although these
remained symptomless, the pathogen was still viable for up to two months. This
finding confirms the hypothesis of Luttrell (1974), who though that the fungus could
be hemibiotroph and capable to switch from a symptomless endophyte to being a
saprobe, making it able to winter inside the leaves in environments with temperate
winters.
A mechanism of resistance of the vines can be involved too. Near the infecting hyphae
and appressoria, Ullrich (2009) detected paramural-like bodies with vesicles in the
epidermal cells. This, associated to the presence of electro lucent fungal walls that
surround the hyphae, indicates a response of the plant to the pathogen.
1.6 Phytotoxic metabolites
Recent studies (Molitor. et al. 2012; Buckel et al. 2013; Andernach. et al. 2013; Stoyle
et al. 2013) of culture filtrates of the pathogen have demonstrated the existence of
secondary metabolites with phytotoxic effects. It is well known that the fungal plant
25
pathogens produce, during the infection, proteins and enzymes necessary for the
pathogen to survive within the host, while other secondary metabolites like toxins
have a role in the host/pathogen relationship, weakening the host plant up to even
causing its death. Guignardic acid, Phenguignardic acid and Alaguignardic acid are
important molecules dioxolanon-type that are produced by the pathogen and have a
similar structure. They are supposed to be produced by the fungus through oxidative
deamination of valine, alanine and phenylalanine. Trials conducted by Molitor (2012)
demonstrated that all these molecules have phytotoxic activity, not specific on Vitis
vinifera, as they show phytotoxic activity on Oryza sativa too (Molitor et al. 2012
references).
On trials conducted in 2012, Buckel et al. hypothesized that the production of the
toxins is related to nutritional needs of the fungus after infection. During the first
biotrophic phase, the fungus penetrates through the cuticle and feeds on the
degradation products of the same, by taking the aromatic substances necessary for
the synthesis of Phenguignardic acid outside of the membrane of the cuticle. The
pathogen has access to the phloem sap rich in nitrogenous substances - both amino
acids and amines - which are precursors of phytotoxic metabolites. Then within the
leaf, the fungus synthesizes the toxins that cause the death of host cells and begins the
second necrotrophic phase: the epidermis collapses and the hyphal network can
penetrate into cells.
The hypothesis that the pathogen uses the plant compounds to produce the
phytotoxins is strength by the preference of the young leaves, in fact they are richer
than the older ones of phloematic tissues and are a sink of phenylalanine.
The mechanisms of the switching from biotrophic to the second phase are unknown,
but all the metabolites of P. ampelicida object of the study (Molitor. et al. 2012; Buckel
et al. 2013; Andernach. et al. 2013; Stoyle et al. 2013) were obtained from submerged
culture of a strain of the fungus (CBS 111645), isolated from Parthenocissus
quinquefolia. The strain according to previously cited papers (Wicht et al., 2012, Zhang
K. et al., 2013), and this study too, is a different species of the Phyllosticta
ampelicida/Guignardia bidwellii complex. What is certain is that the toxins are
phytotoxic on leaves of Vitis vinifera, but the study did not indicate whether the
metabolites are themselves virulence factors and if they are responsible for the
symptoms.
It should now be investigated if the same metabolites are produced by P. ampelicida
too, causing similar damages, or if toxin-free strains are pathogenic too. The work has
been up to now performed in the laboratory, so it should also be verified the
possibility of finding the toxins in the tissues of plants infected by the fungus.
26
1.7 Control
1.7.1 Cultural practices in the control of black rot
Several studies have been conducted to assess which is the most effective strategy for
black rot control. Worldwide trends in recent years are all focused on reducing the
overall use of pesticides in favor of the use of products with a specification and with
low environmental impact. The recent European legislation too indicates to the vine
growers the need to apply an Integrated Pest Management (IPM), when an organic
production is not possible, as the strategy to protect the crop from the pests, in which
different tools are integrated, from the forecasting networks to the use of resistant
plants. The first action in order to reduce infections is prevention i. e. to reduce the
inoculum for the following season: all infected residues must be eliminated at the end
of the season and close attention must be paid to the abandoned vineyards, which are
an important source of inoculum.
In cold and wet environments such as Central Europe or North America, it was
observed that the inoculum provided by the mummified berries that have
overwintered on and in the soil is very low, while tests conducted in Friuli (a region in
the North East of Italy–Bigot, unpublished data), showed that the disease incidence
caused by infectious material on a grassy soil, were lower than those occurring on soils
worked and weeded. Trials conducted in North America have shown that infected
residual left on the trellis wire (Fig. 12), provoked levels of disease higher than the
vineyards in which residues had been removed (Becker, 1996). In addition, mechanical
pruning facilitates the spread of the disease compared to that manual one, as the first
one is not selective and retains infected residual on the trellis. Sosnowski et al. (2012)
proposed as an effective method to eradicate the disease the drastic pruning of the
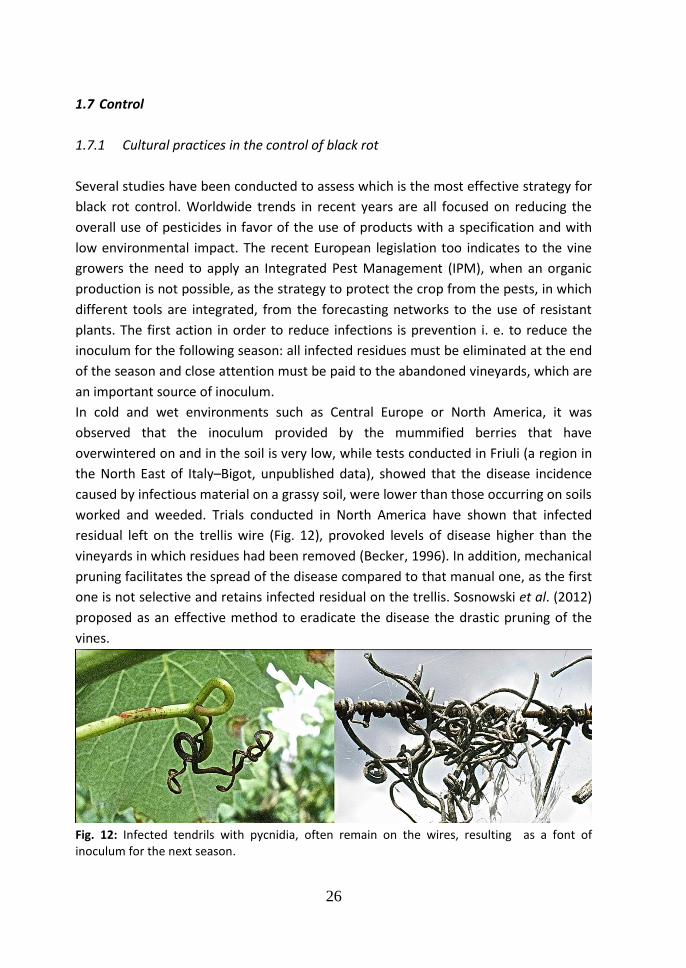
vines.
Fig. 12: Infected tendrils with pycnidia, often remain on the wires, resulting as a font of inoculum for the next season.
27
1.7.2 Chemical control of black rot.
Copper has been shown to have some efficacy on the disease (Reddik, 1911), and it
can be sprayed since after bud bursting in spring. Copper is effective as a preventive
product both on Phyllosticta ampelicida and on Plasmopara viticola and although the
black rot symptoms on the leaves do not cause any economic loss, the treatment leads
to keep a low inoculum of the pathogen in the vineyard.
Nevertheless the efficacy of copper and also of sulphur products is not considered
high enough and therefore black rot disease is considered a very hard diseases to
control in organic vineyards.
Trials performed in France (Bolay et al., 1993)and in Veneto (Italy) in 1994 (Serra et al.)
demonstrated that the dithiocarbammate mancozeb had a very good efficacy to
protect the vines, when sprayed every 8 days. This chemical is still widely used to
prevent infections but today such application of the pesticide to the plants meet
problems linked to the negative secondary effect on predatory mites, but also on their
wider negative effect on the environment for their toxicological characteristics which
lead to limit the number of applications allowed.
Since 2000 important studies were focused on the efficacy of some demethylation
inhibitors (DMI) and Strobilurin fungicides in black rot management. Particularly the
following aspects were studied: the factors influencing the efficacy of these products;
which was the phenological stage of the vine that is more susceptible to infection and
therefore in which protection is more relevant; which are the risks of genetic
resistance to these pesticides by this fungus. Three were the chemical products object
of the studies, myclobutanil, azoxystrobin and pyraclostrobin. The effectiveness of
these molecules has been shown, in all the tests performed, to be dependent on the
climatic conditions, on the vine varieties and the related different period of
susceptibility of the clusters, on the size of inoculum. All tests were focused on the
protection of the clusters from the disease with treatments carried out since the shoot
length was 10 cm. Hoffman and Wilcox (2003), followed by Hoffmanet al.(2004),
Harms et al., (2005), has shown that treatment with myclobutanil on the leaves of cv.
Riesling 2 to 6 days after inoculation, at a dose of 60 mg/l, prevented the formation of
lesions, while when it was sprayed after 6 days, but before the appearance of necrotic
spots, completely inhibited the formation of pycnidia. In the same conditions at doses
of 128 mg/l, azoxystrobin had a curative, but lower, activity. Treatments with
commercial formulations of azoxystrobin at dose of 200 mg/l and inoculated
thefollowing day with conidia, protected the leaves for 4 weeks, but when they were
dried with paraquat from 1 to 7 days after inoculation, 50% of them formed pycnidia.
28
In all the trials when pycnidia were present the conidia production was reduced.
Hoffman came to the conclusion that the period of maximum susceptibility for the
clusters, so the most important intervention period with chemicals was the one
between the pre-flowering and 4 weeks after. As a matter of fact, treatments carried
out after 4 weeks did not provide any additional benefit. Another relevant aspect is
that previous treatments on the leaves to prevent the secondary infections did not
bring benefits. This was in agreement with what was previously reported by Jermini M.
(1996) in Switzerland that there was little correlation between the incidence of black
rot on the leaves and on the fruits.
It must be remebered that azoxystrobin, pyraclostrobinare fungicides belonging to the
group of the quinone outside inhibitors (QoIs), that, as well as the triazole
myclobutanil,have a high risk of inducing resistance in some pathogens by the
mutation of a protein, cytochrome b. For these reasons a strategy to control P.
ampelicida based only on these fungicides in the long run could lead to the selection
of resistant strains.
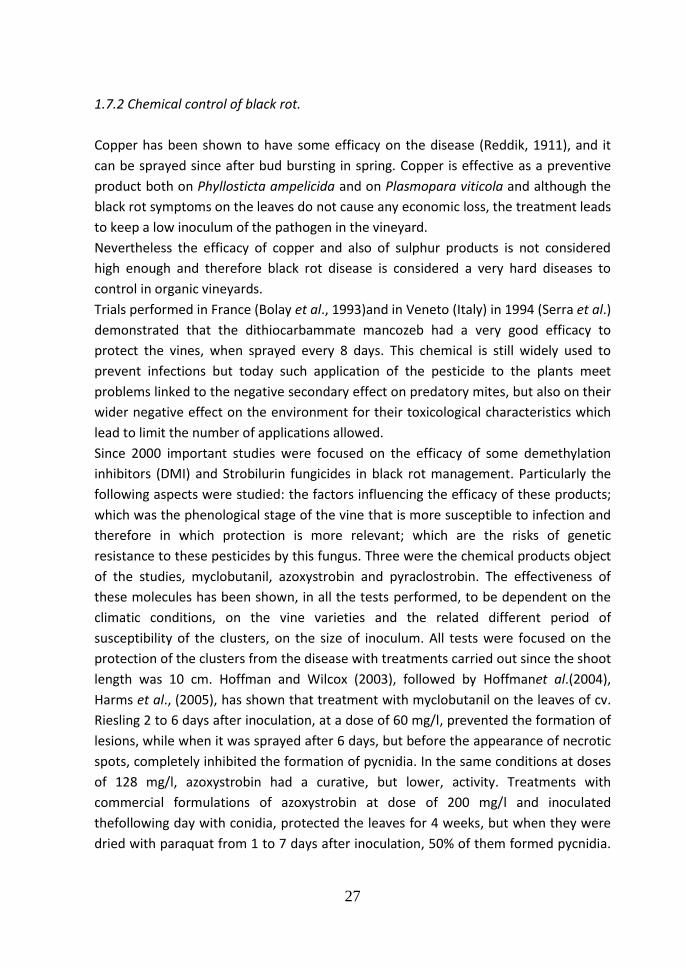
Studies conducted in 2011 by S. Miessner et al. on the estimation of the resistance to
the risk to Qol fungicides by the pathogen, have led to the conclusion that the fungus
has a low risk to generate resistance phenomena.Other tests conducted in Germany
always on Riesling grape and based on the comparison between pyraclostrobin and
myclobutanil, since 2008 until 2010 (Molitor et al. 2011), have shown that
pyraclostrobin provides optimal effectiveness, both in pre-infectionand in post-
infection and when applied in post flowering the chemical is capable of inhibiting
infections up to three weeks after application. In this study it was also evident that the
pre-bloom treatment was fully ineffective in the reducing the damages following the
post bloom infection. Spraying on clusters was effective only if and when the caps had
fell, probably due to a low translocation of the strobirulins (Barlett et al., 2002) (Fig.
13).
Fig. 13: Infected caps with pycnidia. The following protection applied after caps had almost all fallen protected efficiently the newly formed berries.
29
Actually also myclobutanil, supposed to have higher systemic facilities (Gachomo et al.
2009), was not effective when applied before the fall of the caps. Myclobutanil on the
other hand showed a good preventive action. Indeed, if sprayed on the plants one day
before inoculation of the pathogen,it reaches levels of efficacy above 90%, which
decrease at the increasing distance between inoculation and application. When
applied within the middle of the incubation period, it showed a high curative potential,
preventing the development of symptoms both on leaves and on berries. Therefore
pyraclostrobin has been shown a good performance, both curative and protective,on
leaves and berries, while myclobutanil is more effective in post infection.
30
References
Aa HA van der (1973). Studies in PhyllostictaI. Studies in Mycology5:1−110.
Aa HA van der, Vanev S (2002). A revision of the species described in Phyllosticta.
Centraalbureau voor Schimmelcultures, Utrecht, The Netherlands.
Andernach L., Sandjo L. P., Liermann J. C., Buckel I., Thines E., Opatz T., (2013).
Assignment of configuration in a series of Dioxolanone-type secondary metabolites
from Guignardia bidwellii – A comparison of VCD and ECD spectroscopy. European
Journal of Organic Chemistry. 26:5946-5951.
Barlett D. W., Clough J. M., Godwin J. R., Hall A. A., Hamer M., Parr-Dobrzanski B.
(2002). The strobirulin fungicides. Pest Management sciences 58:694-662.
Becker C. M., Pearson R. C., (1996). Black rot lesions on overwintered canes of Euvitis
supply conidia of Guignardia bidwellii for primary inoculum in spring. Plant disease
80(1):24-27.
Bolay, A., O. Viret, and J. Taillens, (1993). Field experiment against black-rot of grape in
1993. Revue suisse de viticulture, arboriculture, horticulture 26 (in French).
Buckel I., Molitor D., Liermann J. C., Sandjo L. P., Berkelmann-Lohnertz B., Opatz T.,
Thines E. (2013). Phytotoxic dioxolanone-type secondary metabolites from Guignardia
bidwellii. Phytochemistry 89:96-103.
Ferrin D. M., Ramsdell D. C., (1977). Ascospore dispersal and infection of grape by
Guignardia bidwellii, the causal agent of grape Black rot disease. Phytopatology
67:1501-1505.
Ferrin D. M., Ramsdell D. C., (1978). Influence of conidial dispersal and environment on
infection of grape by Guignardia bidwellii. Ecology and Epidemiology 68:892-895.
Gachomo E. W., Dehene H. W., Steiner U. (2009). Efficacy of triazoles and strobirulins
in controlling black spot disease of roses caused by Diplocarpon rosae. Annals of
Applied Biology 154:259-267
31
Grovw W. B. (1935). British steam and leaf fungi (Coelomycetes) 1 University Press
Cambridge, England.
Hawksworth DL, Crous PW, Redhead SA, Reynolds DR, Samson RA. , et al. 2011. The
Amsterdam Declaration on Fungal Nomenclature. IMA Fungus2:105–112.
Harms, M., Holz, B., Hoffmann, P.G., Lipps, H.P., Silvanus, W., (2005). Occurrence of
Guignardia bidwellii, the causal fungus of black rot on grapevine, in the vine growing
areas of Rhineland-Palatinate, Germany. BCPC Symp. Proc. 81:127-132.
Hoffman L. E., Wilcox W. F. (2002). Utilizing epidemiological investigation to optimize
management of grape Black rot. Phytopathology 92(6)676-680.
Hoffman L. E., Wilcox W. F. (2003). Factors influencing the efficacy of Myclobutanil and
azoxystrobin for control of grape Black rot. Plant disease 87(3):273-281.
Hoffman, L.E., Wilcox, W.F., Gadoury, D.M., Seem, R.C., Riegel, D.G., (2004). Integrated
control of grape black rot: influence of host phenology, inoculum availability,
sanitation, and spray timing. Phytopathology 94:641-650.
Janex-Favre M. C: Parguey-Leduc A. Jalloux F. (1993). The ontogeny of pycnidia of
Guignardia bidwellii in culture. Mycological Research 97(11) 1333:1339.
Janex-Favre M. C: Parguey-Leduc A. Jalloux F. (1996). The ontogeny of perithecia in
Guignardia bidwellii. Mycological Research 100(7) 875:880.
Jermini M., Gessler C. (1996). Epidemiology and control of grape black rot in Southern
Switzerland. Plant Disease 80(3):322-325.
Kuo KC., Hoch H. C. (1995). Visualization of the extracellular matrix surrounding
pycnidiospores, germlings and appressoria of Phyllosticta ampelicida. Mycologia
87:759-771.
Kuo KC., Hoch H. C. (1996). Germination of Phyllosticta ampelicida pycnospores:
prerequisite of adhesion to the substratum and the relationship of substratum
wettably. Fungal Genetics and Biology 20:18-29.
32
Kuo KC., Hoch H. C. (1996). The parasitic relationship between Phyllosticta ampelicida
and Vitis vinifera. Mycologia 88(4):626-634.
Luttrell E. S. (1946). Black rot of Muscardine grapes. Phytopatology 36:905-924.
Luttrell E. S. (1948). Physiologic specialization in Guignardia bidwellii, cause of Black
rot of Vitis and Parthenocissus species. Phytopatology 38:716-723.
Luttrell E. S. (1974). Parasitism of fungi on vascular plants. Mycologia 66(1):1-15.
Molitor D., Berkelmann-Loehnertz B. B. (2011). Simulating the susceptibility of cluster
to grape black rot infections depending on their phonological development. Crop
Protection. 30:1649-1654.
Molitor D., baus O., Berkelmann-Loehnertz B. B. (2011).Protective and curative grape
black rot control potential of pyraclostrobin and myclobutanil. Journal of plant disease
and protection. 118(5):161-167.
Molitor D.,Liermann J. C., Berkelmann-Loehnertz B., Buckel I.,Opatz T., Thines E.
(2012). Phengugnardic acid and Guignardic acid, Phytotoxic secondary metabolites
from Guignardia bidwellii. Journal of Natural Products 75:1265-1269.
Petrak F. (1957). Über die Gattungen Guignardia Viala & Ravaz und Discosphaerinav.
Höhnel. Sydowia 11:435-445.
Punithalingam E. (1974). Studies in Spheropsidales in culture II Mycological Papers
136:1-63
Ramsdell D. C., Milholland R. D., (1990). Compendium of grape disease. APS Press pp.
15-17
Rossi M. (2012). Indagini sulla biologia ed epidemiologia del marciume nero della vite
in Toscana. University of Florence, discussion.
Schoch C. L., Shoemaker R. A., SeifertK. A., Hambleton S., Spatafora J. W., Crous P. W.
(2006). A multigene phylogeny of the Dothideomycetes using four nuclear loci.
Mycologia 98:1041-1052.
33
Seaver F. J. (1922). Phyllostictaceae. North American Flora 6:3-84.
Shaw B. D., Kuo KC., Hoch H. C. (1998). Germination and appressorium development of
Phyllosticta ampelicida pycnidiospores. Mycologia 90(2):258-268.
Sosnowski M. R., Emmett R. W., Wilcox W. F. Wicks T. J. (2012). Eradication of black
rot (Guignardia bidwellii) from grapevines by drastic pruning. Plant Pathology 61:1093-
1102
Spotts R. A. (1977). Effect of leaf wetness and temperature on the infectivity of
Guignardia bidwellii on grape leaves. Ecology and Epidemiology 67:1378-1381.
Spotts R. A. (1980). Infection of grape by Guignardia bidwellii – Factors affecting lesion
development, conidial dispersal and conidial populations on leaves. Phytopathology
70(3):252-255.
Stoye A., Kowalczyk D., Opatz T., (2013). Total synthesis of (+)-Phenguignardic acid, a
phytotoxic metabolite of Guignardia bidwellii. European Journal of Organic Chemistry.
26:5952-5960.
Ullrich C. I., Kleespies R. G., Enders M., Koch E. (2009). Biology of black rot pathogen,
Guignardia bidwellii, its development in susceptible leaves of grapevine Vitis vinifera.
Journal für Kulturflanzen 61(3):82-90.
Viala P., Ravaz L. (1892). Sur la dénomination botanique (Guignardia bidwellii) du
Black-rot. Bulletin de la Société Mycologique de France. 8:63
Wilkee S., Lombard L., Udayanga D., and Crous P. W., Chukeatirote E., McKenzie E. H.
C., Bahkali A. H., Dai DQ., Hyde K. D. (2011). Phyllosticta – an overview of current
status of species recognition. Fungal Diversity 51:43-61.
Wilkee S., Lombard L., Nakashima C. Motohashi K., Chukeatirote E., Cheewangkoon R.,
McKenzie E. H. C., Hyde K. D. and Crous P. W. (2013). A phylogenetic re-evaluation of
Phyllosticta (Botryosphaeriales). Studies in Mycology 76:1-29
Wingfield MJ, Beer ZW de, Slippers B, Wingfield BD, Groenewald JZ. , et al. 2012. One
fungus, one name promotes progressive plant pathology. Molecular Plant
Pathologydoi: 10.1111/J.1364-3703.2011.00768.X

34
Zhang K., Zhang N., Cai L. (2013). Typification and phylogenetic study of Phyllosticta ampelicida and P. vaccinii. Mycologia DOI:10.3852/12-392
35
Chapter 2
Rinaldi P. A., Paffetti D., Comparini C., Broggini G. A. L., Gessler C., Mugnai L.
Genetic variability of Phyllosticta ampelicida (syn.
Guignardia bidwellii), the agent of black rot disease of
grapevine Manuscript to be submitted
______________________________________________________________________

36
37
Genetic variability of Phyllosticta ampelicida (syn. Guignardia bidwellii), the agent of black rot disease of grapevine
Rinaldi P. A.1, Paffetti D.2, Comparini C.1, Broggini G. A. L.3, Gessler C.3, Mugnai L.1 1Dipartimento di Scienze delle Produzioni Agroalimentari e dell’Ambiente – Sezione
Patologia Vegetale ed Entomologia, Firenze, Italy. 2Dipartimento di Scienze delle Produzioni Agroalimentari e dell’Ambiente – Sezione
Genetica Agraria, Firenze. 3Plant Pathology Integrative Biology Zurich (IBZ) ETH Zurich LFW – Zurich, Switzerland.
Abstract
Phyllosticta ampelicida (syn. Guignardia bidwellii) is an ascomycetous fungus that is pathogenic on some species of the genus Vitis causing black rot disease. Symptoms appear on all green tissues (leaves, canes, tendrils, rachis, floral bunches), but the most economically significant damage is on the clusters that can become completely mummified. In severe cases the disease can result in the complete loss of production. Although the pathogen is present in Europe since 1885 and has spread to all the major vine regions of the continent recently there has been a sudden outbreak of the disease in several European countries. In order to understand what may be the cause of these sudden outbreaks, the present study investigated the genetic variability of the fungus
through the analysis of the partial sequences of the ITS1 - ITS2 region and that of -tubulin and calmodulin genes. The genetic distances observed between strains of the pathogen isolated from different hosts of the genera Vitis and Parthenocissus, confirm the hypothesis of the existence of different species within what was once considered the species Phyllosticta ampelicida. On the other hand the analysis of the sequences in strains isolated from host plants belonging to the genus Vitis, shows a genetic variability between the European and American strains, while no variability was found between isolates of Vitis vinifera and Vitis labrusca. The analysis of nuclear microsatellites (nSSR), applied to strains of Vitis species: i) confirmed the existence of genetic variability of the fungus, ii) showed, also in this case, that the strains from America are distinctive, iii) that the America strains are genetically close to those from the Italian vine areas in which, starting from 2010, there were sudden and devastating oubreaks of the pathogen. 1. Introduction The ascomycete fungus Phyllosticta ampelicida (Englem.) Aa (syn. Guignardia bidwellii (Ellis) Viala & Ravaz), is the causal agent of black rot of grapevine. The symptoms of the disease develop on the green tissues of the plant as cankers on the tendrils, on leaf petioles, on the shoots and on the rachides of grapes (Ramsdell et al., 1990). On the leaves necrotic round spots develop ranging from two, three millimeters in
38
diameter up to 1 centimeter, depending on the age of the leaf (Luttrell, 1946). Within three days, at the optimal weather condition (around 21°C) for the cycle of the fungus (Spotts 1980), small black pycnidia can be seen on all the tissue lesions. The symptoms on the bunches in the early stages consist on the appearance of a whitish dot evolving in the typical light-brownish lesion, typically affecting only a part of the berry, which subsequently extends to the whole berry. The berry then mummifies with its surface completely covered by fruiting bodies of the fungus. The damage on the clusters can be limited to single berries or can lead to the complete mummification of the whole bunch. Characteristic of the disease is that the berries remain firmly anchored to the cluster. The period of the greatest susceptibility of the grapes runs from 1 to 5 weeks after flowering, depending on the weather condition (Hoffman et al., 2002; Molitor et al., 2011). After this time the clusters become less susceptible to the attack of the fungus; at the berry touch stage (berry diameter around 1.5 cm), the berry acquires an age related resistance which results in a decline of percentage of berries developing the disease and an increase in the period of incubation (Hoffman et al.,2002). The pathogen can overwinter as pseudothecia or pycnidia on the infected tissues, and during the following spring at the presence on the new vegetation, both can cause the primary infections (Becker, 1996). Only 0.03 cm of rain are necessary to discharge the ascospores on the green tissues (Ferrin et al., 1977) while 3 mm of rain are necessary to the pycnidia to release the conidia (Ramsdell et al., 1991). The infection and the incubation period is strictly related to the weather (temperature and wetness condition). The incubation period of the disease, when caused by the conidia infection, ranges from 1 week at above 21 °C, until 2 weeks at 15 °C. (Spotts, 1980). The first reports of the disease are from Kentucky, a North American State, when in the year 1805 F. A. Michaux in the tale of his travels noticed the symptoms of the disease in a farm near Lexington town. In Europe the pathogen was reported for the first time in France in 1885, in the upper valley of Herault, where vines from America had been introduced for the first time just 6 years earlier (Galet, 1977). From this first introduction the disease spread in all over Europe. The first report of the disease in Italy was in 1891 (Martelli, 1891), when symptoms were reported only on the leaves. But doubts were raised about the real presence of the pathogen in Italy until 1935 (Trincheri, 1935). First reports of crop damage were recorded only in 1974 in Liguria (Corte ., 1975) and Friuli in 1982 (Rui et al., 1987). In the vine areas of the North Eastern regions in Italy it was assumed that the pathogen came from near Eastern Europe probably from ex Jugoslavia, where the pathogen was known since 1935 (Rui, 1935). Currently the disease is prevalent in all growing areas of northern Italy, including Canton Ticino in southern Switzerland where the disease was recorded in 1988 (Pezet et al. 1989; Jermini et al., 1996) while in the Southern ones damages or even its presence were no longer reported up to 2011 (Prota et al., 2011),in some vineyards in the northern part of the island of Sardinia. Following the literature at present, the pathogen is considered responsible of the black rot disease of several species in the Vitaceae family (Vitis spp., Ampelopsis spp., Cissus spp., Parthenocissus spp.) (Wikee et al., 2011). The fungus was hypothesized to be indigenous to America,
39
so that the native vine species underwent a selective process for resistance (Reddick, 1911). Following studies by inoculation trials on Muscadine grapes (Vitis rotundifolia subgenus Muscadinia), Vitis vinifera, Parthenocissus spp. and American native grapes, Luttrell (1946 and 1948), demonstrated the existence of different forms of P. ampelicida, on the basis of light morphological differences and differences in pathogenicity. The form muscadinii infecting V. rotundifolia, causes primarily a disease of the vegetative part, causing only superficial scabs or lesions of the berries and it is capable to infect V. vinifera too. Other 2 forms detected were P. ampelicida form f. euvitis pathogenic to V. vinifera and American species and f parthenocissi f. nov. pathogen of Parthenocissus species. At the date, no DNA analysis was performed to support this hypothesis, but these studies confirm the theory that the pathogen is native to American grapes whose hybrids had co-evolved and therefore were more resistant. As mentioned the disease is present in Italy since the end of the nineteenth century, but only the recent outbreak shows that it might be harmful to wine production also in southern regions. Several reasons could be hypothesized for this. First of all, the possibility that strains resistant to the commonly used fungicides have been naturally selected cannot be excluded. The transport of infected material from one vine-growing region to another, may have favored the movement and contact of strains more suitable to the new environmental conditions. The multiplication of the fungus both by gamic and agamic reproduction, makes it particularly able to adapt to variable environmental conditions. In fact, if the gamic multiplication is able to produce strains more suitable to the new environmental conditions, it is with the agamic multiplication that is responsible of the diffusion of these new strains in the environment. P. ampelicida is a homotallic fungus, although it is not entirely clear if the fungus is actually homotallic or pseudotallic, nor what are the genetic mechanisms at the basis of its sexual behavior (Jailloux 1992). Another aspect possibly related to the spread of the disease is the recent changes in the management of powdery and downy mildew chemical control. Some of the chemicals used are also effective against black rot, but with the increased sensitivity towards the environment, and the increasingly restrictive legislation of the European Union towards the use of pesticides, the applications strategies have changed, some large spectrum pesticides like dithiocarbamates, which are very effective against P. ampelicida are less used, and application is carried out more and more specifically on powdery and downy mildew risk stages. Under such conditions, the intervention strategies had little or no effect on black rot. Therefore the conditions suitable for a fast spread of the fungus, in the phenological stages of the vine that are more susceptible to infection is possible, leading to an increase of the damages by this pathogen, helped by the lack of knowledge of the typical symptoms, and therefore to wrong diagnosis, as suggested by (Gessler et al. 2006,2008) In order to clarify some of the possible causes in the recent outbreak in central Italy, a study of the genetic variability of the fungus in the Italian population and in the main growing areas of the world was carried out. Strains obtained from infected grape
40
bunches from the main grapevine European countries and from some North American states, were collected, identified by the analysis of the partial sequences of the ITS1-
ITS2 region, -tubulin and calmodulin genes, and the genetic differences and distances among the strains were measured. Moreover primers to amplify nuclear microsatellites (nSSR) selected at (IBZ) ETH Zurich for P. ampelicida were used to gain information about the genetic variation in the fungal population, measuring heterogeneity and distribution of haplotypes. 2. Materials and methods 2.1 Phyllosticta ampelicida isolation and DNA extraction for phylogenetic analysis.
Pathogen isolation was carried out from different infected tissues: leaf necrotic spots, stem cankers, mummified berries and shrivelled berries. The samples were collected in 2011 and 2012 in all the central and northern Italian grapevine areas in which the disease was reported, in the main European countries where the disease is usually present and in two USA states (Virginia and Pennsylvania) (Tab. 1). Only the samples from Pennsylvania are from Vitis labrusca, while all the others are from Vitis vinifera of international and local varieties. The samples were disinfected with immersion in hydrogen peroxide 10% for few seconds followed by two washes in distilled water for few seconds too. The tissues were sectioned and placed on Petri dishes on malt agar (MA) medium and left for 15-20 days at room temperature. For DNA extraction, monohyphal isolates were obtained from actively growing colonies. In the following way: a small sample of the pathogen mycelium was scratched from the surface of the colony grown on MA; introduced in a 2ml sterilized Eppendorf tube and added with 1.5 ml of distilled sterilized water. The
tube was vortexed for two min. and 30 l of the suspension sprayed on water agar Petri dish (90 mm diameter). A single hypha portion was selected and marked with the aid of a stereomicroscope. When the colony was big enough to be visible, it was transferred to another MA dish. The DNA extraction from the mycelium, was performed with DNeasy Plant Mini Kit (QUIAGEN, Hombrechtikon, Switzerland) according to the manufacturer’s instruction. The amplification of partial ITS1-ITS2 region was carried with ITS4 - ITS5 primers (White et al., 1990), and the PCR cycling parameters applied were: 3 min initial denaturation at 94 °C, 35 cycles of 95 °C for 30 s, annealing for 30 s at 50 °C, extended at 72 °C for 30 s and a final 7 min extensions
was made at 72 °C. The amplification of the -tubulin gene partial sequence, was carried out with Bt2a and Bt2b primers (Glass and Donaldson, 1995) and the thermal profile was the following: 3 min initial denaturation at 94 °C, 35 cycles of 95 °C for 30 s, annealing for 30 s at 50 °C, extended at 72 °C for 30 s and a final 7 min extension was made at 72 °C. The amplification of calmodulin gene was performed with CL1 and CL2A primers (O’Donnel et al., 2000), with the following cycling parameters: 5 min initial denaturation at 94 °C, 35 cycles of 94 °C for 50 s, annealing for 50 s at 55 °C, extended at 72 °C for 1 min and a final 7 min extension was made at 72 °C. Amplicons
41
were detected with an agarose gel (1% w/v) stained with ethidium bromide in 1XTris-acetate EDTA (TAE) buffer and purified using ExoSAP-IT (Usb Corporation) according to the manufacturer’s protocol. The amplicons were sequenced at the Centre for Biotechnological Services (CIBIACI) of University of Florence using an ABI Prism 310 CE. Alignment and manual correction of the sequences were performed by Clustal W (Thompson et al., 1994), while the phylogenetic analyses, editing the Neighbor-Joining trees (Kimura-2 parameters, bootstrap test on 500 replicates) were conducted using MEGA version 5 (Tamura et al., 2011). Sequences of different strains of P. ampelicida (as G. bidwellii) from Vitis vinifera, Partenocissus quinquefolia and Partenocissus tricuspidata and the outgroups sequences were selected from GenBank, in accord with a former work about the molecular characterization of P. ampelicida (as G. bidwellii)
(Wicht et al., 2012). Neofusicoccum parvum -tubulin and calmodulin sequences as outgroup, were selected by BLAST query (Altschul et al., 1990). The gene genealogies from DNA sequences was estimated by a statistical parsimony method using TCS1.21 computer program (Clement et al., 2000), based on Templeton’s parsimony connection limit (Templeton et al., 1992), which generates a haplotype network, the construction of which is allowed by all the possible recombination events. 2.2 DNA extraction for the nuclear microsatellites (nSSR) analyses. The microsatellites analysis was carried out on DNA extracted from mummified berries. The berries had been collected from the same clusters from all the main European vine areas and from USA from which fungal colonies had been obtained (see 2.1 P. ampelicida isolation and DNA extraction for phylogenetic analysis). The DNA extraction was performed according the following steps: all the samples were kept in a 2ml Eppendorf with about 10 small glass spheres 2mm in diameter, stored for at least3 hours in a freezer at – 80°C and lyophilized and ground into powder by the Fast Prep Bio 101 Savant homogenizer, at the following cycle 5.5 m/s for 30 seconds. From the powder, the DNA was extracted with the CTAB DNA extraction modified from Aldrich et al., 1993. PCR amplification was performed in 5 μl reactions containing 2.5 μl 2X Qiagen Multiplex, 0.5 μl of both forward and reverse primers, 0.5 μl Q-Sol 5x, 0.5 μl ddH2O and 1 μl DNA. The primers used for the SSR amplification are reported in Table 2, while the PCR cycle parameters were: 15 min initial denaturation at 95 °C, 37 cycles of 94 °C for 40 s, anneal for 90 s at 55 °C, extended at 72 °C for 90 for 90 s and a final 30 min extensions at 60 °C The amplicons for the SSR analysis were eluted according to the rate 1:50 and sequenced with a 3730xl Genetic Analyzer (Life Technologies, Applied Biosystems); the genotyping was performed with the software Genemapper v4.0 (Life Technologies, Applied biosystems). General estimates of genetic diversity from nSSR data were calculated using SPAGeDi 1.3a (Hardy and Vekemans 2002) and GENEPOP 3.3 (Raymond and Rousset, 1995): number of alleles (N), number of rare alleles (Nrare, freq. < 5%), allele frequency, and expected heterozygosity (He) according to Nei (1987). Statistical significance was determined by Jackknifed estimators (Sokal and Rohlf,
42
1995) after 20,000 permutations. The subsequent phylogeographic analysis was performed by NETWORK 4.6.1.1.software (Bandelt et al., 1999; Forster et al., 2001; Polzin and Daneschmand, 2003).
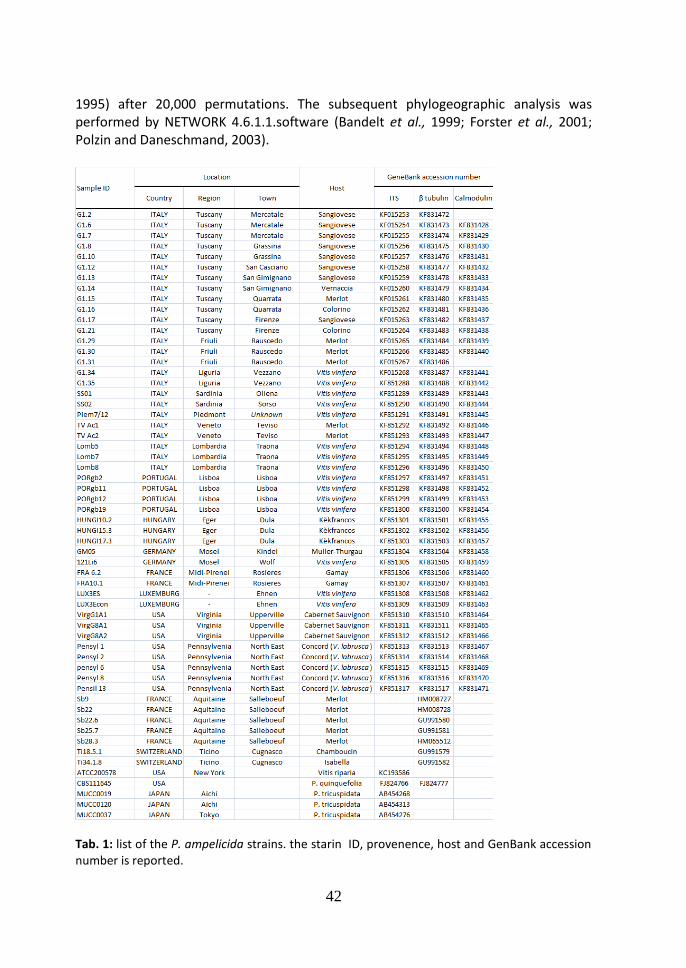
Tab. 1: list of the P. ampelicida strains. the starin ID, provenence, host and GenBank accession number is reported.
43
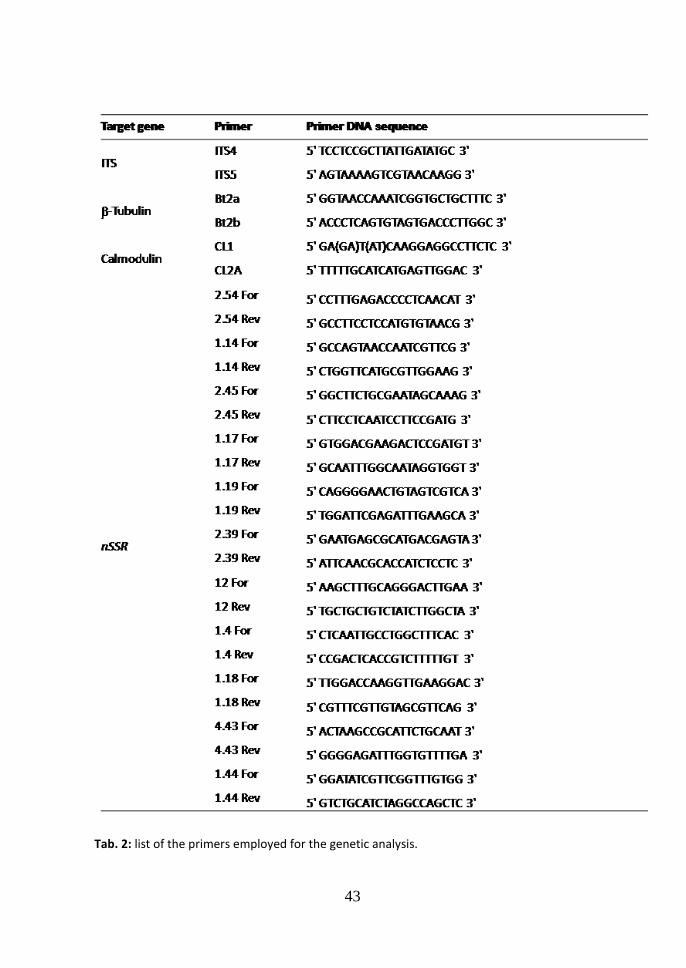
Tab. 2: list of the primers employed for the genetic analysis.
44
3. Results Four Neighbor-Joining trees were elaborated, using the partial sequences of ITS1 - ITS2
region, -tubulin and calmodulin genes with sequences length of 588 bp, 318 bd, 590
bp. The multi locus dataset performed by the partial concatenated sequences of -tubulin and calmodulin, reached a length of 908 bp,. 3.1 ITS Neighbor joining tree. All the strains of P. ampelicida, from the genus Vitis, were grouped in one branch of the tree, while the strains of P. ampelicida from other hosts (Partenocissus quinquefolia and Partenocissus tricuspidata), were grouped in other two branches (Fig. 1). Within the main branch the strains from Vitis were grouped in four different clusters. These results are in accordance with a former study of the genetic variability of the fungus (Wicht et al., 2012) in which only European strains of the pathogen had been included; remarkably the tree in Figure 1 shows a third and a fourth cluster in which two strains from USA (Virginia State – Cluster 3) and one from New York state (Cluster 4) are present. From the analysis of the partial sequences of ITS1-ITS2 region, seven haplotypes were identified and four of them are grouped in cluster 2. The differences among the
haplotypes of cluster 2 are light and consist of one nucleotide substitutions (CT at
the ITS1 position 11) (tab. 3) and one deletion in position 545 (Cgap ITS2). The
difference between cluster 1 and 2, consists in three nucleotide substitutions (TC at
the position 11, GA at the ITS1 position 199; CT at the ITS2 position 559) and one
deletion at the position 545 (Cgap ITS2). The difference between the cluster 1 and 3,
consists in three nucleotide substitutions (GA at the position 199 at the ITS1, CT
at the ITS2 position 474; CT at the ITS2 position 559). The difference between
cluster 1 and 4, consist in five nucleotide substitutions (AT at the position 29 and
GA at the position 199ITS1; CT at the position 515, AG at the position 553 and
CT at the position 559all at ITS2)and one deletion at position 544 (Cgap ITS2). The
difference between cluster 2 and 3 consist in two substitutions (CT at the position
11 at the ITS1 and CT at the ITS2 position 474). The difference between cluster 2
and 4 consists in four substitutions (CT at the position 11 and AT at the position
29ITS1; CT at the position 515, AG at the position 553 at ITS2) and one deletion at
position 544 (Cgap ITS2). The difference between cluster 3 and 4 consists in four
substitutions (AT at the position 29 ITS1; TC at the position 474, CT at the
position 515, AG at the position 553 all at ITS2) and one deletion at position 544
(Cgap ITS2). The average genetic distances (d) among the groups (Maximum Composite Likelihood, complete deletion option) were: d=0.004, between cluster 1 and 2 (99.6% similarity); d=0.006, between cluster 1 and 3 (99.4% similarity); d=0.008, between cluster 1 and 4 (99.2% similarity); d=0.042, between cluster 1 and 5 (95.8% similarity); d=0.054, between cluster 1 and 6 (94.6% similarity); d=0.002, between
45
cluster 2 and 3 (99.8% similarity); d=0.004, between cluster 2 and 4 (99.6% similarity); d=0.038, between cluster 2 and 5 (96.2% similarity); d=0.049, between cluster 2 and 6 (95.1% similarity); d=0.006, between cluster 3 and 4 (99.4% similarity); d=0.040, between cluster 3 and 5 (96.0% similarity); d=0.051, between cluster 3 and 6 (94.9% similarity); d=0.042, between cluster 4 and 5 (95.8% similarity); d=0.049, between cluster 4 and 6 (95.1% similarity); d=0.026, between cluster 5 and 6 (97.4% similarity). According to the parsimony based ITS network generated in TCS (Fig.2), a central node of the network is occupied by the strain SS01, which is included in cluster 2 in the Neighbor-Joining tree, while the two main clusters are situated in the periphery of the network. The cluster 3, which comprises the two American strains from Virginia, is collocated peripherally too. From cluster 1 to the central node SS01, one step is missed.
3.2 -tubulin Neighbor-Joining tree.
According to the -tubulin gene partial sequences five haplotypes were found (Fig.3). The Neighbor-Joining tree of the P. ampelicida strain sequences, both from Vitis vinifera and Partenocissus quinquefolia resulted in four clusters. The differences
between cluster 1 and 2 consist in one substitution (TC at the position 150 of the codon sequence) (Tab. 4). The difference between cluster 1 and 3 consists in two
substitutions (TC at the position 150 in the codon sequence and AT at the position 169). The difference between cluster 2 and 3 consists in one substitution
(AT at the position 169). Two haplotypes were identified in cluster 2. The difference
consists in one substitution (TC at the position 66). The average genetic distance among the groups (Maximum Composite Likelihood, complete deletion option) was: d=0.006, between cluster 1 and 2 (99.4% similarity); d=0.003, between cluster 1 and 3 (99.7% similarity); d=0.154, between cluster 1 and 4 (84.6% similarity); d=0.003, between cluster 2 and 3 (99.7% similarity); d=0.156, between cluster 2 and 4 (84.4% similarity); d=0.149, between cluster 3 and 4 (85.1% similarity). In the parsimony
based -tubulin network generated in TCS (Fig. 4), the central node of the network is occupied by cluster 3 which comprises the main number of the strains analyzed (57.14%), while two strains of this cluster form a different haplotype connected in the network only with cluster 3. 3.3 Calmodulin Neighbor-Joining tree. In the Neighbor-Joining tree of the calmodulin partial sequence, five clusters were identified (Fig. 5). This tree was elaborated using only the calmodulin sequence from strains by Vitis vinifera as in GenBank those from other hosts were not available. Seven were the haplotypes found (tab. 5). The differences between cluster 1 and 2
consist in one substitution (CT at the position 81), while inside the cluster a second
haplotype (Pensyl8 strain) presents a deletion at the position 10 (Cgap). The
difference between cluster 1 and 3 consists in four substitutions (CT at the position
46
81, GC at the position 160, CA at the position 165, GA at the position 193). The
difference between cluster 1 and 4 consists in two substitutions (CT at the position
81, CT at the position 82). In this last cluster two haplotypes are present with one
deletion at the position 10 (Cgap). Cluster 5 consists in only one strain SS02 and the
differences between cluster 1 and 5 consist in two substitutions (CG at the position
7, CT at the position 81). The differences between cluster 2 and 3 consist in three
substitutions (GC at the position 160, CA at the position 165, GA at the position 193). The difference between cluster 2 and 4 consists in one substitution (C⇔T at the position 80), while the difference between cluster 2 and 5 consists in one substitution (C⇔G at the position 7). The differences between cluster 3 and 4 consist in four substitutions (C⇔T at the position 82, C⇔G at the position 160, A⇔C at the position 165 and A⇔G at the position 193); the differences between cluster 3 and 5 consist in four substitution too (C⇔G at the position 7 and 160, A⇔C at the position 165 and A⇔G at the position 193). The differences between cluster 4 and 5 consist in two substitutions (C⇔G at the position 7 and T⇔C at the position 82). The average genetic distance among the groups (Maximum Composite Likelihood, complete deletion option) were: d=0.0018, between cluster 1 and 2 (99.82% similarity); d=0.0071, between cluster 1 and 3 (99.29% similarity), d=0.0035, between cluster 1 and 4 (99.65% similarity); d=0.0035, between cluster 1 and 5 (99.65% similarity); d=0.0053, between cluster 2 and 3 (99.47% similarity); d=0.0018, between cluster 2 and 4 (99.82% similarity); d=0.0018, between cluster 2 and 5 (99.82% similarity); d=0.0071, between cluster 3 and 4 (99.29% similarity); d=0.0071, between cluster 3 and 5 (99.29% similarity); d=0.0035, between cluster 4 and 5 (99.65% similarity). In the calmodulin network generated in TCS (Fig. 6), the central node is occupied by cluster 2, while the most distant haplotypes, from the core of the network, are included in cluster 3, with two steps missed. Also in this case the strains were American ones. Other two peripheral haplotypes are from America too. All the three trees gave a high number of bootstrap with values greater than 63, indicating that all the phylogenetic trees had a good resolution. The comparison of the
-tubulin and calmodulin trees (the partial sequences comparison of two well conserved genes) shows that the most of the strains grouped in the two main clusters
of the -tubulin Neighbor-Joining tree, keep their group identity in the calmodulin
Neighbor-Joining tree. Three strains from -tubulin cluster 3, swap to calmodulin cluster 1, while 1 from cluster 1 moves to calmodulin cluster 2. Four American strains
from -tubulin cluster 3, form cluster 3 and 5 in the calmodulin tree, while the four
strains which form the -tubulin cluster 2, swap one in cluster one, two in cluster 2 and one forms a separate cluster in the calmodulin tree. 3.4 Multi locus Neighbor-Joining tree. The Neighbor Joining tree results by the multi locus dataset show that all the strains are divided in four main groups but 21 strains out off 44 (47.72%) are grouped in only one cluster (cluster 2) (Fig. 7). Two other clusters (including two strains each) form
47
cluster 3 and 4. These two clusters comprise four strains from USA (cluster 3 Pennsylvania 2 and 6; cluster 4 Virginia G8, A1 and A2). Nineteen strains out of 44 (43.18%), although their differences are low, are divided in seven sub clusters. Actually, the bootstrap values of this last sub-tree vary from 10 to 51. According to a geographical view, on this sub-tree, the strains from Hungary, and the North-East Italian regions are grouped all together with the strains from Luxembourg and two American strains (VirginiaG1A1 and Pensyl13). Two strains from Pennsylvania (Pensyl1 and 8) are grouped together and with a strain from France (Fra10.1). The remaining 5 strains don’t form any group, and remain single. The TCS parsimony network elaborated from the multi locus dataset (Fig. 8), is more complex than the former: two are the main nodes, one is cluster 8 and the second one is the node of the strains from France. They are directly connected each other and connected by intermediate nodes. The most distant node, from the network, is cluster 10, which comprises two American strains again. 3.5 Genetic variability as revealed using nuclear microsatellites (nSSR). The nuclear microsatellite analysis allowed to detect 56 haplotypes (H) (tab. 6). Five haplotypes comprise 59.38% of the whole population. H9 was found in 111 samples (26.37%); H38 was found in 58 samples (frequency 13.78%); H14 was present in 35 samples (frequency 8.31%). Both H29 and H55 were found in 23 samples (frequency 5.46%). Of the remaining haplotypes only nine (H5, H10, H13, H19, H23, H30, H39, H45, H46) reached a frequency greater than 1%, ranging from 5 to 19. The remaining 42 haplotypes, 75% of the total amount, resulted in a frequency lower than 1%, meaning that almost the half of the haplotype population were found from 1 to 4 times. In all the localities investigated in this study, two sets of haplotypes were found: shared haplotypes and unique ones (tab 7). All the American haplotypes are unique and no haplotype shared with the European populations was found among them. H9 and H38 are the haplotypes most widespread in Europe, both found in 7 of the total 14 localities. Despite of the high number of samples collected in Tuscany, H38 was not found here but in Friuli, Veneto, Piedmont, France, Germany, Portugal and Hungary, while H9 was found in Italy in all the Tuscan localities, in Liguria, in Lombardy and in Sardinia, and it was also found in France and Portugal. A relevant percentage of unique haplotypes, 42.42%, was found in the Tuscan population which comprises 152 samples from Florence city and 49 from the rest of the region, for a total amount of 201. High numbers of unique haplotypes were found among the Liguria and the Luxembourg populations where 4 over 9 (Liguria), and all of the 5 samples (Luxemburg) were unique. The analysis of the frequency of the alleles among the haplotypes inside the different populations (tab. 8) demonstrated that the highest “mean diversity population” is that of the American and of the Florence strains and it confirms how the two populations are those with the highest genetic variability. On the 36 total alleles found in the American samples, 3 were the rare alleles, while in the Florence samples, the rare alleles were 8 on the total amount of 28.
48
The geographical network (Fig. 9) (Network software) shows how H9, the more common haplotype, was found predominantly in Italy, especially in Tuscany, and in Portugal and France, while the second largest haplotype, H38, was found predominantly in Europe: Hungary, France, Germany and Portugal. The other more frequent haplotypes, H14, H29 and H55 were found in the main Italian vine regions, while H14 was found also in France. In the geographical network, it is evident that the American haplotypes are separated from the European ones and some haplotypes from Florence (H19, H25, H28, H54, H55) and those from Sardinia (H56) are the intermediate ones from the American and the remaining European ones. 4. Discussion
Studies on P. ampelicida in 1946 and 1948 by Luttrell, showed differences among the strains of the pathogen isolated from different hosts of the Vitaceae family. Since then it was clear that the fungus had an host specificity inside the botanical family, although no significant morphological differences were found. Nevertheless in those studies only a pathogenicity tests approach was performed to hypothesize the presence of three different forms. A further confirmation of the existence of differences within the P. ampelicida complex, came in 2012 from Wicht et al., in 2013 by Zhang et al., who performed a typification and a phylogenetic study of Phyllosticta ampelicida. The first study confirmed a genetic variability of the fungus, but the differences found did not suggest the existence of different species. The second paper, Zhang et al., 2013, confirmed that what was up to now called Phyllosticta ampelicida (syn. Guignardia bidwellii) comprises different species, including P. ampelicida and P. parthenocissi. This study, although it is not aimed to the detection of different species of P. ampelicida, confirms a genetic variability of the fungus. The Analysis of ITS1 -ITS2 regions, according a minimum evolution criterion, resulted in a Neighbor Joining tree (Fig. 1) showing two different main clusters: one grouping all the P. ampelicida/Guignardia bidwellii from host species belonging to the genus Vitis, and a second one in which the strains isolated from Parthenocissus spp. are included. Although the similarity is higher than 90%, the genetic distance between the two clusters ranges from 63.8% to 85.4%, which is a genetic distance slightly lower than the one running between the P. ampelicida/Guignardia bidwellii from the genus Vitis and the outgroups (different species of Guignardia: G. vaccinii and G. mangiferae) (Wicht et al. 2012). Actually in this last case the similarity ranges from 90.9% to 93.4% and the respective distance ranges from 9.1% to 6.6%. When the partial sequence of a more conserved gene like
-tubulin is analyzed, the genetic distance between the P. ampelicida group from Vitis, and the strain from Parthenocissus quinquefolia was higher, ranging from 14.9% to 15.6%. Those values are comparable to the genetic distance among the pathogen from Vitis hosts and other Guignardia spp. employed like outgroups, which ranged from 17.4% to 23.8%. According to these observations the high genetic distance between the strains from different hosts let hypothesize more than a simple host specificity of the pathogen or the existence of forms as supported by Luttrell (1946, 1948). The
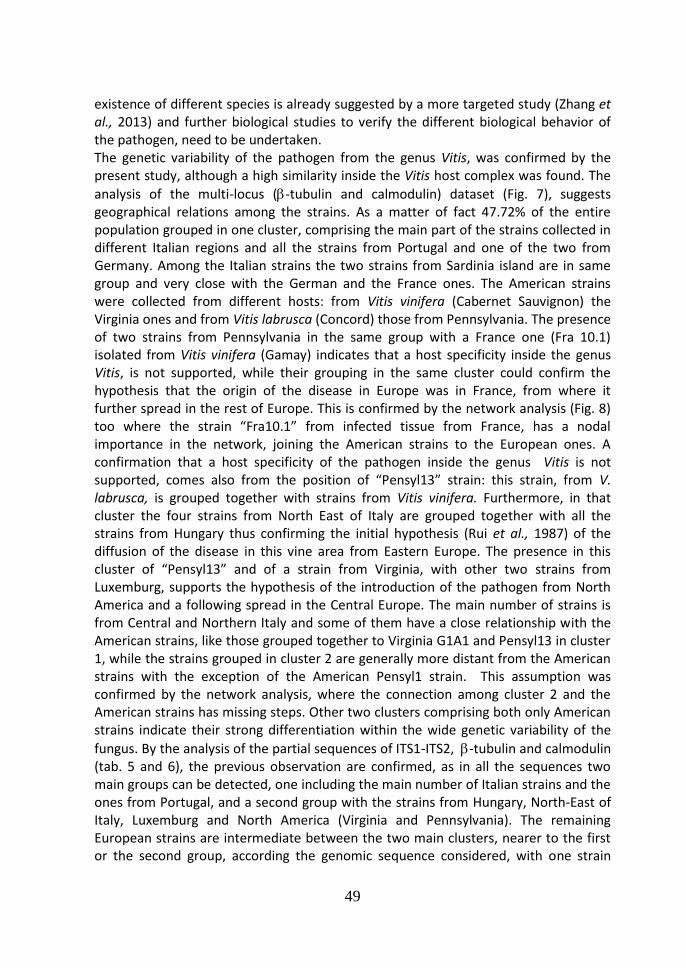
49
existence of different species is already suggested by a more targeted study (Zhang et al., 2013) and further biological studies to verify the different biological behavior of the pathogen, need to be undertaken. The genetic variability of the pathogen from the genus Vitis, was confirmed by the present study, although a high similarity inside the Vitis host complex was found. The
analysis of the multi-locus (-tubulin and calmodulin) dataset (Fig. 7), suggests geographical relations among the strains. As a matter of fact 47.72% of the entire population grouped in one cluster, comprising the main part of the strains collected in different Italian regions and all the strains from Portugal and one of the two from Germany. Among the Italian strains the two strains from Sardinia island are in same group and very close with the German and the France ones. The American strains were collected from different hosts: from Vitis vinifera (Cabernet Sauvignon) the Virginia ones and from Vitis labrusca (Concord) those from Pennsylvania. The presence of two strains from Pennsylvania in the same group with a France one (Fra 10.1) isolated from Vitis vinifera (Gamay) indicates that a host specificity inside the genus Vitis, is not supported, while their grouping in the same cluster could confirm the hypothesis that the origin of the disease in Europe was in France, from where it further spread in the rest of Europe. This is confirmed by the network analysis (Fig. 8) too where the strain “Fra10.1” from infected tissue from France, has a nodal importance in the network, joining the American strains to the European ones. A confirmation that a host specificity of the pathogen inside the genus Vitis is not supported, comes also from the position of “Pensyl13” strain: this strain, from V. labrusca, is grouped together with strains from Vitis vinifera. Furthermore, in that cluster the four strains from North East of Italy are grouped together with all the strains from Hungary thus confirming the initial hypothesis (Rui et al., 1987) of the diffusion of the disease in this vine area from Eastern Europe. The presence in this cluster of “Pensyl13” and of a strain from Virginia, with other two strains from Luxemburg, supports the hypothesis of the introduction of the pathogen from North America and a following spread in the Central Europe. The main number of strains is from Central and Northern Italy and some of them have a close relationship with the American strains, like those grouped together to Virginia G1A1 and Pensyl13 in cluster 1, while the strains grouped in cluster 2 are generally more distant from the American strains with the exception of the American Pensyl1 strain. This assumption was confirmed by the network analysis, where the connection among cluster 2 and the American strains has missing steps. Other two clusters comprising both only American strains indicate their strong differentiation within the wide genetic variability of the
fungus. By the analysis of the partial sequences of ITS1-ITS2, -tubulin and calmodulin (tab. 5 and 6), the previous observation are confirmed, as in all the sequences two main groups can be detected, one including the main number of Italian strains and the ones from Portugal, and a second group with the strains from Hungary, North-East of Italy, Luxemburg and North America (Virginia and Pennsylvania). The remaining European strains are intermediate between the two main clusters, nearer to the first or the second group, according the genomic sequence considered, with one strain
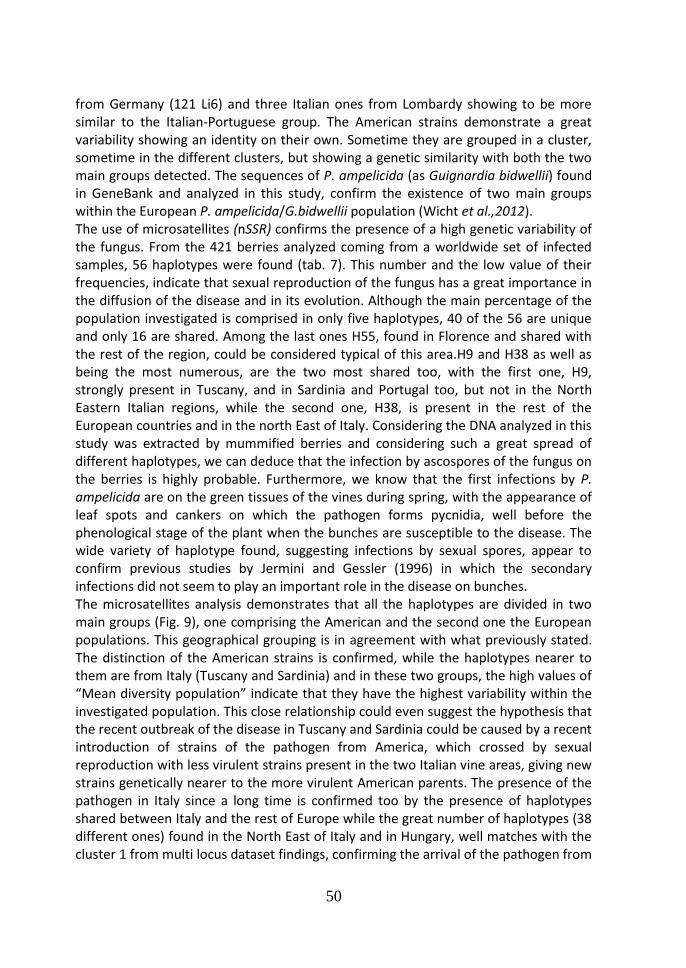
50
from Germany (121 Li6) and three Italian ones from Lombardy showing to be more similar to the Italian-Portuguese group. The American strains demonstrate a great variability showing an identity on their own. Sometime they are grouped in a cluster, sometime in the different clusters, but showing a genetic similarity with both the two main groups detected. The sequences of P. ampelicida (as Guignardia bidwellii) found in GeneBank and analyzed in this study, confirm the existence of two main groups within the European P. ampelicida/G.bidwellii population (Wicht et al.,2012). The use of microsatellites (nSSR) confirms the presence of a high genetic variability of the fungus. From the 421 berries analyzed coming from a worldwide set of infected samples, 56 haplotypes were found (tab. 7). This number and the low value of their frequencies, indicate that sexual reproduction of the fungus has a great importance in the diffusion of the disease and in its evolution. Although the main percentage of the population investigated is comprised in only five haplotypes, 40 of the 56 are unique and only 16 are shared. Among the last ones H55, found in Florence and shared with the rest of the region, could be considered typical of this area.H9 and H38 as well as being the most numerous, are the two most shared too, with the first one, H9, strongly present in Tuscany, and in Sardinia and Portugal too, but not in the North Eastern Italian regions, while the second one, H38, is present in the rest of the European countries and in the north East of Italy. Considering the DNA analyzed in this study was extracted by mummified berries and considering such a great spread of different haplotypes, we can deduce that the infection by ascospores of the fungus on the berries is highly probable. Furthermore, we know that the first infections by P. ampelicida are on the green tissues of the vines during spring, with the appearance of leaf spots and cankers on which the pathogen forms pycnidia, well before the phenological stage of the plant when the bunches are susceptible to the disease. The wide variety of haplotype found, suggesting infections by sexual spores, appear to confirm previous studies by Jermini and Gessler (1996) in which the secondary infections did not seem to play an important role in the disease on bunches. The microsatellites analysis demonstrates that all the haplotypes are divided in two main groups (Fig. 9), one comprising the American and the second one the European populations. This geographical grouping is in agreement with what previously stated. The distinction of the American strains is confirmed, while the haplotypes nearer to them are from Italy (Tuscany and Sardinia) and in these two groups, the high values of “Mean diversity population” indicate that they have the highest variability within the investigated population. This close relationship could even suggest the hypothesis that the recent outbreak of the disease in Tuscany and Sardinia could be caused by a recent introduction of strains of the pathogen from America, which crossed by sexual reproduction with less virulent strains present in the two Italian vine areas, giving new strains genetically nearer to the more virulent American parents. The presence of the pathogen in Italy since a long time is confirmed too by the presence of haplotypes shared between Italy and the rest of Europe while the great number of haplotypes (38 different ones) found in the North East of Italy and in Hungary, well matches with the cluster 1 from multi locus dataset findings, confirming the arrival of the pathogen from
51
East of Europe to Italy. The high rate of different haplotypes on the total samples amount found in France (52.17%), suggest strongly that the fungus arrived in Europe in France for the first time. The American origin of the pathogen is underlined by the same high rate (38.23%) of haplotypes variability found in Virginia, as expected in the land of origin. This study demonstrates the importance of the sexual reproduction in the spread of the pathogen and in the outbreak of the disease. It confirms that the origin of the pathogens is in North America and that the first diffusion in Europe was in France. It suggests that the pathogen was introduced in the North East of Italy from East of Europe, while there is a possibility that the recent outbreaks of the disease in some grapevine Italian areas in which the disease was never present before is the result of a crossbreed between old Italian less virulent strains and strains from North America, resulting in new more virulent strains. The proximity of the haplotypes found in Europe with those from North East of Italy and some from Tuscany too, suggests that in these Italian vine areas the disease spread from the North of Europe and France, and that these strains may be more ancient than the ones which caused the devastating outbreaks of the disease in last 3 years in some Italian vine areas.
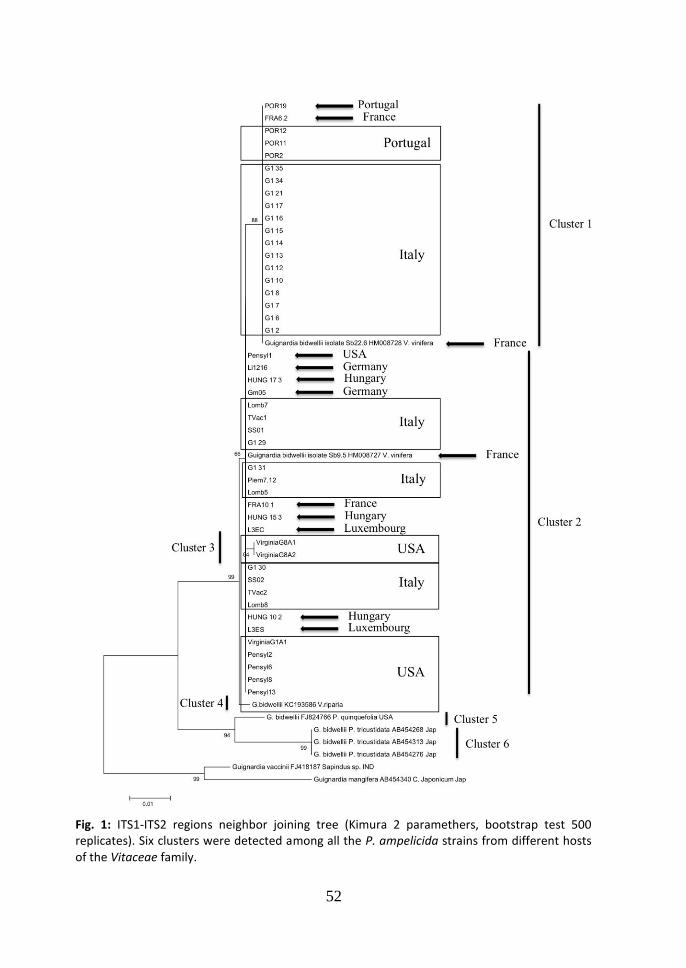
52
Fig. 1: ITS1-ITS2 regions neighbor joining tree (Kimura 2 paramethers, bootstrap test 500 replicates). Six clusters were detected among all the P. ampelicida strains from different hosts of the Vitaceae family.
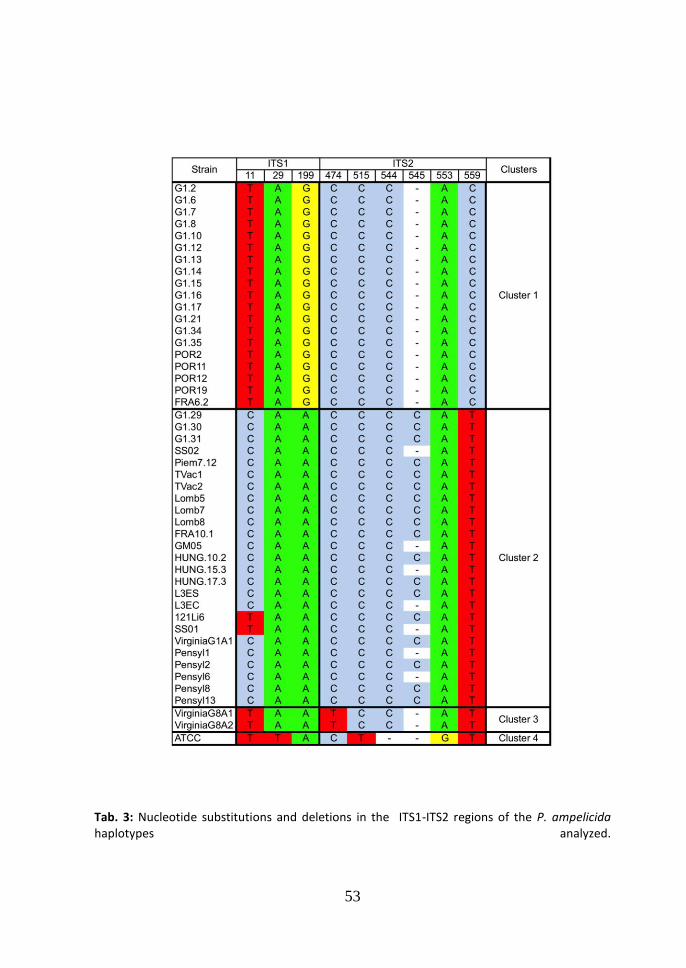
53
Tab. 3: Nucleotide substitutions and deletions in the ITS1-ITS2 regions of the P. ampelicida haplotypes analyzed.
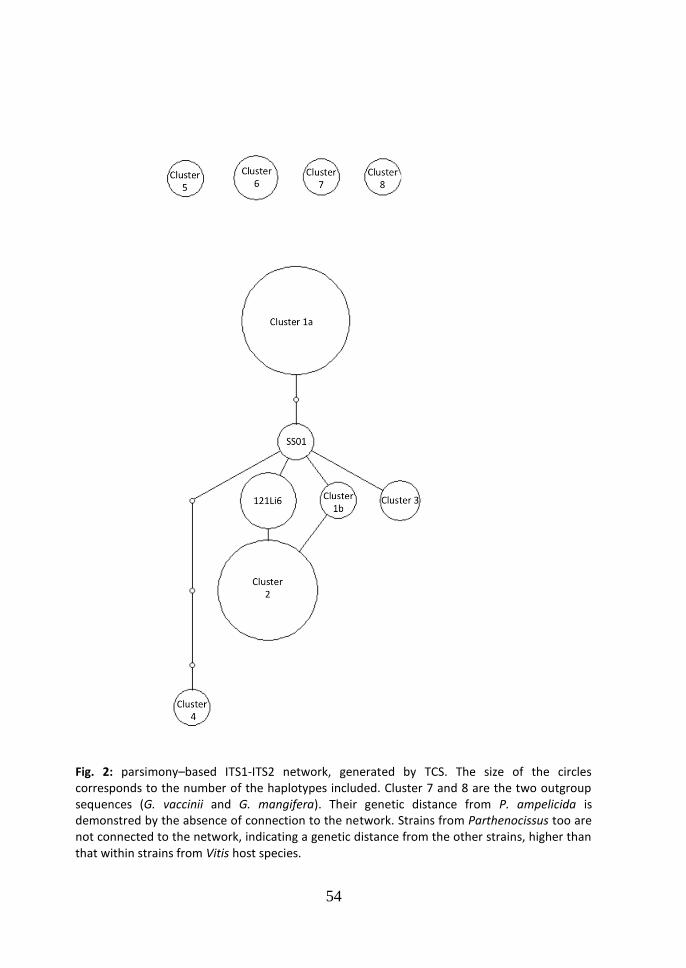
54
Fig. 2: parsimony–based ITS1-ITS2 network, generated by TCS. The size of the circles corresponds to the number of the haplotypes included. Cluster 7 and 8 are the two outgroup sequences (G. vaccinii and G. mangifera). Their genetic distance from P. ampelicida is demonstred by the absence of connection to the network. Strains from Parthenocissus too are not connected to the network, indicating a genetic distance from the other strains, higher than that within strains from Vitis host species.
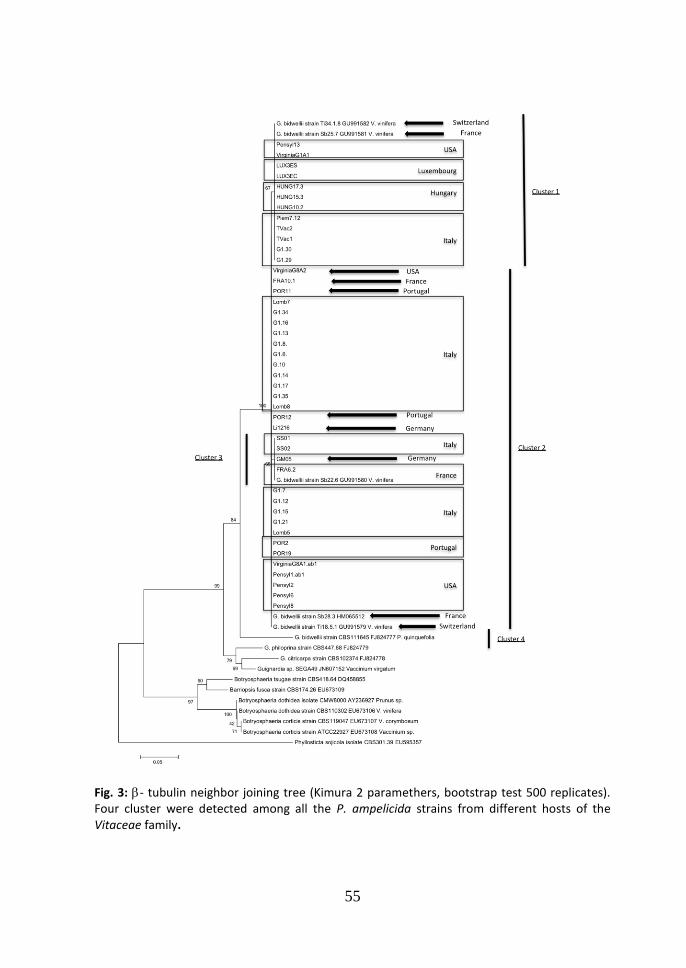
55
Fig. 3: - tubulin neighbor joining tree (Kimura 2 paramethers, bootstrap test 500 replicates). Four cluster were detected among all the P. ampelicida strains from different hosts of the Vitaceae family.
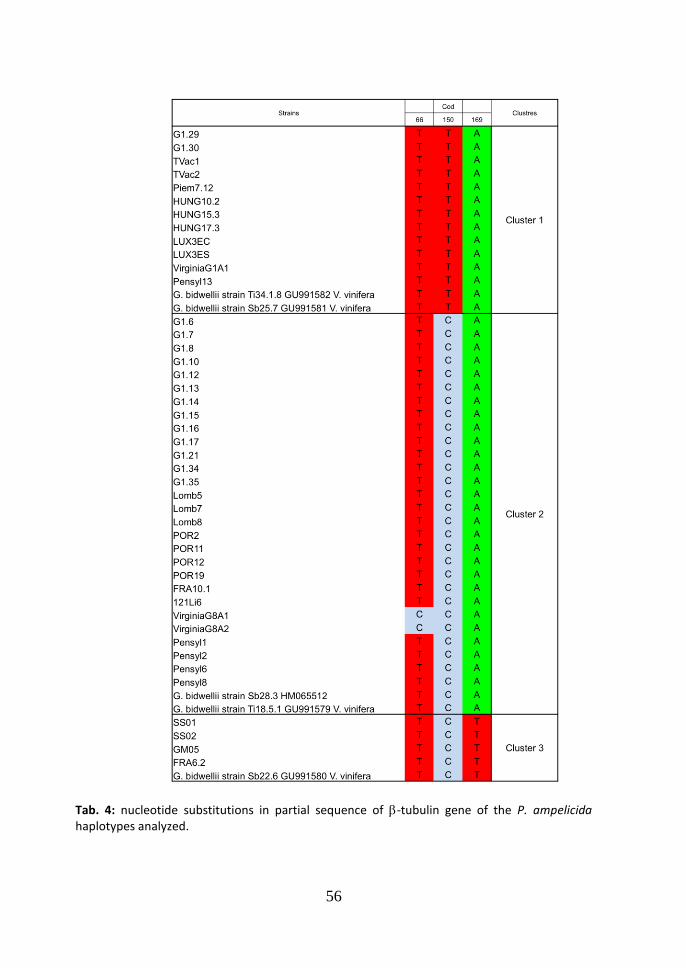
56
Tab. 4: nucleotide substitutions in partial sequence of -tubulin gene of the P. ampelicida haplotypes analyzed.
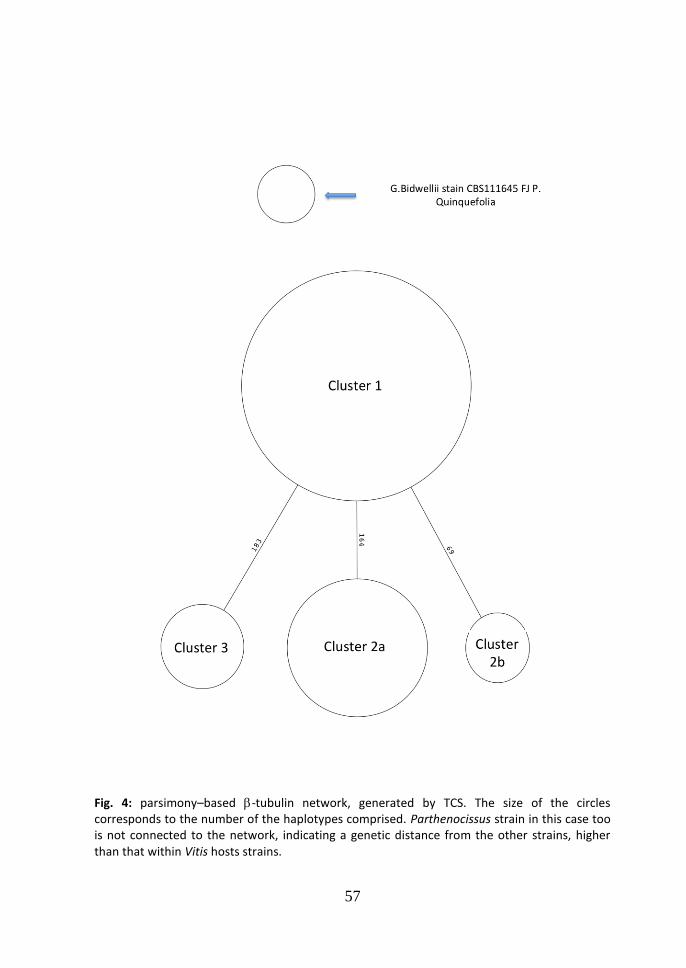
57
Fig. 4: parsimony–based -tubulin network, generated by TCS. The size of the circles corresponds to the number of the haplotypes comprised. Parthenocissus strain in this case too is not connected to the network, indicating a genetic distance from the other strains, higher than that within Vitis hosts strains.
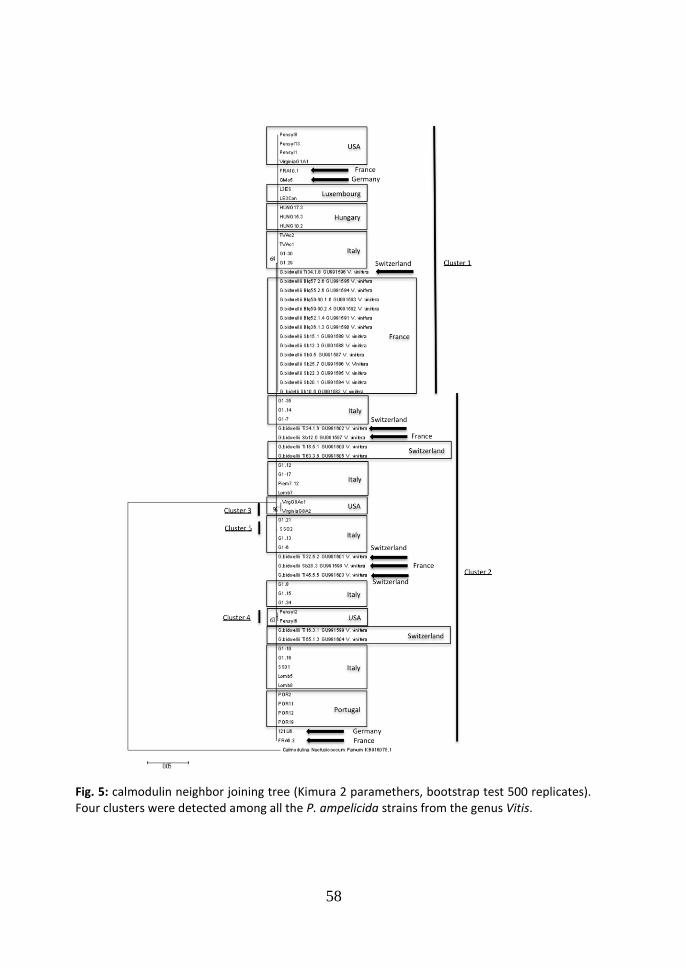
58
Fig. 5: calmodulin neighbor joining tree (Kimura 2 paramethers, bootstrap test 500 replicates). Four clusters were detected among all the P. ampelicida strains from the genus Vitis.
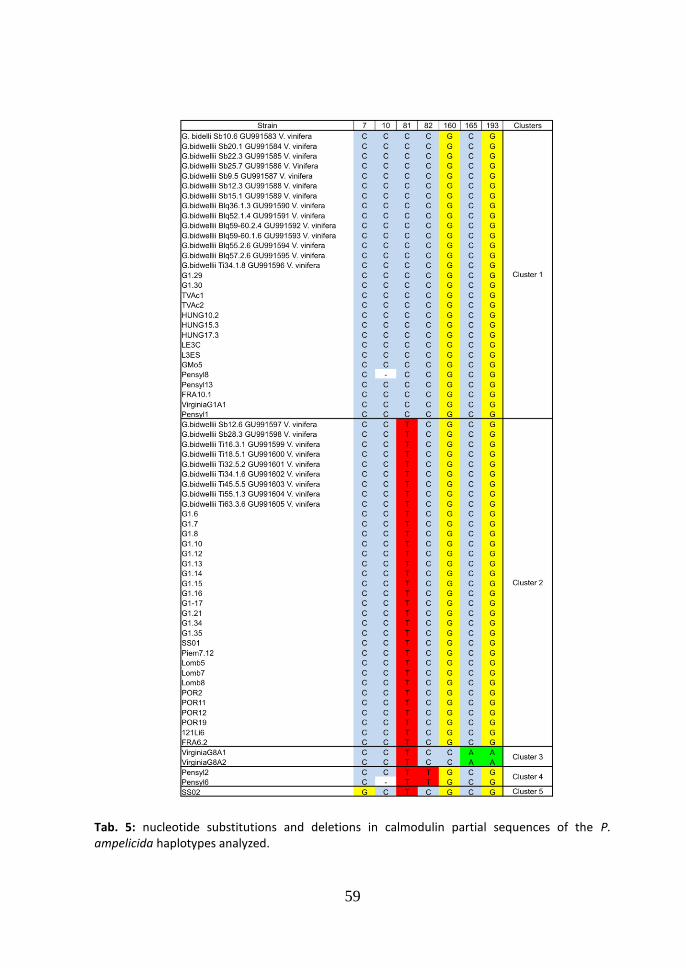
59
Tab. 5: nucleotide substitutions and deletions in calmodulin partial sequences of the P. ampelicida haplotypes analyzed.
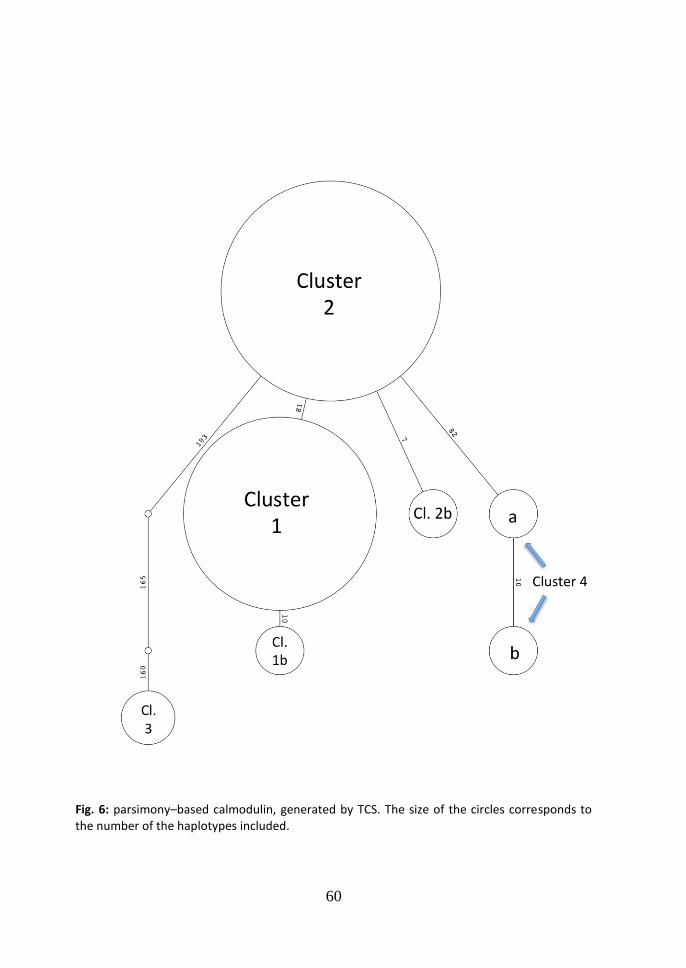
60
Fig. 6: parsimony–based calmodulin, generated by TCS. The size of the circles corresponds to the number of the haplotypes included.
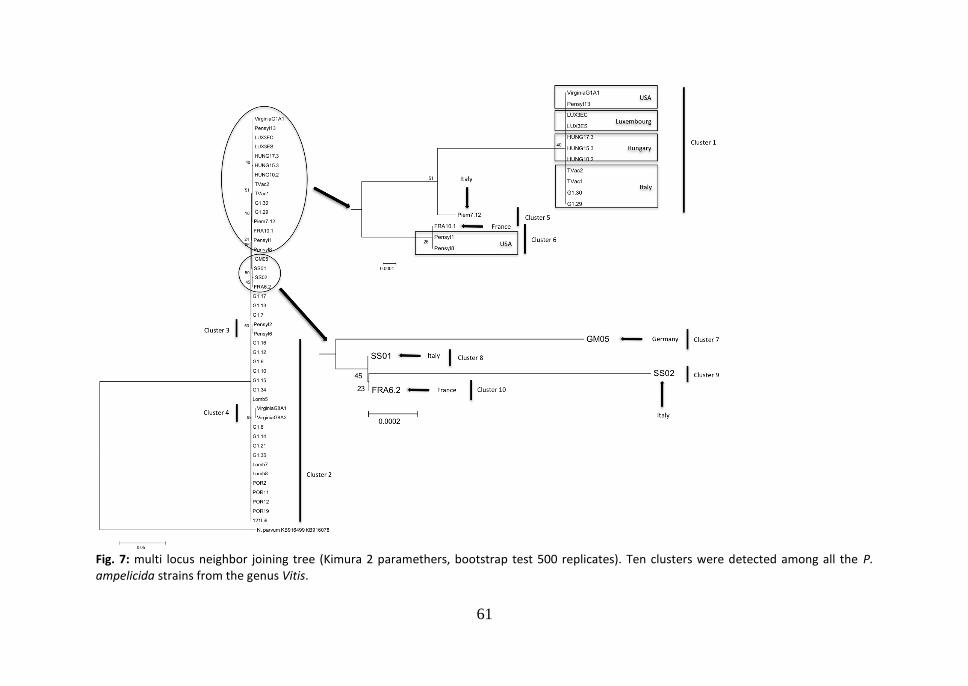
61
Fig. 7: multi locus neighbor joining tree (Kimura 2 paramethers, bootstrap test 500 replicates). Ten clusters were detected among all the P. ampelicida strains from the genus Vitis.
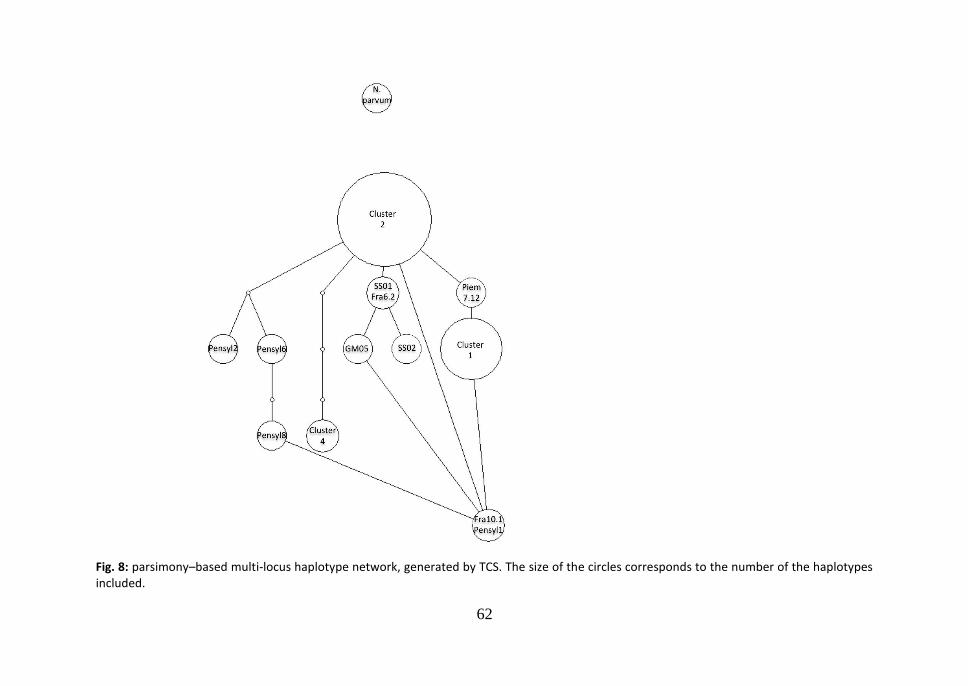
62
Fig. 8: parsimony–based multi-locus haplotype network, generated by TCS. The size of the circles corresponds to the number of the haplotypes included.
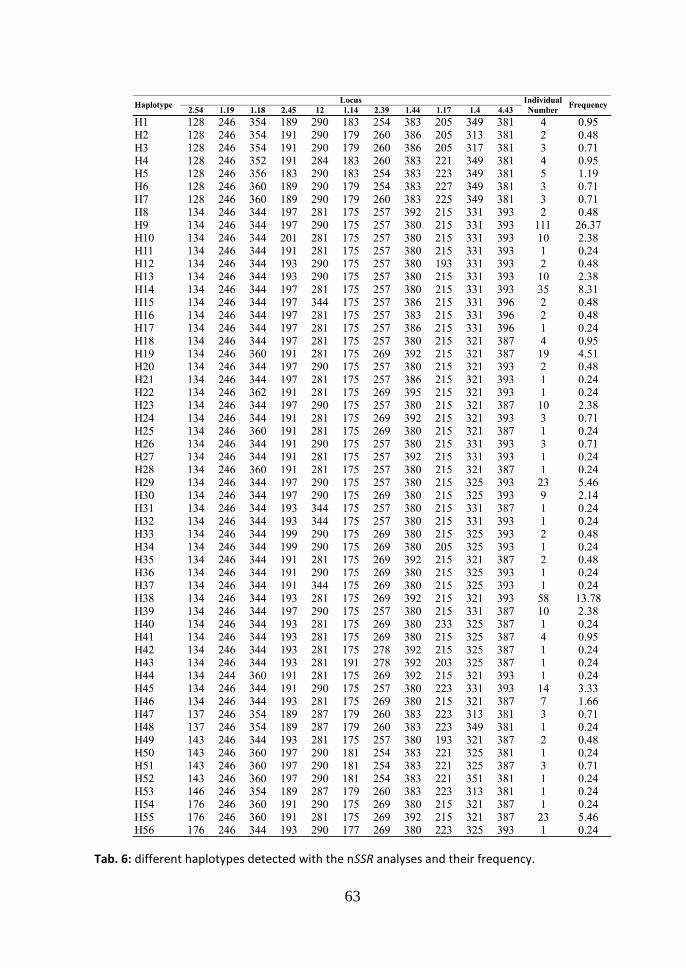
63
Tab. 6: different haplotypes detected with the nSSR analyses and their frequency.
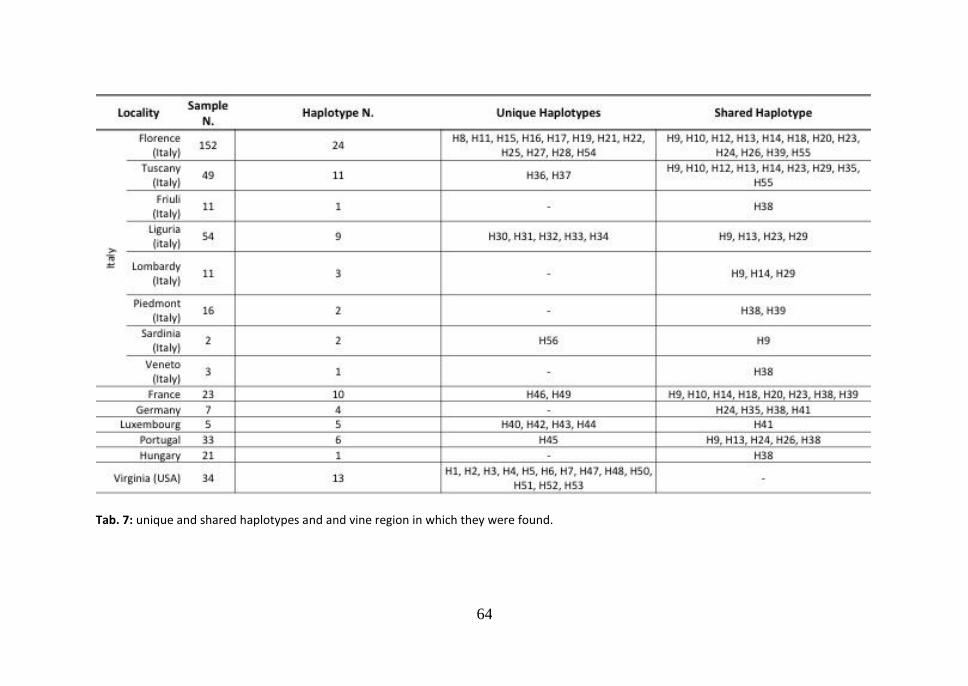
64
Tab. 7: unique and shared haplotypes and and vine region in which they were found.
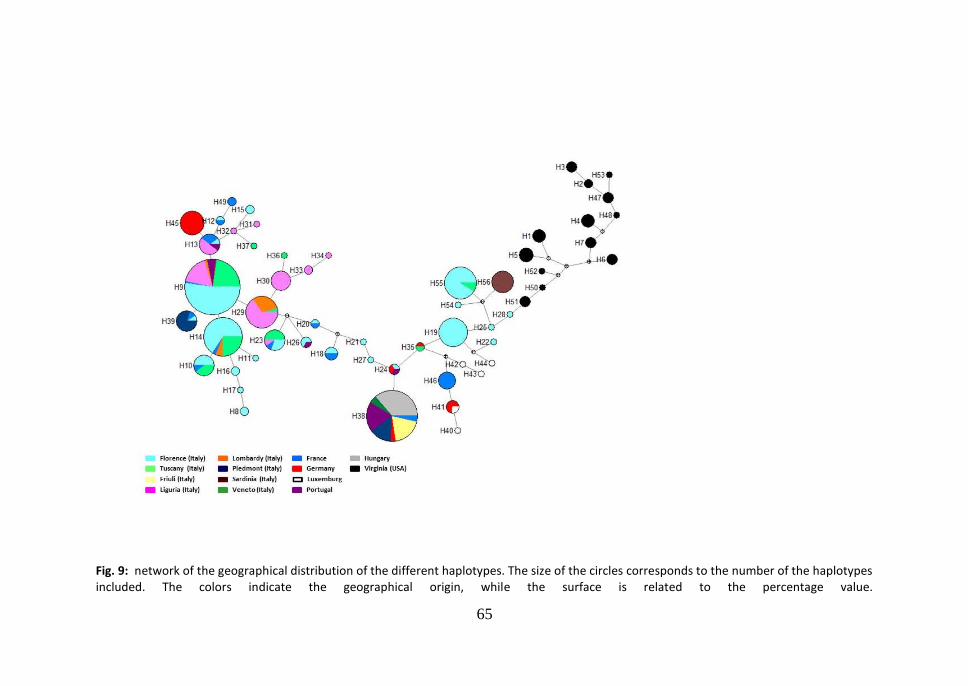
65
Fig. 9: network of the geographical distribution of the different haplotypes. The size of the circles corresponds to the number of the haplotypes included. The colors indicate the geographical origin, while the surface is related to the percentage value.
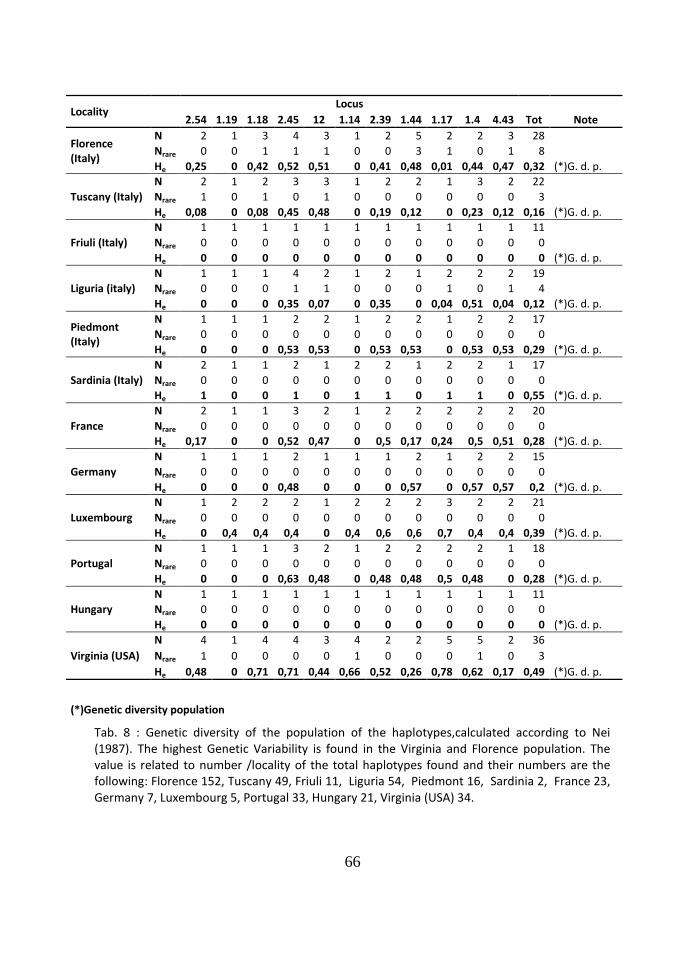
66
Locality Locus
2.54 1.19 1.18 2.45 12 1.14 2.39 1.44 1.17 1.4 4.43 Tot Note
Florence (Italy)
N 2 1 3 4 3 1 2 5 2 2 3 28
Nrare 0 0 1 1 1 0 0 3 1 0 1 8
He 0,25 0 0,42 0,52 0,51 0 0,41 0,48 0,01 0,44 0,47 0,32 (*)G. d. p.
Tuscany (Italy)
N 2 1 2 3 3 1 2 2 1 3 2 22
Nrare 1 0 1 0 1 0 0 0 0 0 0 3
He 0,08 0 0,08 0,45 0,48 0 0,19 0,12 0 0,23 0,12 0,16 (*)G. d. p.
Friuli (Italy)
N 1 1 1 1 1 1 1 1 1 1 1 11
Nrare 0 0 0 0 0 0 0 0 0 0 0 0
He 0 0 0 0 0 0 0 0 0 0 0 0 (*)G. d. p.
Liguria (italy)
N 1 1 1 4 2 1 2 1 2 2 2 19
Nrare 0 0 0 1 1 0 0 0 1 0 1 4
He 0 0 0 0,35 0,07 0 0,35 0 0,04 0,51 0,04 0,12 (*)G. d. p.
Piedmont (Italy)
N 1 1 1 2 2 1 2 2 1 2 2 17
Nrare 0 0 0 0 0 0 0 0 0 0 0 0
He 0 0 0 0,53 0,53 0 0,53 0,53 0 0,53 0,53 0,29 (*)G. d. p.
Sardinia (Italy)
N 2 1 1 2 1 2 2 1 2 2 1 17
Nrare 0 0 0 0 0 0 0 0 0 0 0 0
He 1 0 0 1 0 1 1 0 1 1 0 0,55 (*)G. d. p.
France
N 2 1 1 3 2 1 2 2 2 2 2 20
Nrare 0 0 0 0 0 0 0 0 0 0 0 0
He 0,17 0 0 0,52 0,47 0 0,5 0,17 0,24 0,5 0,51 0,28 (*)G. d. p.
Germany
N 1 1 1 2 1 1 1 2 1 2 2 15
Nrare 0 0 0 0 0 0 0 0 0 0 0 0
He 0 0 0 0,48 0 0 0 0,57 0 0,57 0,57 0,2 (*)G. d. p.
Luxembourg
N 1 2 2 2 1 2 2 2 3 2 2 21
Nrare 0 0 0 0 0 0 0 0 0 0 0 0
He 0 0,4 0,4 0,4 0 0,4 0,6 0,6 0,7 0,4 0,4 0,39 (*)G. d. p.
Portugal
N 1 1 1 3 2 1 2 2 2 2 1 18
Nrare 0 0 0 0 0 0 0 0 0 0 0 0
He 0 0 0 0,63 0,48 0 0,48 0,48 0,5 0,48 0 0,28 (*)G. d. p.
Hungary
N 1 1 1 1 1 1 1 1 1 1 1 11
Nrare 0 0 0 0 0 0 0 0 0 0 0 0
He 0 0 0 0 0 0 0 0 0 0 0 0 (*)G. d. p.
Virginia (USA)
N 4 1 4 4 3 4 2 2 5 5 2 36
Nrare 1 0 0 0 0 1 0 0 0 1 0 3
He 0,48 0 0,71 0,71 0,44 0,66 0,52 0,26 0,78 0,62 0,17 0,49 (*)G. d. p.
(*)Genetic diversity population
Tab. 8 : Genetic diversity of the population of the haplotypes,calculated according to Nei (1987). The highest Genetic Variability is found in the Virginia and Florence population. The value is related to number /locality of the total haplotypes found and their numbers are the following: Florence 152, Tuscany 49, Friuli 11, Liguria 54, Piedmont 16, Sardinia 2, France 23, Germany 7, Luxembourg 5, Portugal 33, Hungary 21, Virginia (USA) 34.
67
References
1. Aldrich J. and Cullis C. A., (1993). RAPD analysis in Flax: Optimization of yeld and reproducibility using klentaq1 DNA polymerase, chelex 100 and gel purification of genomic DNA. Plant Molecular Biology Reporter 11(2) 128-141.
2. Altschul S.F., Gish W., Miller W., Myers E.W., Lipman D. J., (1990). Basic local alignment search tool. Journal of Molecular Biology 215:403-410
3. Bandelt H. J., Forster P., Rohl A. (1999). Median-joining networks for inferring intraspecific phylogenies. Molecular Biology and Evolution 16(1):37-48
4. Becker C. M., Pearson R. C., (1996). Black rot lesions on overwintered canes of Euvitis supply conidia of Guignardia bidwellii for primary inoculum in spring. Plant disease 80(1):24-27.
5. Clement, M., D. Posada and K. A. Crandall (2000). TCS: a computer program to estimate gene genealogies. Molecular Ecology 9 (10): 1657-1660.
6. Corte A. (1975). Il marciume nero degli acini o black-rot della vite in provincia di La Spezia. Informatore Fitopatologico n°8.
7. Ferrin D. M., Ramsdell D. C., (1977). Ascospore dispersal and infection of grape by Guignardia bidwellii, the causal agent of grape Black rot disease. Phytopatology 67:1501-1505.
8. Forster P, Torroni A, Renfrew C, Röhl A (2001). Phylogenetic star contraction applied to Asian and Papuan mtDNA evolution. Molecula Biology and Evolution 18:1864-1881.
9. Galet P. (1977). Les maladies et les parasites de la vigne 1:223-260. 10. Gessler C., Blaise P., Jermini M., (2006). Black rot on the hybrid vitis cultivar
Isabella. IOBC/WPRS Bullettin 29(11):95-102. 11. Gessler C., Foiada F., Jermini M., Pertot I. (2008). Control of black rot
(Guignardia bidwellii) on the hybrid vitis cultivar Isabella. IOBC/WPRS Bullettin 36:101-105.
12. Glass N. L., and Donaldson G. C., (1995). Development of primer sets designed for use with the PCR to amplify conserved genes from filamentous ascomycetes. Applied and Environmental Microbiology 61(4):1323-1330.
13. Jermini M., Gessler C. (1996). Epidemiology and control of grape Black Rot in Southern Switzerland. Plant Disease 80 (3) 322:325.
14. Hardy O. J., Vekemans X. (2002).Spagedi: a versatile computer program to analyse spatial genetic structure at the individual or population levels. Molecular Ecology 2(4)618:620.
15. Hoffman L. E., Wilcox W. F. (2002). Utilizing epidemiological investigations to optimize management of grape Black rot. Phytopatology 92(6):676-680.
16. Luttrell E. S. (1946). Black rot of Muscadine grapes. Phytopatology 36:905-924.
68
17. Luttrell E. S. (1948). Physiologic specialization in Guignardia bidwellii, cause of Black rot of Vitis and Parthenocissus species. Phytopatology 38:716-723.
18. Martelli U. (1891). Il blackrot sulle viti presso Firenze. Nuovo Giornale Botanico Italiano 23:604-610.
19. MotohashiK., Inaba S., Anzai K., Takamatsu S., Nakashima C. (2009). Phylogenetic analyses of Japanese species of Phyllosticta sensu stricto. Mycoscience 50:291-302.
20. Nei M. (1987). Molecular evolutionary genetics. Columbia University Press, New York, pp. 39-46.
21. O’DonnelK., Nirenberg H. I., Aoki T., Cigelnik E. (2000). A multigene phylogeny of the Gibberella fujikuroi species complex: detection of additional phylogenetically distinct species. Mycoscience 41:61-78.
22. Pearson R. C., Goheen A. C. (1990). Compendium of Grape Disease pp. 15-17. 23. Pezet R. Jermini M. (1989). Le Black rot de la vigne: sympomes, épidémiologie
et lutte. Revue Svisse Viticulture Arboriculture Horticulture 21:27-34 24. Polzin T.,Daneschmand, S.V. (2003). On Steiner trees and minimum spanning
trees in hypergraphs. Oper. Res. Lett. 31:12–20 25. Prota V.A., S. Serra, L. Cogotzi, G. Serra and R. Garau. First report of grapevine
black rot in Sardinia. Journal of Plant Pathology (2011), 93(4, Supplement), S4.50.
26. Ramsdell D. C., Milholland R. D., (1990). Compendium of grape disease pp. 15-17
27. Raymond R., Rousset F. (1995). GENEPOP (version 1.2): population genetic software for exact test and ecumenicism. Journal of Heredity 86(3):246-248
28. Reddick D. (1911). The black rot disease of grapes. Cornell University Agr. Exp. Sta. Bul. 293:289-364
29. Rinaldi P. A., Mugnai L. (2012). Marciume nero degli acini, potenziale pericolo in viticoltura. Informatore Agrario 15:68-71.
30. Rui D. (1935). Il black rot o marciume nero dell’uva nell’isola di Veglia (Jugoslavia). Annuario della R. Stazione di viticoltura e di enologia di Conegliano Vol. 5.
31. Rui D., Torresin G. C., Pizzoli L., Carraro S (1987). Lotta guidata contro il black-rot della vite. Informatore Agrario 38:53-58.
32. Wikee S., Dhanushka U., Crous P. W., Chukeatirote E., McKenzie H. C., Bahkali A. H., Dai D. Q., Hyde K. D., (2011). Phyllosticta – an overview of current status of species recognition. Fungal Diversity 51:43-61.
33. Sokal R.R., Rohlf F. J., (1995). Biometry. W. H. Freeman, New York. 34. Spotts R. A. (1980). Infection of grape by Guignardia bidwellii – Factors
affecting lesion development, conidial dispersal and conidial populations on leaves. Phytopathology 70(3):252-255.
69
35. Tamura K, Peterson D, Peterson N, Stecher G, Nei M, and Kumar S (2011) MEGA5: Molecular Evolutionary Genetics Analysis using Maximum Likelihood, Evolutionary Distance, and Maximum Parsimony Methods. Molecular Biology and Evolution 28: 2731-2739.
36. Viala P. (1893). Les Maladies de la Vigne p. 247 37. White T. J., Bruns T., Lee S., Taylor J. (1990). Amplification and direct
sequencing of fungal ribosomal RNA genes for phylogenetics. In: Innis M. A., Gelfand D. H., Sninsky J. J., White T. J., eds. PCR protocols: a gide to methods and applications. Academic press. P 315-322.
38. Wicht B., Perini O., Jermini M., Gessler C., Broggini G. A. L., (2012). Molecular, proteomic and morphological characterization of the ascomycete Guignardia bidwellii, agent of grape black rot: a polyphasic approach to fungal identification. Mycologia 104(5)1036-1045.
39. Zhang K., Zhang N., Cai L. (2013). Typification and phylogenetic study of Phyllosticta ampelicida and P. vaccinii. Mycologia DOI:10.3852/12-392
70
Chapter 3
Rinaldi P. A., Paffetti D., Comparini C., Broggini G. A. L., Gessler C., Mugnai L.
Genetic variability and atypical symptoms development in
black rot of grapevine: a case study in a Tuscan vineyard Manuscript to be submitted
________________________________________________________________

71
72
Genetic variability and atypical symptoms development in black rot of grapevine: a case study in a Tuscan vineyard
Rinaldi P. A.1, Paffetti D.2, Comparini C.1, Broggini G. A. L.3, Gessler C.3, Mugnai L.1 1Dipartimento di Scienze delle Produzioni Agroalimentari e dell’Ambiente – Sezione
Patologia Vegetale ed Entomologia, Firenze, Italy. 2Dipartimento di Scienze delle Produzioni Agroalimentari e dell’Ambiente – Sezione
Genetica Agraria, Firenze. 3Plant Pathology Integrative Biology Zurich (IBZ) ETH Zurich LFW – Zurich, Switzerland.
Abstract
Phyllosticta ampelicida (syn. Guignardia bidwellii), is an ascomycota fungus agent of the vine disease known as black rot, which is present in Europe from 1885. Nevertheless, only since the mid-80s of the last century, sudden and devastating outbreaks of the disease have been reported in some growing regions. Swiss studies have shown that when fungal inoculum is allowed to increase over the years, it can later cause great losses in grape production. The causes of the inoculum increase can be either the presence of a nearby abandoned vineyard, which allows the pathogen to develop over time, or residual infected vegetation that is being mistakenly left in the vineyard or, most of all, the erroneous diagnosis of the symptoms. In fact, black rot symptoms can be easily confused, at the early stages of the disease, with those of other diseases. In this case, the use of not appropriate pesticide treatments can allow the inoculum to increase over time. Observations conducted in 2012 on a vineyard in Tuscany, an Italian region characterized by Mediterranean climate, have shown that the disease can develop on grapes with symptoms not easily assignable to black rot: grape clusters with shrivelled and mummified berries, but without fruiting bodies of the fungus on their surface, can be confused with physiological disorders or symptoms of late downy mildew infections (brown rot). DNA extracted from these berries has being analysed using specific nuclear microsatellites (nSSR) for Plasmopara viticola and Phyllosticta ampelicida. The results showed that P. ampelicida was present in the 90% of mummified berries and in the 19% of the red and shrivelled ones. In contrast, there wasn’t any presence of P. viticola in the shrivelled berries. In the same vineyard, samples of clusters infected in 2011 and unequivocally affected by black rot were collected following a sampling grid. The spatial structure analysis of the genetic diversity performed on the pathogen population present in the vineyard showed that the pathogen population can be divided into three genetically separated subpopulations.
73
1. Introduction Black rot is a vine disease caused by the ascomycota fungus Phyllosticta ampelicida (Englemann) Van der Aa, [syn. Guignardia bidwellii (Ellis) Viala & Ravaz]. This pathogen attacks different species of the Vitaceae family (Ampelopsis spp., Cissus spp., Parthenocissus spp.), but recent molecular studies support the hypothesis that P. ampelicida is actually a complex that comprise different species (Zhang et al 2013). The first report of the disease dates back to 1805 in North America (Kentucky), when European investors tried to implant the vine cultivation for business. After three years most of the vines failed to grow. Here the French naturalist F. A. Michaux, observing for the first time the unhealthy vines, described symptoms on the bunches which are now commonly considered the ones typical of the disease (Pinney, 2005, 2012). The first scientific description of the symptoms on the bunches was made in 1861 by Engelmann, who described the infected berries as covered with pustules or little spherical bodies. The observed berries gradually shrivelled up and turned black (Engelmann, 1861). The disease had never been noticed before in Europe nor it had been reported in America, but appeared soon clear that among the different varieties of the genus Vitis cultivated for grape production, there were high differences in susceptibility, with the American ones less susceptible, and the European one fully susceptible. In Europe the disease entered first in France subsequently at the importation of American rootstocks that were used to fight Phylloxera vastatrix (Pouget, 1990). The symptoms on the vines were observed in Europe for the first time in 1885 in the upper Valley of Hérault, France, by Viala and Ravaz. In this valley no American vines had been introduced during the previous six years. Viala described the final stage of the disease on the berries. These were shrivelled, with a colour that varied from dark purple to black, and had the simultaneous appearance of “black pustules”, which rapidly invaded all the berry surface without leaving any free space (Viala, 1888). Arnaud, in 1931 (Arnaud et al., 1931), specified too that, during the final stages of the disease, the infected berries shrivelled, their colour changed from a purple colour to a darker colour and they became soon covered on their surface by numerous fruiting bodies of the fungus. The pathogen can infect not only the bunches of Vitis vinifera, but also those of other species of the genus Vitis. Epidemiological studies on Vitis rotundifolia (Luttrell, 1946) demonstrated that the symptoms produced by the pathogen in this species were different from those described on Vitis vinifera. On the bunch of V. vinifera, the infection produced the complete mummification of the berries, while on muscadine grapes the pathogen caused only superficial scabs or lesions. The likeliest hypothesis of this different behaviour between the two species was that the two had a different reaction to the host. Since the first black rot reports, the most common observations regarding the evolution of the disease on the berries were: appearance of a small whitish dot; presence of a
74
reddish brown ring that, in few hours, surrounded the dot; shrivelling of the berry, which now have a red purplish colour; drying of the berry, that becomes a hard blue-black mummy and has fungus fruiting bodies on its surface (Ramsdell et al., 1990). This last symptom - the appearance of the fruiting bodies of the fungus (which are also called “black pustules”) on the black mummified berries – has always been observed. It should be noted that all the observations and descriptions of the disease were from France or North America. After the first report in France in the 19th century, the pathogen has slowly spread throughout many other European countries. The disease was reported in Spain, in the Valencia region, in 1914 (Ravaz, 1914); in Germany, in the Baden region, in 1933 (Trincheri, 1935), and in the Assia Nassau region, in 1934 (Lüstner, 1935); in ex Jugoslavia, in 1935 (Veglia island, Rui, 1935). In Italy the earliest (but not documented) reports of the disease are from 1891 (Martelli, 1891), but the first economically important damages were reported only later in different regions: in 1974 in Liguria (Corte, 1975), in 1987 in Friuli (Rui, 1987), in 2010 in Tuscany (Rinaldi et al., 2012) and, in 2012, in the Sardinia island, the only southern Italian region in which the pathogen is recorded. Recently, outbreaks of black rot were reported in countries where the disease had been previously or occasionally present, as in Germany in the Rhineland-Palatinate region in 2003 and 2004 (Harms, 2005) or, more recently, in Hungary (Rinaldi et al., 2013) and Portugal in 2005 (Rego et al 2007). In Switzerland the disease was observed for the first time in 1988 in Canton Ticino, where in a very short time has caused great losses in private vineyards (Pezet, 1989). The causes of these sudden outbreaks of the disease are unknown; studies in Switzerland demonstrated that, under low inoculum pressure, the pathogen does not lead to vast epidemics (Jermini, 1996), but if the disease is allowed to build up inoculum over the years, major outbreaks could happen, and these could lead to severe economic losses. Abandoned vineyards or the lack of care during cultural practices leading to leave infected tissue in the vineyard (Becker, 1996) are the main causes of inoculum increase. These could be probably considered one of the causes behind recent outbreaks of the disease in different European countries. It could be hypothesized that vine growers can misidentified the shrivelling of the berries caused by P. ampelicida with the symptoms of the “brown rot” phase due to late infections by Plasmopara viticola. These symptoms can also be confused with the symptoms caused by white rot (Pilidiella diplodiella), sun scald and anthracnose (Elsinoë ampelina). The misleading diagnosis could lead to a wrong spraying strategy with the consequent increase of the inoculum. As a matter of fact, the fungus cycle and the major observations regarding the pathogen have been up to now carried out in vinegrowing areas characterized by cool, wet springs like those of Central Europe or the United States, while there are no major studies on the symptoms and epidemiology of the fungus in warmer and drier environments.
75
In this study we therefore surveyed the symptoms development in a vineyard located in Florence, Tuscany (Italy), and investigated the nature of uncertain symptoms similar to those caused by late Plasmopara viticola infections (brown rot), even if developed in a vineyard heavily infected by P. ampelicida. The protocol applied to detect the presence of P. ampelicida in atypical symptoms was based on the use of amplicons, which were run on an agarose gel to verify the presence of the two pathogens on infected material. The same procedure was followed amplifying a microsatellite formerly detected on Plasmopara viticola DNA (Valsesia et al., 2005) and another one set up on Phyllosticta ampelicida by Plant Pathology Integrative biology - ETH – Zurich Switzerland. This approach could allow to establish the real risk of a wrong disease diagnosis, with the final aim to better understand the reasons behind the sudden spread of the disease in the region. In the same vineyard, in a season when the typical symptoms were widely spread, a spatial pattern of the local population of the pathogen was investigated by applying a nuclear microsatellites analysis (nSSR). This approach had previously shown to be suitable on studies regarding the epidemic and the fungal population of different plant pathogens (Tenzer et al., 1999; Gobbin et al., 2005; Winton et al., 2007) for the characterization of genetic variability of different or local populations. 2. Materials and methods 2.1 Study site and symptomatic sample collection for nuclear microsatellite analysis (2011 growth season). Trials were started in 2011 in a 35 years old vineyard growing in the surrounding of Florence, Italy, cultivar Sangiovese and Trebbiano, where heavy damages by Plasmopara viticola had been claimed by the grower in 2010. In 2011, 100% of the clusters in both cultivars showed a complete drying up. A careful analysis showed that all clusters were affected by black rot symptoms. The vineyardwas divided into 90 rectangular sub-plots (11 × 3 m each). Each sub-plot included three rows (Fig. 1).In each sub-plot a mummified cluster, chosen at random, was collected from the middle row and stored at 4°C. Twenty five subplots were selected at random but taking care of covering all the surface of the vineyard, and the corresponding 25 clusters were used for further analysis. From each of these 25 clusters four berries were selected and fungal DNA extracted for nuclear microsatellites analysis. 2.2 Analysis of the spatial genetic structure of the pathogen population. General estimates of genetic diversity from nSSR data were calculated using SPAGeDi 1.3a (Hardy and Vekemans 2002) and GENEPOP 3.3 (Raymond and Rousset, 1995): number of alleles (N), number of rare alleles (Nrare, freq. < 5%), allele frequency, and
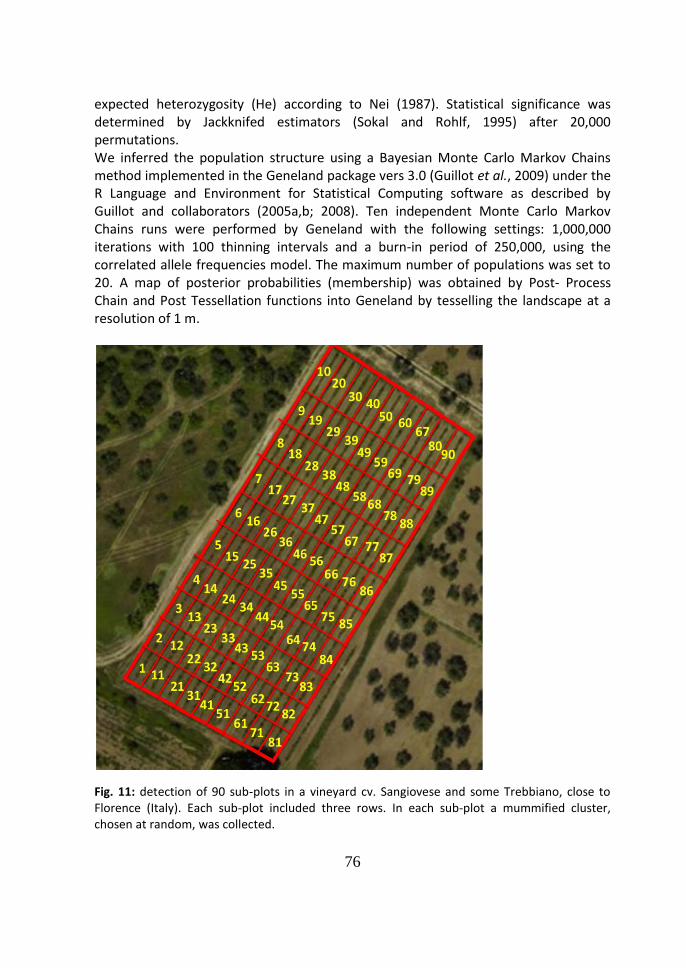
76
expected heterozygosity (He) according to Nei (1987). Statistical significance was determined by Jackknifed estimators (Sokal and Rohlf, 1995) after 20,000 permutations. We inferred the population structure using a Bayesian Monte Carlo Markov Chains method implemented in the Geneland package vers 3.0 (Guillot et al., 2009) under the R Language and Environment for Statistical Computing software as described by Guillot and collaborators (2005a,b; 2008). Ten independent Monte Carlo Markov Chains runs were performed by Geneland with the following settings: 1,000,000 iterations with 100 thinning intervals and a burn-in period of 250,000, using the correlated allele frequencies model. The maximum number of populations was set to 20. A map of posterior probabilities (membership) was obtained by Post- Process Chain and Post Tessellation functions into Geneland by tesselling the landscape at a resolution of 1 m.
Fig. 11: detection of 90 sub-plots in a vineyard cv. Sangiovese and some Trebbiano, close to Florence (Italy). Each sub-plot included three rows. In each sub-plot a mummified cluster, chosen at random, was collected.
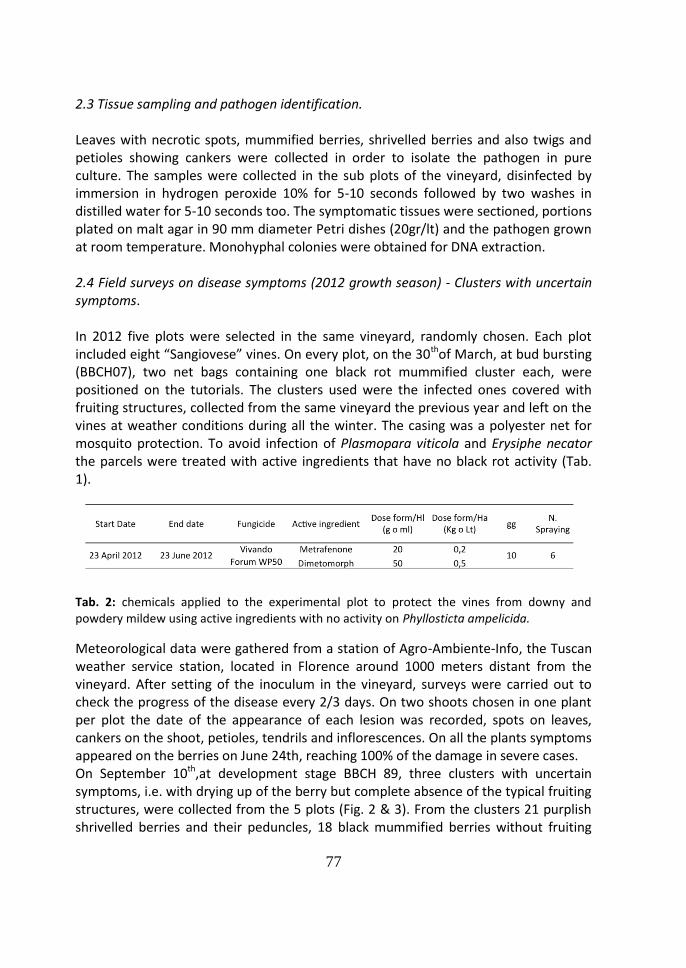
77
2.3 Tissue sampling and pathogen identification. Leaves with necrotic spots, mummified berries, shrivelled berries and also twigs and petioles showing cankers were collected in order to isolate the pathogen in pure culture. The samples were collected in the sub plots of the vineyard, disinfected by immersion in hydrogen peroxide 10% for 5-10 seconds followed by two washes in distilled water for 5-10 seconds too. The symptomatic tissues were sectioned, portions plated on malt agar in 90 mm diameter Petri dishes (20gr/lt) and the pathogen grown at room temperature. Monohyphal colonies were obtained for DNA extraction. 2.4 Field surveys on disease symptoms (2012 growth season) - Clusters with uncertain symptoms. In 2012 five plots were selected in the same vineyard, randomly chosen. Each plot included eight “Sangiovese” vines. On every plot, on the 30thof March, at bud bursting (BBCH07), two net bags containing one black rot mummified cluster each, were positioned on the tutorials. The clusters used were the infected ones covered with fruiting structures, collected from the same vineyard the previous year and left on the vines at weather conditions during all the winter. The casing was a polyester net for mosquito protection. To avoid infection of Plasmopara viticola and Erysiphe necator the parcels were treated with active ingredients that have no black rot activity (Tab. 1).
Tab. 2: chemicals applied to the experimental plot to protect the vines from downy and powdery mildew using active ingredients with no activity on Phyllosticta ampelicida.
Meteorological data were gathered from a station of Agro-Ambiente-Info, the Tuscan weather service station, located in Florence around 1000 meters distant from the vineyard. After setting of the inoculum in the vineyard, surveys were carried out to check the progress of the disease every 2/3 days. On two shoots chosen in one plant per plot the date of the appearance of each lesion was recorded, spots on leaves, cankers on the shoot, petioles, tendrils and inflorescences. On all the plants symptoms appeared on the berries on June 24th, reaching 100% of the damage in severe cases. On September 10th,at development stage BBCH 89, three clusters with uncertain symptoms, i.e. with drying up of the berry but complete absence of the typical fruiting structures, were collected from the 5 plots (Fig. 2 & 3). From the clusters 21 purplish shrivelled berries and their peduncles, 18 black mummified berries without fruiting
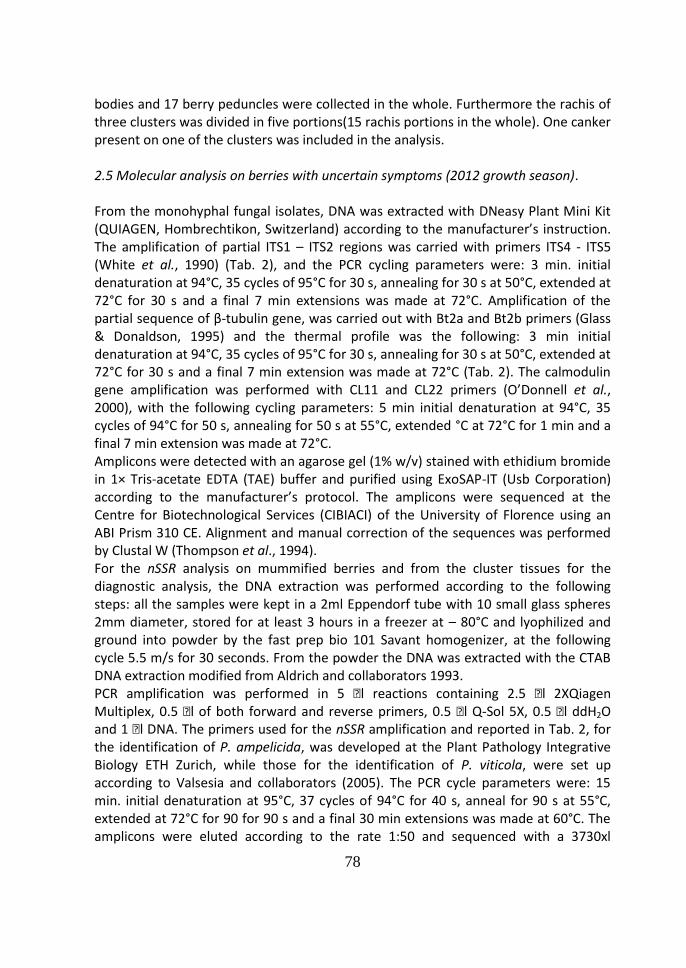
78
bodies and 17 berry peduncles were collected in the whole. Furthermore the rachis of three clusters was divided in five portions(15 rachis portions in the whole). One canker present on one of the clusters was included in the analysis. 2.5 Molecular analysis on berries with uncertain symptoms (2012 growth season). From the monohyphal fungal isolates, DNA was extracted with DNeasy Plant Mini Kit (QUIAGEN, Hombrechtikon, Switzerland) according to the manufacturer’s instruction. The amplification of partial ITS1 – ITS2 regions was carried with primers ITS4 - ITS5 (White et al., 1990) (Tab. 2), and the PCR cycling parameters were: 3 min. initial denaturation at 94°C, 35 cycles of 95°C for 30 s, annealing for 30 s at 50°C, extended at 72°C for 30 s and a final 7 min extensions was made at 72°C. Amplification of the partial sequence of β-tubulin gene, was carried out with Bt2a and Bt2b primers (Glass & Donaldson, 1995) and the thermal profile was the following: 3 min initial denaturation at 94°C, 35 cycles of 95°C for 30 s, annealing for 30 s at 50°C, extended at 72°C for 30 s and a final 7 min extension was made at 72°C (Tab. 2). The calmodulin gene amplification was performed with CL11 and CL22 primers (O’Donnell et al., 2000), with the following cycling parameters: 5 min initial denaturation at 94°C, 35 cycles of 94°C for 50 s, annealing for 50 s at 55°C, extended °C at 72°C for 1 min and a final 7 min extension was made at 72°C. Amplicons were detected with an agarose gel (1% w/v) stained with ethidium bromide in 1× Tris-acetate EDTA (TAE) buffer and purified using ExoSAP-IT (Usb Corporation) according to the manufacturer’s protocol. The amplicons were sequenced at the Centre for Biotechnological Services (CIBIACI) of the University of Florence using an ABI Prism 310 CE. Alignment and manual correction of the sequences was performed by Clustal W (Thompson et al., 1994). For the nSSR analysis on mummified berries and from the cluster tissues for the diagnostic analysis, the DNA extraction was performed according to the following steps: all the samples were kept in a 2ml Eppendorf tube with 10 small glass spheres 2mm diameter, stored for at least 3 hours in a freezer at – 80°C and lyophilized and ground into powder by the fast prep bio 101 Savant homogenizer, at the following cycle 5.5 m/s for 30 seconds. From the powder the DNA was extracted with the CTAB DNA extraction modified from Aldrich and collaborators 1993. PCR amplification was performed in 5 l reactions containing 2.5 l 2XQiagen Multiplex, 0.5 l of both forward and reverse primers, 0.5 l Q-Sol 5X, 0.5 l ddH2O and 1 l DNA. The primers used for the nSSR amplification and reported in Tab. 2, for the identification of P. ampelicida, was developed at the Plant Pathology Integrative Biology ETH Zurich, while those for the identification of P. viticola, were set up according to Valsesia and collaborators (2005). The PCR cycle parameters were: 15 min. initial denaturation at 95°C, 37 cycles of 94°C for 40 s, anneal for 90 s at 55°C, extended at 72°C for 90 for 90 s and a final 30 min extensions was made at 60°C. The amplicons were eluted according to the rate 1:50 and sequenced with a 3730xl
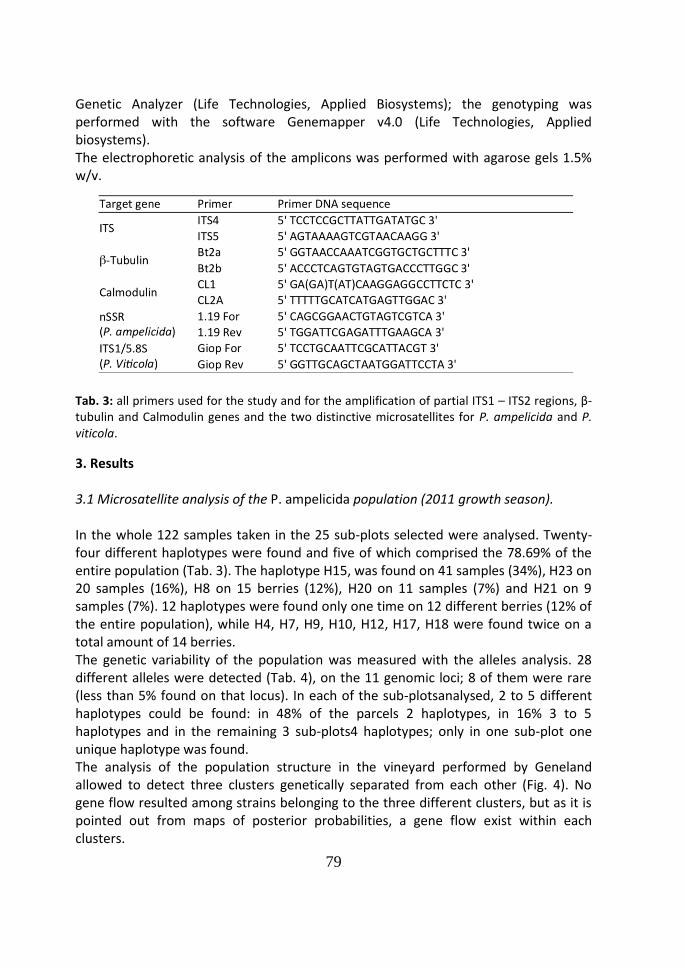
79
Genetic Analyzer (Life Technologies, Applied Biosystems); the genotyping was performed with the software Genemapper v4.0 (Life Technologies, Applied biosystems). The electrophoretic analysis of the amplicons was performed with agarose gels 1.5% w/v.
Tab. 3: all primers used for the study and for the amplification of partial ITS1 – ITS2 regions, β-tubulin and Calmodulin genes and the two distinctive microsatellites for P. ampelicida and P. viticola.
3. Results 3.1 Microsatellite analysis of the P. ampelicida population (2011 growth season). In the whole 122 samples taken in the 25 sub-plots selected were analysed. Twenty-four different haplotypes were found and five of which comprised the 78.69% of the entire population (Tab. 3). The haplotype H15, was found on 41 samples (34%), H23 on 20 samples (16%), H8 on 15 berries (12%), H20 on 11 samples (7%) and H21 on 9 samples (7%). 12 haplotypes were found only one time on 12 different berries (12% of the entire population), while H4, H7, H9, H10, H12, H17, H18 were found twice on a total amount of 14 berries. The genetic variability of the population was measured with the alleles analysis. 28 different alleles were detected (Tab. 4), on the 11 genomic loci; 8 of them were rare (less than 5% found on that locus). In each of the sub-plotsanalysed, 2 to 5 different haplotypes could be found: in 48% of the parcels 2 haplotypes, in 16% 3 to 5 haplotypes and in the remaining 3 sub-plots4 haplotypes; only in one sub-plot one unique haplotype was found. The analysis of the population structure in the vineyard performed by Geneland allowed to detect three clusters genetically separated from each other (Fig. 4). No gene flow resulted among strains belonging to the three different clusters, but as it is pointed out from maps of posterior probabilities, a gene flow exist within each clusters.
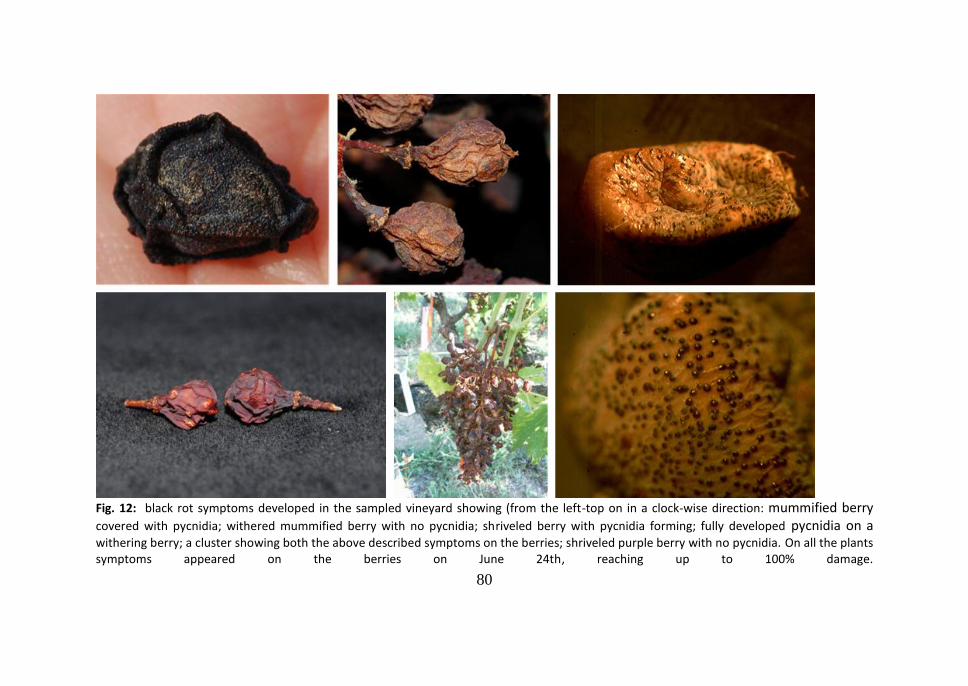
80
Fig. 12: black rot symptoms developed in the sampled vineyard showing (from the left-top on in a clock-wise direction: mummified berry covered with pycnidia; withered mummified berry with no pycnidia; shriveled berry with pycnidia forming; fully developed pycnidia on a withering berry; a cluster showing both the above described symptoms on the berries; shriveled purple berry with no pycnidia. On all the plants symptoms appeared on the berries on June 24th, reaching up to 100% damage.
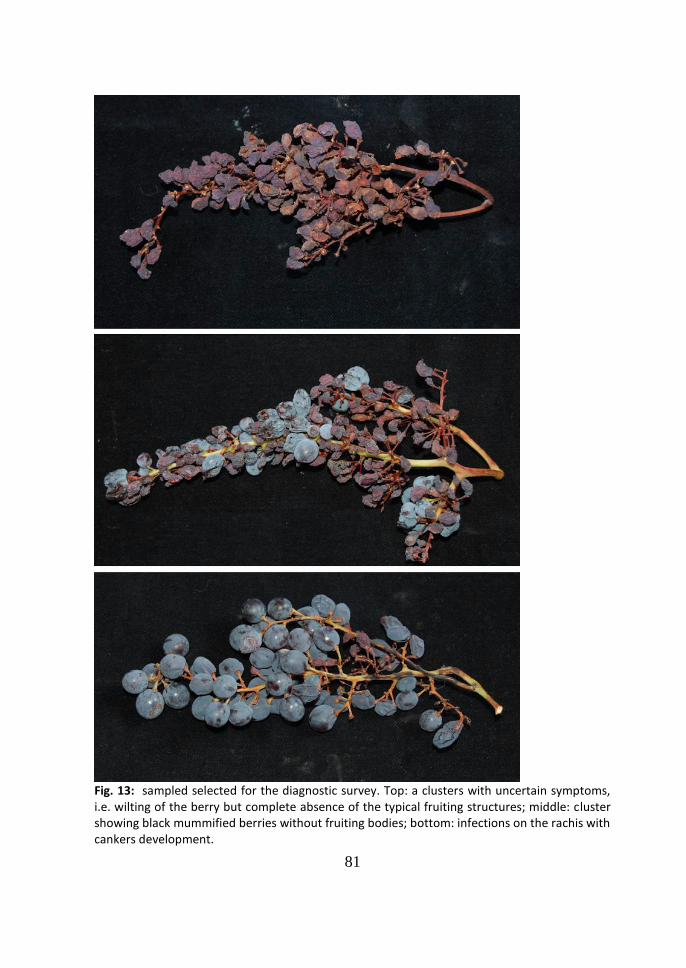
81
Fig. 13: sampled selected for the diagnostic survey. Top: a clusters with uncertain symptoms, i.e. wilting of the berry but complete absence of the typical fruiting structures; middle: cluster showing black mummified berries without fruiting bodies; bottom: infections on the rachis with cankers development.
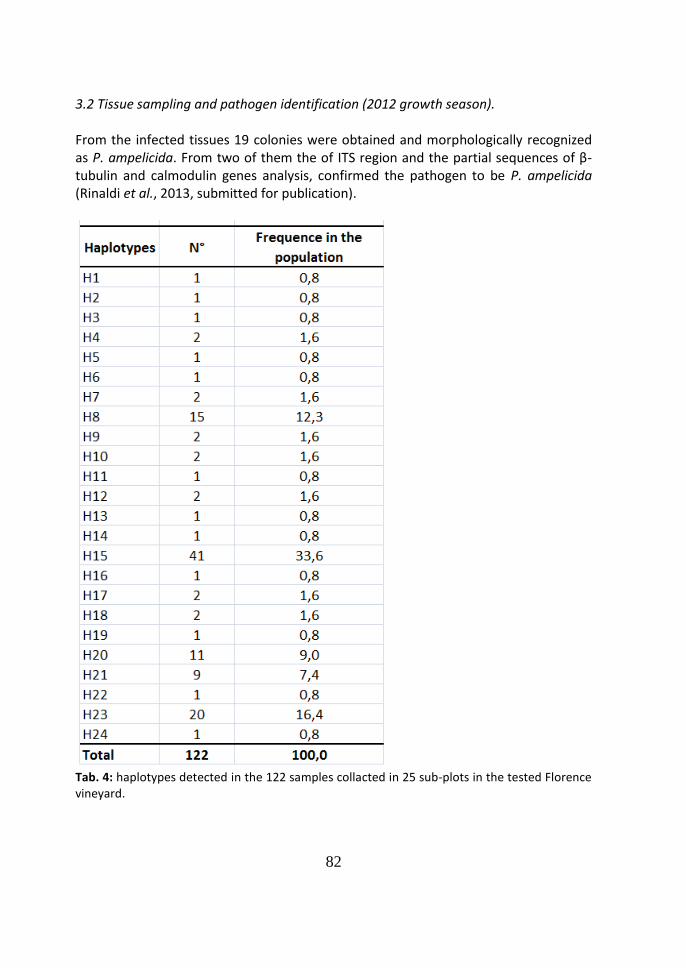
82
3.2 Tissue sampling and pathogen identification (2012 growth season). From the infected tissues 19 colonies were obtained and morphologically recognized as P. ampelicida. From two of them the of ITS region and the partial sequences of β-tubulin and calmodulin genes analysis, confirmed the pathogen to be P. ampelicida (Rinaldi et al., 2013, submitted for publication).
Tab. 4: haplotypes detected in the 122 samples collacted in 25 sub-plots in the tested Florence vineyard.
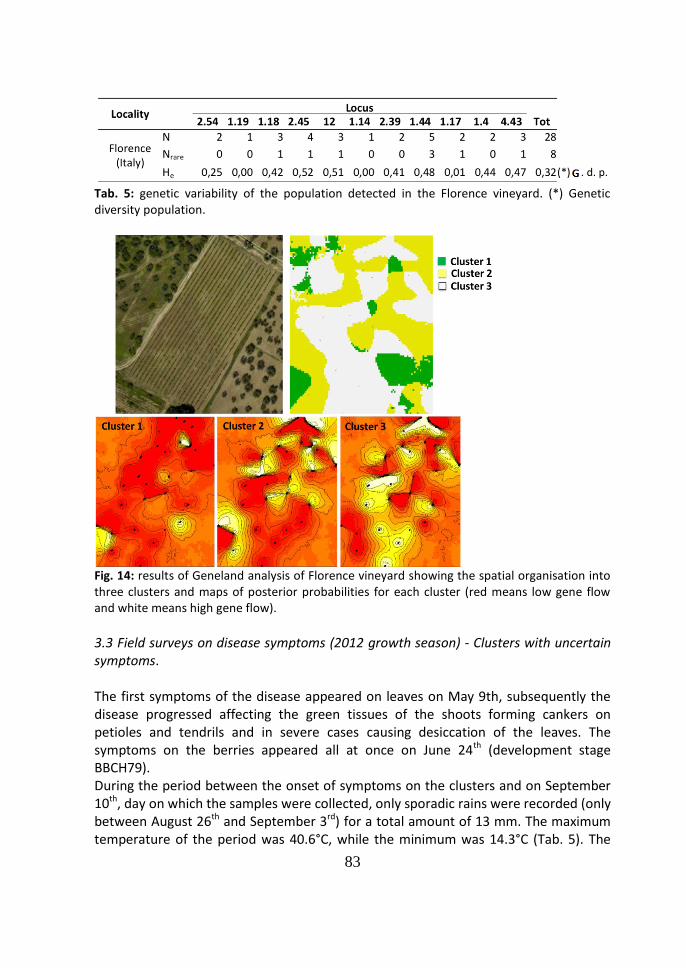
83
Tab. 5: genetic variability of the population detected in the Florence vineyard. (*) Genetic diversity population.
Fig. 14: results of Geneland analysis of Florence vineyard showing the spatial organisation into three clusters and maps of posterior probabilities for each cluster (red means low gene flow and white means high gene flow).
3.3 Field surveys on disease symptoms (2012 growth season) - Clusters with uncertain symptoms. The first symptoms of the disease appeared on leaves on May 9th, subsequently the disease progressed affecting the green tissues of the shoots forming cankers on petioles and tendrils and in severe cases causing desiccation of the leaves. The symptoms on the berries appeared all at once on June 24th (development stage BBCH79). During the period between the onset of symptoms on the clusters and on September 10th, day on which the samples were collected, only sporadic rains were recorded (only between August 26th and September 3rd) for a total amount of 13 mm. The maximum temperature of the period was 40.6°C, while the minimum was 14.3°C (Tab. 5). The
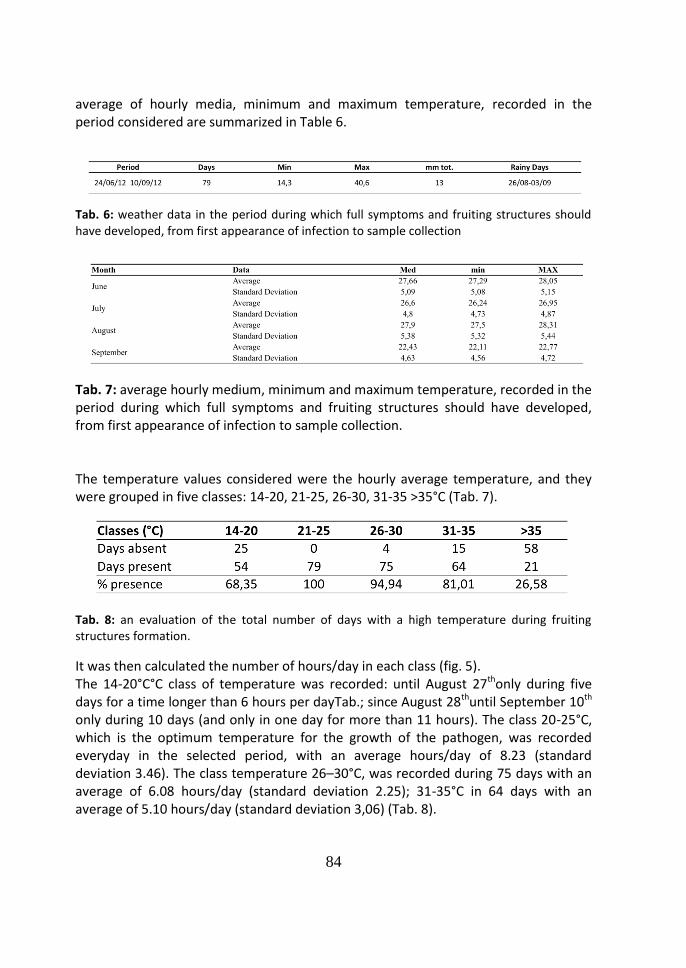
84
average of hourly media, minimum and maximum temperature, recorded in the period considered are summarized in Table 6.
Tab. 6: weather data in the period during which full symptoms and fruiting structures should have developed, from first appearance of infection to sample collection
Tab. 7: average hourly medium, minimum and maximum temperature, recorded in the period during which full symptoms and fruiting structures should have developed, from first appearance of infection to sample collection. The temperature values considered were the hourly average temperature, and they were grouped in five classes: 14-20, 21-25, 26-30, 31-35 >35°C (Tab. 7).
Tab. 8: an evaluation of the total number of days with a high temperature during fruiting structures formation.
It was then calculated the number of hours/day in each class (fig. 5). The 14-20°C°C class of temperature was recorded: until August 27thonly during five days for a time longer than 6 hours per dayTab.; since August 28thuntil September 10th only during 10 days (and only in one day for more than 11 hours). The class 20-25°C, which is the optimum temperature for the growth of the pathogen, was recorded everyday in the selected period, with an average hours/day of 8.23 (standard deviation 3.46). The class temperature 26–30°C, was recorded during 75 days with an average of 6.08 hours/day (standard deviation 2.25); 31-35°C in 64 days with an average of 5.10 hours/day (standard deviation 3,06) (Tab. 8).
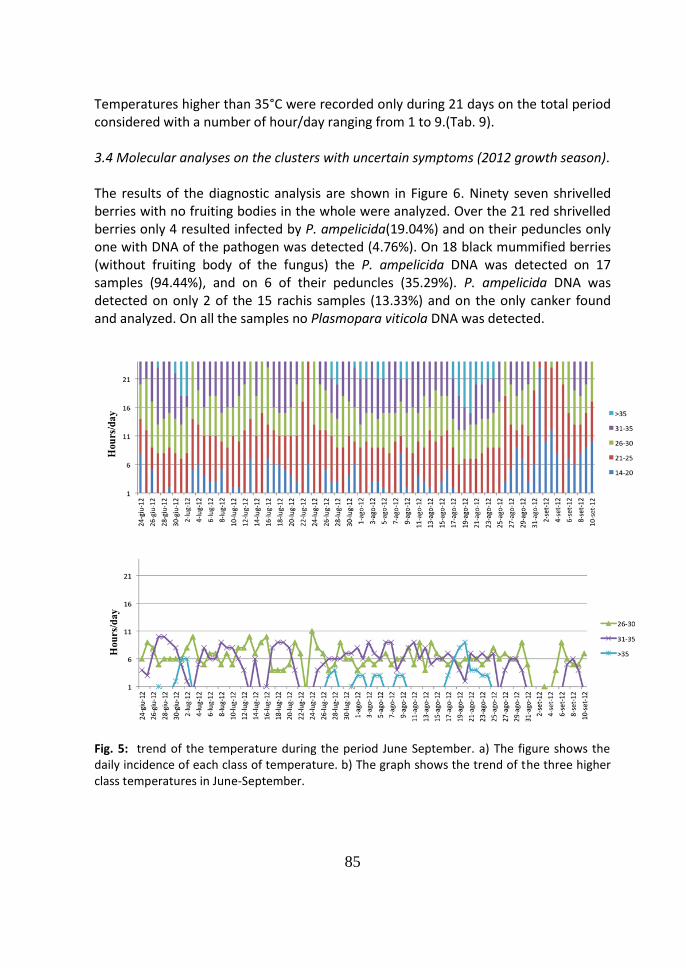
85
Temperatures higher than 35°C were recorded only during 21 days on the total period considered with a number of hour/day ranging from 1 to 9.(Tab. 9). 3.4 Molecular analyses on the clusters with uncertain symptoms (2012 growth season). The results of the diagnostic analysis are shown in Figure 6. Ninety seven shrivelled berries with no fruiting bodies in the whole were analyzed. Over the 21 red shrivelled berries only 4 resulted infected by P. ampelicida(19.04%) and on their peduncles only one with DNA of the pathogen was detected (4.76%). On 18 black mummified berries (without fruiting body of the fungus) the P. ampelicida DNA was detected on 17 samples (94.44%), and on 6 of their peduncles (35.29%). P. ampelicida DNA was detected on only 2 of the 15 rachis samples (13.33%) and on the only canker found and analyzed. On all the samples no Plasmopara viticola DNA was detected.
Fig. 5: trend of the temperature during the period June September. a) The figure shows the daily incidence of each class of temperature. b) The graph shows the trend of the three higher class temperatures in June-September.
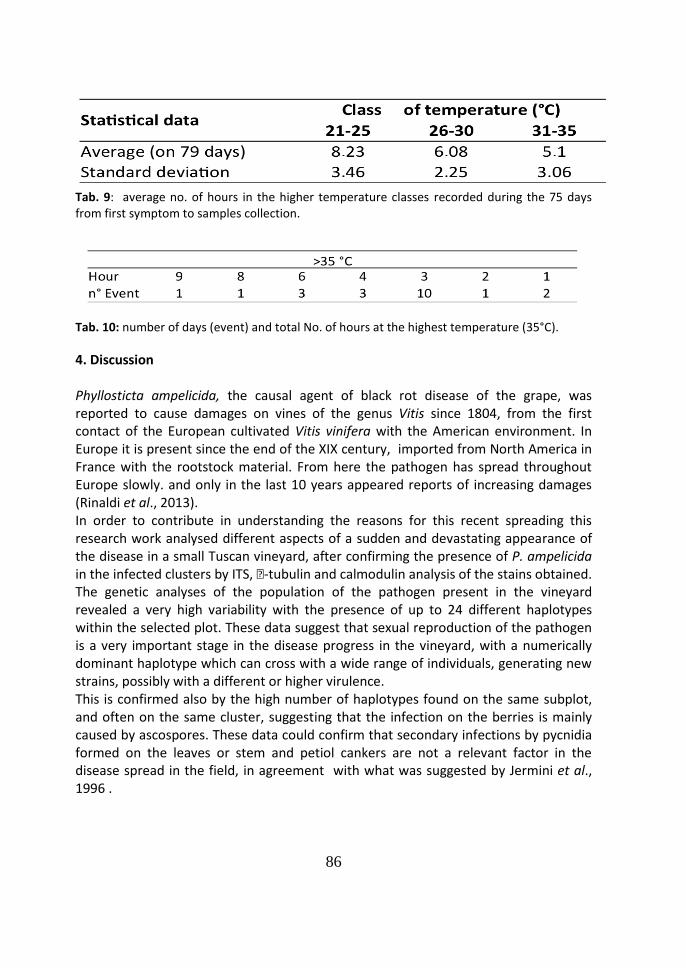
86
Tab. 9: average no. of hours in the higher temperature classes recorded during the 75 days from first symptom to samples collection.
Tab. 10: number of days (event) and total No. of hours at the highest temperature (35°C).
4. Discussion Phyllosticta ampelicida, the causal agent of black rot disease of the grape, was reported to cause damages on vines of the genus Vitis since 1804, from the first contact of the European cultivated Vitis vinifera with the American environment. In Europe it is present since the end of the XIX century, imported from North America in France with the rootstock material. From here the pathogen has spread throughout Europe slowly. and only in the last 10 years appeared reports of increasing damages (Rinaldi et al., 2013). In order to contribute in understanding the reasons for this recent spreading this research work analysed different aspects of a sudden and devastating appearance of the disease in a small Tuscan vineyard, after confirming the presence of P. ampelicida in the infected clusters by ITS, -tubulin and calmodulin analysis of the stains obtained. The genetic analyses of the population of the pathogen present in the vineyard revealed a very high variability with the presence of up to 24 different haplotypes within the selected plot. These data suggest that sexual reproduction of the pathogen is a very important stage in the disease progress in the vineyard, with a numerically dominant haplotype which can cross with a wide range of individuals, generating new strains, possibly with a different or higher virulence. This is confirmed also by the high number of haplotypes found on the same subplot, and often on the same cluster, suggesting that the infection on the berries is mainly caused by ascospores. These data could confirm that secondary infections by pycnidia formed on the leaves or stem and petiol cankers are not a relevant factor in the disease spread in the field, in agreement with what was suggested by Jermini et al., 1996 .
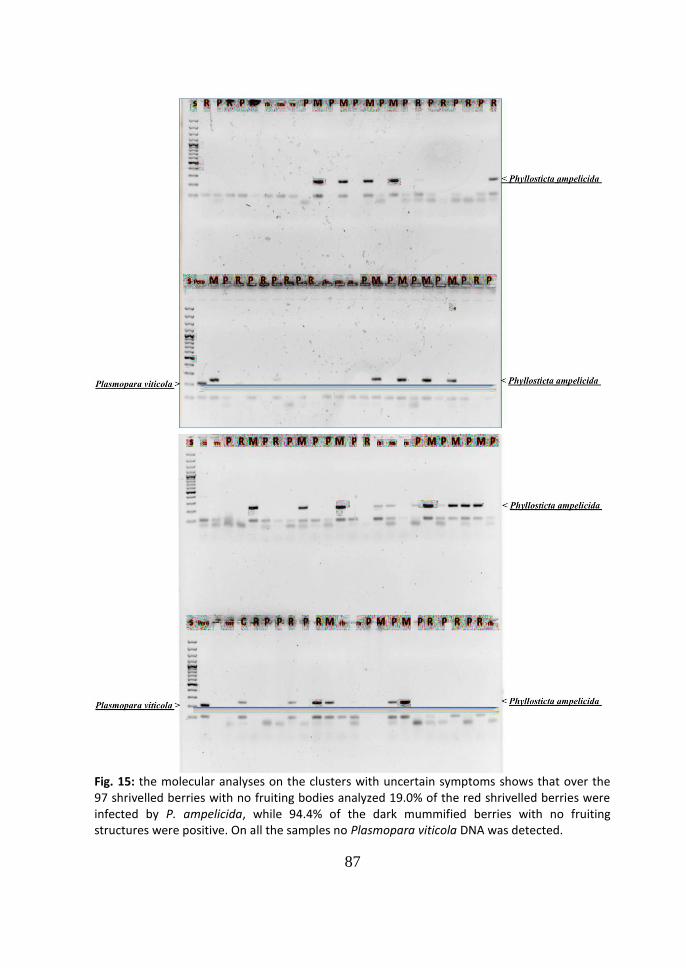
87
Fig. 15: the molecular analyses on the clusters with uncertain symptoms shows that over the 97 shrivelled berries with no fruiting bodies analyzed 19.0% of the red shrivelled berries were infected by P. ampelicida, while 94.4% of the dark mummified berries with no fruiting structures were positive. On all the samples no Plasmopara viticola DNA was detected.
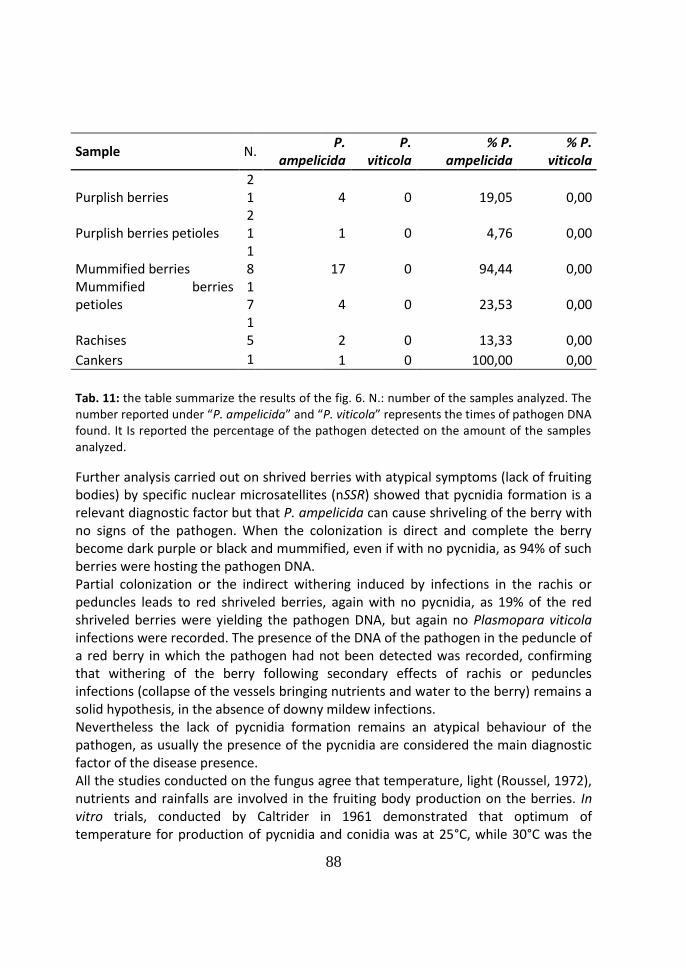
88
Sample N.
P. ampelicida
P. viticola
% P. ampelicida
% P. viticola
Purplish berries 21 4 0 19,05 0,00
Purplish berries petioles 21 1 0 4,76 0,00
Mummified berries 18 17 0 94,44 0,00
Mummified berries petioles
17 4 0 23,53 0,00
Rachises 15 2 0 13,33 0,00
Cankers 1 1 0 100,00 0,00
Tab. 11: the table summarize the results of the fig. 6. N.: number of the samples analyzed. The number reported under “P. ampelicida” and “P. viticola” represents the times of pathogen DNA found. It Is reported the percentage of the pathogen detected on the amount of the samples analyzed.
Further analysis carried out on shrived berries with atypical symptoms (lack of fruiting bodies) by specific nuclear microsatellites (nSSR) showed that pycnidia formation is a relevant diagnostic factor but that P. ampelicida can cause shriveling of the berry with no signs of the pathogen. When the colonization is direct and complete the berry become dark purple or black and mummified, even if with no pycnidia, as 94% of such berries were hosting the pathogen DNA. Partial colonization or the indirect withering induced by infections in the rachis or peduncles leads to red shriveled berries, again with no pycnidia, as 19% of the red shriveled berries were yielding the pathogen DNA, but again no Plasmopara viticola infections were recorded. The presence of the DNA of the pathogen in the peduncle of a red berry in which the pathogen had not been detected was recorded, confirming that withering of the berry following secondary effects of rachis or peduncles infections (collapse of the vessels bringing nutrients and water to the berry) remains a solid hypothesis, in the absence of downy mildew infections. Nevertheless the lack of pycnidia formation remains an atypical behaviour of the pathogen, as usually the presence of the pycnidia are considered the main diagnostic factor of the disease presence. All the studies conducted on the fungus agree that temperature, light (Roussel, 1972), nutrients and rainfalls are involved in the fruiting body production on the berries. In vitro trials, conducted by Caltrider in 1961 demonstrated that optimum of temperature for production of pycnidia and conidia was at 25°C, while 30°C was the
89
optimum for the production of spermatia and pycnosclerotia and the continuous light increased greatly the abundance of pycnidia and conidia. At 35°C no fruiting structures were produced by the fungus. Temperature and light have great importance in the maturation of the berries and the observations by Caltrider (1961) demonstrated that nutrients present in the grapes are important in the determining the type of fruiting bodies. Nutrients present in the substrates from mature grapes produced spermatia and picnosclerotia more abundantly, while pycnidia formation was favoured by immature grapes. Studies about the susceptibility of the berries to the infection, indicated that berries become susceptible after bloom, i.e. almost up to the beginning of veraison (Ferrinet al., 1978; Jermini et al., 1996; Hoffmann, 2002) and percentages higher than 5% of sugar inhibit the fungus(Ramsdell et al., 1990). Furthermore, during the ripening of the berries two proteins are produced: basic chitinase and grape osmotin. They represent, together with the increase of glucose, a defence response of the vine to the pathogen (Salzman, 1998). In the case under study the absence of the fungal fruiting bodies could be assigned to the extraordinarily hot and dry season. Long persistence of the high temperature associated to the high light intensity typical of summer time, could have inhibited the fungus to produce the characteristic black fruiting bodies; besides this the drought could have reduced the water availability to the fungus and accelerated the ripening of the berries with the production of anti fungal proteins and sugars. The data shown here indicate that Phyllosticta ampelicida can cause in the Mediterranean environment a wilting of the clusters, similar to those caused by another vine pathogen, Plasmopara viticola, confirming the importance of a very careful diagnosis. To be aware of this overlapping of symptoms can be very relevant for the vine growers as can bring them to an erroneous spraying strategy with the consequent increase of the fungus inoculum. More knowledge on the different aspects of the epidemiology and population structure, at different levels, of the black rot agent in the Mediterranean area and climate is needed. is necessary to understand the causes of atypical symptoms through a deeper study of the relationship between pathogen and berries in warmer climates, the influence of biochemical changes occurring in the berry during ripening and the effects of temerature on the cycle and reproduction of the fungus. A better understanding of the causes of the presence of clusters of haplotypes, which cross themselves and their influence on evolution of infection of the vineyard is needed.
90
References
1. Aldrich J. and Cullis C. A., (1993). RAPD analysis in Flax: Optimization of yeld and reproducibility using klentaq1 DNA polymerase, chelex 100 and gel purification of genomic DNA. Plant Molecular Biology Reporter 11(2) 128-141.
2. Arnaud G., Arnaud M. (1931). Traité Pathol. Vég. I:382-389. Lechevalier éd. Paris.
3. Becker C. M., Pearson R. C., (1996). Black rot lesions on overwintered canes of Euvitis supply conidia of Guignardia bidwellii for primary inoculum in spring. Plant disease 80(1):24-27.
4. Caltrider P. G. (1961). Growth and sporulation of Guignardia bidwellii. Phytopathology 51:860-863.
5. Corte A. (1975). Il marciume nero degli acini o black-rot della vite in provincia di La Spezia. Informatore Fitopatologico n°8.
6. Engelmann G. (1861). Two species of fungi which infest our vineyards. Trans. St. Luois Acad. Sci., Jour. Proc. 2:165
7. Ferrin D. M., Ramsdell D. C., (1978). Influence of conidial dispersal and infection of grape by Guignardia bidwellii. Ecology and Epidemiology 68:892-895.
8. Glass N. L., and Donaldson G. C., (1995). Development of primer sets designed for use with the PCR to amplify conserved genes from filamentous ascomycetes. Applied and Environmental Microbiology 61(4):1323-1330.
9. Gobbin d., Jermini M., Loskill B., Pertot I., Raynal M., Gessler C. (2005). Importance of secondary inoculum of Plasmopara viticola to epidemics of grapevine downy mildew. Plant Pathology 54:522-534
10. Guillot, G., Estoup, A., Mortier, F., Cosson, J.F., (2005a). A spatial statistical model for landscape genetics. Genetics 170:1261–1280
11. Guillot, G., Leblois, R., Coulon, A., Frantz, A.C., (2009). Statistical methods in spatial genetics. Mol. Ecol 18:4734–4756
12. Guillot, G., Mortier, F., Estoup, A., (2005b). Geneland: a computer package for landscape genetics. Mol. Ecol. Notes 5:712–715
13. Guillot, G., Santos, F., Estoup, A., (2008). Analysing georeferenced population genetics data with Geneland: a new algorithm to deal with null alleles and a friendly graphical user interface. Bioinformatics 24:1406–1407
14. Jermini M., Gessler C. (1996). Epidemiology and control of grape Black Rot in Southern Switzerland. Plant Disease 80 (3) 322:325.
15. Harms M., Holz B., Hoffmann C., Lipps H. P., Silvanus W. (2005). Occurrence of Guignardia bidwellii, the causal fungus of Black rot on grapevine, in the vine growing areas of Rhineland-Palatinate, Germany. In International Symposium on Introduction and Spread of Invasive Species, 9-11 June, Humboldt
91
University, Berlin, Germany (http://dpg-bcpc-symposium.de/fileadmin/alte_Webseiten/Invasive_Symposium/articles/articles.htm
16. Hoffman L. E., Wilcox W. F. Gadoury D. M., Seem R. C. (2002). Influence of Grape Berry Age on Susceptibility to Guignardia bidwellii and ITS Incubation period lenght. Phytopatology 92(10):1068-1076.
17. Lüstner G. (1935). Auftreten der Schwarzfaule (Black rot) der Rebe in Deutschland. Nachrichtenblatt des Deutschen Pflanzenschutzdienst 15 p. 27
18. Luttrell E. S. (1946). Black rot of Muscadine grapes. Phytopatology 36:905-924. 19. Martelli U. (1891). Il black rot sulle viti presso Firenze. Nuovo Giornale
Botanico Italiano 23:604-610. 20. O’DonnelK., Nirenberg H. I., Aoki T., Cigelnik E. (2000). A multigene phylogeny
of the Gibberella fujikuroi species complex: detection of additional phylogenetically distinct
21. Peel, M. C.; Finlayson, B. L.; McMahon, T. A. (2007). "Updated world map of the Köppen-Geiger climate classification". Hydrology and Earth System Sciences11(5):1633-1644. doi:10.5194/hess-11-1633-2007. Retrieved 2011-02-27.
22. Pinney T. (2005). A history of wine in America. From the beginnings to prohibition. University of California Press.
23. Pinney T. (2012). The makers of American wine. University of California Press. 24. Pezet R. and Jermini M. (1989). Le Black-Rot de la vigne: symptoms,
épidémiologie et lutte. Rev. Suisse Vitic. Arboric. Hortic. 21:27-34. 25. Ramsdell D. C., Milholland R. D., (1990). Compendium of grape disease pp. 15-
17 26. Ravaz L. (1914). Le Black-Rot en Espagne. Le Progress Agricole et Viticole,
Montpellier, 1914, 31° année n° 30 p. 115 27. Rego C., Oliveira H. (2007). “Black rot” da videira causado por Guignardia
bidwellii. Actas do 7° Simpòsio de Vitivinicultura do Alentejo, 23 a 25 de Maio, Évora, 107-114.
28. Rinaldi P. A., Mugnai L. (2012). Marciume nero degli acini, potenziale pericolo in viticoltura. Informatore Agrario 15:68-71.
29. Rossi M. (2012). Indagini sulla biologia ed epidemiologia del marciume nero della vite in Toscana. Tesi di Laurea
30. Roussel C. (1972). Le Black-rot de la vigne. Progrès Agricole et Viticole 11:270-282.
31. Rui D. (1935). Il black rot o marciume nero dell’uva nell’isola di Veglia (Jugoslavia). Annuario della R. Stazione di viticoltura e di enologia di Conegliano Vol. 5.
32. Rui D., Torresin G. C., Pizzoli L., Carraro S (1987). Lotta guidata contro il black-rot della vite. Informatore Agrario 38:53-58.
92
33. Salzman R. A., Tikhonova I., Bordelon B. T., Hasegawa P. M. and Bressan R. A. (1998). Coordinate accumulation of Antifungal Proteins and Hexoses Constitutes a Developmentally Controlled Defence Response during Fruit Ripening in Grape. Plant Physiology 117:465-472.
34. Tenzer I., Degli Ivanisevich S., Morgante M., Gessler C. (1999). Identificaion of microsatellite markers and their application to population genetics of Venturia inequalis. Phytopathology 89(9):748-753
35. Trincheri G. (1935). Il “blackrot” della vite in Italia? Il Coltivatore e Giornale Vinicolo Italiano 1:230-232
36. Thompson J. D., Higgins D. G., Gibson T. J. (1994). CLUSTAL W:improving the sensivity of progressive multiple sequence alignment through sequence weighting, position-specific gap penalities and weight matrix choice. Nucleic Acids Research 22(22)4673:4680.
37. Valsesia G.; Gobbin D., Patocchi A., Vecchione A., Pertot I., and Gessler C. (2005). Development of a High-throughput method for quantification of Plasmopara viticola DNA in grapevine leaves by means of quantitative Real-Time Polymerase Chain Reaction. Phytopathology 95(6)672:678.
38. Viala P. Ravaz, L. (1888). Note sur le Black Rot (Laestadia bidwellii). Prog. Agr. Et Vit. 9:490-493. I.er Semestre.
39. White T. J., Bruns T., Lee S., Taylor J. (1990). Amplification and direct sequencing of fungal ribosomal RNA genes for phylogenetics. In: Innis M. A., Gelfand D. H., Sninsky J. J., White T. J., eds. PCR protocols: a guide to methods and applications. Academic press. P 315-322.
40. Winton L. M. Krohn A. L. Leiner R. H. (2007). Microsatellite markers for Sclerotinia subartica nom. Prov., a new vegetable pathogen of the high North. Molecular Ecology Notes 7:1077-1079.
41. Zhang K., Zhang N., Cai L., (2013). Typification and phylogenetic study of Phyllosticta amplelicida and P. vaccinii. Mycologia 2013 105:1030-1042; Preliminary version published online: May 24, 2013, doi:10.3852/12-392
93
Ringraziamenti Mai così tanto dovetti a così tanti! In primo luogo un grazie al Prof. Paolo Capretti, ha apprezzato il mio esame di ingresso e mi ha consentito di realizzare questa bella Esperienza. Un grazie al Prof. Salvatore Moricca, che tanto amorevolmente ha accettato di condividere la sua stanza con me, dimostrandosi uomo di gradevole compagnia. Un ringraziamento particolare al ricercatore Guido Marchi, a lui devo il mio ingresso nella biologia molecolare. Un immenso GRAZIE di tutto cuore al Professor Cesare Gessler, per avermi accolto a Zurigo presso il suo prestigioso istituto ed avermi consentito di portare a casa risultati altrimenti impensabili ed insperati, ma soprattutto per avermi fatto conoscere un meraviglioso gruppo di persone. Ringrazio i tecnici di laboratorio Cecilia Comparini e Antonio Esposito per la loro costante presenza dentro ma soprattutto fuori i laboratori. Grazie ai Professori Alessandro Ragazzi e Giuseppe Surico per non aver mai negato aiuti e conforto. Un immenso grazie ai miei tutors Laura Mugnai e Donatella Paffetti per aver consentito che questo lavoro prendesse forma. Terminati i ringraziamenti istituzionali devo ricordare i Dottorandi senior con cui ho condiviso giornate, esperienze di vita e laboratori: GRAZIE a Beatrice Ginetti, per tutto. Grazie a Matteo Feducci per gli immancabili aiuti l’allegria sempre contagiosa che ha trasmesso e la convivialità dimostrata. Grazie a Tamara Cinelli sempre gentile, cortese ma soprattutto paziente con me, per qualunque minima o grande inesattezza avessi mai commesso. Ringrazio tutti i ragazzi tesisti e studenti con cui ho lavorato, grazie a Domenico Bossio, a Marco Baleani, a Costanza Lari, ad Azzurra Feliciani, a Marco Rossi e Martina Barcia.


![MATERIALI!AGGIUNTIVI! - epiprev.it · [humans]/lim! Record(trovati:(2.278(((( ... Tipo!di!intervento!non!nei!criteri!di!inclusione:!mancanza!del!gruppo!di!controllo! Flachenecker!2014!](https://img.pdfslide.us/doc/110x75/5c66852f09d3f20f218c62c4/materialiaggiuntivi-humanslim-recordtrovati2278-tipodiinterventononneicriteridiinclusionemancanzadelgruppodicontrollo.jpg)