Embed Size (px)
Citation preview

“ Add your company slogan ”
Decision Tree
Prem Junsawang
LOGO
Department of StatisticsFaculty of ScienceKhon Kaen University

Overview
Predictive ModelsThe process by which a model is
created or chosen to try to bestpredict the probability of anoutcome (Classification)
Predictive ModelsThe process by which a model is
created or chosen to try to bestpredict the probability of anoutcome (Classification)

Overview
Classification Classification Classification
Overview Classification Concept
• Given a training set: each recordcontains a set of attributes (features,parameters, variables) and a class label(target)
• Find a model for a function of a set ofattributes
• Gold is to predict class labels of anunseen records as accurately aspossible:
Classification Concept• Given a training set: each recordcontains a set of attributes (features,parameters, variables) and a class label(target)
• Find a model for a function of a set ofattributes
• Gold is to predict class labels of anunseen records as accurately aspossible:
Classification Concept• Given a training set: each recordcontains a set of attributes (features,parameters, variables) and a class label(target)
• Find a model for a function of a set ofattributes
• Gold is to predict class labels of anunseen records as accurately aspossible:

Overview Test Set : determine an accuracy of amodel Examples of classification techniques
• Decision tree• Genetic Algorithm• Neural Network• Bayesian Classifier• K-nearest neighbor
Test Set : determine an accuracy of amodel Examples of classification techniques
• Decision tree• Genetic Algorithm• Neural Network• Bayesian Classifier• K-nearest neighbor
Test Set : determine an accuracy of amodel Examples of classification techniques
• Decision tree• Genetic Algorithm• Neural Network• Bayesian Classifier• K-nearest neighbor
Overview Decision Tree Tree-shaped structure that represent set ofdecisions for generating rules forclassification of a dataset.
Genetic Algorithms Optimization techniques that use theconcept of evolution such as selection,crossover and mutation
Neural Network Nonlinear predictive model that learnthrough learning and resemble biologicalneural network
Decision Tree Tree-shaped structure that represent set ofdecisions for generating rules forclassification of a dataset.
Genetic Algorithms Optimization techniques that use theconcept of evolution such as selection,crossover and mutation
Neural Network Nonlinear predictive model that learnthrough learning and resemble biologicalneural network

Overview Bayesian ClassifierBayesian Theorem
K-nearest neighbor Perform prediction by finding theprediction value of records similar tothe record to be predicted Determine an email as spam or not spam
Bayesian ClassifierBayesian Theorem
K-nearest neighbor Perform prediction by finding theprediction value of records similar tothe record to be predicted Determine an email as spam or not spam
Bayesian ClassifierBayesian Theorem
K-nearest neighbor Perform prediction by finding theprediction value of records similar tothe record to be predicted Determine an email as spam or not spam

Overview Learning algorithm
• identify a model that best fits therelationship between the set ofattributes and its class label
Examples:• Classify credit card transactions as
legitimate (ของจริง) or fraudulent (ของปลอม)
Learning algorithm• identify a model that best fits the
relationship between the set ofattributes and its class label
Examples:• Classify credit card transactions as
legitimate (ของจริง) or fraudulent (ของปลอม)
Learning algorithm• identify a model that best fits the
relationship between the set ofattributes and its class label
Examples:• Classify credit card transactions as
legitimate (ของจริง) or fraudulent (ของปลอม)

Overview Classification Process
Tid Attrib1 Attrib2 Attrib3 Class
1 Yes Large 125K No
2 No Medium 100K No
3 No Small 70K No
4 Yes Medium 120K No
5 No Large 95K Yes
6 No Medium 60K No
7 Yes Large 220K No
8 No Small 85K Yes
9 No Medium 75K No
10 No Small 90K Yes10
Classification Process
LearnModel
Tid Attrib1 Attrib2 Attrib3 Class
1 Yes Large 125K No
2 No Medium 100K No
3 No Small 70K No
4 Yes Medium 120K No
5 No Large 95K Yes
6 No Medium 60K No
7 Yes Large 220K No
8 No Small 85K Yes
9 No Medium 75K No
10 No Small 90K Yes10
Classification Process
ApplyModelTid Attrib1 Attrib2 Attrib3 Class
11 No Small 55K ?
12 Yes Medium 80K ?
13 Yes Large 110K ?
14 No Small 95K ?
15 No Large 67K ?10

Decision Tree Induction Example of a Decision Tree

Decision Tree Induction Another Example of a Decision Tree

Decision Tree Induction Decision Tree Classification Task
Tid Attrib1 Attrib2 Attrib3 Class
1 Yes Large 125K No
2 No Medium 100K No
3 No Small 70K No
4 Yes Medium 120K No
5 No Large 95K Yes
6 No Medium 60K No
7 Yes Large 220K No
8 No Small 85K Yes
9 No Medium 75K No
10 No Small 90K Yes10
ApplyModel
LearnModel
Tid Attrib1 Attrib2 Attrib3 Class
1 Yes Large 125K No
2 No Medium 100K No
3 No Small 70K No
4 Yes Medium 120K No
5 No Large 95K Yes
6 No Medium 60K No
7 Yes Large 220K No
8 No Small 85K Yes
9 No Medium 75K No
10 No Small 90K Yes10
ApplyModel
Tid Attrib1 Attrib2 Attrib3 Class
11 No Small 55K ?
12 Yes Medium 80K ?
13 Yes Large 110K ?
14 No Small 95K ?
15 No Large 67K ?10

Decision Tree Induction Apply Model to Test Data

Decision Tree Induction Apply Model to Test Data

Decision Tree Induction Apply Model to Test Data

Decision Tree Induction Apply Model to Test Data

Decision Tree Induction Apply Model to Test Data

Decision Tree Induction Apply Model to Test Data

Decision Tree Induction Decision Tree Classification Task
Tid Attrib1 Attrib2 Attrib3 Class
1 Yes Large 125K No
2 No Medium 100K No
3 No Small 70K No
4 Yes Medium 120K No
5 No Large 95K Yes
6 No Medium 60K No
7 Yes Large 220K No
8 No Small 85K Yes
9 No Medium 75K No
10 No Small 90K Yes10
ApplyModel
LearnModel
Tid Attrib1 Attrib2 Attrib3 Class
1 Yes Large 125K No
2 No Medium 100K No
3 No Small 70K No
4 Yes Medium 120K No
5 No Large 95K Yes
6 No Medium 60K No
7 Yes Large 220K No
8 No Small 85K Yes
9 No Medium 75K No
10 No Small 90K Yes10
ApplyModel
Tid Attrib1 Attrib2 Attrib3 Class
11 No Small 55K ?
12 Yes Medium 80K ?
13 Yes Large 110K ?
14 No Small 95K ?
15 No Large 67K ?10

Decision Tree InductionMany Algorithms:
• Hunt’s Algorithm• CART• ID 3 or C 4.5
How to build a Decision Tree• Hunt’s Algorithm The basis of many
existing decision tree inductionalgorithms, including ID3, C4.5 andCART
Many Algorithms:• Hunt’s Algorithm• CART• ID 3 or C 4.5
How to build a Decision Tree• Hunt’s Algorithm The basis of many
existing decision tree inductionalgorithms, including ID3, C4.5 andCART
Many Algorithms:• Hunt’s Algorithm• CART• ID 3 or C 4.5
How to build a Decision Tree• Hunt’s Algorithm The basis of many
existing decision tree inductionalgorithms, including ID3, C4.5 andCART

Decision Tree Induction Hunt’s Algorithm
• Let’s Dt be the set of training recordsthat are associated with node t andy={y1 ,y2 , …,yc} be the class labels1. If all records in Dt belong to the sameclass yt , then t is a leaf node labeledas yt
2. If Dt contains records that belong tomore than one class, an attribute testcondition is select to partition therecords into smaller subsets
Hunt’s Algorithm• Let’s Dt be the set of training recordsthat are associated with node t andy={y1 ,y2 , …,yc} be the class labels1. If all records in Dt belong to the sameclass yt , then t is a leaf node labeledas yt
2. If Dt contains records that belong tomore than one class, an attribute testcondition is select to partition therecords into smaller subsets

Decision Tree Induction How to the algorithm works How to the algorithm works

Decision Tree Induction How to the algorithm works How to the algorithm works

Decision Tree Induction How to the algorithm works How to the algorithm works

Decision Tree InductionDesign Issues of DT InductionHow should the training records be
split?• An measurement is used to evaluate the
goodness of each test condition
How should the splitting procedurestop?• All records belong to the same class• The records have identical attribute
values
Design Issues of DT InductionHow should the training records be
split?• An measurement is used to evaluate the
goodness of each test condition
How should the splitting procedurestop?• All records belong to the same class• The records have identical attribute
values
Design Issues of DT InductionHow should the training records be
split?• An measurement is used to evaluate the
goodness of each test condition
How should the splitting procedurestop?• All records belong to the same class• The records have identical attribute
values

Decision Tree InductionMethod for Expressing Attribute
Test Condition1. Binary Attributes2. Nominal Attributes3. Ordinal Attributes4. Continuous Attributes
Method for Expressing AttributeTest Condition1. Binary Attributes2. Nominal Attributes3. Ordinal Attributes4. Continuous Attributes
Method for Expressing AttributeTest Condition1. Binary Attributes2. Nominal Attributes3. Ordinal Attributes4. Continuous Attributes

Decision Tree Induction Binary Attributes Binary Attributes Binary Attributes

Decision Tree Induction Nominal Attributes Nominal Attributes Nominal Attributes

Decision Tree Induction Ordinal Attributes Ordinal Attributes Ordinal Attributes

Decision Tree Induction Continuous Attributes Continuous Attributes Continuous Attributes

Decision Tree Induction Splitting Based on Continuous Attributes Discretization – form an ordinal attribute
•Static – discretize once at the beginning
•Dynamic – range can be determined by equalinterval bucketing, equal frequency bucketing orclustering
Binary Decision - A<v or A>v•Consider all possible splits and find the best cut
•More time consumption
Splitting Based on Continuous Attributes Discretization – form an ordinal attribute
•Static – discretize once at the beginning
•Dynamic – range can be determined by equalinterval bucketing, equal frequency bucketing orclustering
Binary Decision - A<v or A>v•Consider all possible splits and find the best cut
•More time consumption

Decision Tree Induction Continuous Attributes Continuous Attributes Continuous Attributes

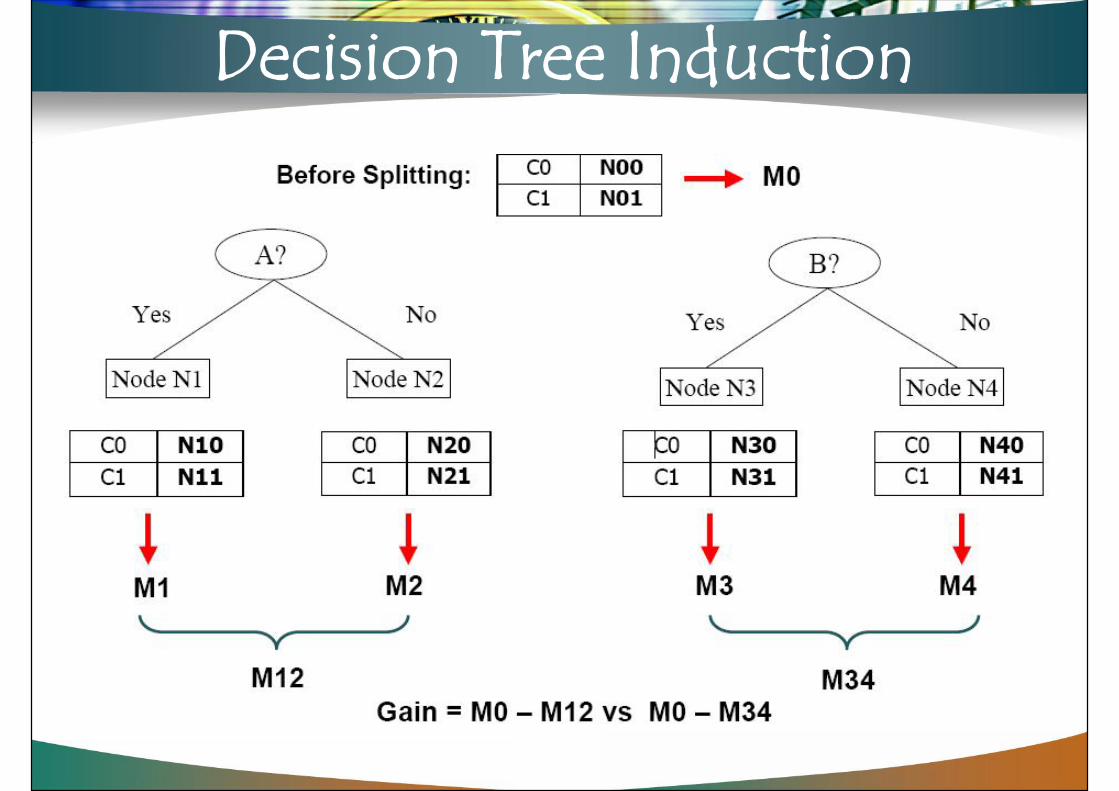
Decision Tree Induction How to Determine the Best Split
• Nodes with homogeneous classdistribution are preferred
• Measure of node impurity
How to Determine the Best Split• Nodes with homogeneous class
distribution are preferred• Measure of node impurity
How to Determine the Best Split• Nodes with homogeneous class
distribution are preferred• Measure of node impurity
Non-homogeneous,
High degree of impurity
Homogeneous,
Low degree of impurity
Decision Tree Induction

Decision Tree InductionMeasure of Impurity
Let p(i | t) denote the fraction of recordsbelonging to class i at a given node t
Measure of ImpurityLet p(i | t) denote the fraction of records
belonging to class i at a given node t
21
2
1
2
Entropy( ) ( | ) log ( | ) (1)
Gini( ) 1 [ ( | )] (2)
Classification error( ) = 1 max[ ( | )] (3)
Where is the number of classes and 0log 0 = 0 i
C
iC
i
i
t p i t p i t
t p i t
t p i t
C
n entropy calcalation

Decision Tree InductionMeasure of Impurity
p(0|gender) = 10/17, p(1|gender) = 7/17
• Gini Index(Gender)= 1 - [ (10/17)2+(7/17)2 ]= 0.4844
• Entropy(Gender)= - [(10/17) log2(10/17) +(7/17) log2(7/17)]= 0.7655
• Error (Gender)= 1- max{(10/17), (7/17)} = 1-(10/17) =0.4118
Measure of Impurityp(0|gender) = 10/17, p(1|gender) = 7/17
• Gini Index(Gender)= 1 - [ (10/17)2+(7/17)2 ]= 0.4844
• Entropy(Gender)= - [(10/17) log2(10/17) +(7/17) log2(7/17)]= 0.7655
• Error (Gender)= 1- max{(10/17), (7/17)} = 1-(10/17) =0.4118
Measure of Impurityp(0|gender) = 10/17, p(1|gender) = 7/17
• Gini Index(Gender)= 1 - [ (10/17)2+(7/17)2 ]= 0.4844
• Entropy(Gender)= - [(10/17) log2(10/17) +(7/17) log2(7/17)]= 0.7655
• Error (Gender)= 1- max{(10/17), (7/17)} = 1-(10/17) =0.4118

Decision Tree Induction ทดสอบ ทดสอบ
Car Type
Family Luxury
Sport
ทดสอบ
C0: 1C1: 3
C0: 1C1: 7
C0: 8C1: 0

Decision Tree Induction Gini Index Gini Index Gini Index

Decision Tree Induction

Decision Tree InductionTable: Training data tuples from the all electronics customerdatabase

Decision Tree Induction Gini Index is used as impurity
measure2 2
2 2
Gini(root) 1 [ (0| ) (1| ) ]5 91 [( ) ( ) ] 0.4592
14 14Gini(root)=Gini(age)=Gini(income)=Gini(student)
p root p root
Gini Index is used as impuritymeasure
2 2
2 2
Gini(root) 1 [ (0| ) (1| ) ]5 91 [( ) ( ) ] 0.4592
14 14Gini(root)=Gini(age)=Gini(income)=Gini(student)
p root p root
Gini Index is used as impuritymeasure

Decision Tree Induction Age: <=30(V1), 31-40(V2) and >40(V3)
2 21 1 1
2 2
( ) 1 [ (0 | ) (1| ) ]3 21 [( ) ( ) ] 0.485 5
Gini v p v p v
Age: <=30(V1), 31-40(V2) and >40(V3)
2 21 1 1
2 2
( ) 1 [ (0 | ) (1| ) ]3 21 [( ) ( ) ] 0.485 5
Gini v p v p v
2 22 2 2
2 2
( ) 1 [ (0 | ) (1| ) ]0 41 [( ) ( ) ] 04 4
Gini v p v p v
Age: <=30(V1), 31-40(V2) and >40(V3)
2 22 2 2
2 2
( ) 1 [ (0 | ) (1| ) ]0 41 [( ) ( ) ] 04 4
Gini v p v p v
2 23 3 3
2 2
( ) 1 [ (0 | ) (1| ) ]2 31 [( ) ( ) ] 0.485 5
Gini v p v p v

Decision Tree Induction Gain(age)
31 21 2 3
(age)( )( ) ( )( ) [ ( ) ( ) ( )]
5 4 50.4592 [( )0.48 ( )0 ( )0.48]14 14 14
0.1163
GainN vN v N vGini age Gini v Gini v Gini v
N N N
Gain(age)
31 21 2 3
(age)( )( ) ( )( ) [ ( ) ( ) ( )]
5 4 50.4592 [( )0.48 ( )0 ( )0.48]14 14 14
0.1163
GainN vN v N vGini age Gini v Gini v Gini v
N N N
Gain(age)

Decision Tree Induction Income: high, medium and low
2 2
2 2
( ) 1 [ (0 | ) (1| ) ]2 21 [( ) ( ) ] 0.54 4
Gini h p h p h
Income: high, medium and low
2 2
2 2
( ) 1 [ (0 | ) (1| ) ]2 21 [( ) ( ) ] 0.54 4
Gini h p h p h
2 2
2 2
( ) 1 [ (0 | ) (1| ) ]2 41 [( ) ( ) ] 0.446 6
Gini m p m p m
Income: high, medium and low
2 2
2 2
( ) 1 [ (0 | ) (1| ) ]2 41 [( ) ( ) ] 0.446 6
Gini m p m p m
2 2
2 2
( ) 1 [ (0 | ) (1| ) ]1 31 [( ) ( ) ] 0.384 4
Gini l p l p l

Decision Tree Induction Gain(income)
(income)( ) ( ) ( )(income) [ ( ) ( ) ( )]
4 6 40.4592 [( )0.5 ( )0.44 ( )0.38]14 14 14
0.0192
GainN h N m N lGini Gini h Gini m Gini lN N N
Gain(income)(income)
( ) ( ) ( )(income) [ ( ) ( ) ( )]
4 6 40.4592 [( )0.5 ( )0.44 ( )0.38]14 14 14
0.0192
GainN h N m N lGini Gini h Gini m Gini lN N N
Gain(income)

Decision Tree Induction Student: No and Yes
2 2
2 2
( ) 1 [ (0 | ) (1| ) ]4 31 [( ) ( ) ] 0.497 7
Gini N p No p No
Student: No and Yes
2 2
2 2
( ) 1 [ (0 | ) (1| ) ]4 31 [( ) ( ) ] 0.497 7
Gini N p No p No
2 2
2 2
( ) 1 [ (0 | ) (1| ) ]1 51 [( ) ( ) ] 0.477 7
Gini Y p Yes p Yes
Student: No and Yes
2 2
2 2
( ) 1 [ (0 | ) (1| ) ]1 51 [( ) ( ) ] 0.477 7
Gini Y p Yes p Yes

Decision Tree Induction Gain(student)
(student)( ) ( )(student) [ ( ) ( )]
7 70.4592 [( )0.49 ( )0.47]14 14
0.0208
GainN No N YesGini Gini No Gini YesN N
Gain(student)(student)
( ) ( )(student) [ ( ) ( )]
7 70.4592 [( )0.49 ( )0.47]14 14
0.0208
GainN No N YesGini Gini No Gini YesN N
Gain(student)

Decision Tree Induction Credit rating: fair and excellent
2 2
2 2
( ) 1 [ (0 | ) (1| ) ]2 61 [( ) ( ) ] 0.388 8
Gini f p f p f
Credit rating: fair and excellent
2 2
2 2
( ) 1 [ (0 | ) (1| ) ]2 61 [( ) ( ) ] 0.388 8
Gini f p f p f
2 2
2 2
( ) 1 [ (0 | ) (1| ) ]1 51 [( ) ( ) ] 0.477 7
Gini e p e p e
Credit rating: fair and excellent
2 2
2 2
( ) 1 [ (0 | ) (1| ) ]1 51 [( ) ( ) ] 0.477 7
Gini e p e p e

Decision Tree Induction Gain(student)
( ) ( )(credit_rating) (parent) [ ( ) ( )]
8 60.4592 [( )0.38 ( )0.5 0.027814 14
N e N fGain Gini Gini e Gini fN N
Gain(student)
( ) ( )(credit_rating) (parent) [ ( ) ( )]
8 60.4592 [( )0.38 ( )0.5 0.027814 14
N e N fGain Gini Gini e Gini fN N
Gain(student)

Decision Tree Induction Gain Information
Gain(age) = 0.1163Gain(income) = 0.0192Gain(student) = -0.0208Gain(credit_rating) = 0.0278
Gain InformationGain(age) = 0.1163Gain(income) = 0.0192Gain(student) = -0.0208Gain(credit_rating) = 0.0278
Gain InformationGain(age) = 0.1163Gain(income) = 0.0192Gain(student) = -0.0208Gain(credit_rating) = 0.0278

Decision Tree Induction

Decision Tree Induction Final Decision Tree Final Decision Tree Final Decision Tree
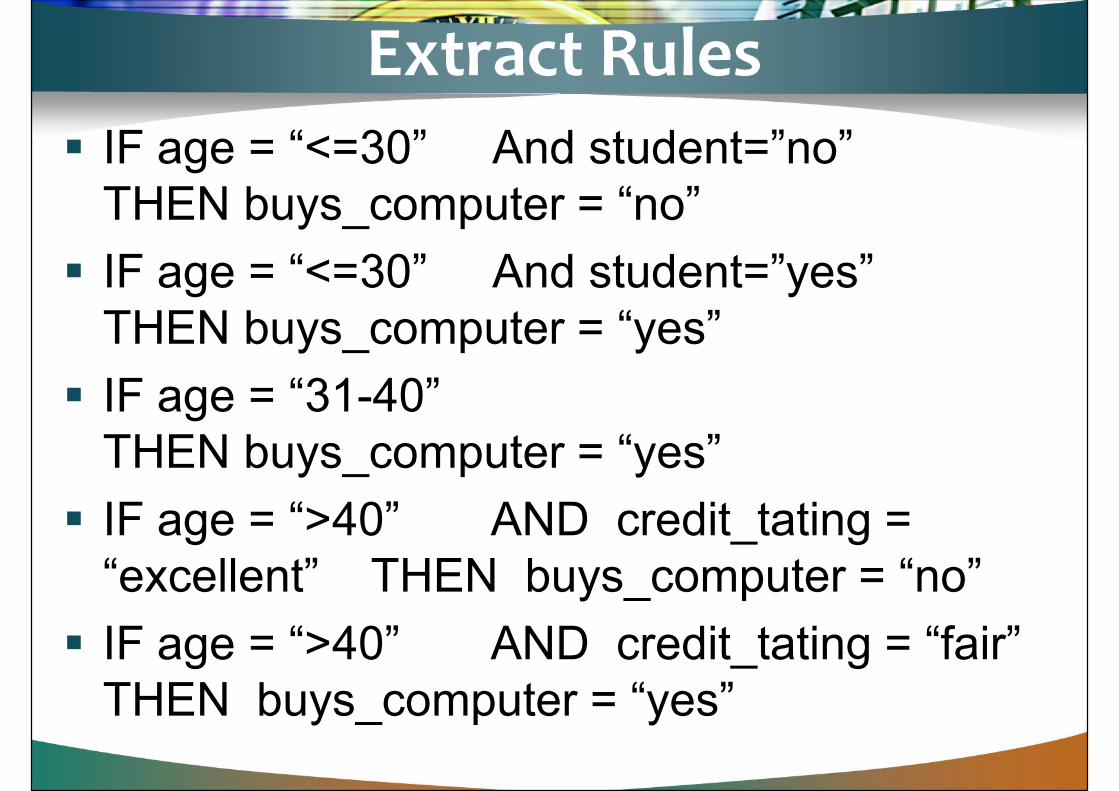
Extract Rules IF age = “<=30” And student=”no”
THEN buys_computer = “no” IF age = “<=30” And student=”yes”
THEN buys_computer = “yes” IF age = “31-40”
THEN buys_computer = “yes” IF age = “>40” AND credit_tating =
“excellent” THEN buys_computer = “no” IF age = “>40” AND credit_tating = “fair”
THEN buys_computer = “yes”
IF age = “<=30” And student=”no”THEN buys_computer = “no” IF age = “<=30” And student=”yes”
THEN buys_computer = “yes” IF age = “31-40”
THEN buys_computer = “yes” IF age = “>40” AND credit_tating =
“excellent” THEN buys_computer = “no” IF age = “>40” AND credit_tating = “fair”
THEN buys_computer = “yes”

Decision Tree Induction How to extract classification rules
from decision tree1. Prepruning approach
2. Postpruning approach
How to extract classification rulesfrom decision tree1. Prepruning approach
2. Postpruning approach
How to extract classification rulesfrom decision tree1. Prepruning approach
2. Postpruning approach

Prepruning Measures such as information gain can be
used to assess the goodness of a split
If partitioning the samples at a node wouldresult in a split that falls below a prespecifiedthreshold, then further partitioning of thegiven subset is halted
Difficulties in choosing an appropriatethreshold.
High thresholds => oversimplified trees Low thresholds => complicated trees
Measures such as information gain can beused to assess the goodness of a split
If partitioning the samples at a node wouldresult in a split that falls below a prespecifiedthreshold, then further partitioning of thegiven subset is halted
Difficulties in choosing an appropriatethreshold.
High thresholds => oversimplified trees Low thresholds => complicated trees

Postpruning Some branches are remove from a fully
grown tree
The cost complexity pruning algorithm is anexample of the postpruning approach
Alternatively, prepruning and postpruningmay be combined
Some branches are remove from a fullygrown tree
The cost complexity pruning algorithm is anexample of the postpruning approach
Alternatively, prepruning and postpruningmay be combined
Some branches are remove from a fullygrown tree
The cost complexity pruning algorithm is anexample of the postpruning approach
Alternatively, prepruning and postpruningmay be combined

Characteristic of DTNonparametric approach for building
classification models
Robust to the presence of noise ofdata set
The presence of redundant attributesdoes not adversely affect theaccuracy of decision trees
Nonparametric approach for buildingclassification models
Robust to the presence of noise ofdata set
The presence of redundant attributesdoes not adversely affect theaccuracy of decision trees
Nonparametric approach for buildingclassification models
Robust to the presence of noise ofdata set
The presence of redundant attributesdoes not adversely affect theaccuracy of decision trees

Evaluating the perf. of a Classifier Holdout Method Random Subsampling Cross-validation
Holdout Method Random Subsampling Cross-validation

Holdout Method The original data with labeled
examples is partitioned: Two disjoint sets, called the training
and the test sets, respectively(e.g.,50-50 or two-thirds for training andone-third for testing).
The original data with labeledexamples is partitioned: Two disjoint sets, called the training
and the test sets, respectively(e.g.,50-50 or two-thirds for training andone-third for testing).
The original data with labeledexamples is partitioned: Two disjoint sets, called the training
and the test sets, respectively(e.g.,50-50 or two-thirds for training andone-third for testing).

Random Subsampling The holdout method can be
repeated several times to improvethe estimation of a classifier’sperformance known as randomsubsampling. The overall accuracy is given by the
average accuracy of all iterations.
The holdout method can berepeated several times to improvethe estimation of a classifier’sperformance known as randomsubsampling. The overall accuracy is given by the
average accuracy of all iterations.
The holdout method can berepeated several times to improvethe estimation of a classifier’sperformance known as randomsubsampling. The overall accuracy is given by the
average accuracy of all iterations.

K-Fold Cross-validation The dataset is partitioned into k
equal-sized parts.One of the parts is used for testing,
while the rest of them are used fortraining. This procedure is repeated k times
so that each partition is used fortesting only once , the total error is give by summing
up the errors for all k runs.
The dataset is partitioned into kequal-sized parts.One of the parts is used for testing,
while the rest of them are used fortraining. This procedure is repeated k times
so that each partition is used fortesting only once , the total error is give by summing
up the errors for all k runs.
The dataset is partitioned into kequal-sized parts.One of the parts is used for testing,
while the rest of them are used fortraining. This procedure is repeated k times
so that each partition is used fortesting only once , the total error is give by summing
up the errors for all k runs.

References P. N. Tan, M Steinbach, V. Kumar,”Introductionto data mining”, Pearson Addison Wesley. เอกสารประกอบการสอนรายวิชา KNOWLEDGE / DATA MINING โดยผศ.ดร. จันทรเจา มงคลนาวิน
P. N. Tan, M Steinbach, V. Kumar,”Introductionto data mining”, Pearson Addison Wesley. เอกสารประกอบการสอนรายวิชา KNOWLEDGE / DATA MINING โดยผศ.ดร. จันทรเจา มงคลนาวิน
P. N. Tan, M Steinbach, V. Kumar,”Introductionto data mining”, Pearson Addison Wesley. เอกสารประกอบการสอนรายวิชา KNOWLEDGE / DATA MINING โดยผศ.ดร. จันทรเจา มงคลนาวิน

“ Add your company slogan ”
LOGO

Decision Tree Induction How to the algorithm works
HomeOwner
MaritalStatus
AnnualIncome
DefaultedBorrower
How to the algorithm works
TidHomeOwner
MaritalStatus
AnnualIncome
DefaultedBorrower
1 Yes Single 125k No2 No Married 100k No3 No Single 70k No4 Yes Married 120k No5 No Divorced 95k Yes6 No Married 60k No6 No Married 60k No7 Yes Divorced 220k No8 No Single 85k Yes9 No Married 75k No10 No Single 90k Yes

Decision Tree Induction How to the algorithm works How to the algorithm works
Decision Tree Induction ทดสอบ Car Type
Family Luxury
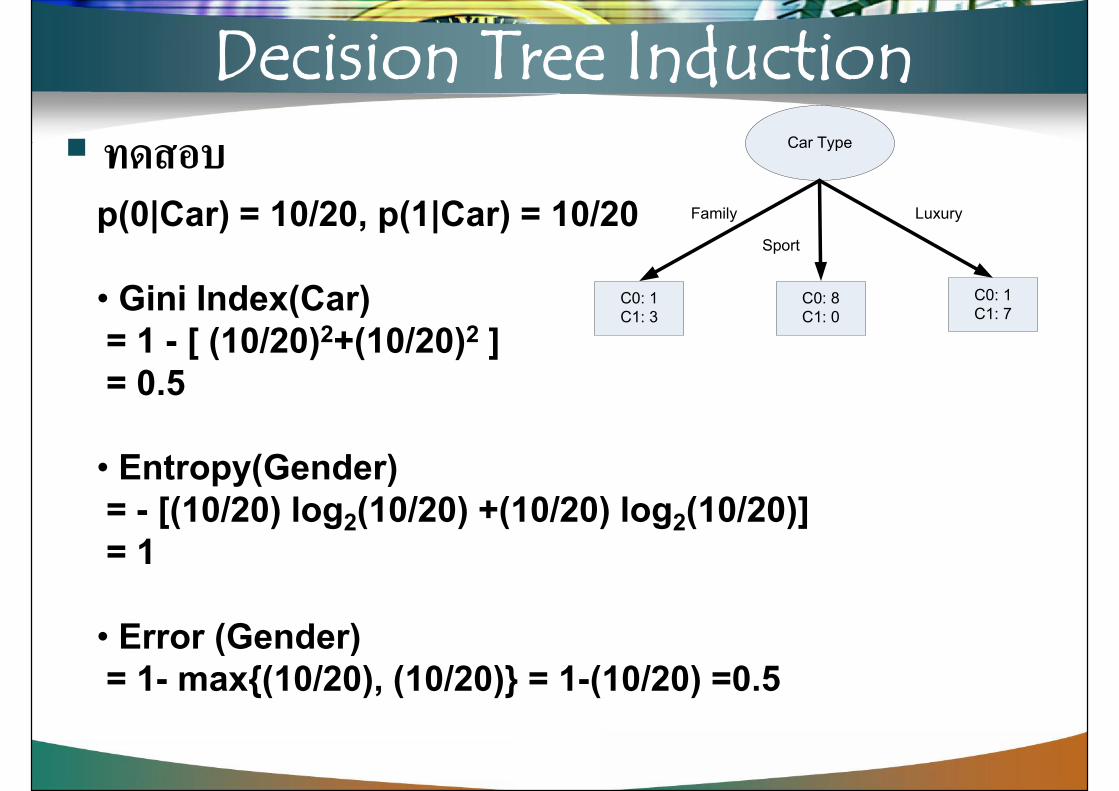
Sportp(0|Car) = 10/20, p(1|Car) = 10/20
• Gini Index(Car)= 1 - [ (10/20)2+(10/20)2 ]= 0.5
• Entropy(Gender)= - [(10/20) log2(10/20) +(10/20) log2(10/20)]= 1
• Error (Gender)= 1- max{(10/20), (10/20)} = 1-(10/20) =0.5
ทดสอบ
C0: 1C1: 3
C0: 1C1: 7
C0: 8C1: 0
p(0|Car) = 10/20, p(1|Car) = 10/20
• Gini Index(Car)= 1 - [ (10/20)2+(10/20)2 ]= 0.5
• Entropy(Gender)= - [(10/20) log2(10/20) +(10/20) log2(10/20)]= 1
• Error (Gender)= 1- max{(10/20), (10/20)} = 1-(10/20) =0.5
ทดสอบp(0|Car) = 10/20, p(1|Car) = 10/20
• Gini Index(Car)= 1 - [ (10/20)2+(10/20)2 ]= 0.5
• Entropy(Gender)= - [(10/20) log2(10/20) +(10/20) log2(10/20)]= 1
• Error (Gender)= 1- max{(10/20), (10/20)} = 1-(10/20) =0.5