Embed Size (px)
Citation preview
Decision Theoretic Analysis of Improving Epidemic Detection
Izadi, M.
Buckeridge, D.
AMIA 2007,Symposium Proceedings 2007
Overview Objective: Improve the accuracy of current
detection methods
Observation: Quantifying the potential costs and effects of intervention can be used to optimize the alarm function
Method: Use Partially Observable Markov Decision Processes on the outbreak detection method
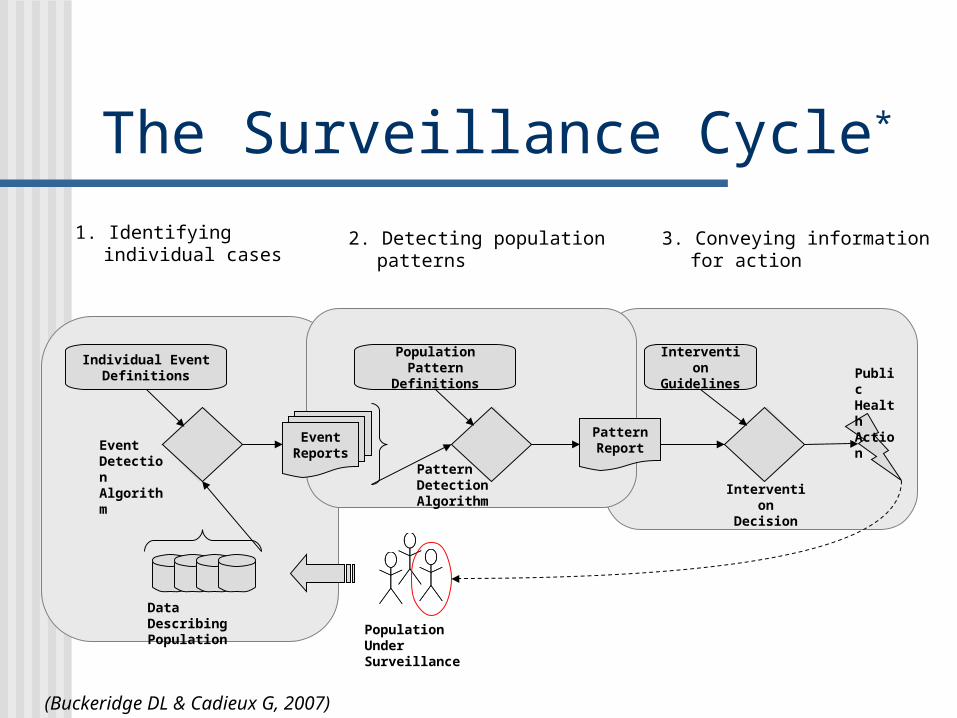
The Surveillance Cycle*
Event Report
s
Individual Event Definitions
Population Pattern
Definitions
Event Detection Algorithm
Pattern Report
Population Under Surveillance
Intervention Decision
Intervention
GuidelinesPublic Health Action
Data Describing Population
Pattern Detection Algorithm
1. Identifying individual cases
2. Detecting population patterns
3. Conveying information for action
(Buckeridge DL & Cadieux G, 2007)
Usual Detection Methods*
Methods are non-specific – they look for anything unusual in the data
Design a baseline.
Define an aberration when some statistics are more than expected values by the baseline.
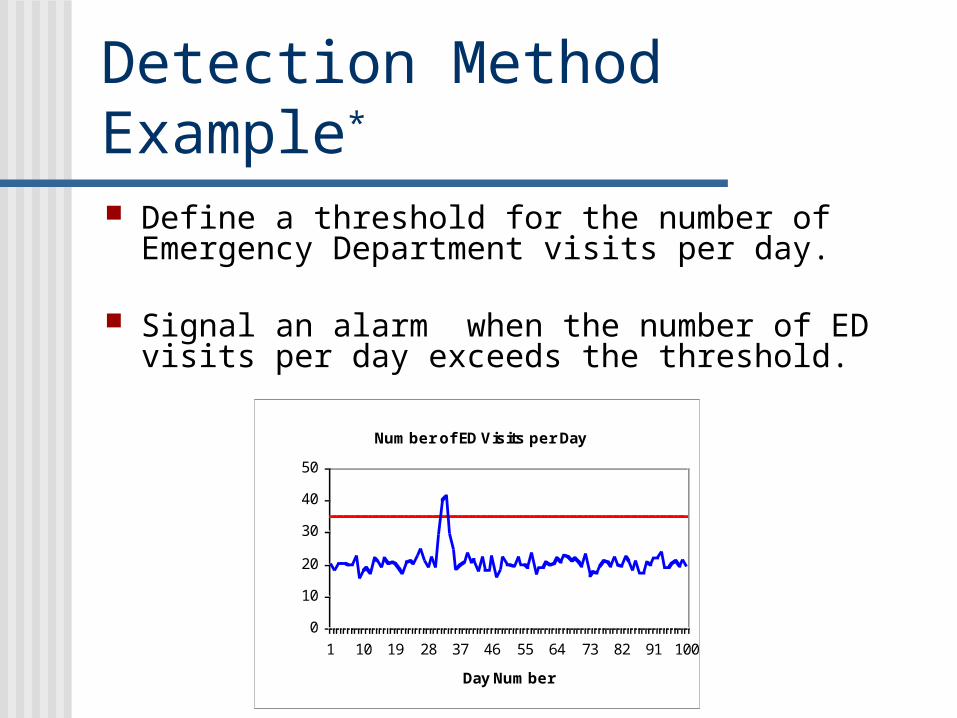
Detection Method Example*
Define a threshold for the number of Emergency Department visits per day.
Signal an alarm when the number of ED visits per day exceeds the threshold.
Number of ED Visits per Day
0
10
20
30
40
50
1 10 19 28 37 46 55 64 73 82 91 100
Day Number
Number of ED Visits
Sensitivity and Specificity Tradeoff
Sensitivity is the probability of alarm given an outbreak P(A+|O+)
Specificity is the probability of no alarm given no out break P(A-|O-)
Timeliness is time between outbreak and detection
Challenge: Increasing sensitivity and improving timeliness decreases specificity
Approach Overview*
Instead of trying to improve the detection method, ‘post-process’ the signals: Use a standard detection method to
provide signalsFeed this signal to a decision support
model to find the optimal action
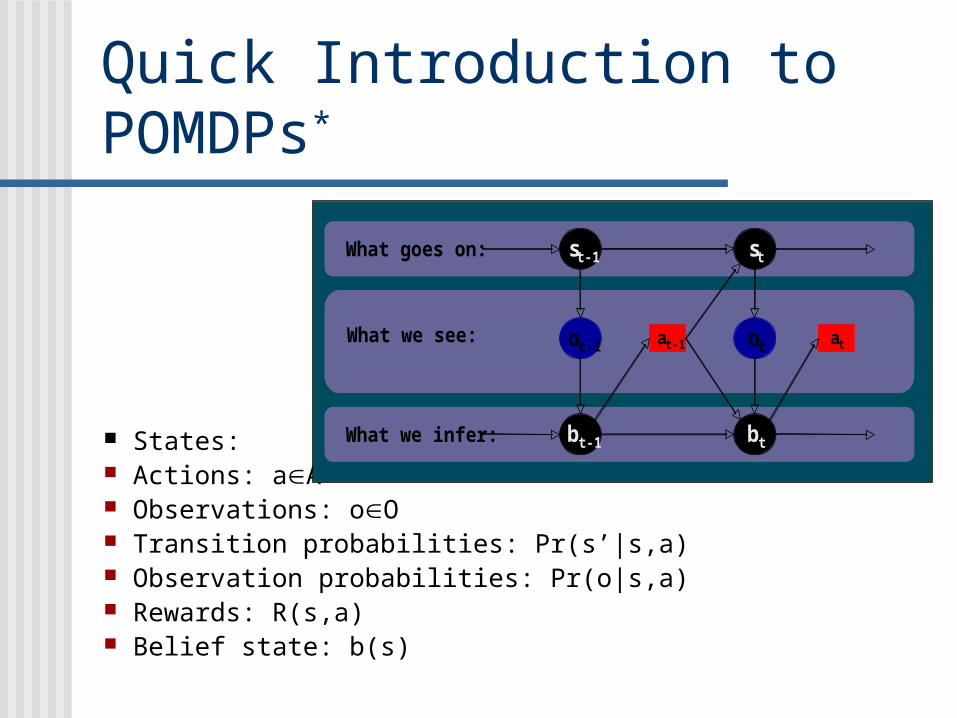
Quick Introduction to POMDPs*
States: sS Actions: aA Observations: oO Transition probabilities: Pr(s’|s,a) Observation probabilities: Pr(o|s,a) Rewards: R(s,a) Belief state: b(s)
What goes on: st-1 st
at-1 atWhat we see: ot-1 ot
What we infer: bt-1 bt
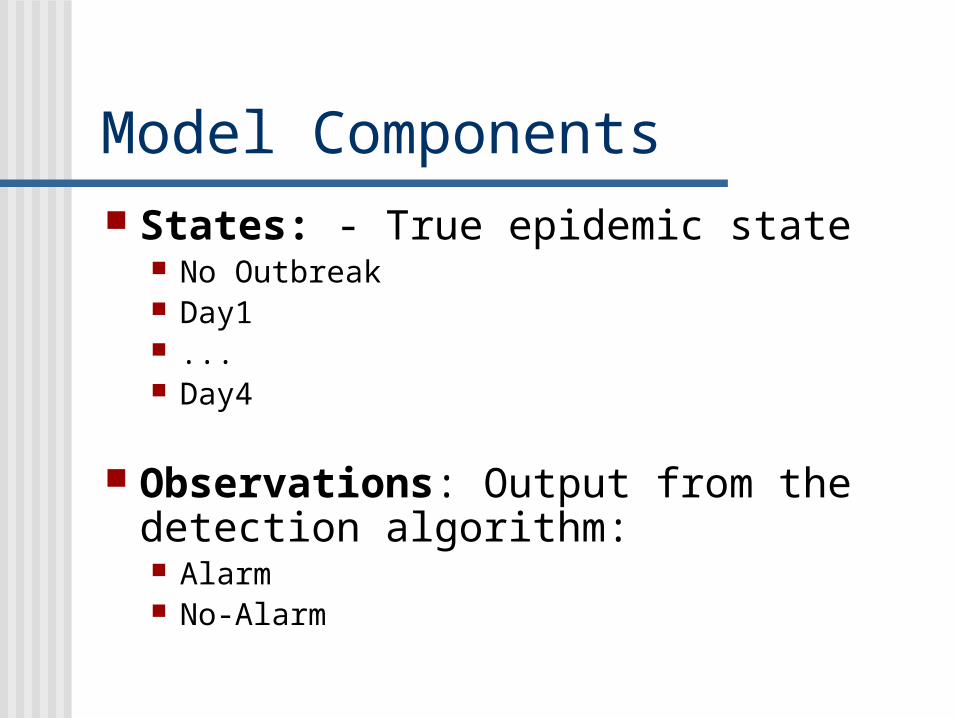
Model Components States: - True epidemic state
No Outbreak Day1 ... Day4
Observations: Output from the detection algorithm: Alarm No-Alarm
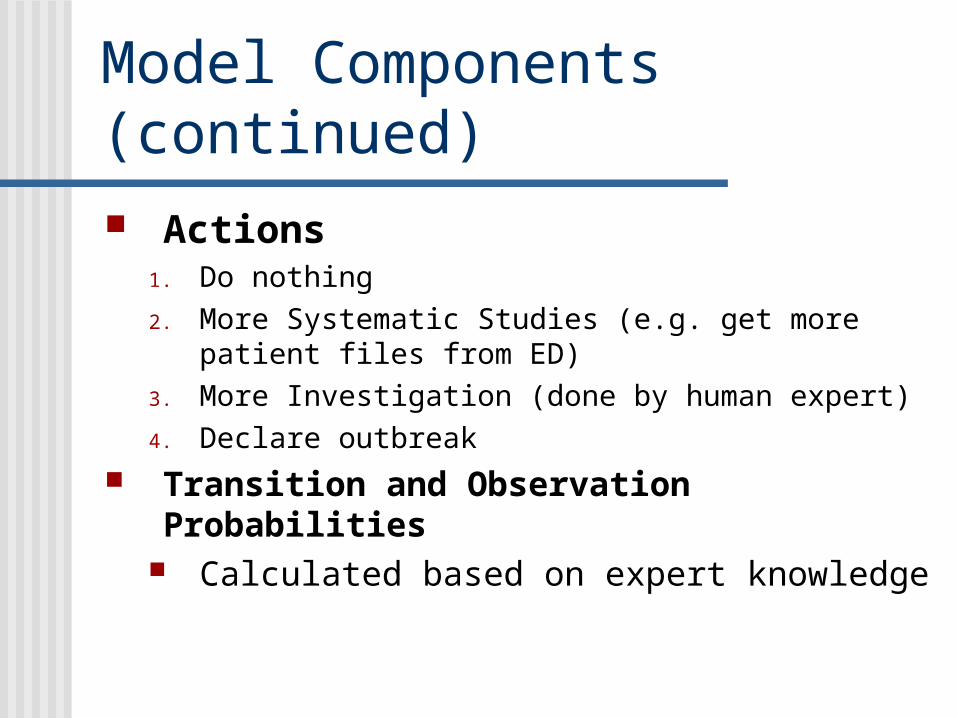
Model Components (continued)
Actions1. Do nothing
2. More Systematic Studies (e.g. get more patient files from ED)
3. More Investigation (done by human expert)
4. Declare outbreak
Transition and Observation Probabilities Calculated based on expert knowledge
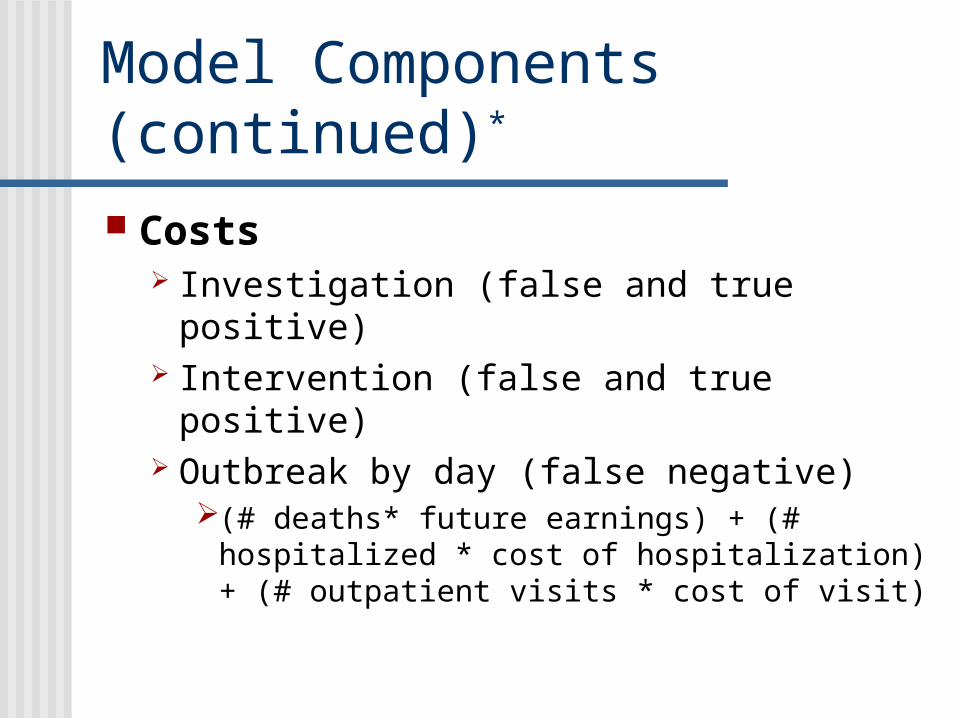
Model Components (continued)*
Costs Investigation (false and true positive) Intervention (false and true positive) Outbreak by day (false negative)
(# deaths* future earnings) + (# hospitalized * cost of hospitalization) + (# outpatient visits * cost of visit)
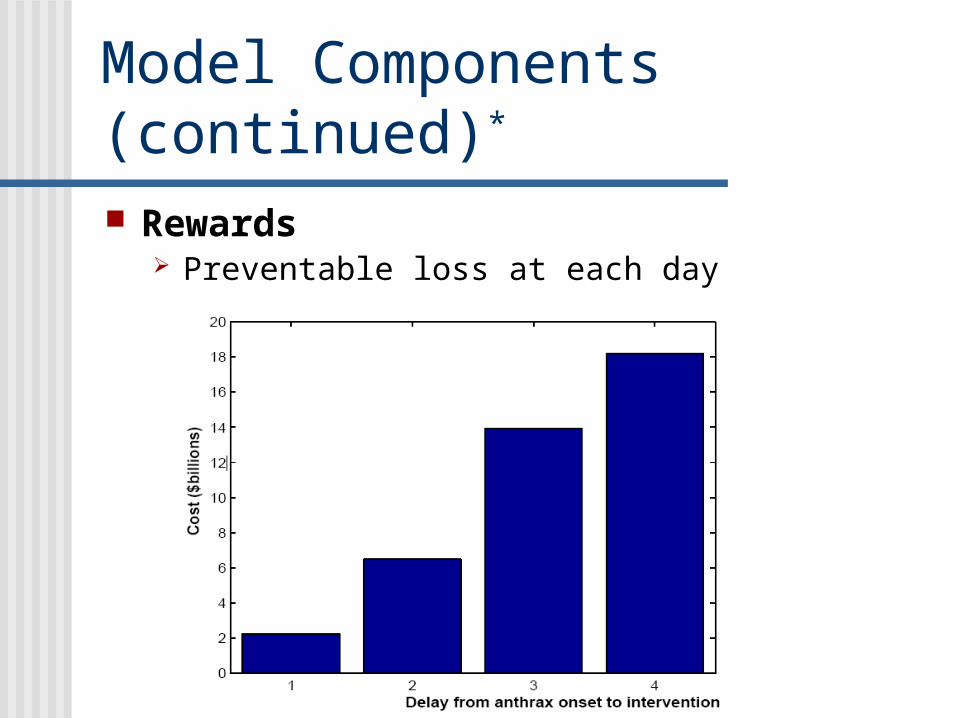
Model Components (continued)*
Rewards Preventable loss at each day
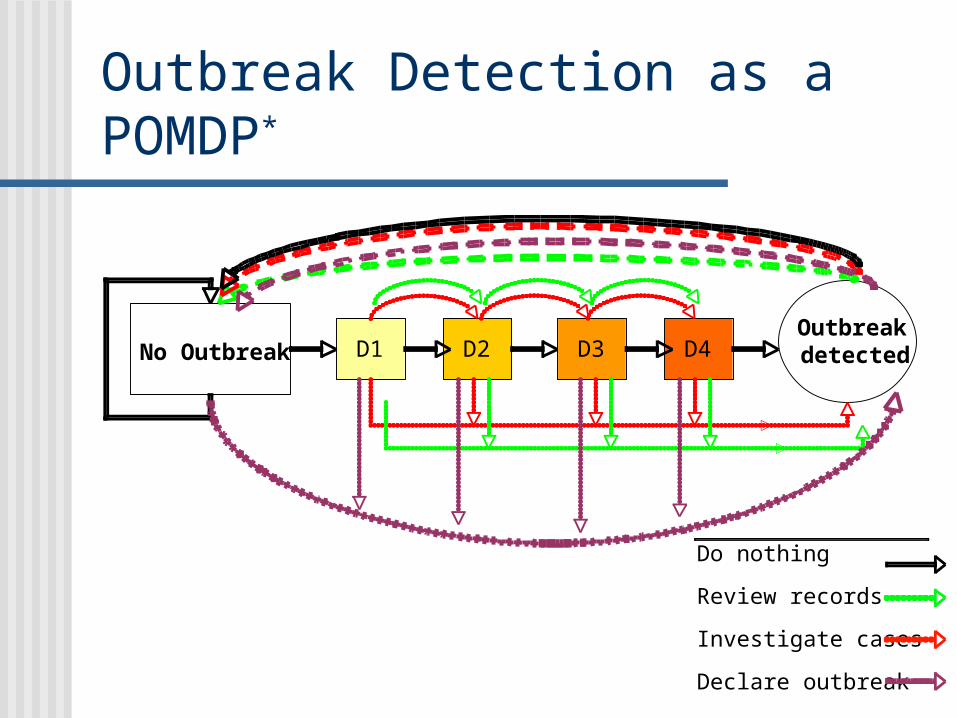
Outbreak Detection as a POMDP*
No OutbreakOutbreakdetectedD1 D2 D3 D4
Do nothing
Review records
Investigate cases
Declare outbreak
Experimental Design Compare a detection method (moving
average) with and without addition of POMDP
Consider a fixed Specificity of 0.97
The comparison is over 10 years simulation Not exactly clear how the data is generated
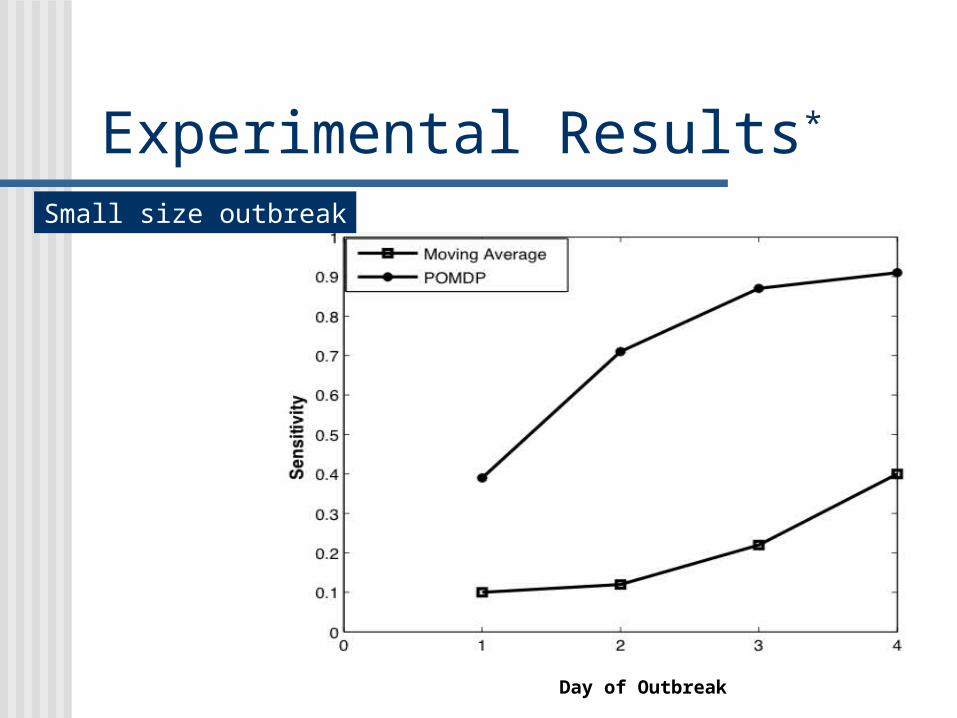
Experimental Results*
Small size outbreak
Day of Outbreak
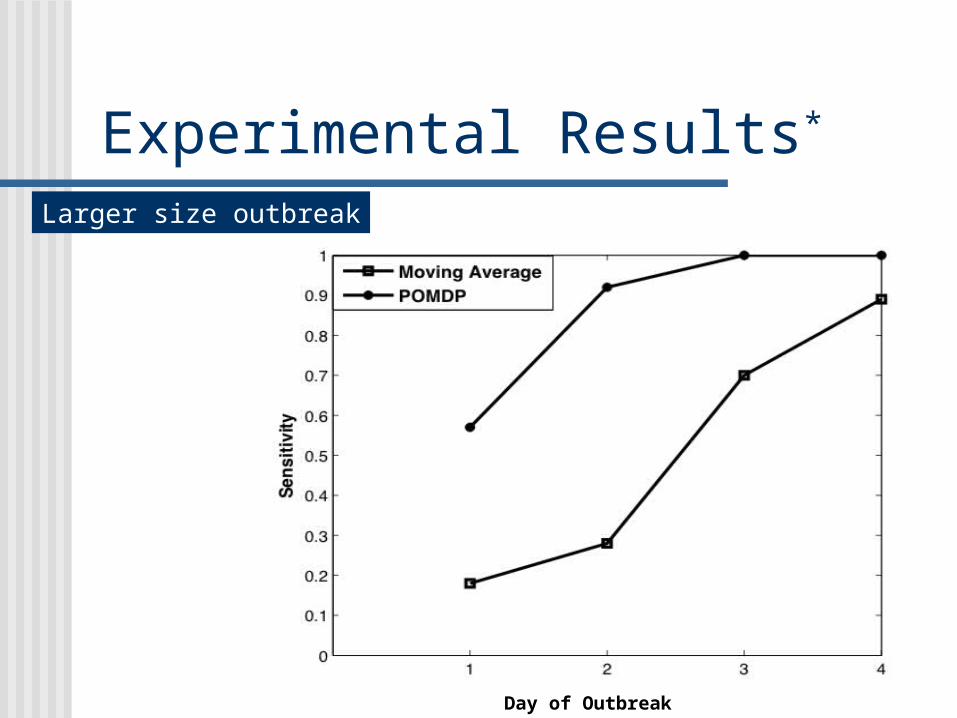
Experimental Results*
Day of Outbreak
Larger size outbreak
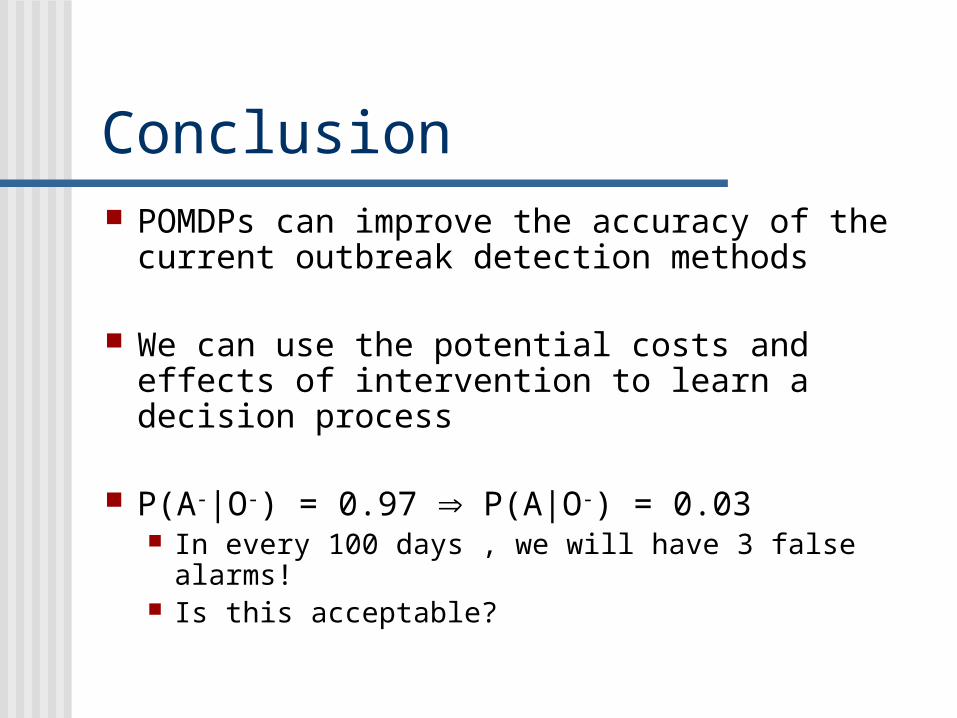
Conclusion POMDPs can improve the accuracy of the
current outbreak detection methods
We can use the potential costs and effects of intervention to learn a decision process
P(A-|O-) = 0.97 P(A|O-) = 0.03 In every 100 days , we will have 3 false alarms! Is this acceptable?