Embed Size (px)
Citation preview
3RD OECD GREEN INVESTMENT FINANCING FORUM
State and trends of green finance
and green investment needs
Ali Izadi
13 October 2015
1
0
5
10
15
20
25
30
35
40
187
0
187
5
188
0
188
5
189
0
189
5
190
0
190
5
191
0
191
5
192
0
192
5
193
0
193
5
194
0
194
5
195
0
195
5
196
0
196
5
197
0
197
5
198
0
198
5
199
0
199
5
200
0
200
5
201
0
201
5
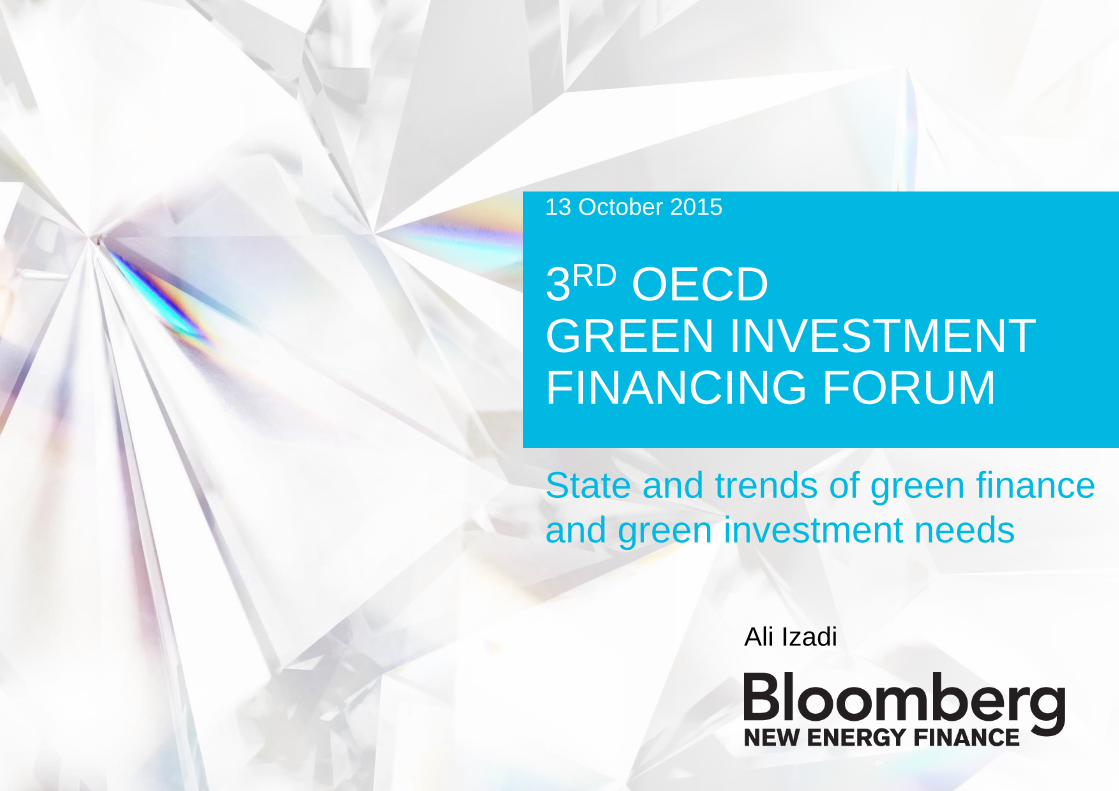
Note: Includes NGL and processing gain, but excludes biofuels
Source: IEA; CDIAC; BP; Bloomberg New
Energy Finance
GLOBAL CARBON EMISSIONS FROM FOSSIL FUELS(GIGATONNES CO2/YEAR)
0.00%2.00%4.00%6.00%8.00%10.00%
30
32
34
36
5.5% 5.7% 3.1% 5.4% 4.2% 3.4% 3.4% 3.4% 3.5%
0%
2%
4%
6%
20
06
20
07
20
08
20
09
20
10
20
11
2012
20
13
20
14
2015
5.5% 5.7% 3.1% 0% 5.4% 4.2% 3.4% 3.4% 3.4% 3.5%
Global GDP growth (real)
2
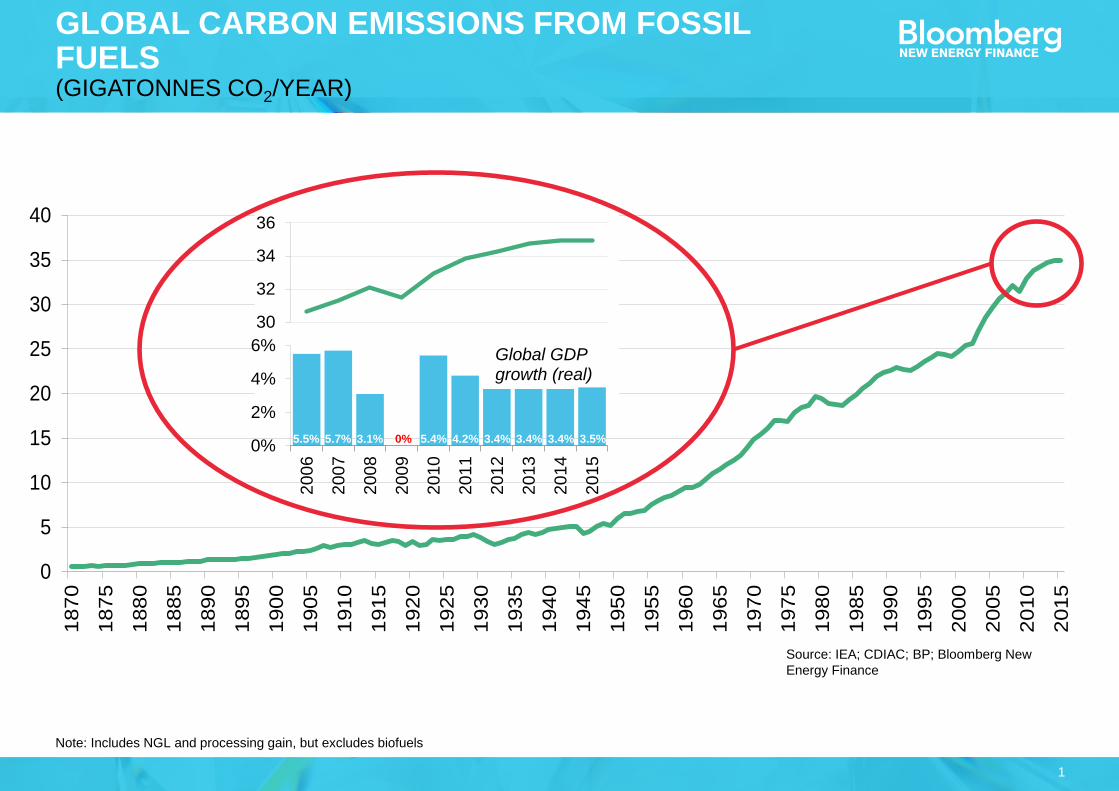
$62bn
$88bn
$128bn
$175bn
$206bn $207bn
$274bn
$318bn$297bn
$272bn
$316bn$329bn
2004 2005 2006 2007 2008 2009 2010 2011 2012 2013 2014 2015
$146/bbl
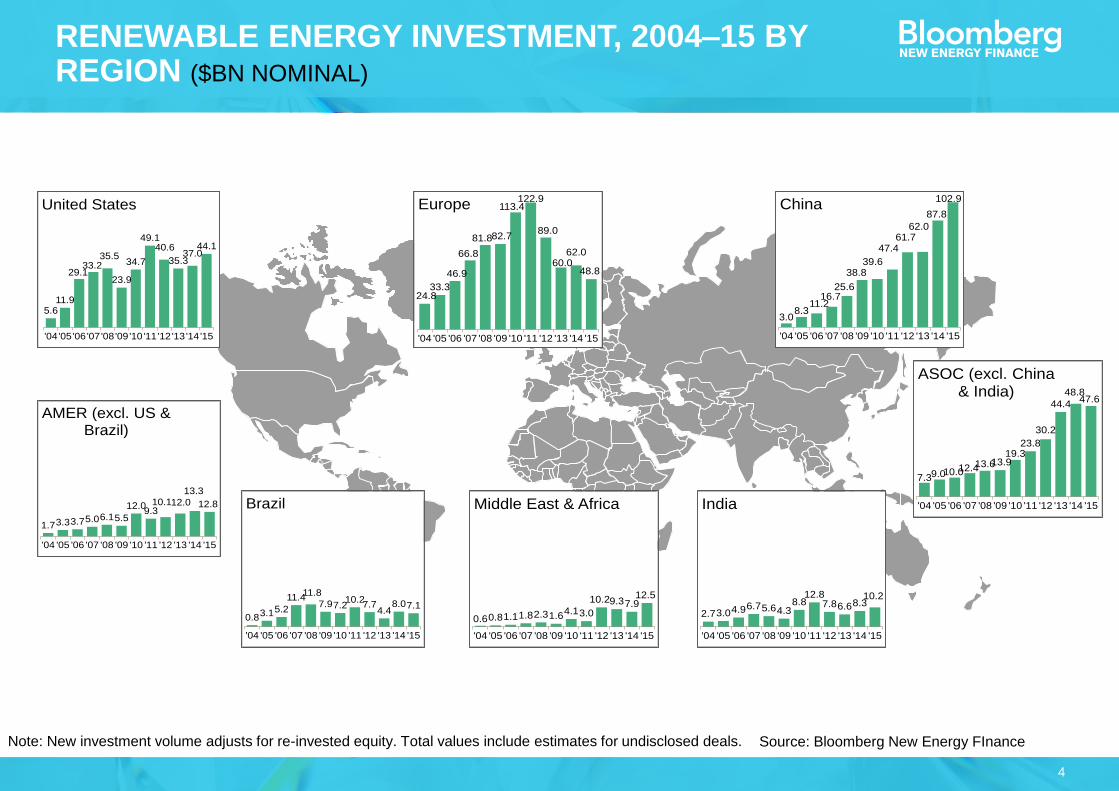
Note: Total values include estimates for undisclosed deals. Includes corporate and government R&D, and spending for digital energy and energy
storage projects (not reported in quarterly statistics). Excludes large hydro.
Source: Bloomberg Intelligence, Bloomberg New Energy
Finance
CLEAN ENERGY INVESTMENT ROSE WHILE OIL PLUMMETEDGLOBAL CLEAN ENERGY INVESTMENT VS WTI CRUDE SPOT 2004-15
$48/bbl
Record
investment
3
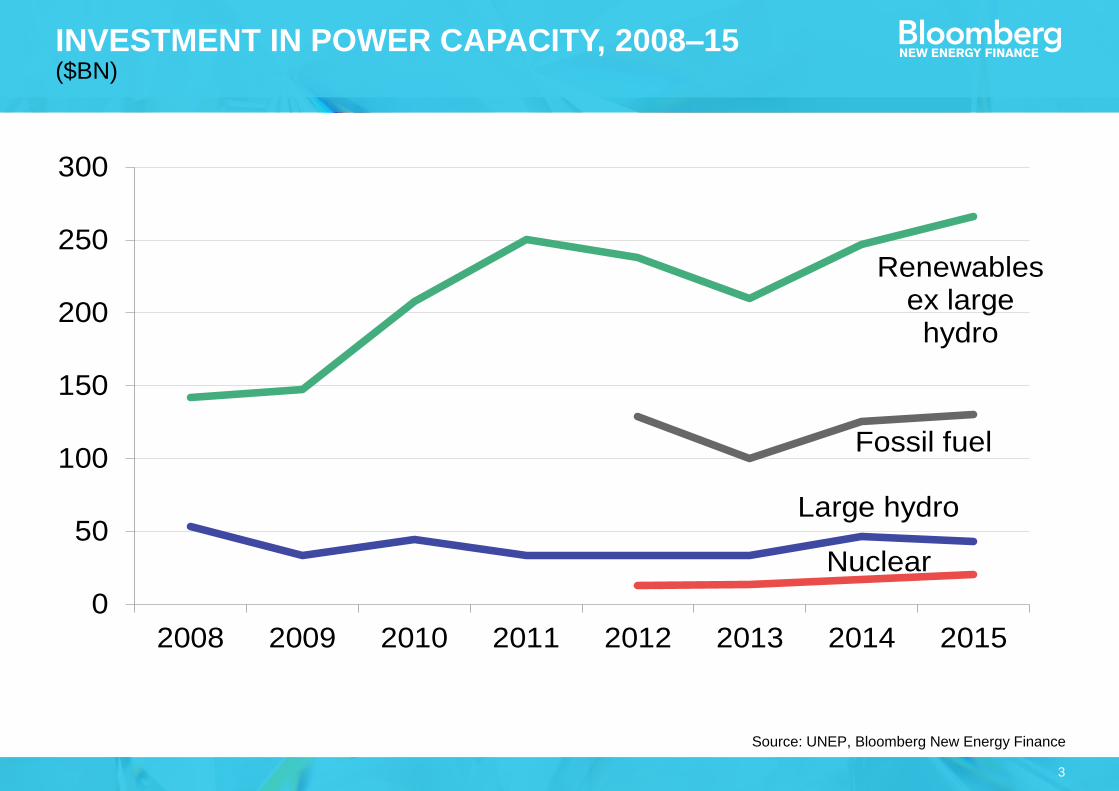
Source: UNEP, Bloomberg New Energy Finance
INVESTMENT IN POWER CAPACITY, 2008–15 ($BN)
Renewables ex large hydro
Fossil fuel
Nuclear
Large hydro
0
50
100
150
200
250
300
2008 2009 2010 2011 2012 2013 2014 2015
4
Note: New investment volume adjusts for re-invested equity. Total values include estimates for undisclosed deals. Source: Bloomberg New Energy FInance
RENEWABLE ENERGY INVESTMENT, 2004–15 BY REGION ($BN NOMINAL)
5.611.9
29.133.2
35.5
23.9
34.7
49.140.6
35.337.0
44.1
'04'05'06'07'08'09'10'11'12'13'14'15
United States
0.83.15.2
11.411.8
7.97.210.2
7.74.4
8.07.1
'04 '05 '06 '07 '08 '09 '10 '11 '12 '13 '14 '15
Brazil
1.73.33.75.06.15.5
12.09.3
10.112.0
13.3
12.8
'04 '05 '06 '07 '08 '09 '10 '11 '12 '13 '14 '15
AMER (excl. US & Brazil)
24.833.3
46.9
66.8
81.882.7
113.4122.9
89.0
60.062.0
48.8
'04 '05 '06 '07 '08 '09 '10 '11 '12 '13 '14 '15
Europe
7.39.010.012.413.613.919.3
23.8
30.2
44.4
48.847.6
'04 '05 '06 '07 '08 '09 '10 '11 '12 '13 '14 '15
ASOC (excl. China & India)
3.08.3
11.216.7
25.6
38.839.6
47.461.7
62.0
87.8
102.9
'04 '05 '06 '07 '08 '09 '10 '11 '12 '13 '14 '15
China
2.73.04.96.75.64.38.8
12.87.86.68.3
10.2
'04 '05 '06 '07 '08 '09 '10 '11 '12 '13 '14 '15
India
0.60.81.11.82.31.64.13.0
10.29.37.912.5
'04 '05 '06 '07 '08 '09 '10 '11 '12 '13 '14 '15
Middle East & Africa
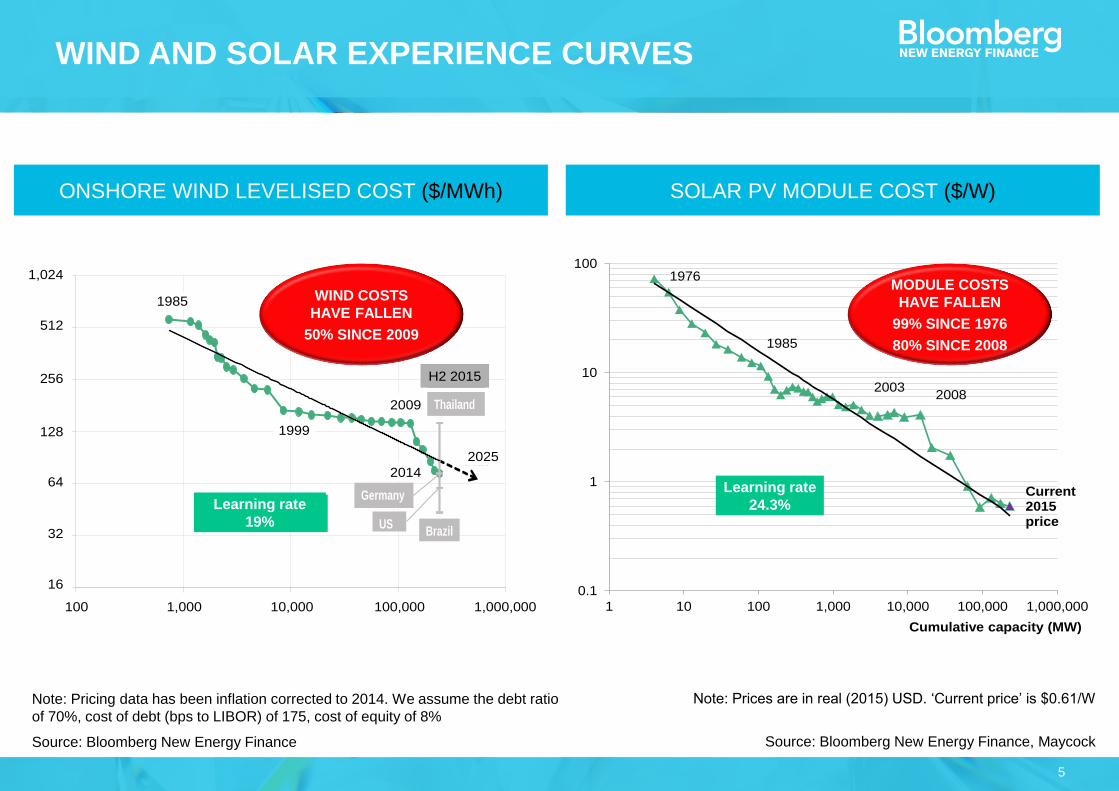
5
0.1
1
10
100
1 10 100 1,000 10,000 100,000 1,000,000
2003
1976
1985
2008
Cumulative capacity (MW)
Current 2015 price
WIND AND SOLAR EXPERIENCE CURVES
Note: Pricing data has been inflation corrected to 2014. We assume the debt ratio
of 70%, cost of debt (bps to LIBOR) of 175, cost of equity of 8%
Source: Bloomberg New Energy Finance
Note: Prices are in real (2015) USD. ‘Current price’ is $0.61/W
Source: Bloomberg New Energy Finance, Maycock
ONSHORE WIND LEVELISED COST ($/MWh) SOLAR PV MODULE COST ($/W)
Learning rate
24.3%
MODULE COSTS
HAVE FALLEN
99% SINCE 1976
80% SINCE 2008
y = 3,582.42x-0.30
R² = 0.91
16
32
64
128
256
512
1,024
100 1,000 10,000 100,000 1,000,000
1985
20252014
Learning rate =19%R² = 0.91
Thailand
Brazil
Germany
US
H1 2015
1999
2009
1,024
512
256
128
64
32
100 1,000 10,000
16
100,000 1,000,000
Learning rate 19%
1985
1999
2009
2014
2025
H2 2015
Learning rate
19%
WIND COSTS
HAVE FALLEN
50% SINCE 2009
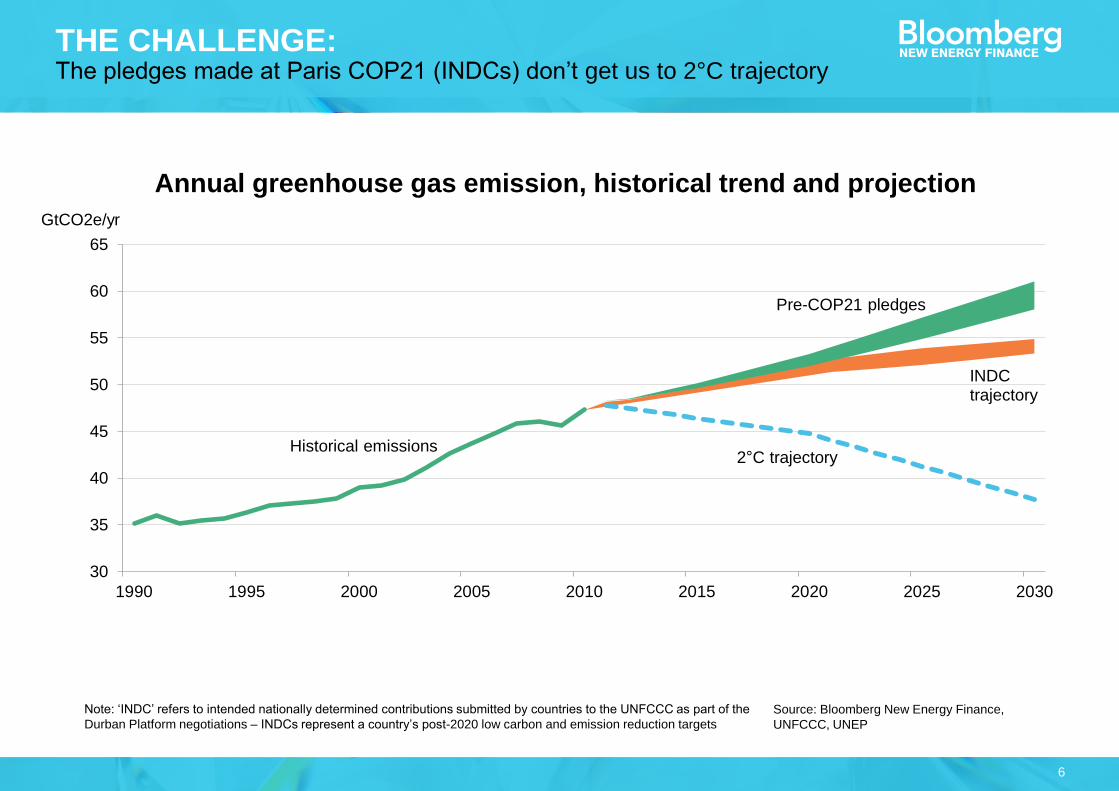
6
30
35
40
45
50
55
60
65
1990 1995 2000 2005 2010 2015 2020 2025 2030
Historical emissions2 C trajectory
INDC trajectory
Pre-COP21 pledges
GtCO2e/yr
THE CHALLENGE: The pledges made at Paris COP21 (INDCs) don’t get us to 2°C trajectory
Source: Bloomberg New Energy Finance,
UNFCCC, UNEP
Note: ‘INDC’ refers to intended nationally determined contributions submitted by countries to the UNFCCC as part of the
Durban Platform negotiations – INDCs represent a country’s post-2020 low carbon and emission reduction targets
Annual greenhouse gas emission, historical trend and projection
7
Source: Bloomberg New Energy Finance
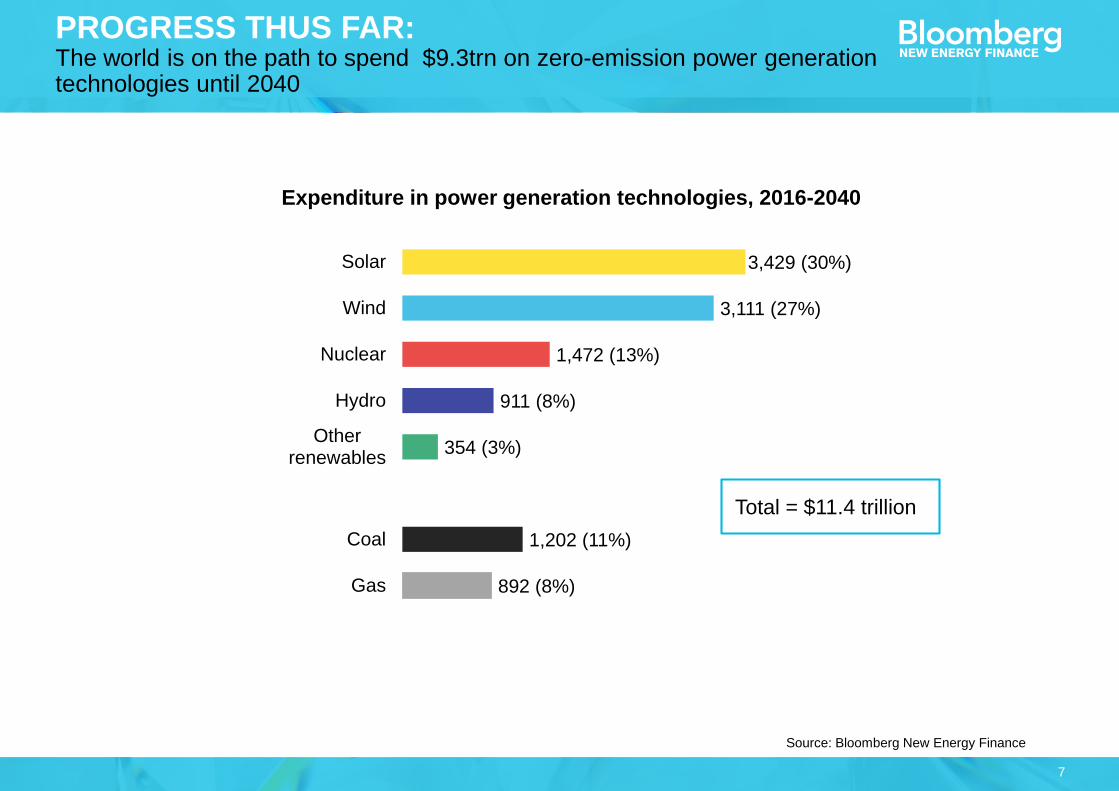
PROGRESS THUS FAR: The world is on the path to spend $9.3trn on zero-emission power generation technologies until 2040
Expenditure in power generation technologies, 2016-2040
3,429 (30%)
3,111 (27%)
1,472 (13%)
911 (8%)
354 (3%)
1,202 (11%)
892 (8%)
Solar
Wind
Nuclear
Hydro
Otherrenewables
Coal
Gas
Total = $11.4 trillion
8
Source: Bloomberg New Energy Finance
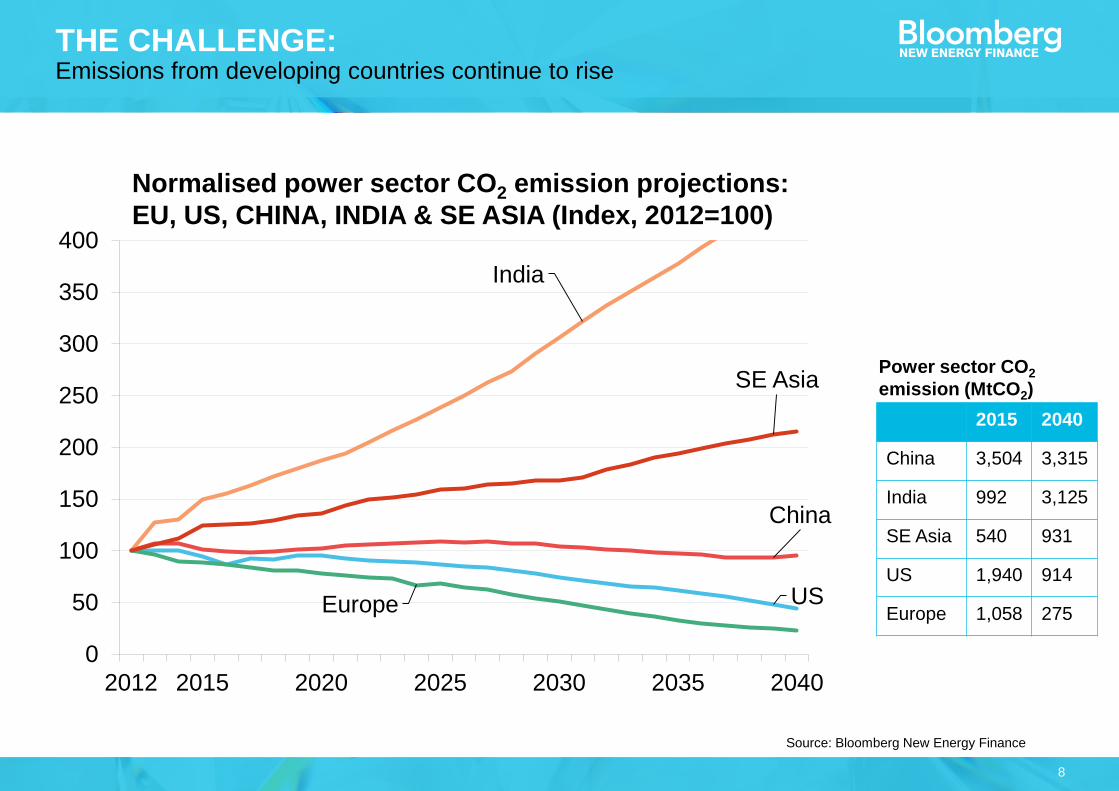
THE CHALLENGE:Emissions from developing countries continue to rise
China
USEurope
India
SE Asia
0
50
100
150
200
250
300
350
400
2012 2015 2020 2025 2030 2035 2040
Normalised power sector CO2 emission projections:
EU, US, CHINA, INDIA & SE ASIA (Index, 2012=100)
2015 2040
China 3,504 3,315
India 992 3,125
SE Asia 540 931
US 1,940 914
Europe 1,058 275
Power sector CO2
emission (MtCO2)
9
Source: Bloomberg New Energy Finance
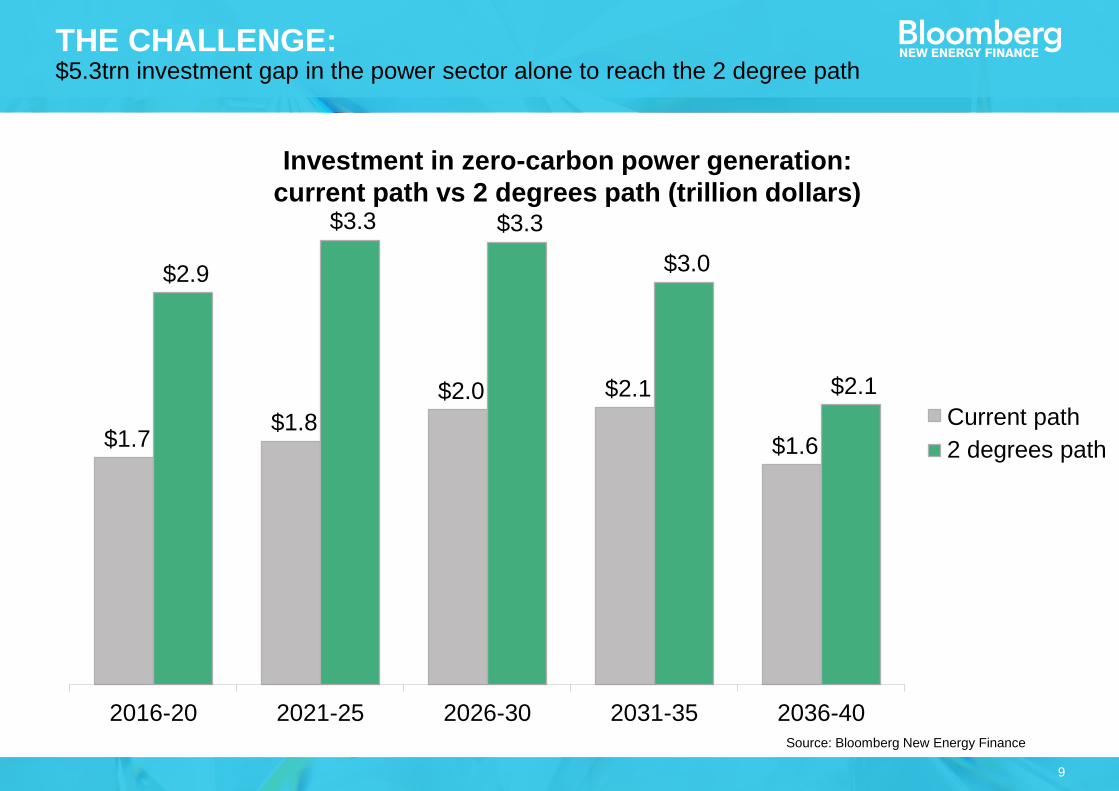
THE CHALLENGE: $5.3trn investment gap in the power sector alone to reach the 2 degree path
$1.7 $1.8
$2.0 $2.1
$1.6
$2.9
$3.3 $3.3
$3.0
$2.1
2016-20 2021-25 2026-30 2031-35 2036-40
NEO2016
2 degrees
Current path
2 degrees path
Investment in zero-carbon power generation:
current path vs 2 degrees path (trillion dollars)
10
This publication is the copyright of Bloomberg New Energy Finance. No portion of this document may be photocopied,
reproduced, scanned into an electronic system or transmitted, forwarded or distributed in any way without prior consent of
Bloomberg New Energy Finance.
The information contained in this publication is derived from carefully selected sources we believe are reasonable. We do
not guarantee its accuracy or completeness and nothing in this document shall be construed to be a representation of such
a guarantee. Any opinions expressed reflect the current judgment of the author of the relevant article or features, and does
not necessarily reflect the opinion of Bloomberg New Energy Finance, Bloomberg Finance L.P., Bloomberg L.P. or any of
their affiliates ("Bloomberg"). The opinions presented are subject to change without notice. Bloomberg accepts no
responsibility for any liability arising from use of this document or its contents. Nothing herein shall constitute or be
construed as an offering of financial instruments, or as investment advice or recommendations by Bloomberg of an
investment strategy or whether or not to "buy," "sell" or "hold" an investment.
COPYRIGHT AND DISCLAIMER
Unique analysis, tools and data for decision-makers
driving change in the energy system
MARKETS Renewable Energy
Energy Smart Technologies
Advanced Transport
Gas
Carbon and RECs
SERVICESAmericas Service
Asia Pacific Service
EMEA Service
Applied Research
Events and Workshops