Embed Size (px)
Citation preview
Decision Support Tool Evaluation Report for General NOAA Oil Modeling Environment (GNOME) Version 2.0 Earth Science Applications Directorate Coastal Management Team John C. Stennis Space Center, Mississippi
National Aeronautics and Space Administration John C. Stennis Space Center SSC, Mississippi 39529
National Aeronautics and Space Administration John C. Stennis Space Center SSC, Mississippi 39529–6000
May 2004
https://ntrs.nasa.gov/search.jsp?R=20050238479 2018-07-07T00:46:13+00:00Z
Acknowledgments
This work was supported by the NASA Earth Science Applications Directorate under contract number NAS 13-650 at the John C. Stennis Space Center, Mississippi.
Earth Science Applications Directorate Coastal Management Team
Callie Hall, NASA SSC/ESA Vicki Zanoni, NASA SSC/ESA Slawomir Blonski, LMSO RSD Eurico D’Sa, LMSO RSD Lee Estep, LMIT REAC
Donald Holland, LMSO RSD Roxzana F. Moore, LMSO RSD Mary Pagnutti, LMSO RSD Joseph P. Spruce, LMSO RSD – Lead Author Greg Terrie, LMSO RSD
The use of trademarks or names of manufacturers is for accurate reporting only and does not constitute an official endorsement, either expressed or implied, of such products or manufacturers by the National Aeronautics and Space Administration.
NASA ESA Directorate Coastal Management Team
Table of Contents
Executive Summary ...................................................................................................................................... v
1.0 Introduction............................................................................................................................................. 1 1.1 Background on GNOME .................................................................................................................... 3 1.2 Partnering Agencies and Institutions .................................................................................................. 4 1.3 NASA Centers/Offices with Relevant Expertise and Responsibility.................................................. 5
2.0 Description of GNOME Model DST...................................................................................................... 6 2.1 GNOME Operating Procedures .......................................................................................................... 9 2.2 GNOME End Users .......................................................................................................................... 13 2.3 Pros and Cons of GNOME DST Features......................................................................................... 14
3.0 Consideration of NASA Inputs ............................................................................................................. 15 3.1 GNOME DST Information Requirements ........................................................................................ 15 3.2 Potential Existing NASA Inputs ....................................................................................................... 17
3.2.1 NASA Data and Products .......................................................................................................... 17 3.2.2 NASA-Supported Models.......................................................................................................... 23
3.3 Potential Future NASA Inputs .......................................................................................................... 24
4.0 NASA Technology Gaps in Meeting GNOME Requirements ............................................................. 26
5.0 Conclusions........................................................................................................................................... 27 5.1 Findings............................................................................................................................................. 27 5.2 Recommendations............................................................................................................................. 28 5.3 Next Steps ......................................................................................................................................... 29
6.0 References............................................................................................................................................. 32
Appendix A. Glossary...............................................................................................................................A-1
Appendix B. Acronyms ............................................................................................................................ B-1
Appendix C. System Engineering Approach ............................................................................................ C-1
Appendix D. Remote Sensing of Oil Spills ..............................................................................................D-1
Appendix E. Coastal Management Roadmap ........................................................................................... E-1
Appendix F. Relevant NASA Earth Observing Missions and Sensors......................................................F-1
Appendix G. Relevant NASA Earth Observation Products......................................................................G-1
iii
DST Evaluation Report for General NOAA Oil Modeling Environment
Tables Table 1. Role of NASA research centers regarding oceanography. ............................................................. 5 Table 2. Publicly available location files for the GNOME DST. ............................................................... 11 Table 3. GNOME DST information requirements compared to current NASA remote sensing data
product specifications – NRT remote sensing data for nowcast and forecast studies of active spill response incidents. .............................................................................................................................. 17
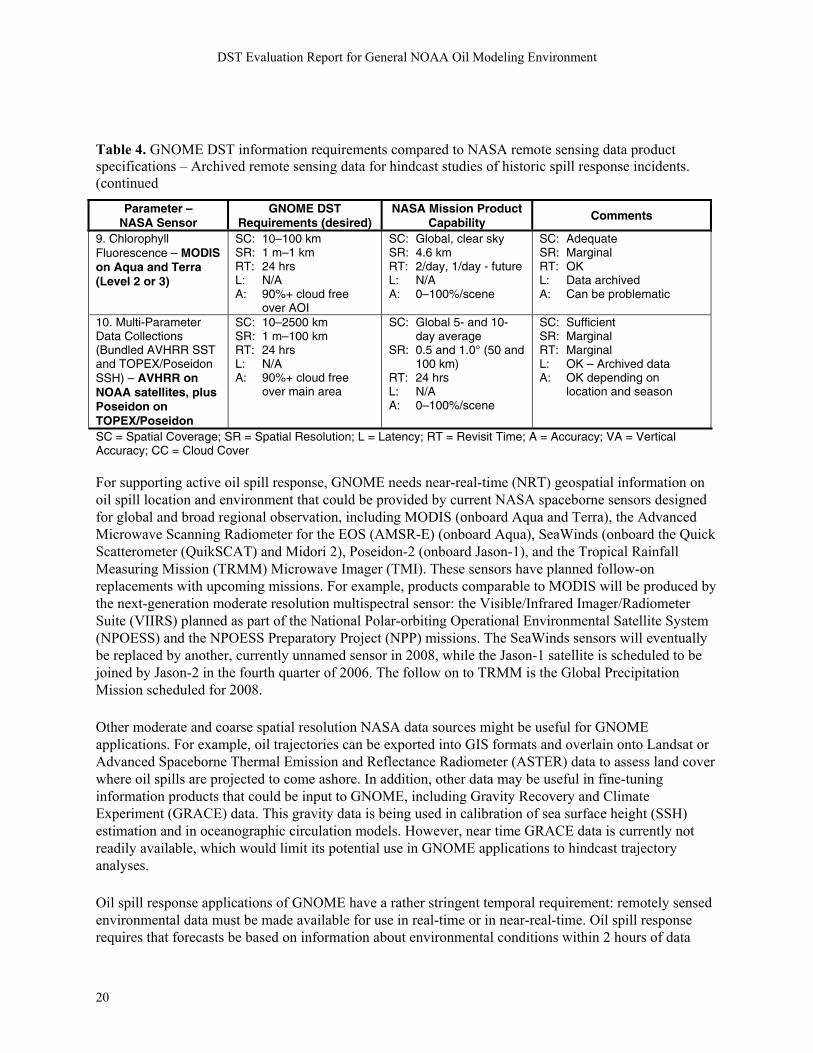
Table 4. GNOME DST information requirements compared to NASA remote sensing data product specifications – Archived remote sensing data for hindcast studies of historic spill response incidents. ............................................................................................................................................. 19
Table 5. Potential NASA-supported ocean hydrodynamic models for GNOME. ...................................... 24 Table F-1. NASA sensors and missions discussed in this report. ..............................................................F-1 Table G-1. NASA Earth observation products with potential for aiding GNOME DST applications. ....G-1
Figures Figure 1. NASA Earth Science Enterprise applications of national priority. ............................................... 1 Figure 2. Systems engineering approach (adapted from Bahill and Gissing, 1998). .................................... 2 Figure 3. View of GNOME software graphical user interface. .................................................................... 4 Figure 4. Example GNOME spill trajectory for San Diego, California........................................................ 9 Figure 5. Example GNOME oil concentrations and uncertainty contour for spill trajectory analysis
regarding San Diego, California. .......................................................................................................... 9 Figure 6. Flowchart for GNOME Standard mode of operation. ................................................................. 10 Figure 7. Flowchart for GNOME GIS and Diagnostic modes of operation. The green boxes denote
functionality resident to the Standard mode, the blue box shows additional functionality of the Diagnostic mode, and the light yellow boxes depict functionality of the GIS mode.......................... 12
Figure 8. Data used in spill trajectory forecast analysis.............................................................................. 16 Figure 9. Physical processes considered in spill trajectory forecast analysis. ............................................ 16 Figure 10. VIIRS products (shaded in blue) versus band definitions. Band position and width are in
units of nm for bands M1–M7 and in µm for bands M8–M16. .......................................................... 25 Figure 11. V&V hierarchy. ......................................................................................................................... 30
iv
NASA ESA Directorate Coastal Management Team
Executive Summary
NASA’s Earth Science Applications Directorate evaluated the potential of NASA remote sensing data and modeling products to enhance the General NOAA Oil Modeling Environment (GNOME) decision support tool currently used by the National Oceanic and Atmospheric Administration for oil spill modeling, risk assessment, mitigation, and response. GNOME was developed by NOAA’s Office of Response and Restoration (OR&R) Hazardous Materials (HAZMAT) Response Division. The tool is a geospatial software package that models oil spill scenarios and trajectories. NOAA developed GNOME to predict how wind, current, river flow, and tidal processes spread oil spills and to predict oil changes over time. The software is structured to accept inputs from a variety of data sources and models. GNOME does not currently incorporate remote sensing data directly, although it does use information derived from remote sensing systems. The software’s outputs consist of digital maps and 2-dimensional visualizations. A variety of government agencies, private organizations, and even commercial companies use GNOME for oil spill planning, education, training, and response purposes.
NOAA OR&R HAZMAT is interested in enhancing GNOME with near-realtime (NRT) NASA remote sensing products on oceanic winds and ocean circulation. The NASA SeaWinds sea surface wind and Jason-1 sea surface height NRT products have noteworthy potential for providing needed information on ocean winds and circulation. Other potential NASA data inputs include sea surface temperature and reflectance products from the Moderate Resolution Imaging Spectroradiometer (MODIS) and sea surface reflectance products from Landsat and the Advanced Spaceborne Thermal Emission and Reflectance Radiometer (ASTER) as well. HAZMAT is also interested in using NASA-supported ocean circulation models, such as the Advanced Circulation (ADCIRC) model and the Ocean General Circulation Model (OGCM). This report identifies other NASA contributions that may enhance GNOME for applications other than oil spill response (e.g., education and training purposes).
While NASA inputs have potential for enhancing GNOME, certain issues must be considered. Examples include lack of data continuity, marginal data redundancy, and data formatting problems. Spatial resolution is an issue for near-shore GNOME applications. Additional work will be needed to incorporate NASA inputs into GNOME, including the verification and validation of data products, algorithms, models, and NRT data delivery.
v
NASA ESA Directorate Coastal Management Team
1.0 Introduction
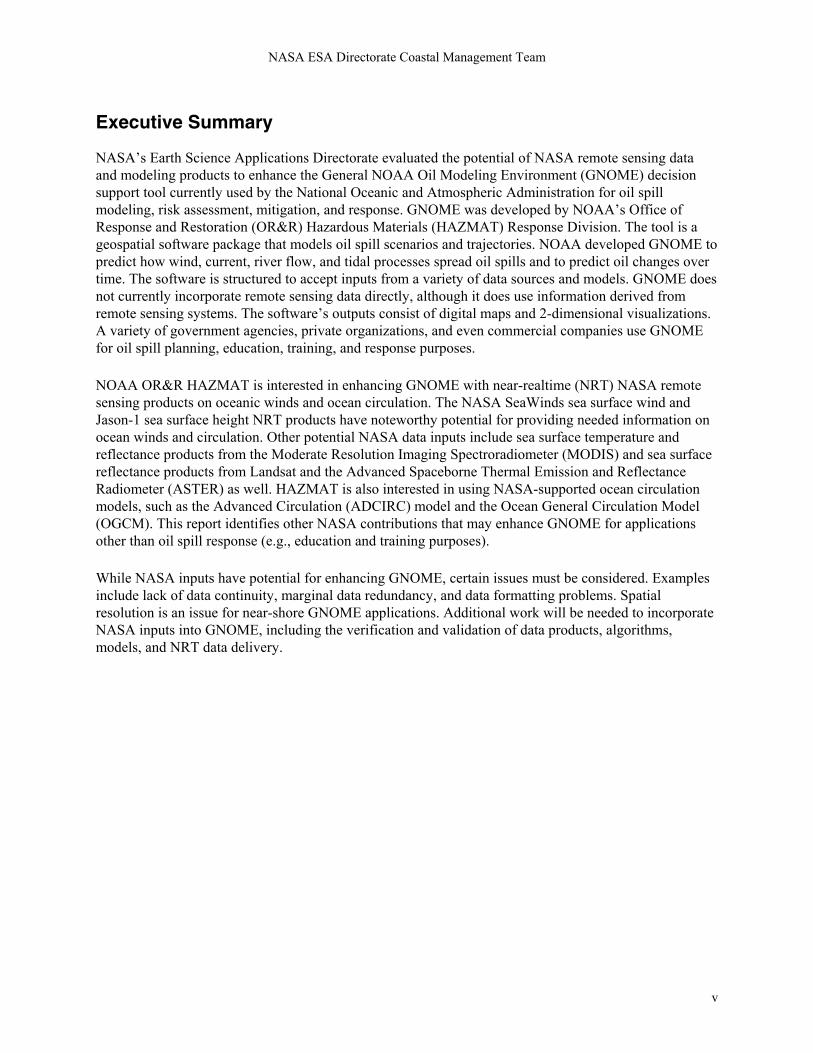
NASA’s Earth Science Enterprise (ESE) conducts global monitoring studies of the Earth that result in the development of remote sensing technologies, data, information products, and models that can be used to improve government decision making and public quality of life. One component of the ESE regards the application of Earth science products to topics of national concern. The ESE’s Applications Division is charged with implementing programs and projects that foster infusion of NASA Earth science products into decision support tools (DSTs) (a.k.a. decision support systems (DSSs)) used to address issues of national importance, such as coastal management. As part of a systematic approach to extending the benefits of NASA’s Earth science to the broader community, the Earth Science Enterprise has identified 12 applications of national priority. These 12 national applications have been determined using criteria including the consideration of potential socio-economic return, application feasibility, appropriateness for NASA, and partnership opportunities (Figure 1). The Applications Division of the ESE, in partnership with public and private organizations, employs a systems engineering process to integrate and benchmark NASA inputs into operational DSTs across these 12 application areas.
Agricultural Efficiency Air Quality Aviation Invasive Species
Carbon Management Coastal Management Disaster Management Homeland Security
Energy Management Public Health Ecological Forecasting Water Management
Figure 1. NASA Earth Science Enterprise applications of national priority.
Each national application includes multiple DST packages that may benefit from integration of NASA data and models, but resources to perform any such integration are limited. Consequently, before such integration is attempted, both the DST and the potential benefit of NASA inputs to the DST are evaluated. Activities for the Coastal Management national application currently include evaluation of multiple decision support systems, including the National Oceanic and Atmospheric Administration’s General NOAA Oil Modeling Environment (GNOME) discussed in this evaluation report. The DST evaluation is one part of multi-staged system engineering process used by NASA to integrate NASA inputs into national application decision support systems (Figure 2).
1
DST Evaluation Report for General NOAA Oil Modeling Environment
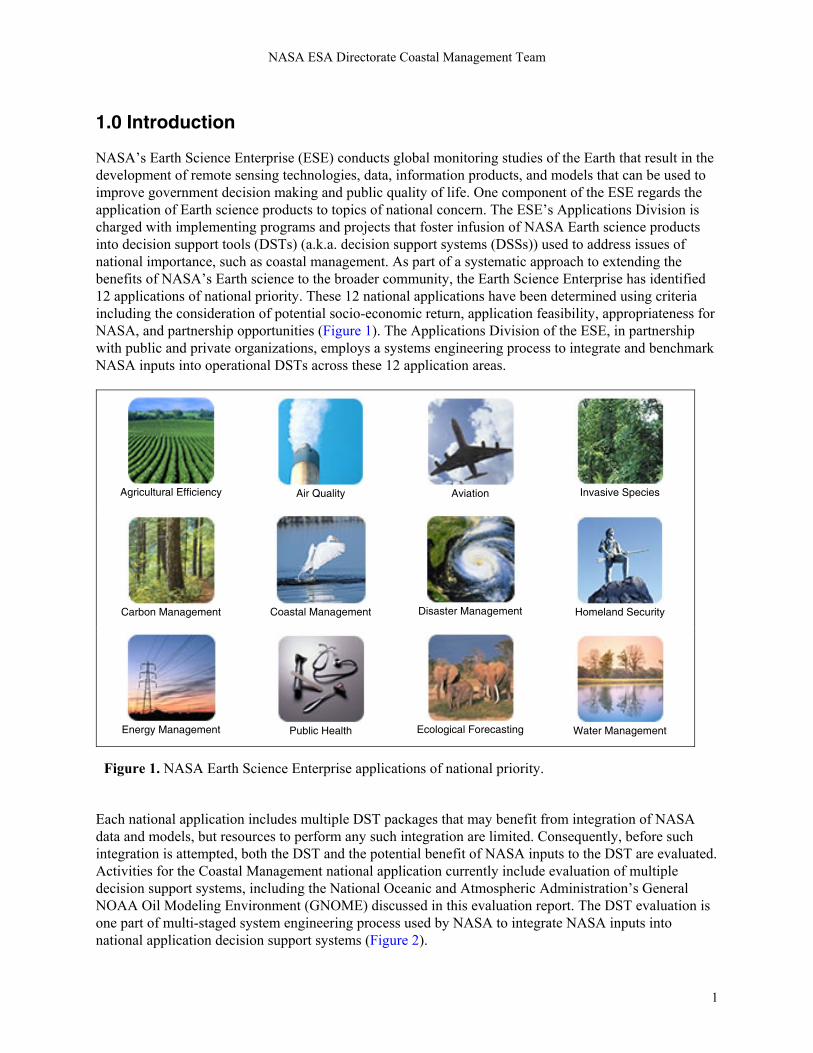
Systems Engineering Approach
A systems engineering approach leads to scalable, systemic, and sustainable solutions and processes that contribute to the success of the mission, goals, and objectives of each National Application.
Adapted from Bahill & Gissing (1998)
Define Requirements
& Specifications
DSS
Selection
Investigate Alternative
NASA Inputs
Design&
Implement
Benchmark(Baseline
&Assess
Performance)
Enhanced
DSS
Refine Refine Refine Refine
Evaluation V&V Benchmarking
Verify&
Validate
Refine
Figure 2. Systems engineering approach (adapted from Bahill and Gissing, 1998).
Coastal communities and their natural resources are a crucial component of American society and play a fundamental role in the national and global economy. Observations from airborne and spaceborne platforms have been used for decades to help coastal managers and land use planners, from the municipality to national level, to make decisions that affect coastal management and policy. NOAA is a key partner with NASA in ensuring that new NASA remote sensing technologies are evaluated and, where appropriate, are integrated into NOAA’s operational decision-making process and support to other government agencies.
The goal of NASA’s Earth Science Applications Coastal Management Program is to enable partners’ beneficial use of Earth science, observations, models, and technology to enhance decision support capabilities serving their coastal management and policy responsibilities. The major tenets of the Coastal Management Program are as follows:
• Develop and nurture partnerships with appropriate coastal organizations.
• Identify and assess partners’ coastal management responsibilities, plans, and decision support tools and evaluate the capacity of Earth science results to support the partners.
• Verify and validate the application of Earth science results with partners, including development of products and prototypes to meet partners’ requirements.
• With partners, document the value of Earth science results relative to partners’ benchmarks and support adoption into operational use.
• Communicate results and partners’ achievements to appropriate coastal communities and stakeholders.
Providing support information regarding oil spills is one of the many responsibilities assigned to NOAA. The Hazardous Materials Response Division (HAZMAT) of NOAA’s Office of Response and Restoration (OR&R) delivers this support to Federal agencies, such as the U.S. Coast Guard (USCG) and
2
NASA ESA Directorate Coastal Management Team
the Environmental Protection Agency (EPA), and to foreign countries upon request. This report evaluates the potential for NASA Earth science data, data products, models, and other technology to enhance NOAA’s GNOME decision support tool (DST).
1.1 Background on GNOME
Industrial marine oil spills represent major pollution threats to coastal ecosystems and economies. Oil spills, such as the 1989 Exxon Valdez incident in Alaska, cause economic losses and related environmental damage and loss, including degradation of coastal habitat and serious negative effects to wildlife and fisheries. The cost associated with major spills can be enormous to government agencies, affected industry, and coastal residents living near the spill. Industrial oil transport is a complicated, expensive, and dangerous endeavor that may increase the risk of accidental and terrorist-induced oil spills. Shipping is a major means for transporting oil and other goods across large marine and fresh-water bodies. However, great economic and political incentive remains to reduce the risk of oil spills and to increase effective, timely response when they occur.
Government agencies and private industry have developed sophisticated, computer-based models to forecast the trajectory, evolution, and environmental impact of an oil spill. An oil spill possesses the following characteristics of which spill trajectory software takes account: 1) the fate of a surface slick is controlled primarily by the conditions in the upper layer of the ocean; 2) horizontal movement of the slick is driven by surface flow, which is affected by winds, waves, tides, density gradients, and deep ocean currents; and 3) the slick can be diffused by wave action and by interacting physical, chemical, and/or biological processes, such as spreading, evaporation, emulsification, entrainment, sedimentation, biochemical decay, and contact with coastlines or sea ice (UNESCO, 2003).
The U.S. Government has enacted laws to protect coastal environments and to mitigate oil spill disasters when they occur in U.S. coastal waters. The 1990 Oil Pollution Act (OPA 90) charges NOAA’s OR&R HAZMAT Response Division with providing technical support services to the USCG for coastal oil spill response. Technical support includes the development of spill trajectory predictions for use in oil or other chemical spill response. NOAA actively works with the USCG and with other agencies to use the best available technology to reduce the threat of oil spills and to effect timely response to oil spills when they occur.
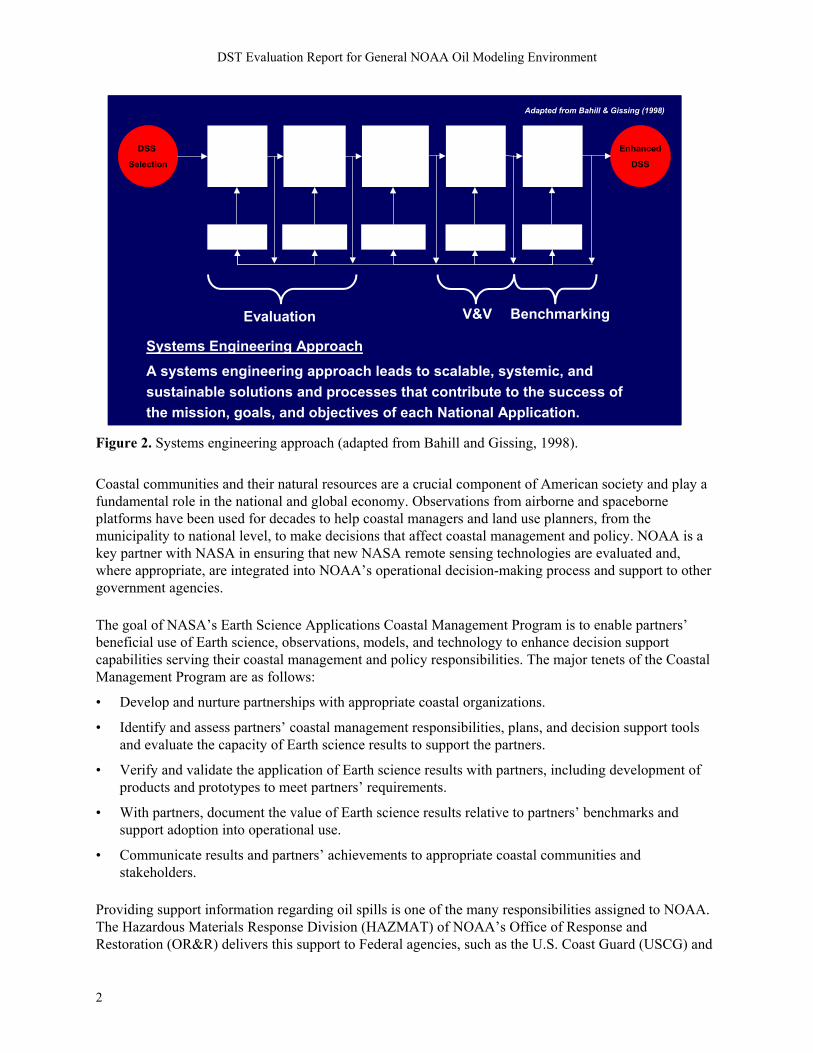
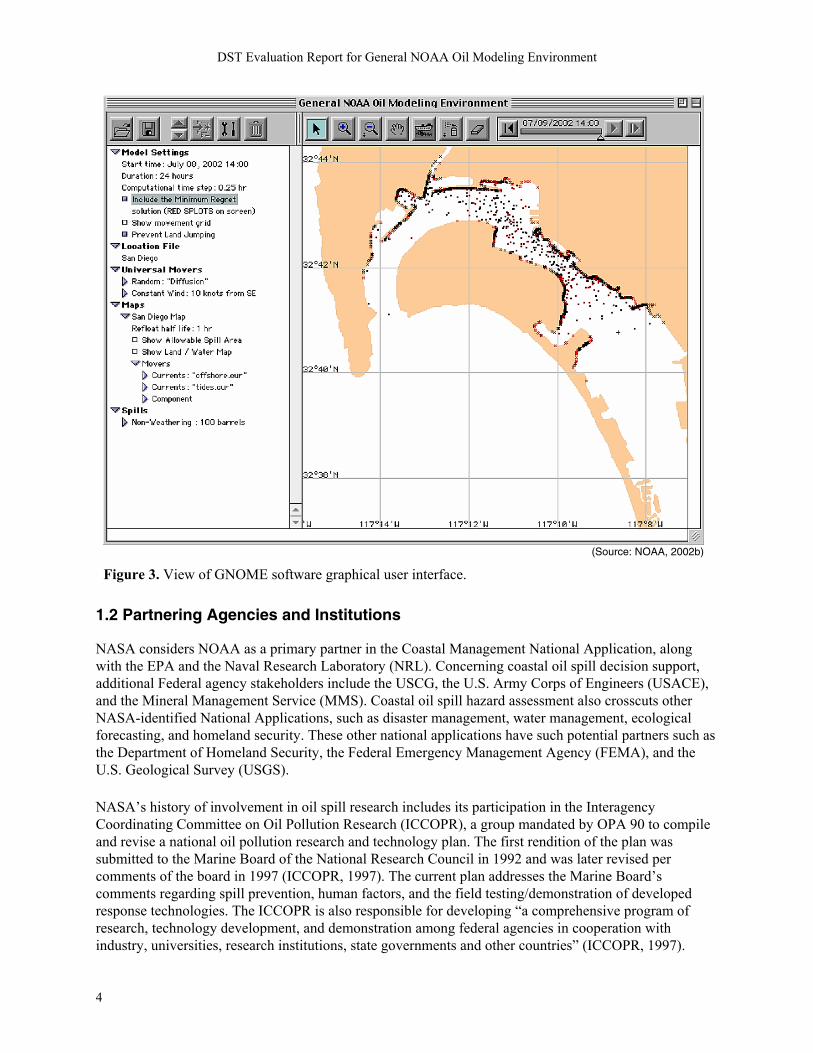
NOAA’s OR&R HAZMAT developed GNOME, a public-domain geospatial software package, for modeling oil spill trajectory and fate scenarios (Figure 3). GNOME employs oceanographic, weather, and oil spill data using default and user inputs to output digital maps and 2-D movie visualizations for use in oil spill response, mitigation, environmental impact assessment, and public outreach. NOAA developed GNOME to predict how wind, current, river flow, and tidal processes spread oil and to predict oil changes based on weathering over time. GNOME serves as a training tool as well as a diagnostic tool for full tactical support for actual spill response. GNOME does not currently incorporate remote sensing data directly, although it does make use of information derived from remote sensing systems. For example, NOAA’s National Weather Service (NWS) provides forecasts for surface winds, waves, visibility, and temperature (NOAA, 2002b). Section 2.0 provides a more detailed description of GNOME.
3
DST Evaluation Report for General NOAA Oil Modeling Environment
(Source: NOAA, 2002b)
Figure 3. View of GNOME software graphical user interface.
1.2 Partnering Agencies and Institutions
NASA considers NOAA as a primary partner in the Coastal Management National Application, along with the EPA and the Naval Research Laboratory (NRL). Concerning coastal oil spill decision support, additional Federal agency stakeholders include the USCG, the U.S. Army Corps of Engineers (USACE), and the Mineral Management Service (MMS). Coastal oil spill hazard assessment also crosscuts other NASA-identified National Applications, such as disaster management, water management, ecological forecasting, and homeland security. These other national applications have such potential partners such as the Department of Homeland Security, the Federal Emergency Management Agency (FEMA), and the U.S. Geological Survey (USGS).
NASA’s history of involvement in oil spill research includes its participation in the Interagency Coordinating Committee on Oil Pollution Research (ICCOPR), a group mandated by OPA 90 to compile and revise a national oil pollution research and technology plan. The first rendition of the plan was submitted to the Marine Board of the National Research Council in 1992 and was later revised per comments of the board in 1997 (ICCOPR, 1997). The current plan addresses the Marine Board’s comments regarding spill prevention, human factors, and the field testing/demonstration of developed response technologies. The ICCOPR is also responsible for developing “a comprehensive program of research, technology development, and demonstration among federal agencies in cooperation with industry, universities, research institutions, state governments and other countries” (ICCOPR, 1997).
4
NASA ESA Directorate Coastal Management Team
1.3 NASA Centers/Offices with Relevant Expertise and Responsibility
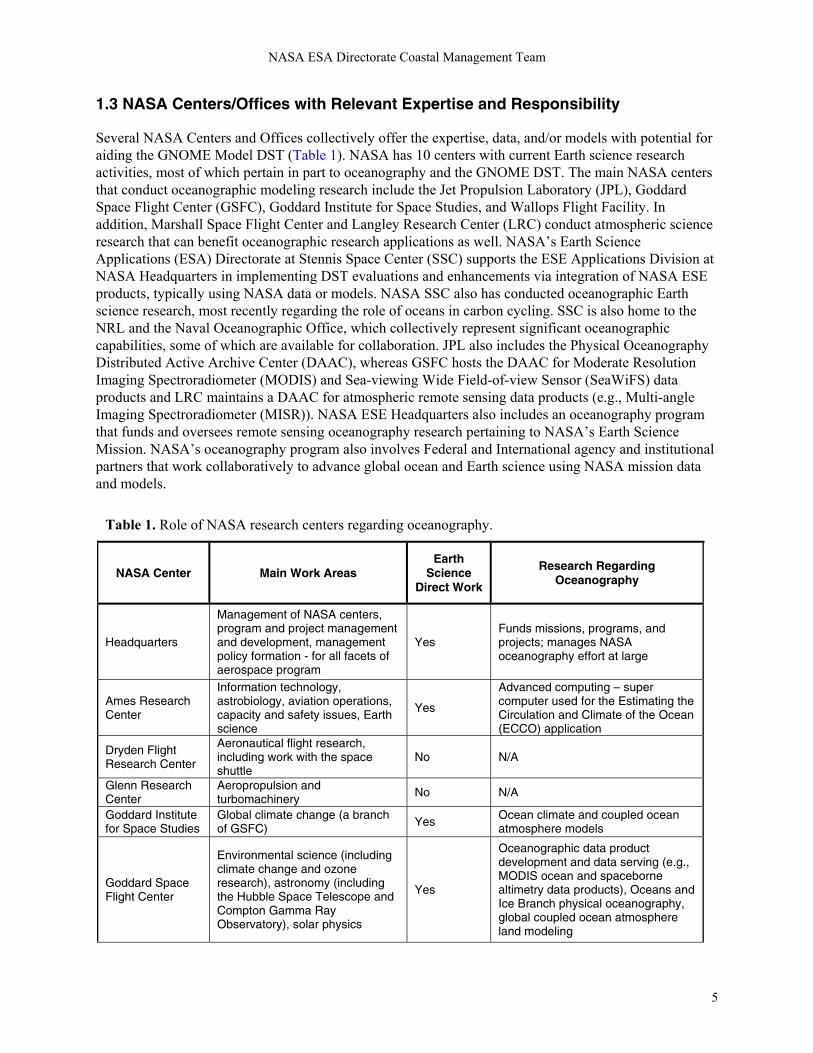
Several NASA Centers and Offices collectively offer the expertise, data, and/or models with potential for aiding the GNOME Model DST (Table 1). NASA has 10 centers with current Earth science research activities, most of which pertain in part to oceanography and the GNOME DST. The main NASA centers that conduct oceanographic modeling research include the Jet Propulsion Laboratory (JPL), Goddard Space Flight Center (GSFC), Goddard Institute for Space Studies, and Wallops Flight Facility. In addition, Marshall Space Flight Center and Langley Research Center (LRC) conduct atmospheric science research that can benefit oceanographic research applications as well. NASA’s Earth Science Applications (ESA) Directorate at Stennis Space Center (SSC) supports the ESE Applications Division at NASA Headquarters in implementing DST evaluations and enhancements via integration of NASA ESE products, typically using NASA data or models. NASA SSC also has conducted oceanographic Earth science research, most recently regarding the role of oceans in carbon cycling. SSC is also home to the NRL and the Naval Oceanographic Office, which collectively represent significant oceanographic capabilities, some of which are available for collaboration. JPL also includes the Physical Oceanography Distributed Active Archive Center (DAAC), whereas GSFC hosts the DAAC for Moderate Resolution Imaging Spectroradiometer (MODIS) and Sea-viewing Wide Field-of-view Sensor (SeaWiFS) data products and LRC maintains a DAAC for atmospheric remote sensing data products (e.g., Multi-angle Imaging Spectroradiometer (MISR)). NASA ESE Headquarters also includes an oceanography program that funds and oversees remote sensing oceanography research pertaining to NASA’s Earth Science Mission. NASA’s oceanography program also involves Federal and International agency and institutional partners that work collaboratively to advance global ocean and Earth science using NASA mission data and models.
Table 1. Role of NASA research centers regarding oceanography.
NASA Center Main Work Areas Earth
Science Direct Work
Research Regarding Oceanography
Headquarters
Management of NASA centers, program and project management and development, management policy formation - for all facets of aerospace program
Yes Funds missions, programs, and projects; manages NASA oceanography effort at large
Ames Research Center
Information technology, astrobiology, aviation operations, capacity and safety issues, Earth science
Yes
Advanced computing – super computer used for the Estimating the Circulation and Climate of the Ocean (ECCO) application
Dryden Flight Research Center
Aeronautical flight research, including work with the space shuttle
No N/A
Glenn Research Center
Aeropropulsion and turbomachinery No N/A
Goddard Institute for Space Studies
Global climate change (a branch of GSFC) Yes
Ocean climate and coupled ocean atmosphere models
Goddard Space Flight Center
Environmental science (including climate change and ozone research), astronomy (including the Hubble Space Telescope and Compton Gamma Ray Observatory), solar physics
Yes
Oceanographic data product development and data serving (e.g., MODIS ocean and spaceborne altimetry data products), Oceans and Ice Branch physical oceanography, global coupled ocean atmosphere land modeling
5
DST Evaluation Report for General NOAA Oil Modeling Environment
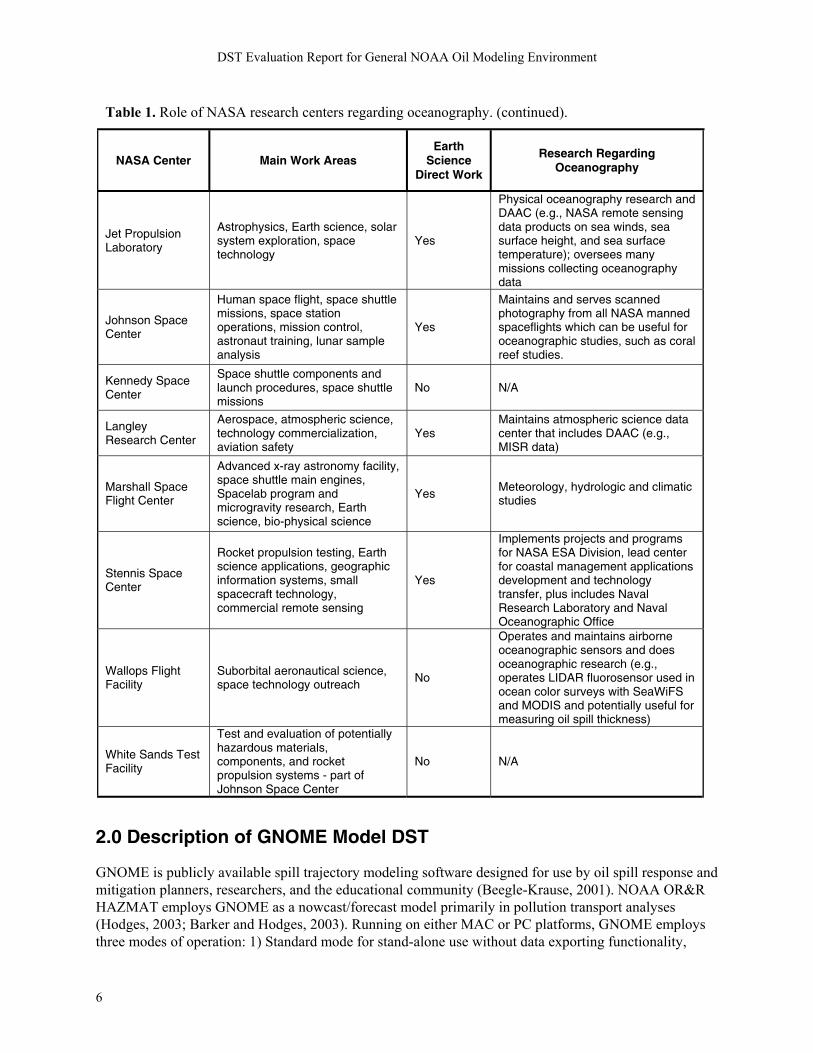
Table 1. Role of NASA research centers regarding oceanography. (continued).
NASA Center Main Work Areas Earth
Science Direct Work
Research Regarding Oceanography
Jet Propulsion Laboratory
Astrophysics, Earth science, solar system exploration, space technology
Yes
Physical oceanography research and DAAC (e.g., NASA remote sensing data products on sea winds, sea surface height, and sea surface temperature); oversees many missions collecting oceanography data
Johnson Space Center
Human space flight, space shuttle missions, space station operations, mission control, astronaut training, lunar sample analysis
Yes
Maintains and serves scanned photography from all NASA manned spaceflights which can be useful for oceanographic studies, such as coral reef studies.
Kennedy Space Center
Space shuttle components and launch procedures, space shuttle missions
No N/A
Langley Research Center
Aerospace, atmospheric science, technology commercialization, aviation safety
Yes Maintains atmospheric science data center that includes DAAC (e.g., MISR data)
Marshall Space Flight Center
Advanced x-ray astronomy facility, space shuttle main engines, Spacelab program and microgravity research, Earth science, bio-physical science
Yes Meteorology, hydrologic and climatic studies
Stennis Space Center
Rocket propulsion testing, Earth science applications, geographic information systems, small spacecraft technology, commercial remote sensing
Yes
Implements projects and programs for NASA ESA Division, lead center for coastal management applications development and technology transfer, plus includes Naval Research Laboratory and Naval Oceanographic Office
Wallops Flight Facility
Suborbital aeronautical science, space technology outreach No
Operates and maintains airborne oceanographic sensors and does oceanographic research (e.g., operates LIDAR fluorosensor used in ocean color surveys with SeaWiFS and MODIS and potentially useful for measuring oil spill thickness)
White Sands Test Facility
Test and evaluation of potentially hazardous materials, components, and rocket propulsion systems - part of Johnson Space Center
No N/A
2.0 Description of GNOME Model DST
GNOME is publicly available spill trajectory modeling software designed for use by oil spill response and mitigation planners, researchers, and the educational community (Beegle-Krause, 2001). NOAA OR&R HAZMAT employs GNOME as a nowcast/forecast model primarily in pollution transport analyses (Hodges, 2003; Barker and Hodges, 2003). Running on either MAC or PC platforms, GNOME employs three modes of operation: 1) Standard mode for stand-alone use without data exporting functionality,
6
NASA ESA Directorate Coastal Management Team
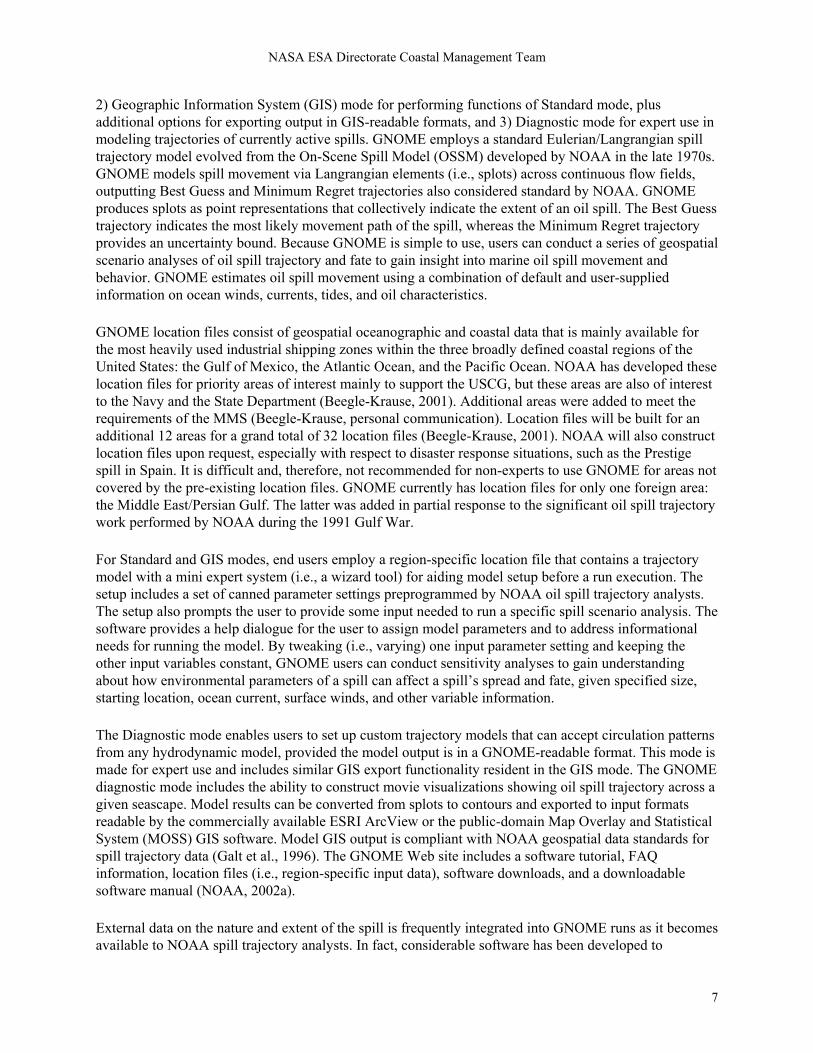
2) Geographic Information System (GIS) mode for performing functions of Standard mode, plus additional options for exporting output in GIS-readable formats, and 3) Diagnostic mode for expert use in modeling trajectories of currently active spills. GNOME employs a standard Eulerian/Langrangian spill trajectory model evolved from the On-Scene Spill Model (OSSM) developed by NOAA in the late 1970s. GNOME models spill movement via Langrangian elements (i.e., splots) across continuous flow fields, outputting Best Guess and Minimum Regret trajectories also considered standard by NOAA. GNOME produces splots as point representations that collectively indicate the extent of an oil spill. The Best Guess trajectory indicates the most likely movement path of the spill, whereas the Minimum Regret trajectory provides an uncertainty bound. Because GNOME is simple to use, users can conduct a series of geospatial scenario analyses of oil spill trajectory and fate to gain insight into marine oil spill movement and behavior. GNOME estimates oil spill movement using a combination of default and user-supplied information on ocean winds, currents, tides, and oil characteristics.
GNOME location files consist of geospatial oceanographic and coastal data that is mainly available for the most heavily used industrial shipping zones within the three broadly defined coastal regions of the United States: the Gulf of Mexico, the Atlantic Ocean, and the Pacific Ocean. NOAA has developed these location files for priority areas of interest mainly to support the USCG, but these areas are also of interest to the Navy and the State Department (Beegle-Krause, 2001). Additional areas were added to meet the requirements of the MMS (Beegle-Krause, personal communication). Location files will be built for an additional 12 areas for a grand total of 32 location files (Beegle-Krause, 2001). NOAA will also construct location files upon request, especially with respect to disaster response situations, such as the Prestige spill in Spain. It is difficult and, therefore, not recommended for non-experts to use GNOME for areas not covered by the pre-existing location files. GNOME currently has location files for only one foreign area: the Middle East/Persian Gulf. The latter was added in partial response to the significant oil spill trajectory work performed by NOAA during the 1991 Gulf War.
For Standard and GIS modes, end users employ a region-specific location file that contains a trajectory model with a mini expert system (i.e., a wizard tool) for aiding model setup before a run execution. The setup includes a set of canned parameter settings preprogrammed by NOAA oil spill trajectory analysts. The setup also prompts the user to provide some input needed to run a specific spill scenario analysis. The software provides a help dialogue for the user to assign model parameters and to address informational needs for running the model. By tweaking (i.e., varying) one input parameter setting and keeping the other input variables constant, GNOME users can conduct sensitivity analyses to gain understanding about how environmental parameters of a spill can affect a spill’s spread and fate, given specified size, starting location, ocean current, surface winds, and other variable information.
The Diagnostic mode enables users to set up custom trajectory models that can accept circulation patterns from any hydrodynamic model, provided the model output is in a GNOME-readable format. This mode is made for expert use and includes similar GIS export functionality resident in the GIS mode. The GNOME diagnostic mode includes the ability to construct movie visualizations showing oil spill trajectory across a given seascape. Model results can be converted from splots to contours and exported to input formats readable by the commercially available ESRI ArcView or the public-domain Map Overlay and Statistical System (MOSS) GIS software. Model GIS output is compliant with NOAA geospatial data standards for spill trajectory data (Galt et al., 1996). The GNOME Web site includes a software tutorial, FAQ information, location files (i.e., region-specific input data), software downloads, and a downloadable software manual (NOAA, 2002a).
External data on the nature and extent of the spill is frequently integrated into GNOME runs as it becomes available to NOAA spill trajectory analysts. In fact, considerable software has been developed to
7
DST Evaluation Report for General NOAA Oil Modeling Environment
accommodate various data inputs. Spill data is collected using a variety of techniques, including airborne remote sensing, buoy data, and in situ techniques, such as floaters that can be tracked remotely. Spill data is also gathered using satellite remote sensing, although this is performed more opportunistically in support of oil spill response. Monitoring oil spill movement via remote sensing can be confounded by false positives from such factors as red tides (See Appendix D for additional information).
Environmental data on the spill is gathered using in situ buoy data and synoptic remote sensing from air and space. Analysts desiring environmental data to compute oil spill trajectories want real-time measurements for use in nowcasts and forecasts. Supplying real-time environmental data is a formidable and somewhat impractical task to accomplish for expansive areas with present technology. However, networks of probe-enhanced buoys have been established in environmentally sensitive areas frequented by heavy shipping traffic (e.g., the San Francisco Bay region). The NWS provides NOAA OR&R HAZMAT’s GNOME analysts with much of this environmental data, based on buoy sensor readings and on their own remote sensing data products. However, spill trajectory analysts often consider other sources to acquire the most up-to-date data available.
GNOME can import hydrodynamic modeling output of multiple formats and sources, such as output from the NOAA Current Analysis for Trajectories (CATS) program. Additional work is being performed to expand this capability to accept ocean current data in network common data file (netCDF) format, which is often used by non-NOAA models. For simulating horizontal mixing of oil dispersion, GNOME employs a conservative oil spreading model for which the user inputs a diffusion coefficient for calculating random step lengths drawn from a uniform distribution (Beegle-Krause, 2001). In doing so, GNOME simulates diffusion as a random walk. Use of a uniform distribution is advantageous because it enables users to pinpoint higher risk areas more accurately for current or simulated oil spills.
GNOME has output options for producing 2-D movies, GIS-readable point files of oil spread, and GIS-readable contour vectors depicting oil concentration levels. GNOME output graphics indicate the relative amount of pollution released, floating on the water, washed on the beach, evaporated, and dispersed for each location and for the entire set of spill locations.
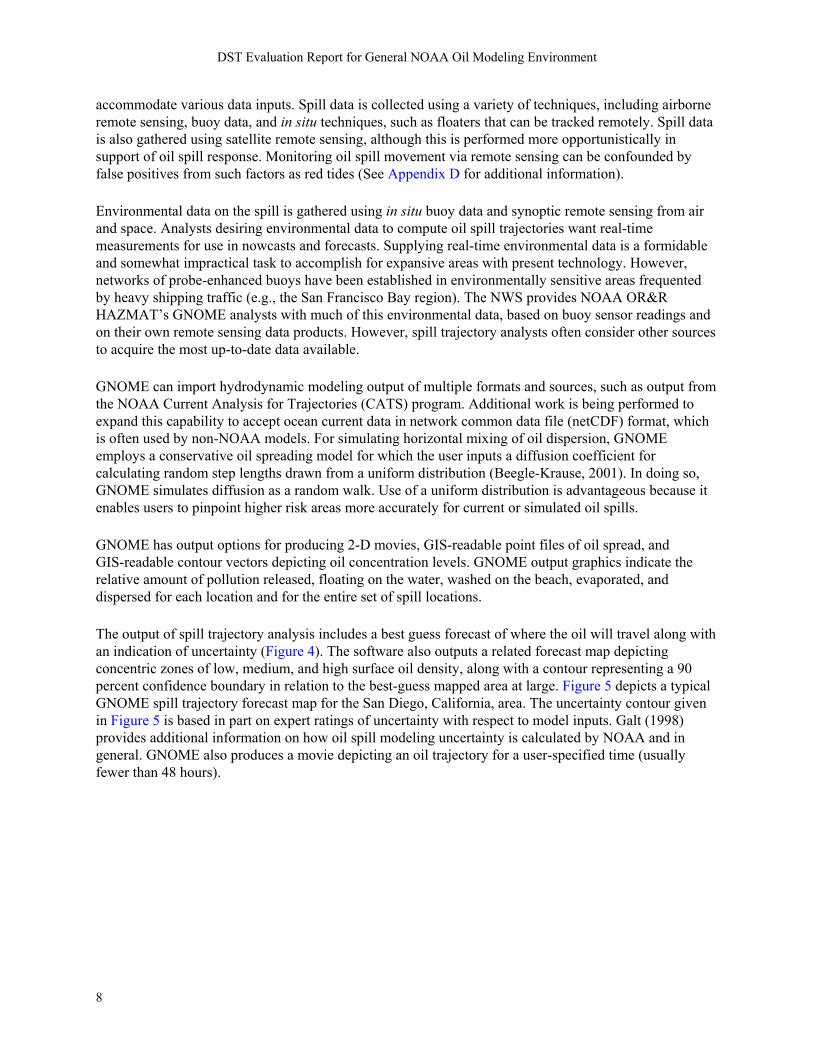
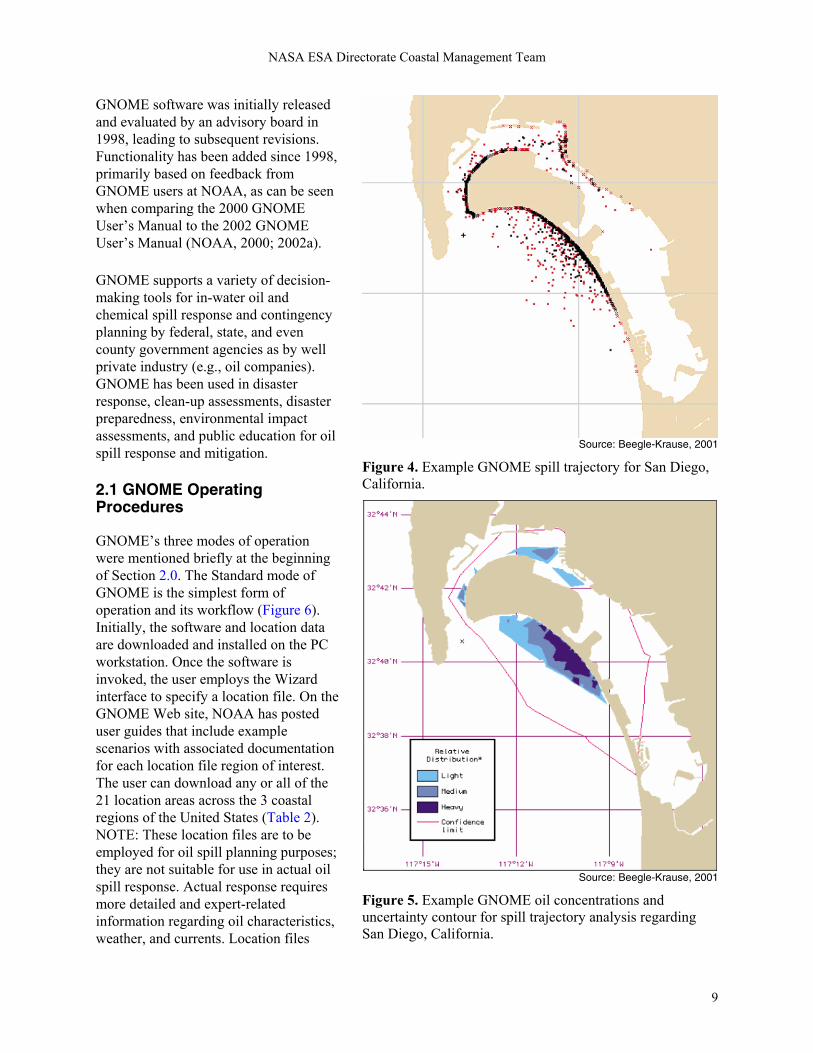
The output of spill trajectory analysis includes a best guess forecast of where the oil will travel along with an indication of uncertainty (Figure 4). The software also outputs a related forecast map depicting concentric zones of low, medium, and high surface oil density, along with a contour representing a 90 percent confidence boundary in relation to the best-guess mapped area at large. Figure 5 depicts a typical GNOME spill trajectory forecast map for the San Diego, California, area. The uncertainty contour given in Figure 5 is based in part on expert ratings of uncertainty with respect to model inputs. Galt (1998) provides additional information on how oil spill modeling uncertainty is calculated by NOAA and in general. GNOME also produces a movie depicting an oil trajectory for a user-specified time (usually fewer than 48 hours).
8
NASA ESA Directorate Coastal Management Team
GNOME software was initially released and evaluated by an advisory board in 1998, leading to subsequent revisions. Functionality has been added since 1998, primarily based on feedback from GNOME users at NOAA, as can be seen when comparing the 2000 GNOME User’s Manual to the 2002 GNOME User’s Manual (NOAA, 2000; 2002a).
GNOME supports a variety of decision-making tools for in-water oil and chemical spill response and contingency planning by federal, state, and even county government agencies as by well private industry (e.g., oil companies). GNOME has been used in disaster response, clean-up assessments, disaster preparedness, environmental impact assessments, and public education for oil spill response and mitigation.
Source: Beegle-Krause, 2001
Figure 4. Example GNOME spill trajectory for San Diego, California. 2.1 GNOME Operating
Procedures
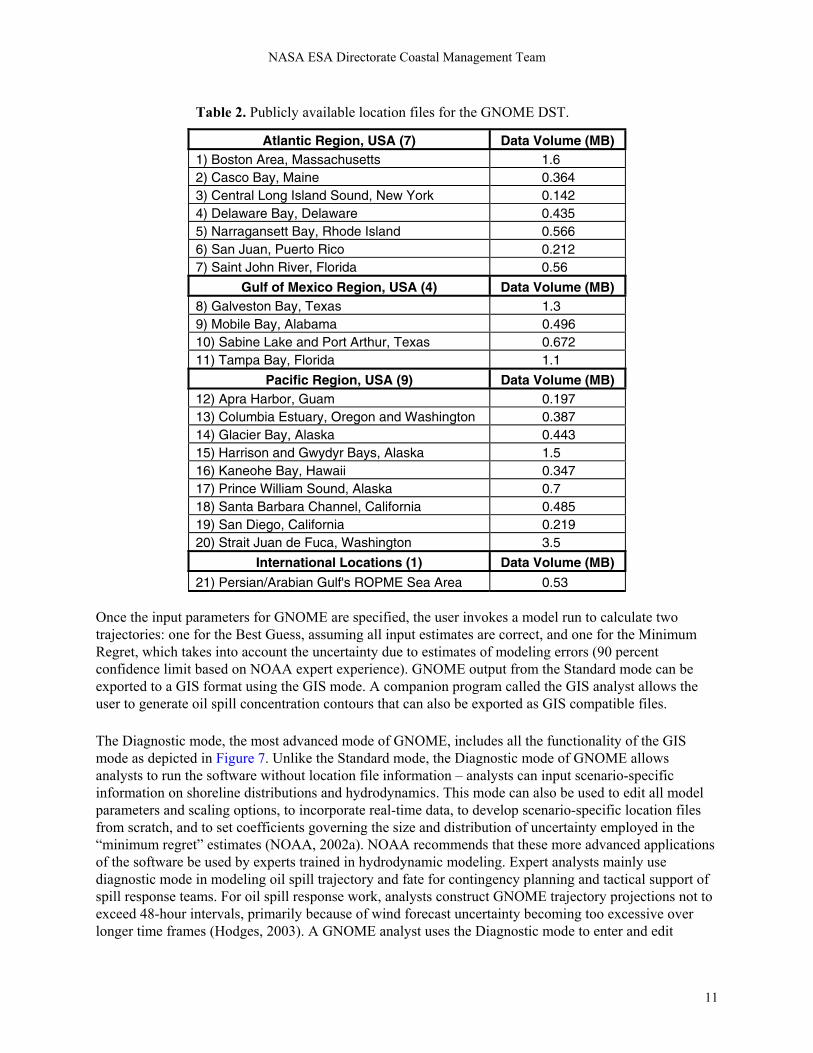
GNOME’s three modes of operation were mentioned briefly at the beginning of Section 2.0. The Standard mode of GNOME is the simplest form of operation and its workflow (Figure 6). Initially, the software and location data are downloaded and installed on the PC workstation. Once the software is invoked, the user employs the Wizard interface to specify a location file. On the GNOME Web site, NOAA has posted user guides that include example scenarios with associated documentation for each location file region of interest. The user can download any or all of the 21 location areas across the 3 coastal regions of the United States (Table 2). NOTE: These location files are to be employed for oil spill planning purposes; they are not suitable for use in actual oil spill response. Actual response requires more detailed and expert-related information regarding oil characteristics, weather, and currents. Location files
Source: Beegle-Krause, 2001
Figure 5. Example GNOME oil concentrations and uncertainty contour for spill trajectory analysis regarding San Diego, California.
9
DST Evaluation Report for General NOAA Oil Modeling Environment
include only generalized information on tides, currents, and shorelines. Such files include general climatologic information and do not include time-sensitive information regarding weather conditions.
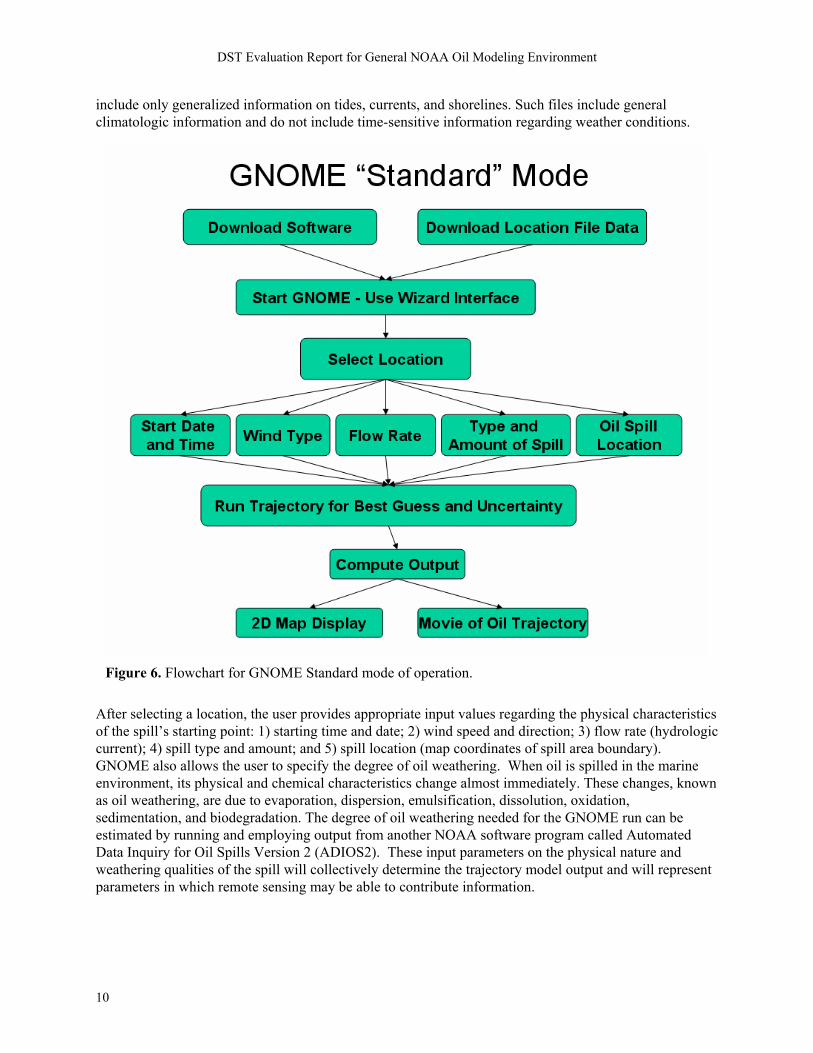
Figure 6. Flowchart for GNOME Standard mode of operation.
After selecting a location, the user provides appropriate input values regarding the physical characteristics of the spill’s starting point: 1) starting time and date; 2) wind speed and direction; 3) flow rate (hydrologic current); 4) spill type and amount; and 5) spill location (map coordinates of spill area boundary). GNOME also allows the user to specify the degree of oil weathering. When oil is spilled in the marine environment, its physical and chemical characteristics change almost immediately. These changes, known as oil weathering, are due to evaporation, dispersion, emulsification, dissolution, oxidation, sedimentation, and biodegradation. The degree of oil weathering needed for the GNOME run can be estimated by running and employing output from another NOAA software program called Automated Data Inquiry for Oil Spills Version 2 (ADIOS2). These input parameters on the physical nature and weathering qualities of the spill will collectively determine the trajectory model output and will represent parameters in which remote sensing may be able to contribute information.
10
NASA ESA Directorate Coastal Management Team
Table 2. Publicly available location files for the GNOME DST.
Atlantic Region, USA (7) Data Volume (MB) 1) Boston Area, Massachusetts 1.6 2) Casco Bay, Maine 0.364 3) Central Long Island Sound, New York 0.142 4) Delaware Bay, Delaware 0.435 5) Narragansett Bay, Rhode Island 0.566 6) San Juan, Puerto Rico 0.212 7) Saint John River, Florida 0.56
Gulf of Mexico Region, USA (4) Data Volume (MB) 8) Galveston Bay, Texas 1.3 9) Mobile Bay, Alabama 0.496 10) Sabine Lake and Port Arthur, Texas 0.672 11) Tampa Bay, Florida 1.1
Pacific Region, USA (9) Data Volume (MB) 12) Apra Harbor, Guam 0.197 13) Columbia Estuary, Oregon and Washington 0.387 14) Glacier Bay, Alaska 0.443 15) Harrison and Gwydyr Bays, Alaska 1.5 16) Kaneohe Bay, Hawaii 0.347 17) Prince William Sound, Alaska 0.7 18) Santa Barbara Channel, California 0.485 19) San Diego, California 0.219 20) Strait Juan de Fuca, Washington 3.5
International Locations (1) Data Volume (MB)
21) Persian/Arabian Gulf's ROPME Sea Area 0.53
Once the input parameters for GNOME are specified, the user invokes a model run to calculate two trajectories: one for the Best Guess, assuming all input estimates are correct, and one for the Minimum Regret, which takes into account the uncertainty due to estimates of modeling errors (90 percent confidence limit based on NOAA expert experience). GNOME output from the Standard mode can be exported to a GIS format using the GIS mode. A companion program called the GIS analyst allows the user to generate oil spill concentration contours that can also be exported as GIS compatible files.
The Diagnostic mode, the most advanced mode of GNOME, includes all the functionality of the GIS mode as depicted in Figure 7. Unlike the Standard mode, the Diagnostic mode of GNOME allows analysts to run the software without location file information – analysts can input scenario-specific information on shoreline distributions and hydrodynamics. This mode can also be used to edit all model parameters and scaling options, to incorporate real-time data, to develop scenario-specific location files from scratch, and to set coefficients governing the size and distribution of uncertainty employed in the “minimum regret” estimates (NOAA, 2002a). NOAA recommends that these more advanced applications of the software be used by experts trained in hydrodynamic modeling. Expert analysts mainly use diagnostic mode in modeling oil spill trajectory and fate for contingency planning and tactical support of spill response teams. For oil spill response work, analysts construct GNOME trajectory projections not to exceed 48-hour intervals, primarily because of wind forecast uncertainty becoming too excessive over longer time frames (Hodges, 2003). A GNOME analyst uses the Diagnostic mode to enter and edit
11
DST Evaluation Report for General NOAA Oil Modeling Environment
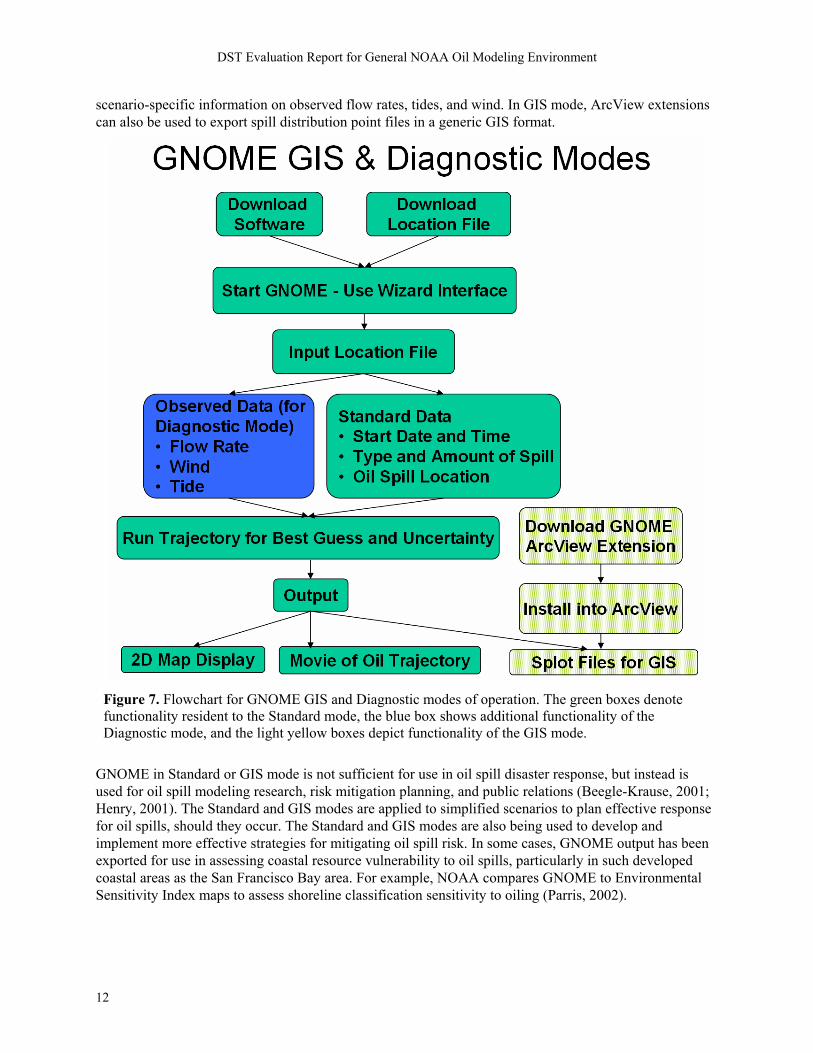
scenario-specific information on observed flow rates, tides, and wind. In GIS mode, ArcView extensions can also be used to export spill distribution point files in a generic GIS format.
Figure 7. Flowchart for GNOME GIS and Diagnostic modes of operation. The green boxes denote functionality resident to the Standard mode, the blue box shows additional functionality of the Diagnostic mode, and the light yellow boxes depict functionality of the GIS mode.
GNOME in Standard or GIS mode is not sufficient for use in oil spill disaster response, but instead is used for oil spill modeling research, risk mitigation planning, and public relations (Beegle-Krause, 2001; Henry, 2001). The Standard and GIS modes are applied to simplified scenarios to plan effective response for oil spills, should they occur. The Standard and GIS modes are also being used to develop and implement more effective strategies for mitigating oil spill risk. In some cases, GNOME output has been exported for use in assessing coastal resource vulnerability to oil spills, particularly in such developed coastal areas as the San Francisco Bay area. For example, NOAA compares GNOME to Environmental Sensitivity Index maps to assess shoreline classification sensitivity to oiling (Parris, 2002).
12
NASA ESA Directorate Coastal Management Team
The GNOME Diagnostic mode can employ model output from other NOAA software, such as the CATS program for hydrodynamic modeling (Beegle-Krause, 2001; Galt, 1980). Conversely, GNOME GIS output can be imported into other NOAA models used in oil spill risk assessment and response. Examples in the literature include the use of GNOME with NOAA’s Trajectory Analysis Planner (TAP) (Beegle-Krause, 2001), OSSM, and ADIOS2. GNOME output can be read into ArcView and MOSS GIS software. GNOME includes an extension called GNOME Analyst that allows additional output display capability. NOAA (2002b) and the International Marine Organization (2000) provide more descriptive information on the suite of NOAA software used in oil spill modeling.
NOAA provides additional documentation on GNOME’s operating procedure, primarily through the GNOME User Manual (NOAA, 2002a) and other information posted on the GNOME Web site. In addition, conference papers by Beegle-Kraus (2001; 2003) and Beegle Krause et al. (2003) describe basic operation of the software.
2.2 GNOME End Users
GNOME has a broad user base, consisting of Federal and State agencies involved with coastal environmental protection and of oil spill response consultants, teachers, students, and researchers. NOAA is the primary Federal user of the software, often in support of USCG oil and chemical spill in water response activities. GNOME is also being used in MMS environmental impact studies affiliated with offshore oil leasing, such as proposed oil leases in the Santa Barbara Channel (MMS, 2001). Another NOAA study employed GNOME and the related NOAA TAP software for modeling and assessing fish larvae dispersal (Kendall and Picquelle, 2003).
Federal agencies involved with in-water oil spill assessment include the MMS, the USGS, the USCG, the USACE, the EPA, and the Department of Energy. These groups sometimes make use of NOAA oil spill trajectories, although the USCG and the EPA do so in response to OPA 90. Accordingly, NOAA holds primary responsibility in providing spill modeling expertise to the USCG during major spills in non-inland coastal U.S. waters (USCG, 2004). NOAA also provides comparable services to the EPA, which is responsible for oil spill response in Federal inland waters with coastal areas, such as along the Great Lakes. In some cases, NOAA and other Federal agencies use multiple spill trajectory analysis software for comparison purposes, especially during large spills and along proposed oil lease areas with potential for oil spill impacts (e.g., MMS, 2001).
State agencies and private industry within the oil spill response community also use GNOME. Many coastal states include agency programs responsible for oil spill risk assessment, mitigation, and response. Some of these groups use GNOME to model scenarios in contingency planning exercises. Examples of state agency GNOME users include the Alaska Department of Environmental Conservation and the Washington Department of Ecology (2003). Oil companies and consulting firms are also using the software either in contingency planning or in environmental impact assessment.
Upon request, NOAA assists foreign countries with oil spill trajectory prediction and other spill response services. NOAA assisted Spain with GNOME trajectory analysis during response to the 2003 Prestige oil spill and Ecuador during the 2001 Jessica oil spill over the Galapagos. GNOME has been used in foreign research on oil spill modeling, including an environmental risk assessment of oil spill risk for the North Sea (Wojtaszek, 2003) in which GNOME results were compared to those from an oil modeling package from the Netherlands known as SIMPAR. Fuentes (2003) conducted additional research with GNOME to model oil spill scenarios for the Rosarita area of Baja de California, Mexico.
13
DST Evaluation Report for General NOAA Oil Modeling Environment
NOAA also uses other in-house software for spill disaster response (NOAA, 2002b). When supporting disaster response, NOAA OR&R HAZMAT uses GNOME in Diagnostic mode, along with other oil modeling software such as the previously mentioned in-house OSSM, the TAP software for statistical probability analysis based on a full range of possible spill scenarios, and the ADIOS2 program for oil weather modeling. NOAA’s OSSM software can be made available for external use but has minimal documentation (NOAA, 2002b). The public can employ GNOME because it is in the public domain and it has better documentation than OSSM (Henry, 2001). However, OSSM is still used by NOAA spill trajectory analysts for oil spill response because it contains certain functions that are not available in GNOME. Used as a planning tool with or without GNOME, TAP generates multiple oil spill trajectories to determine the probability that a given spot in the area of interest will fall victim to an oil spill. GNOME is more often used to model specific scenarios to determine how and where the oil spill will move.
2.3 Pros and Cons of GNOME DST Features
Beegle-Krause (2001), Henry (2001), and Wojtaszek (2003) describe apparent advantages and shortcomings of GNOME. In terms of advantages, GNOME is publicly available and relatively easy to use. NOAA constructed the software using the most up-to-date, object-oriented methods in C++ programming (Beegle-Krause, 2001). In doing so, process-specific objects are self-contained components (i.e., modules) of GNOME. The software also employs a Eulerian/Langrangian approach considered standard for oil spill trajectory modeling. As noted previously, GNOME can import hydrodynamic modeling output of various formats, such as output from the NOAA CATS program. GNOME interfaces with several NOAA oil spill modeling packages, including those that are publicly available.
One advantage of GNOME is its ability to output options for producing 2-D movies, GIS-readable point files of oil spread, and GIS-readable contour vectors depicting oil concentration levels. GNOME software has been designed for use with other NOAA software tools used for geospatial data analyses regarding oil spill assessment and response. Other advantages of GNOME include its graphical user interface and its availability on both MAC and PC platforms. Wojtaszek (2003) adds that GNOME users can simulate oil spill trajectories for multiple locations in any given run, although the weather must have the same settings for each location.
On the downside, GNOME location data is mainly available for a few heavily traveled industrial shipping zones within the three broadly defined coastal regions of the United States: the Gulf of Mexico, the Atlantic Ocean, and the Pacific Ocean. Additional location data for other areas will be added in the future.
Wojtaszek (2003) reported additional drawbacks to GNOME: generally, results in oil spill trajectory modeling are subject to errors from employed ocean current and wind settings. Available documentation on GNOME does not give much description of mathematical formulas used in modeling spill trajectories. Another potential limitation of the software is that it cannot be used for oil spills larger than a set limit of 76,000 cubic meters (20,079,200 gallons). To give some context, the largest U.S. oil spill, the Exxon Valdez incident, released about 11,000,000 gallons into Prince William Sound (USCG, 1999). However, internationally, at least 29 major oil spills have exceeded 20 million gallons, including the 140-million-gallon Ixtoc 1 spill in the Gulf of Mexico in 1979. Therefore, the current spill size limitation of GNOME may cause a problem with extremely large spills. GNOME does not include a module that performs hydrodynamic modeling directly. However, according to NOAA, GNOME can read any hydrodynamic model output that is provided in a standard format (Beegle-Krause, 2003). In addition, NOAA OR&R HAZMAT software packages are configured so that an individual model remains distinct and is not intertwined into one huge software package. GNOME input formats are flexible enough to be able to read
14
NASA ESA Directorate Coastal Management Team
data from a variety of sources, provided the sources conform to standard, generally used formats. Otherwise, if the format is known and stable, GNOME can be programmed to read the format. GNOME is generally used to output nowcasts and near- to mid-range forecasts of spill trajectories (Barker and Hodges, 2003; Hodges, 2003). However, GNOME cannot effectively produce long-range forecasts, even though trajectory analysts would like to do so. GNOME is currently used to forecast up to the 48-hour mark. The primary impediment to long-range spill trajectories is wind forecast uncertainty (Barker and Hodges, 2003; Hodges, 2003). This impediment may be reduced for areas with strong prevailing winds and the climatological data to verify/validate those winds.
3.0 Consideration of NASA Inputs
3.1 GNOME DST Information Requirements
The System Engineering approach illustrated in Figure 2 outlines identification of DST information requirements that are subsequently used to consider whether NASA data, data products, models, or model estimates/predictions may be used effectively to improve the capability of the DST. GNOME information requirements depend on the application, which dictates whether the GNOME software can be run in a stand-alone capacity or with other in-house and external software packages. As discussed earlier, GNOME users employ the software in a variety of applications. Such applications can be classified as follows: 1) operational response preparedness, including risk assessment, disaster mitigation planning, and training of response personnel; 2) operational response support during a spill; 3) operational response support after a spill, including mitigation; and 4) research into improved methods of spill response and assessment before, during, and after spill incidents. Of these four categories of GNOME applications, operational response support possesses the most stringent, demanding requirements.
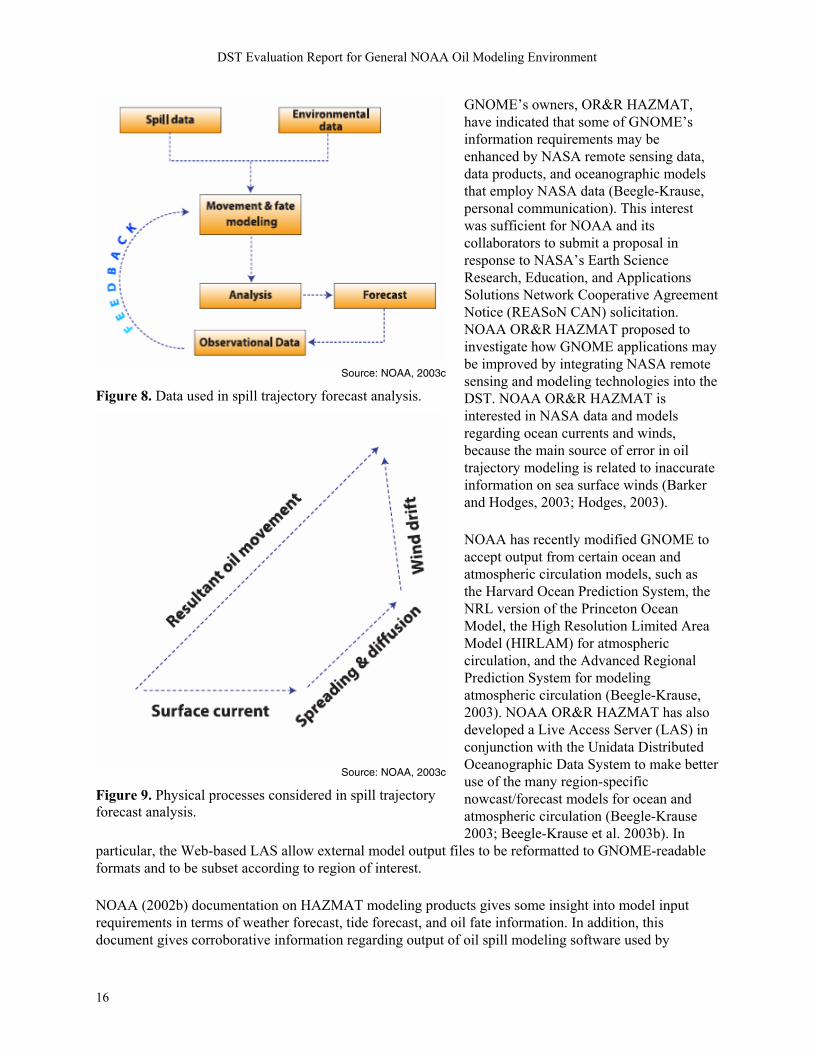
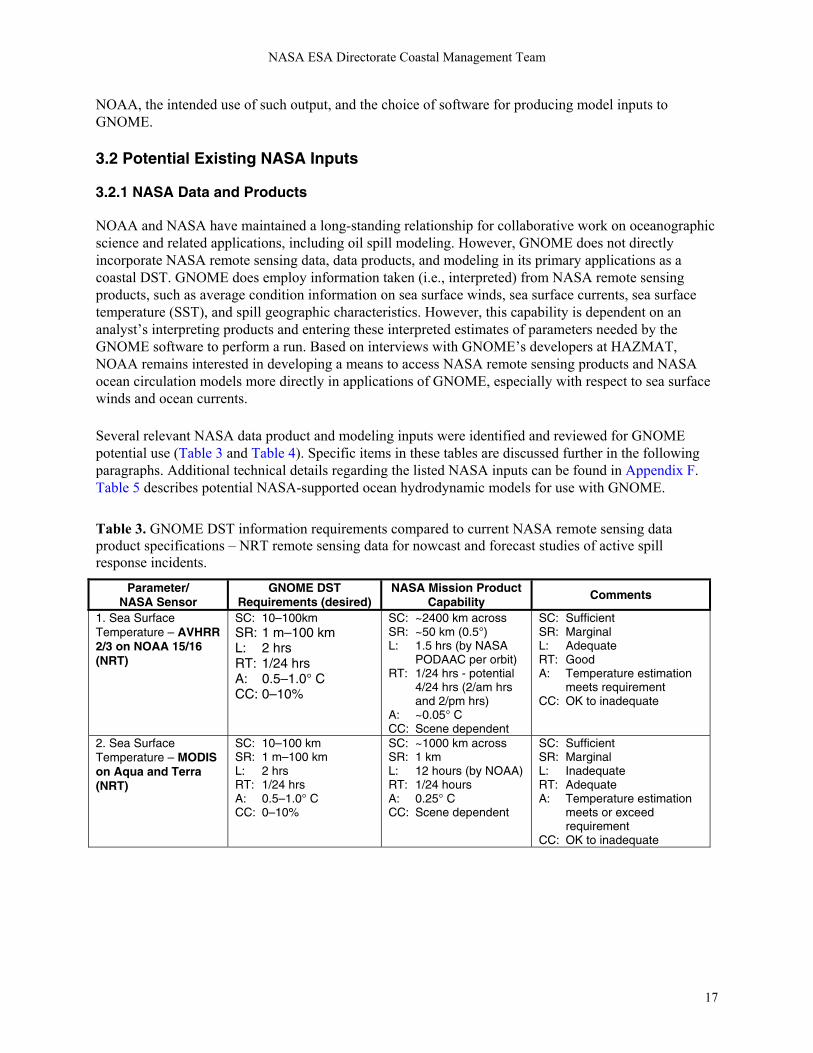
Oil trajectory analysis for actual oil spill response must be performed by expert oceanographers with experience and training in the specific application at hand. For each spill incident, trajectory analysts usually must refine oil spill trajectory prediction as additional, timely oil spill information (such as location, type, thickness, total volume, dispersion, and weathering) and environmental characteristics (such as currents, tides, and wind) become available for input into the model (Figure 8). In addition, the trajectory of oil across marine waters is often complicated by the interplay of multiple factors (Figure 9). Many of GNOME’s information requirements for supporting oil spill response can be gleaned from the NOAA Trajectory Analysis Handbook (NOAA, 2002c).
GNOME has thematic map information requirements that may relate to remote sensing data resolution requirements. Resolution is commonly assessed in terms of spatial, radiometric, signal, and temporal requirements. Thematic map information requirements refer to different indicators of product quality, such as thematic map and geopositional accuracy in addition to spatial and temporal resolution accuracy. In addition, data delivery time and minimum mapping unit can also be important requirements. The input data requirements need to be sufficiently resolute to enable targeted output quality requirements.
NOAA (2002c) reports that the following environmental data are needed for oil spill trajectory analysis: wind (speed, direction, and variability), currents (large-scale, tidal, and river flows), tidal heights, and diffusion. Certain spill information is also needed, including the location of the spill, oil type, oil volume lost, and the time and type of loss (instantaneous or continuous, stationary or moving). The report also maintains that the uncertainty estimation for trajectory analysis needs to take into account oil thickness, convergences, local variations in astronomical tides, small-scale currents (i.e., around piers, small groins, or jetties), and small-scale meteorology.
15
DST Evaluation Report for General NOAA Oil Modeling Environment
GNOME’s owners, OR&R HAZMAT, have indicated that some of GNOME’s information requirements may be enhanced by NASA remote sensing data, data products, and oceanographic models that employ NASA data (Beegle-Krause, personal communication). This interest was sufficient for NOAA and its collaborators to submit a proposal in response to NASA’s Earth Science Research, Education, and Applications Solutions Network Cooperative Agreement Notice (REASoN CAN) solicitation. NOAA OR&R HAZMAT proposed to investigate how GNOME applications may be improved by integrating NASA remote sensing and modeling technologies into the DST. NOAA OR&R HAZMAT is interested in NASA data and models regarding ocean currents and winds, because the main source of error in oil trajectory modeling is related to inaccurate information on sea surface winds (Barker and Hodges, 2003; Hodges, 2003).
Source: NOAA, 2003c
Figure 8. Data used in spill trajectory forecast analysis.
NOAA has recently modified GNOME to accept output from certain ocean and atmospheric circulation models, such as the Harvard Ocean Prediction System, the NRL version of the Princeton Ocean Model, the High Resolution Limited Area Model (HIRLAM) for atmospheric circulation, and the Advanced Regional Prediction System for modeling atmospheric circulation (Beegle-Krause, 2003). NOAA OR&R HAZMAT has also developed a Live Access Server (LAS) in conjunction with the Unidata Distributed Oceanographic Data System to make better use of the many region-specific nowcast/forecast models for ocean and atmospheric circulation (Beegle-Krause 2003; Beegle-Krause et al. 2003b). In
particular, the Web-based LAS allow external model output files to be reformatted to GNOME-readable formats and to be subset according to region of interest.
Source: NOAA, 2003c
Figure 9. Physical processes considered in spill trajectory forecast analysis.
NOAA (2002b) documentation on HAZMAT modeling products gives some insight into model input requirements in terms of weather forecast, tide forecast, and oil fate information. In addition, this document gives corroborative information regarding output of oil spill modeling software used by
16
NASA ESA Directorate Coastal Management Team
NOAA, the intended use of such output, and the choice of software for producing model inputs to GNOME.
3.2 Potential Existing NASA Inputs
3.2.1 NASA Data and Products
NOAA and NASA have maintained a long-standing relationship for collaborative work on oceanographic science and related applications, including oil spill modeling. However, GNOME does not directly incorporate NASA remote sensing data, data products, and modeling in its primary applications as a coastal DST. GNOME does employ information taken (i.e., interpreted) from NASA remote sensing products, such as average condition information on sea surface winds, sea surface currents, sea surface temperature (SST), and spill geographic characteristics. However, this capability is dependent on an analyst’s interpreting products and entering these interpreted estimates of parameters needed by the GNOME software to perform a run. Based on interviews with GNOME’s developers at HAZMAT, NOAA remains interested in developing a means to access NASA remote sensing products and NASA ocean circulation models more directly in applications of GNOME, especially with respect to sea surface winds and ocean currents.
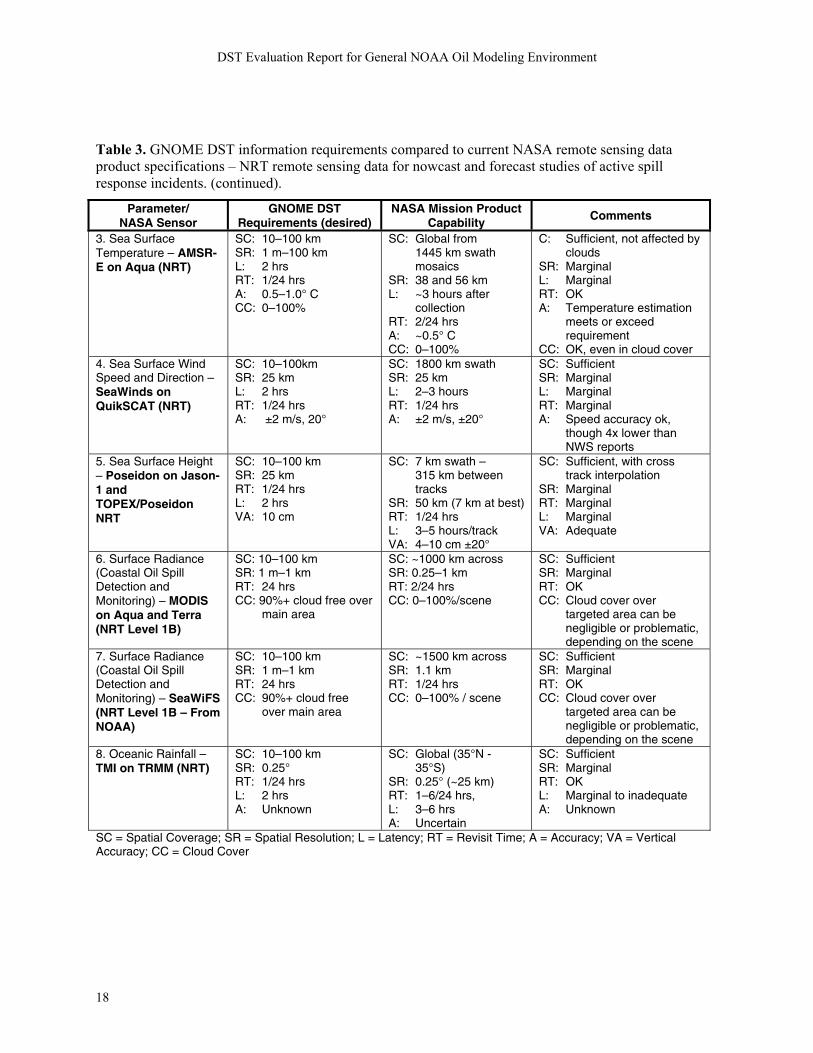
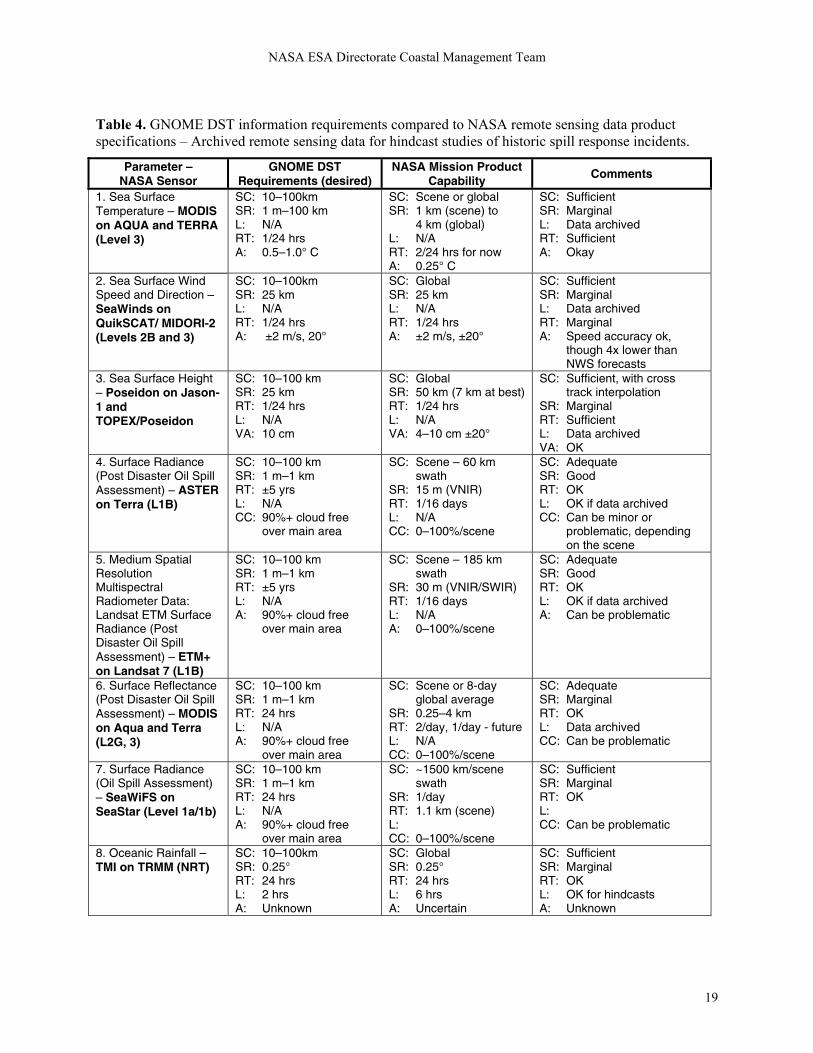
Several relevant NASA data product and modeling inputs were identified and reviewed for GNOME potential use (Table 3 and Table 4). Specific items in these tables are discussed further in the following paragraphs. Additional technical details regarding the listed NASA inputs can be found in Appendix F. Table 5 describes potential NASA-supported ocean hydrodynamic models for use with GNOME.
Table 3. GNOME DST information requirements compared to current NASA remote sensing data product specifications – NRT remote sensing data for nowcast and forecast studies of active spill response incidents.
Parameter/ NASA Sensor
GNOME DST Requirements (desired)
NASA Mission Product Capability
Comments
1. Sea Surface Temperature – AVHRR 2/3 on NOAA 15/16 (NRT)
SC: 10–100km SR: 1 m–100 km L: 2 hrs RT: 1/24 hrs A: 0.5–1.0° C CC: 0–10%
SC: ~2400 km across SR: ~50 km (0.5°) L: 1.5 hrs (by NASA
PODAAC per orbit) RT: 1/24 hrs - potential
4/24 hrs (2/am hrs and 2/pm hrs)
A: ~0.05° C CC: Scene dependent
SC: Sufficient SR: Marginal L: Adequate RT: Good A: Temperature estimation
meets requirement CC: OK to inadequate
2. Sea Surface Temperature – MODIS on Aqua and Terra (NRT)
SC: 10–100 km SR: 1 m–100 km L: 2 hrs RT: 1/24 hrs A: 0.5–1.0° C CC: 0–10%
SC: ~1000 km across SR: 1 km L: 12 hours (by NOAA) RT: 1/24 hours A: 0.25° C CC: Scene dependent
SC: Sufficient SR: Marginal L: Inadequate RT: Adequate A: Temperature estimation
meets or exceed requirement
CC: OK to inadequate
17
DST Evaluation Report for General NOAA Oil Modeling Environment
Table 3. GNOME DST information requirements compared to current NASA remote sensing data product specifications – NRT remote sensing data for nowcast and forecast studies of active spill response incidents. (continued).
Parameter/ NASA Sensor
GNOME DST Requirements (desired)
NASA Mission Product Capability
Comments
3. Sea Surface Temperature – AMSR-E on Aqua (NRT)
SC: 10–100 km SR: 1 m–100 km L: 2 hrs RT: 1/24 hrs A: 0.5–1.0° C CC: 0–100%
SC: Global from 1445 km swath mosaics
SR: 38 and 56 km L: ~3 hours after
collection RT: 2/24 hrs A: ~0.5° C CC: 0–100%
C: Sufficient, not affected by clouds
SR: Marginal L: Marginal RT: OK A: Temperature estimation
meets or exceed requirement
CC: OK, even in cloud cover 4. Sea Surface Wind Speed and Direction – SeaWinds on QuikSCAT (NRT)
SC: 10–100km SR: 25 km L: 2 hrs RT: 1/24 hrs A: ±2 m/s, 20°
SC: 1800 km swath SR: 25 km L: 2–3 hours RT: 1/24 hrs A: ±2 m/s, ±20°
SC: Sufficient SR: Marginal L: Marginal RT: Marginal A: Speed accuracy ok,
though 4x lower than NWS reports
5. Sea Surface Height – Poseidon on Jason-1 and TOPEX/Poseidon NRT
SC: 10–100 km SR: 25 km RT: 1/24 hrs L: 2 hrs VA: 10 cm
SC: 7 km swath – 315 km between tracks
SR: 50 km (7 km at best) RT: 1/24 hrs L: 3–5 hours/track VA: 4–10 cm ±20°
SC: Sufficient, with cross track interpolation
SR: Marginal RT: Marginal L: Marginal VA: Adequate
6. Surface Radiance (Coastal Oil Spill Detection and Monitoring) – MODIS on Aqua and Terra (NRT Level 1B)
SC: 10–100 km SR: 1 m–1 km RT: 24 hrs CC: 90%+ cloud free over
main area
SC: ~1000 km across SR: 0.25–1 km RT: 2/24 hrs CC: 0–100%/scene
SC: Sufficient SR: Marginal RT: OK CC: Cloud cover over
targeted area can be negligible or problematic, depending on the scene
7. Surface Radiance (Coastal Oil Spill Detection and Monitoring) – SeaWiFS (NRT Level 1B – From NOAA)
SC: 10–100 km SR: 1 m–1 km RT: 24 hrs CC: 90%+ cloud free
over main area
SC: ~1500 km across SR: 1.1 km RT: 1/24 hrs CC: 0–100% / scene
SC: Sufficient SR: Marginal RT: OK CC: Cloud cover over
targeted area can be negligible or problematic, depending on the scene
8. Oceanic Rainfall – TMI on TRMM (NRT)
SC: 10–100 km SR: 0.25° RT: 1/24 hrs L: 2 hrs A: Unknown
SC: Global (35°N - 35°S)
SR: 0.25° (~25 km) RT: 1–6/24 hrs, L: 3–6 hrs A: Uncertain
SC: Sufficient SR: Marginal RT: OK L: Marginal to inadequate A: Unknown
SC = Spatial Coverage; SR = Spatial Resolution; L = Latency; RT = Revisit Time; A = Accuracy; VA = Vertical Accuracy; CC = Cloud Cover
18
NASA ESA Directorate Coastal Management Team
Table 4. GNOME DST information requirements compared to NASA remote sensing data product specifications – Archived remote sensing data for hindcast studies of historic spill response incidents.
Parameter – NASA Sensor
GNOME DST Requirements (desired)
NASA Mission Product Capability Comments
1. Sea Surface Temperature – MODIS on AQUA and TERRA (Level 3)
SC: 10–100km SR: 1 m–100 km L: N/A RT: 1/24 hrs A: 0.5–1.0° C
SC: Scene or global SR: 1 km (scene) to
4 km (global) L: N/A RT: 2/24 hrs for now A: 0.25° C
SC: Sufficient SR: Marginal L: Data archived RT: Sufficient A: Okay
2. Sea Surface Wind Speed and Direction – SeaWinds on QuikSCAT/ MIDORI-2 (Levels 2B and 3)
SC: 10–100km SR: 25 km L: N/A RT: 1/24 hrs A: ±2 m/s, 20°
SC: Global SR: 25 km L: N/A RT: 1/24 hrs A: ±2 m/s, ±20°
SC: Sufficient SR: Marginal L: Data archived RT: Marginal A: Speed accuracy ok,
though 4x lower than NWS forecasts
3. Sea Surface Height – Poseidon on Jason-1 and TOPEX/Poseidon
SC: 10–100 km SR: 25 km RT: 1/24 hrs L: N/A VA: 10 cm
SC: Global SR: 50 km (7 km at best) RT: 1/24 hrs L: N/A VA: 4–10 cm ±20°
SC: Sufficient, with cross track interpolation
SR: Marginal RT: Sufficient L: Data archived VA: OK
4. Surface Radiance (Post Disaster Oil Spill Assessment) – ASTER on Terra (L1B)
SC: 10–100 km SR: 1 m–1 km RT: ±5 yrs L: N/A CC: 90%+ cloud free
over main area
SC: Scene – 60 km swath
SR: 15 m (VNIR) RT: 1/16 days L: N/A CC: 0–100%/scene
SC: Adequate SR: Good RT: OK L: OK if data archived CC: Can be minor or
problematic, depending on the scene
5. Medium Spatial Resolution Multispectral Radiometer Data: Landsat ETM Surface Radiance (Post Disaster Oil Spill Assessment) – ETM+ on Landsat 7 (L1B)
SC: 10–100 km SR: 1 m–1 km RT: ±5 yrs L: N/A A: 90%+ cloud free
over main area
SC: Scene – 185 km swath
SR: 30 m (VNIR/SWIR) RT: 1/16 days L: N/A A: 0–100%/scene
SC: Adequate SR: Good RT: OK L: OK if data archived A: Can be problematic
6. Surface Reflectance (Post Disaster Oil Spill Assessment) – MODIS on Aqua and Terra (L2G, 3)
SC: 10–100 km SR: 1 m–1 km RT: 24 hrs L: N/A A: 90%+ cloud free
over main area
SC: Scene or 8-day global average
SR: 0.25–4 km RT: 2/day, 1/day - future L: N/A CC: 0–100%/scene
SC: Adequate SR: Marginal RT: OK L: Data archived CC: Can be problematic
7. Surface Radiance (Oil Spill Assessment) – SeaWiFS on SeaStar (Level 1a/1b)
SC: 10–100 km SR: 1 m–1 km RT: 24 hrs L: N/A A: 90%+ cloud free
over main area
SC: ~1500 km/scene swath
SR: 1/day RT: 1.1 km (scene) L: CC: 0–100%/scene
SC: Sufficient SR: Marginal RT: OK L: CC: Can be problematic
8. Oceanic Rainfall – TMI on TRMM (NRT)
SC: 10–100km SR: 0.25° RT: 24 hrs L: 2 hrs A: Unknown
SC: Global SR: 0.25° RT: 24 hrs L: 6 hrs A: Uncertain
SC: Sufficient SR: Marginal RT: OK L: OK for hindcasts A: Unknown
19
DST Evaluation Report for General NOAA Oil Modeling Environment
Table 4. GNOME DST information requirements compared to NASA remote sensing data product specifications – Archived remote sensing data for hindcast studies of historic spill response incidents. (continued
Parameter – NASA Sensor
GNOME DST Requirements (desired)
NASA Mission Product Capability
Comments
9. Chlorophyll Fluorescence – MODIS on Aqua and Terra (Level 2 or 3)
SC: 10–100 km SR: 1 m–1 km RT: 24 hrs L: N/A A: 90%+ cloud free
over AOI
SC: Global, clear sky SR: 4.6 km RT: 2/day, 1/day - future L: N/A A: 0–100%/scene
SC: Adequate SR: Marginal RT: OK L: Data archived A: Can be problematic
10. Multi-Parameter Data Collections (Bundled AVHRR SST and TOPEX/Poseidon SSH) – AVHRR on NOAA satellites, plus Poseidon on TOPEX/Poseidon
SC: 10–2500 km SR: 1 m–100 km RT: 24 hrs L: N/A A: 90%+ cloud free
over main area
SC: Global 5- and 10-day average
SR: 0.5 and 1.0° (50 and 100 km)
RT: 24 hrs L: N/A A: 0–100%/scene
SC: Sufficient SR: Marginal RT: Marginal L: OK – Archived data A: OK depending on
location and season
SC = Spatial Coverage; SR = Spatial Resolution; L = Latency; RT = Revisit Time; A = Accuracy; VA = Vertical Accuracy; CC = Cloud Cover
For supporting active oil spill response, GNOME needs near-real-time (NRT) geospatial information on oil spill location and environment that could be provided by current NASA spaceborne sensors designed for global and broad regional observation, including MODIS (onboard Aqua and Terra), the Advanced Microwave Scanning Radiometer for the EOS (AMSR-E) (onboard Aqua), SeaWinds (onboard the Quick Scatterometer (QuikSCAT) and Midori 2), Poseidon-2 (onboard Jason-1), and the Tropical Rainfall Measuring Mission (TRMM) Microwave Imager (TMI). These sensors have planned follow-on replacements with upcoming missions. For example, products comparable to MODIS will be produced by the next-generation moderate resolution multispectral sensor: the Visible/Infrared Imager/Radiometer Suite (VIIRS) planned as part of the National Polar-orbiting Operational Environmental Satellite System (NPOESS) and the NPOESS Preparatory Project (NPP) missions. The SeaWinds sensors will eventually be replaced by another, currently unnamed sensor in 2008, while the Jason-1 satellite is scheduled to be joined by Jason-2 in the fourth quarter of 2006. The follow on to TRMM is the Global Precipitation Mission scheduled for 2008.
Other moderate and coarse spatial resolution NASA data sources might be useful for GNOME applications. For example, oil trajectories can be exported into GIS formats and overlain onto Landsat or Advanced Spaceborne Thermal Emission and Reflectance Radiometer (ASTER) data to assess land cover where oil spills are projected to come ashore. In addition, other data may be useful in fine-tuning information products that could be input to GNOME, including Gravity Recovery and Climate Experiment (GRACE) data. This gravity data is being used in calibration of sea surface height (SSH) estimation and in oceanographic circulation models. However, near time GRACE data is currently not readily available, which would limit its potential use in GNOME applications to hindcast trajectory analyses.
Oil spill response applications of GNOME have a rather stringent temporal requirement: remotely sensed environmental data must be made available for use in real-time or in near-real-time. Oil spill response requires that forecasts be based on information about environmental conditions within 2 hours of data
20
NASA ESA Directorate Coastal Management Team
acquisition. Environmental data has a very short shelf life for this application. After 2 hours, the usefulness of environmental spill data is lowered for oil spill response work because ocean environments can be quite dynamic, changing significantly even on an hourly basis. However, in some cases, the conditions may not change appreciably, thereby extending the utility of environmental information.
Use of GNOME in spill trajectory hindcasting studies does not have such stringent latency requirements (Table 4). For non-storm periods, historical environmental data may be useful for determining trends of a given locale for a given season. The NWS provides NOAA with much of this real-time and near-real-time environmental data, largely based on buoy probes and on NOAA’s own remote sensing data products. Hindcast applications may benefit from the same kinds of NASA remote sensing data. However, because of relaxed latency requirements, users can employ higher level products (Levels 2 or 3 as opposed to Level 1 in the case of SeaWinds data).
NOAA has utilized satellite remote sensing to track coastal oil spills on a limited basis, although the effectiveness of such data depends on the occurrence of suitable weather conditions. In cloud-free conditions, oil spill location and aerial extent can be assessed with multispectral satellite imagery, even with relatively spatially coarse sensors such as the Advanced Very High Resolution Radiometer (AVHRR) (Cross, 1992), SeaWiFS (Banks, 2003), and MODIS (Hu et al. 2003), if the spill is large enough to be spatially resolved. Under optimal conditions, the tandem of MODIS sensors onboard Aqua and Terra can provide up to two images of a spill area per day. Clouds can cause multispectral data to be ineffective for detection of oil spills in coastal waters. On the other hand, synthetic aperture radar (SAR) can be effectively used in cloudy conditions for oil spill monitoring, although its effectiveness is limited to situations with moderately mild winds. For C band hh polarization RADARSAT SAR data, the optimal wind speed for oil spill detection is from 3 m/s to 14 m/s (Biegart et al., 1997). Askne (2003) indicates the optimal wind speed for oil spill detection on European Remote Sensing Satellite (ERS) C band vv polarization SAR data is from 3 m/w to 10 m/s. The shorter waveband SAR data (X or C band) is generally accepted as being better for oil slick monitoring, though L band is also useful for coastal monitoring in general if the winds are in the optimal range (John Berry, Shell Oil (retired), personal communication).
Taking these studies into account, it appears that NRT MODIS multispectral data has some potential for aiding detection of active oil spills when the spill is large and more offshore. The same can be said for SeaWiFS data, although to a lesser extent because of its lack of thermal band coverage and its somewhat lower spatial resolution. Some literature suggests that day/night diurnal thermal remote sensing can enhance oil detection by satellite. MODIS can collect day and night SST data. The MODIS fluorescence product may also be helpful for detecting larger oil spills, although it would need to be available as an NRT product and would require more research to assess its potential fully. Even with the relatively coarse spatial resolutions, MODIS and SeaWiFS multispectral reflectance data may be helpful for visualizing results of oil spill trajectories, especially with respect to potential landfall areas. Moderate spatial resolution ASTER and Landsat multispectral reflectance data would be helpful in visualizing trajectories of spills as they approach land. The reflectance data could be used a backdrop in a GIS product to visualize the context of a given GNOME spill trajectory result. Multispectral reflectance imagery would not necessarily have to be from the same frame as the spill because its more time-critical information is overlain onto the ASTER or Landsat data to assess the context of the incoming spill in relation to threatened coastal areas.
Other NASA sensors have potential for providing near sea surface wind and SSH data in NRT mode. NOAA OR&R HAZMAT used information from SeaWinds data products in spill trajectory analyses for the Prestige oil spill in Spain (Beegle-Krause, 2003). NASA and NOAA currently employ the SeaWinds
21
DST Evaluation Report for General NOAA Oil Modeling Environment
scatterometer deployed onboard the QuikSCAT satellite to derive and provide NRT wind products. Wind estimates from SeaWinds may also be enhanced by using buoy data. Unfortunately, SeaWinds onboard Midori 2 is no longer collecting data, although historic data exists in NASA’s archive.
NASA delivers SeaWinds NRT data products to NOAA, albeit with less refinement and formal validation than the other, more processed, non-NRT SeaWinds products offered by NASA’s JPL Physical Oceanography DAAC. However, the SeaWinds NRT product also produces wind estimates in 2m/s increments, although without the product refinement and validation applied to the higher level non-NRT wind products. As noted earlier, faulty wind data can be a major problem in oil trajectory analyses. Buoy data may not be sufficiently distributed to ensure accurate estimates of near surface winds across broad remote seascapes, whereas satellite-based estimates can have a greater density of data points across the same area. In such cases, satellite-based wind data could be quite useful (Clamente-Colon et al., 2003), although buoy data could be used to calibrate and validate the NRT SeaWinds scatterometer data for better product accuracy. The spatial resolution of SeaWinds data may be problematic for near-shore coastal areas where hydrodynamic variability occurs at finer scales and estimates are affected by the land/water boundary. Offshore wind estimates using SeaWinds do not suffer from this issue.
Wind information can also be derived from satellite SAR data, such as the RADARSAT sensor in ScanSAR mode. This sensor contains a higher spatial resolution and is well calibrated, but it does not meet the same NRT data delivery specification of SeaWinds. Work by Monaldo (2000) and Beal (2000) indicates that RADARSAT ScanSAR data was processed into NRT wind speed and direction in 5 hours, which is 2 hours longer than the NOAA requirement for NRT SeaWinds data. The wind speed accuracy from the RADARSAT product is comparable to that of SeaWinds, but the spatial resolution is much higher at about 1 km per pixel (Beal, 2000). The frequency of the RADARSAT product is unknown, although it appears to be in terms of days. However, European SAR sensors (e.g., ERS-2) can also be used to derive fine resolution near sea surface wind products. SeaWinds has advantages over satellite SAR wind data in terms of temporal resolution (once per day given the data collection and NRT data delivery rate).
NRT Jason-1 (Poseidon-2) data may also aid GNOME applications by providing useful information on ocean currents in terms of sea surface height products. Such data is used along with SST data to model sea surface current dynamics. The relatively coarse spatial resolution of the Jason-1 data limits its usefulness in near-shore coastal areas because of the need for resolving the fine-scale hydrodynamics (Clamente-Colon et al., 2003). The data should have utility for offshore areas to complement the sparse density of sensor-equipped buoys. Although the once-per-day availability of Jason-1 data does not meet GNOME temporal requirements, NASA already provides NOAA with NRT Jason-1 products, which could supplement other data sources when relevant.
In addition to NRT remote sensing data, NASA also has a vast archive of remote sensing data that has potential for GNOME hindcast spill trajectory applications (Table 4). Latency requirements for hindcast analysis are not as stringent as those for spill trajectory analysis for active oil spills. A considerable amount of archived oceanographic remote sensing data exists for all of the previously mentioned NASA spaceborne remote sensing data types. Some of this archived data is bundled. For example, the Physical Oceanography DAAC at NASA’s JPL offers bundled SSH data from TOPEX/Poseidon and SST data from AVHRR for 1992 through 2002. The data can be downloaded on a global basis at either 0.5º or 1º resolution for 10-day, monthly, and yearly composites. Such data may be useful for GNOME hindcasting applications and research performed for response preparedness training and for educational purposes.
22
NASA ESA Directorate Coastal Management Team
3.2.2 NASA-Supported Models
NASA has contributed to the development and application of many hydrodynamic, oceanographic, and 3-D ocean circulation models, some of which are listed in Table 5. NOAA OR&R HAZMAT has expressed special interest in evaluating some of the hydrodynamic models developed in part by JPL. These include the Massachusetts Institute of Technology General Circulation Model (MITgcm), the Regional Ocean Modeling System (ROMS), and the S-Coordinates Rutgers University Model (SCRUM). NASA has contributed to the development of these models through university-funded research and/or partnerships with other Federal agencies and universities.
NOAA OR&R HAZMAT has also recognized that there may be other NASA-supported models with potential for integration into GNOME, such as the Advanced Circulation (ADCIRC) Model. The WaveWatch III (WW3) model may be useful; it has been used in support of oil spill modeling. This model was supported by NASA, although the most recent version was developed by NOAA. NASA is partnering with FEMA and the National Institute of Building Sciences to integrate WW3 with the Hazards U.S. – Multi-Hazards (HAZUS-MH) Hurricane risk assessment software as part of the Disaster Management National Application program.
The integration of additional models is another way to assimilate NASA inputs into GNOME, because some of these models already use NASA remote sensing data. For instance, wind data from QuikSCAT and rainfall estimates from TRMM have been incorporated into applications of the HIRLAM model for atmospheric circulation and weather forecasting. HIRLAM has been used with GNOME in the NOAA oil spill response support for the Prestige spill off the coast of Spain (Beegle-Krause, 2003).
The U.S Navy developed the Naval Coastal Ocean Model (NCOM) for the Gulf of Mexico, and NASA is making NCOM available to the NOAA National Centers for Coastal Ocean Science (NCCOS) through a REASoN-funded project. The project, titled “Sensor to User - Applying NASA/EOS Data to Coastal Zone Management Applications Developed from Integrated Analyses,” is a collaborative effort between Applied Coherent Technology, Inc. (ACT) and NRL at Stennis Space Center. The project’s intent is to integrate NRT ocean measurements from NASA and NOAA satellites with coastal ocean model output into an automated real-time database of ocean weather in the Gulf of Mexico.
NCOM is a spatially 3-D time independent numerical physical ocean model based on the primitive equations of motion. The model predicts temperature, salinity, and 3-D velocity fields and also takes into account bathymetry and coastline geometry. NCOM is used by the NRL to produce real-time nowcasts at 0.5° resolution for the global ocean.
23
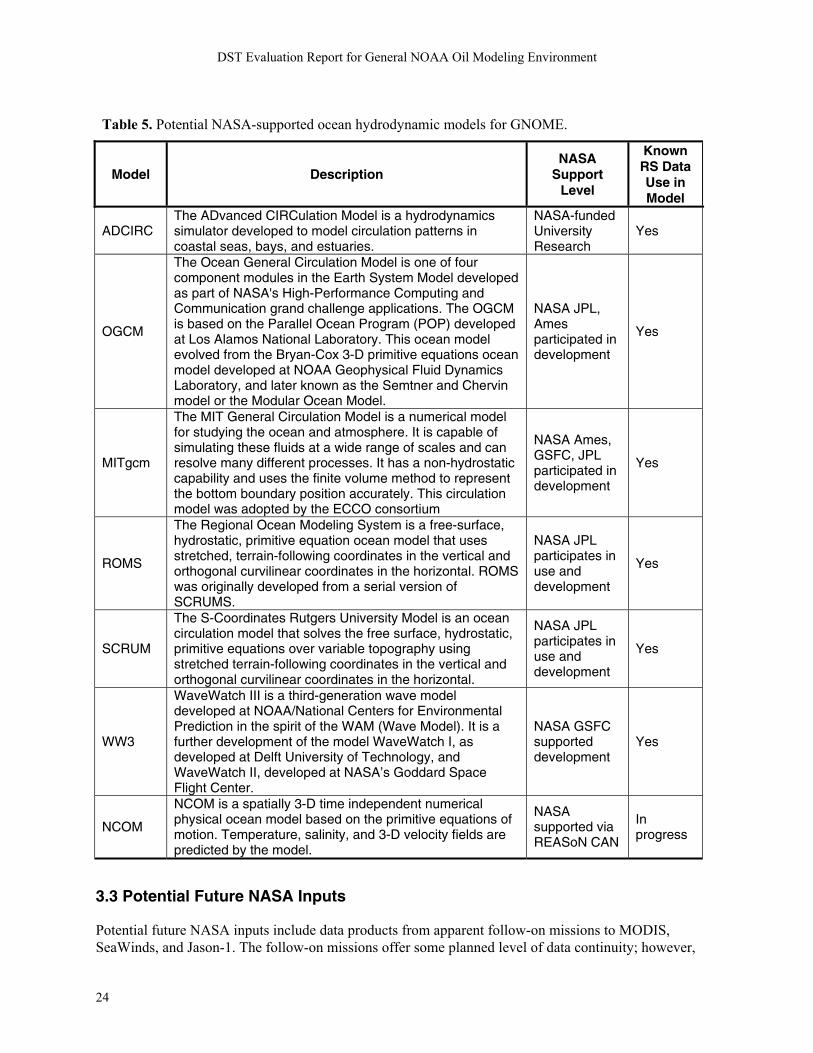
DST Evaluation Report for General NOAA Oil Modeling Environment
Table 5. Potential NASA-supported ocean hydrodynamic models for GNOME.
Model Description NASA
Support Level
Known RS Data Use in Model
ADCIRC The ADvanced CIRCulation Model is a hydrodynamics simulator developed to model circulation patterns in coastal seas, bays, and estuaries.
NASA-funded University Research
Yes
OGCM
The Ocean General Circulation Model is one of four component modules in the Earth System Model developed as part of NASA's High-Performance Computing and Communication grand challenge applications. The OGCM is based on the Parallel Ocean Program (POP) developed at Los Alamos National Laboratory. This ocean model evolved from the Bryan-Cox 3-D primitive equations ocean model developed at NOAA Geophysical Fluid Dynamics Laboratory, and later known as the Semtner and Chervin model or the Modular Ocean Model.
NASA JPL, Ames participated in development
Yes
MITgcm
The MIT General Circulation Model is a numerical model for studying the ocean and atmosphere. It is capable of simulating these fluids at a wide range of scales and can resolve many different processes. It has a non-hydrostatic capability and uses the finite volume method to represent the bottom boundary position accurately. This circulation model was adopted by the ECCO consortium
NASA Ames, GSFC, JPL participated in development
Yes
ROMS
The Regional Ocean Modeling System is a free-surface, hydrostatic, primitive equation ocean model that uses stretched, terrain-following coordinates in the vertical and orthogonal curvilinear coordinates in the horizontal. ROMS was originally developed from a serial version of SCRUMS.
NASA JPL participates in use and development
Yes
SCRUM
The S-Coordinates Rutgers University Model is an ocean circulation model that solves the free surface, hydrostatic, primitive equations over variable topography using stretched terrain-following coordinates in the vertical and orthogonal curvilinear coordinates in the horizontal.
NASA JPL participates in use and development
Yes
WW3
WaveWatch III is a third-generation wave model developed at NOAA/National Centers for Environmental Prediction in the spirit of the WAM (Wave Model). It is a further development of the model WaveWatch I, as developed at Delft University of Technology, and WaveWatch II, developed at NASA’s Goddard Space Flight Center.
NASA GSFC supported development
Yes
NCOM
NCOM is a spatially 3-D time independent numerical physical ocean model based on the primitive equations of motion. Temperature, salinity, and 3-D velocity fields are predicted by the model.
NASA supported via REASoN CAN
In progress
3.3 Potential Future NASA Inputs
Potential future NASA inputs include data products from apparent follow-on missions to MODIS, SeaWinds, and Jason-1. The follow-on missions offer some planned level of data continuity; however,
24
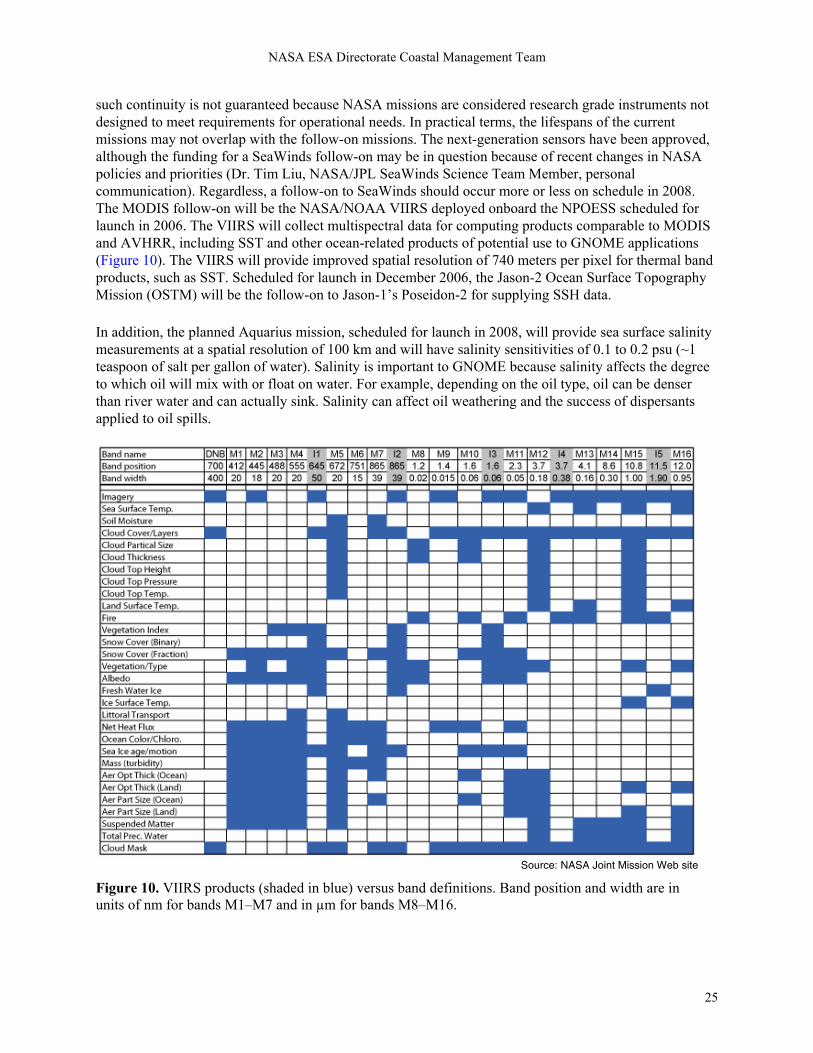
NASA ESA Directorate Coastal Management Team
such continuity is not guaranteed because NASA missions are considered research grade instruments not designed to meet requirements for operational needs. In practical terms, the lifespans of the current missions may not overlap with the follow-on missions. The next-generation sensors have been approved, although the funding for a SeaWinds follow-on may be in question because of recent changes in NASA policies and priorities (Dr. Tim Liu, NASA/JPL SeaWinds Science Team Member, personal communication). Regardless, a follow-on to SeaWinds should occur more or less on schedule in 2008. The MODIS follow-on will be the NASA/NOAA VIIRS deployed onboard the NPOESS scheduled for launch in 2006. The VIIRS will collect multispectral data for computing products comparable to MODIS and AVHRR, including SST and other ocean-related products of potential use to GNOME applications (Figure 10). The VIIRS will provide improved spatial resolution of 740 meters per pixel for thermal band products, such as SST. Scheduled for launch in December 2006, the Jason-2 Ocean Surface Topography Mission (OSTM) will be the follow-on to Jason-1’s Poseidon-2 for supplying SSH data.
In addition, the planned Aquarius mission, scheduled for launch in 2008, will provide sea surface salinity measurements at a spatial resolution of 100 km and will have salinity sensitivities of 0.1 to 0.2 psu (~1 teaspoon of salt per gallon of water). Salinity is important to GNOME because salinity affects the degree to which oil will mix with or float on water. For example, depending on the oil type, oil can be denser than river water and can actually sink. Salinity can affect oil weathering and the success of dispersants applied to oil spills.
Source: NASA Joint Mission Web site
Figure 10. VIIRS products (shaded in blue) versus band definitions. Band position and width are in units of nm for bands M1–M7 and in µm for bands M8–M16.
25
DST Evaluation Report for General NOAA Oil Modeling Environment
Potential future NASA inputs also include new data products from currently operating sensor systems. Additional NASA ESE sensor data products of use to GNOME users may also exist. For example, GRACE measures gravity and can be used to fine-tune altimetry measurements of SSH, although data distribution is currently limited. GRACE is being used to measure sea-level change and may be useful for refining ocean circulation models. A follow-on GRACE mission is planned; however, the details of the mission are still emerging. Other MODIS products, including NRT ocean color data products developed and offered by NOAA for other coastal applications, may also be useful for GNOME applications, especially if they become available on a NRT basis. However, NOAA OR&R HAZMAT has not identified any current requirements for ocean color products in regard to GNOME spill trajectory applications.
4.0 NASA Technology Gaps in Meeting GNOME Requirements
Section 3.0 discussed several NASA remote sensing products and NASA-supported oceanographic models with potential for integration into GNOME. Some of these remote sensing data products and models are of interest to NOAA OR&R HAZMAT for situation-specific use with GNOME. The analysis of NASA capability for satisfying GNOME requirements has resulted in the identification of several technology gaps that, if addressed, would provide products more in line with the requirements of the DST: 1) data continuity, 2) spatial resolution, 3) data delivery and timeliness, and 4) lack of an on-orbit SAR.
NASA missions and sensors are designed to support research rather than operational activities, although relevance to operational needs may nonetheless occur. In many cases the research activities generate the necessity for follow-on missions; however, the follow-on’s launch might not provide data overlap, or worse yet the follow-on mission may fail during launch. Thus, data continuity is not planned with more uncertainty, compared to sensor follow-on for operational missions, such as with the AVHRR missions. It is recognized that NASA is a research and development agency and not an operational agency like NOAA. Consequently, data continuity, although desirable, may not occur as frequently as in deployment of operational remote sensing programs.
The NASA sensors listed in Table 3 that can provide NRT data for SST (MODIS and AMSR-E), wind information (SeaWinds), and SSH (TOPEX/Poseidon) have marginal spatial resolution with respect to GNOME requirements. The data from these sensors in near-shore coastal regions will be particularly suspect because of mixed pixels containing both land and water. The coarse spatial resolution of these sensors may also limit the capability of capturing fine-scale hydrodynamics in near-shore areas. The spatial resolution issue of NASA sensor data is less problematic for offshore areas with more broad-scale ocean circulation patterns. For example, Jason-1 data is 315 km between tracks, and each swath is 6 to 7 km wide. For global and regional products, areas in between tracks are interpolated in a manner comparable to grid interpolation of buoy-based environmental data (e.g., on buoy-based SST measurements). NOAA’s MODIS SST product has 1 km pixels, and the SeaWinds NRT product is parsed on 25 km intervals.
Data and information delivery timeliness is crucial to decision makers and is especially important for GNOME users. GNOME analysts need to give their customers oil spill trajectories within 2 hours of incident notification and deliver subsequent update trajectories every 2 hours until spill containment is achieved. The NASA NRT products mentioned in Table 3 come close to meeting data delivery (latency) requirements for GNOME. NOAA posts NRT MODIS, SeaWinds, and Jason-1 products within 3 hours of data collection. The NASA JPL Web site indicates that NASA delivers SeaWinds NRT data products within 2 hours of collection.
26
NASA ESA Directorate Coastal Management Team
In terms of providing data regarding spill location and extent, the spatial and spectral resolution of NASA remote sensing data pose challenges to spill detection, providing only conditional usability. One significant technology gap in oil spill detection and monitoring is the lack of a spaceborne SAR within NASA’s constellation of sensors. The Committee of Earth Observation Satellites Disaster Management Support Group recently recommended that SAR data be used in an operational support capacity for monitoring offshore waters for oil spills and for tracking known offshore spills. While NASA does not have a sensor to collect this kind of data, certain foreign countries or groups (e.g., Canada, European Space Agency, and Japan) either have the capability or are in the process of deploying the capability. NASA, NOAA and other Federal agencies have a certain amount of tasking allocation for RADARSAT data collection because of NASA’s assistance with the RADARSAT launch. However, RADARSAT-1 has exceeded its originally planned lifespan, and the repeat cycle of such SAR sensors is much greater than desired.
5.0 Conclusions
5.1 Findings
NASA remote sensing data regarding ocean near-surface winds and currents should benefit GNOME DST analyses, although software development may be needed and sensitivity analyses are definitely needed to confirm this conclusion. NASA SeaWinds data on wind direction and speed and Jason-1 altimetry data on sea surface heights constitute the two main data streams, although other data sources have potential and are of interest to NOAA OR&R HAZMAT for preliminary GNOME DST suitability research. NOAA has already developed NRT products that could be used directly by GNOME once the DST is programmed to read HDF and generic binary data formats. NASA data could also be input into ocean circulation models that interface with GNOME.
As proposed, the planned SeaWinds and Jason-1 inputs may fall short of GNOME’s rather stringent temporal requirements for rapid NRT response to oil spill incidents, although once per day coverage delivered within 3 hours could also be useful, depending on the spill scenario, especially in the absence of alternative synoptic remote sensing data sources.
No current NASA projects exist for enabling integration of NASA remote sensing data and modeling output into GNOME. Such support may be needed to enhance GNOME with NASA technology, data, and capabilities. The assimilation of NASA HDF formatted data may be facilitated by public domain software for HDF file reading and conversion. If so, software development of RS data and model integration into GNOME may not be necessary.
Other potential ESE data streams may also enhance GNOME’s capabilities for modeling spill trajectories of active spills, including the following:
• Sea Surface Temperature – NRT cloud-free MODIS and all weather AMSR-E SST products could be useful in assessing ocean currents and locations of offshore spills.
• Multispectral Reflectance Data – Cloud free NRT MODIS products could be useful ancillary data for viewing offshore spills and for assessing context of beached spills.
• Archived Multispectral Reflectance Data – ASTER and Landsat-7 could be useful for viewing the context of predicted spill trajectories in relation to threatened coastal littoral zones.
27
DST Evaluation Report for General NOAA Oil Modeling Environment
Preexisting distribution nodes exist between NASA and NOAA regarding NRT products for MODIS, SeaWinds, and Jason-1 data. This arrangement should facilitate the delivery of timely data products to NOAA OR&R HAZMAT for GNOME applications.
Several NASA-supported ocean circulation models have potential for use with GNOME as indicated in Table 5. NOAA OR&R HAZMAT has expressed particular interest in the models supported by JPL (OGCM, MITgcm, ROMS, and SCRUM). The ability to use several models supports the current practice of running the current model(s) multiple times to obtain several trajectory scenarios. GNOME analysts typically employ comparative analysis of results based in part on use of different circulation models.
NOAA OR&R HAZMAT has practical constraints on how many potential enhancements to GNOME can be considered for any given fiscal year. At present, NOAA OR&R HAZMAT appears to be equally interested in upgrading GNOME’s DST inputs and in considering alternatives to model outputs.
GNOME’s access to oceanographic and meteorological information from NASA-maintained moderately high resolution remote sensing data may be jeopardized if system failures occur before completion of a system’s operational life span. The NASA systems with highest potential for benefiting the DST have little redundant capability, especially over the longer term. In addition, issues exist in terms of maintaining data continuity, especially with the SeaWinds sensor, after completion of the originally planned QuikSCAT mission.
The GNOME DST is currently functioning for a variety of purposes without directly accessing NASA remote sensing data and models, although additional integration of NASA data and models into the DST would give spill trajectory analysts additional tools for deriving quality results. Some integration of NASA remote sensing into the DST may be occurring through ocean and atmospheric models from which the DST can already assimilate output. For instance, GNOME accepts output from the HIRLAM model, which is using QuikSCAT data.
5.2 Recommendations
This evaluation found sufficient reason to warrant recommendation for NASA to aid integration of three NASA data product types into the GNOME DST: 1) sea surface temperature, 2) wind speed and direction, and 3) sea surface height. Regardless of NRT delivery capability, these remote sensing data product types have the highest potential for enhancing the DST. NASA will need to support integration and verification/validation of these products within the GNOME environment in the near term. While these products do not practically satisfy the temporal requirements for an actual oil spill response activity, NOAA is nonetheless interested in increasing their availability of such products for use in GNOME spill response applications because these products complement use of other data and may be their only source of such data, depending on the circumstance. However, the NASA data is better suited to the less time-critical applications of GNOME, such as oil spill response training, disaster risk assessment and mitigation planning, and education (high school and undergraduate). Successful integration will enable GNOME analysts to use these datasets when appropriate during real-time oil spill response scenarios.
HAZMAT has expressed an interest in integrating ocean circulation and hydrodynamic models, especially those with JPL involvement (see Table 5). The additional models will add capability and will complement the models already resident in GNOME. Efforts should also be made to leverage the ACT/NRL REASoN project to enhance GNOME’s capability for using satellite data and ocean model outputs. It would be highly desirable to leverage any NASA remote sensing data integration into GNOME with present and previous NASA efforts for providing NOAA NWS with data for NRT products.
28
NASA ESA Directorate Coastal Management Team
Additional recommended products with good potential for enhancing the GNOME DST include surface radiance, surface reflectance, and rainfall. The radiance and reflectance products provide additional capability for mapping and monitoring the extent of the oil spill and also provide information about the potential impacts to land environments.
NASA and NOAA should collaborate on activities that enable GNOME to ingest NASA data, products, and model outputs directly. The current version of GNOME is unable to ingest NASA remote sensing data or products directly, and a rapid response capability would be an ideal way to provide NASA products to GNOME analysts for use in spill response support. A MODIS-based rapid response product for fires developed by the University of Maryland could serve as a model for this activity. In addition, NASA may be able to leverage the ACT/NRL REASoN project to enable better NRT delivery of NASA oceanographic data products via the Internet.
If NASA supports a GNOME DST enhancement project, it would be necessary to perform systematic engineering studies, including sensitivity and/or feasibility studies, working with pre-existing NASA remote sensing datasets acquired during a significant oil spill incident. In particular, sensitivity analyses could be performed using GNOME with the addition of NASA remote sensing data products and models in regard to recent oil spill incidents where sufficient reference data exists on spill movement and treatment.
Regarding each of the highest potential remote sensing data types, NASA should take the following actions:
• Contact the principal investigators for each product, algorithm, or model; learn more about each one; and seek an up-to-date assessment of availability.
• Review these findings with the GNOME DST owners; further refine the product, algorithm, or model as needed; and determine which of these products, algorithms, or models might be worthy of this round of DST enhancement.
• Work with NASA ESE researchers to accelerate development for any product, algorithm, or model that NOAA identifies as worthwhile for enhancement.
• As the input products still in development become available, cross-validate these products against current GNOME analogs.
5.3 Next Steps
This evaluation report on the potential of NASA assets for enhancing GNOME applications will be used by NASA and NOAA to determine whether future work is warranted and, if so, to determine how such work should be performed. If both agencies agree to partner in improving the DST, the next step would be the V&V of all potential NASA-related enhancements to the GNOME DST, as depicted in Figure 2. Any planned NASA input requires a detailed V&V implementation plan, which should be designed and implemented so that the overall V&V effort is complete and cohesive. NASA and NOAA will initially assign roles and responsibilities for each of the participants in the process and will establish quantifiable metrics.
Figure 11 depicts the DST V&V paradigm as a pyramid with the idea that V&V of a DST must be performed from the ground up. Data and product characterization encompasses everything from intrinsic sensor data to information products generated by employed algorithm(s). The data quality of all fundamental information types must be understood before the models that make predictions based on such
29
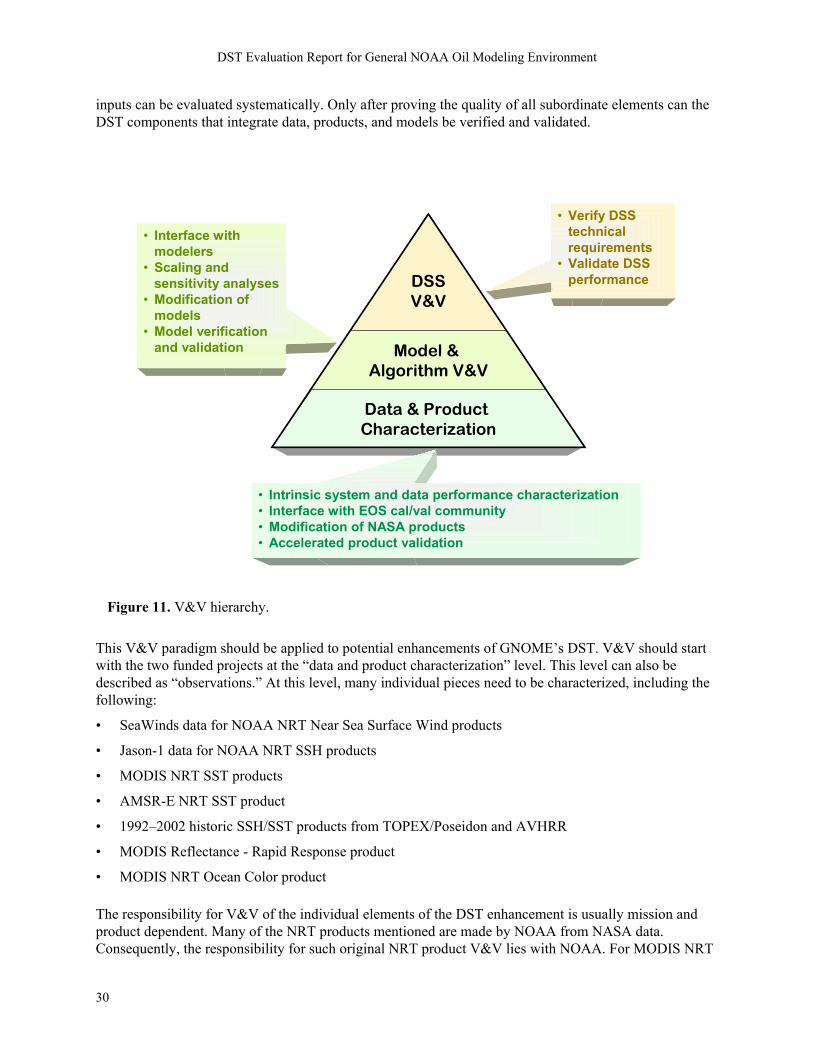
DST Evaluation Report for General NOAA Oil Modeling Environment
inputs can be evaluated systematically. Only after proving the quality of all subordinate elements can the DST components that integrate data, products, and models be verified and validated.
Model & Algorithm V&V
DSSV&V
Data & Product Characterization
• Intrinsic system and data performance characterization• Interface with EOS cal/val community• Modification of NASA products• Accelerated product validation
• Verify DSS technical requirements
• Validate DSS performance
• Interface with modelers
• Scaling and sensitivity analyses
• Modification of models
• Model verification and validation
Figure 11. V&V hierarchy.
This V&V paradigm should be applied to potential enhancements of GNOME’s DST. V&V should start with the two funded projects at the “data and product characterization” level. This level can also be described as “observations.” At this level, many individual pieces need to be characterized, including the following:
• SeaWinds data for NOAA NRT Near Sea Surface Wind products
• Jason-1 data for NOAA NRT SSH products
• MODIS NRT SST products
• AMSR-E NRT SST product
• 1992–2002 historic SSH/SST products from TOPEX/Poseidon and AVHRR
• MODIS Reflectance - Rapid Response product
• MODIS NRT Ocean Color product
The responsibility for V&V of the individual elements of the DST enhancement is usually mission and product dependent. Many of the NRT products mentioned are made by NOAA from NASA data. Consequently, the responsibility for such original NRT product V&V lies with NOAA. For MODIS NRT
30
NASA ESA Directorate Coastal Management Team
products, NOAA downloads the data using its own dish in 120–140 minutes for a 2-hour block of about 6 gigabytes (Haggerty et al., 2001). NOAA then processes the data into NRT products in less than an hour. It takes about 3 hours overall for NOAA to derive products with its MODIS/NRT processing system and to deliver products to the NOAA NWS. Note also, though, that NASA employs ESE data to produce comparable NRT oceanographic data products that are posted on the NASA JPL DAAC.
SSC/ESA has responsibility for coordinating the V&V efforts so that all efforts meet consistent standards and that GNOME may have a single “overseer” regarding the quality of NASA inputs delivered to enhance GNOME, either in terms of remote sensing data, remote sensing data products, or modeling output. Additionally, the ESA Directorate has responsibility for performing or overseeing any additional V&V efforts needed to address GNOME requirements. Because GNOME information needs are time sensitive, one of the key activities will be V&V of latency or delivery time. In addition, if NASA and NOAA agree to evaluate any additional enhancements, SSC/ESA should work these enhancements into the overall V&V plan.
Models and the predictions they generate both fall within the scope of V&V. Whenever possible, a full understanding is needed of model error budgets and of model sensitivity for various parameters. For potential enhancements to GNOME, this V&V level includes the ADCIRC Model and other models and their products/predictions, as decided upon in future discussions between NASA and NOAA OR&R HAZMAT. Such discussions need to take place to determine which models are most desirable for integration into GNOME. In this case, NASA must communicate with model developers to understand the state of model validation and to perform or oversee any additional V&V needed to address GNOME requirements.
The final assessment of an enhanced DST will actually be the benchmarking process that follows V&V stages, but as sub-components are added or upgraded, they may be assessed pre-benchmarking to determine if they contribute properly to the overall system. New systems elements will be added in the potential enhancement of GNOME, pending additional discussions between NASA and NOAA. For example, any implemented information delivery systems must be assessed in terms of speed, throughput, reliability, etc.
Finally, SSC/ESA needs to work with GNOME to identify, articulate, and summarize all of the requirements related to this potential DST enhancement. Using its systems engineering capabilities, SSC/ESA needs to validate the requirements to ensure that they match GNOME user needs and enable GNOME mission success.
Cross-cutting Solutions: Some of the NASA remote sensing data and modeling solutions that may arise from a GNOME enhancement project have relevance to DST enhancement efforts of other National Applications. For example, Disaster Management National Application activity includes efforts to enhance HAZUS-MH for hurricane damage risk assessment. This project includes integration of the WaveWatch III model to help assess hurricane damage risk from storm surge and tides. Integration of WaveWatch III into GNOME would likely be of further benefit to this DST.
In addition to the direct societal benefits to Coastal Management and Disaster Preparedness achieved through enhancements to GNOME, the software development for integrating NRT MODIS products into GNOME could be useful for Homeland Security of coastal communities because the same mechanisms that reveal oil spill trajectories and fate could also show patterns stemming from coastal oil and chemical spills due to terrorist activities.
31
DST Evaluation Report for General NOAA Oil Modeling Environment
6.0 References
Askne, J., Editor, 2003, Oil Spill Detection, In: Remote Sensing Using Microwaves, Chapter F (Applications), Section 4 (Oil Spill Detection), Chalmers University, Department of Radio and Space Science, Goteburg, Sweden, pp. F.36-F.46.
Bahill, A.T., and B. Gissing, 1998, Re-evaluating systems engineering concepts using systems thinking. IEEE Transactions on Systems, Man and Cybernetics, Part C: Applications and Reviews, 28(4):516–527.
Banks, S., 2003, SeaWiFS satellite monitoring of oil spill impact on primary production in the Galapagos Marine Reserve, Marine Pollution Bulletin, July 2003, vol. 47, no. 7, pp. 325-330(6).
Barker, C.H., and M. K. Hodges, 2003, Optimizing Matching Criteria For Start Time Analysis Of Real-Time “SPOT” Forecasts And Climatology For Long Range Oil Spill Trajectory Research, Fifth Conference on Coastal Atmospheric and Oceanic Prediction and Processes, Seattle, WA, Downloadable at: http://ams.confex.com/ams/32BC31R5C/techprogram/paper_64786.htm
Beal, R.C., 2000, High Resolution Wind Fields from Synthetic Aperture Radar (SAR) Imagery, In: Prince William Sound Meteorological Workshop Proceedings, pp. D-25 to D-27,
Beegle-Krause, C.J., 2001, General NOAA Modeling Environment (GNOME): A New Spill Trajectory Model, Proceedings, 2001 International Oil Spill Conference (IOSC): Global Strategies for Prevention, Preparedness, Response, and Restoration, Volume 2., Washington, DC: American Petroleum Institute, National Ocean Service, Office of Response and Restoration, 2001., March 26-29, 2001, Tampa Bay, Florida.
Beegle-Krause, C.J., 2003, Advantages of Separating the Circulation Model and Trajectory Model: GNOME Trajectory Model Used with Outside Circulation Models, In: Proceedings of 26th Artic and Marine Oil Spill Program Technical Seminar, May 10-12, 2003. Victoria, British Columbia.
Beegle-Krause, C.J., J. Callahan, and C. O’Connor, 2003, NOAA Model Extended to Use Nowcast/Forecast Currents, In Proceedings of 2004 International Oil Spill Conference, April 6-10, 2003, Vancouver, British Columbia.
Biegert, E.K., Baker, R.N., Berry, J.L., Mott, S. and Scantland, S., 1997, A Gulf Offshore Satellite Applications Project Detects Oil Slicks Using RadarSat, In Proceedings of International Symposium: Geomatics in the Era of Radarsat, Ottawa, Canada.
Clamente-Colon, P., W.G. Pichel, D. Lamb, M. Von Woert, F. M. Monaldo, D. R. Thompson, and C. C. Wackerman, 2003, Operational use of SAR-Derived Ocean Products: Are We There Yet, Proceedings of the 2003 EUMETSAT Meteorological Satellite Conference, Weimar, Germany.
Cross, A., 1992, Monitoring Marine Oil Pollution Using AVHRR Data: Observations off the Coast of Kuwait and Saudi Arabia during January 1991, International Journal of Remote Sensing, Vol. 13, pp. 781-788.
32
NASA ESA Directorate Coastal Management Team
Engelhart, F.R., 1999, Remote Sensing for Oil Spill Detection Response, Pure Appl. Chem. 71 (1):103-111.
Fuentes, E.M. 2003, Modelación De Trayectorias De Los Derrames De Hidrocarburos Frente A Las Costas De Rosarito, B.C., México, Master’s Thesis, Universidad Autónoma De Baja California Facultad De Ciencias Marinas, Completed August 2003, Downloadable at: http://rcmarinas.ens.uabc.mx/~pagina/tesis/tesis-licenciatura/L002.pdf
Fingus, M., and C.E. Brown, 2000, Review of Oil Spill Remote Sensing, Proceedings of SpillCon 2000, August 15-17, 2000, Brisbane, Australia, Downloadable at http://www.aip.com.au/amosc/papers/fingas_m.doc.
Galt, J.A. 1980. A finite-element solution procedure for the interpolation of current data in complex regions. Journal of Physical Oceanography 10:1984-1997
Galt, J.A., D.L. Payton, H. Norris, and C. Friel, 1996, Digital Distribution Standard for NOAA Trajectory Analysis Information, NOAA ORR HAZMAT Report 96-4, January, 1996, Downloadable at: http://response.restoration.noaa.gov/oilaids/ta_stand.pdf
Galt, J.A. 1998. Uncertainty Analysis Related to Oil Spill Modeling. Spill Science & Technology, 4(4):231-238.
Goodman, Ron. 1990. Remote sensing – What do you really need? In: Proceedings of the 13th Artic and Marine Oilspill Program Technical Seminar, June 6-8, 1990, Edmonton, Alberta. Downloadable from: http://www.mms.gov/tarprojects/157.htm.
Haggerty, P., K. Sprietzer, G. Legg, and R. Luczak, 2001, The MODIS/Near-Real Time System, In Proceedings of the American Meteorological Society Conference 2001, 5pp., Downloadable at: http://www.osdpd.noaa.gov.
Henry, C.B., 2001, NOAA Oil Modeling Initiatives: Tools for Oil Spill Response and Planning, In: Proceedings: Nineteenth Annual Gulf of Mexico Information Transfer Meeting, November 30 – December 2, 1999, OCS Study MMS 2001-081, pp. 427-433.
Hodges, M., 2003, Long-Range Oil Spill Trajectory Research To Determine The Optimal Mix Of Realtime Forecasts And Climatology For Various Temporal And Spatial Scales, 12th Conference on Interactions of the Sea and Atmosphere (12ISA), Poster-paper, 12 pp., Downloadable at: http://ams.confex.com/ams/pdfpapers/56095.pdf.
Hu, C., F.E. Muller-Karger, C. Taylor, D. Myhre, Brock Murch, A.L. Odriozola, and G. Godoy, 2003, MODIS Detects Oil Spills in Lake Maracaibo, Venezuela, EOS, Vol. 84, No. 33, August 19th, 2003, pages 313, 319.
International Marine Organization, 2000, Catalogue of Computer Programs and Internet Information Related to Responding to Oil Spills, 57 pp, Downloadable at: http://www.imo.org/includes/blastDataOnly.asp/data_id%3D1752/367.pdf
33
DST Evaluation Report for General NOAA Oil Modeling Environment
ICCOPR, 1997, Oil Pollution Research and Technology Plan, Interagency Coordinating Committee on Oil Pollution Research, 83 pp., Downloadable at: http://ntl.bts.gov/data/coop.pdf
Kendall, A.W., and S.J. Picquelle, 2003, Marine Protected Areas and the Early Life History of Fishes, NOAA Alaska Fisheries Center, National Marine Fisheries Service, AFSC Processed Report 2003-10, 36 pp., Downloadable at: http://www.afsc.noaa.gov/Publications/ProcRpt/PR%202003-10.pdf.
MMS, 2001, Delineation Drilling Activities in Federal Waters Offshore, Santa Barbara County, California, Draft Environmental Impact Statement, OCS EIS/EA MMS 2001-046, Downloadable at: http://www.mms.gov/itd/pubs/2001/2001-046/TableofContents.pdf and http://www.mms.gov/omm/pacific/enviro/EIS/pdfs/.
Monaldo, F., 2000, The Alaska SAR Demonstration and Near-Real-Time Synthetic Aperture Radar Winds, John Hopkins APL Technical Digest, 21(1):75-79, Downloadable at: http://orbit-net.nesdis.noaa.gov/orad/sar/paper_apl_monaldo.pdf.
NOAA, 1996a, Aerial observations of oil at sea, HAZMAT Report 96-7, Seattle: Hazardous Materials Response and Assessment Division, National Oceanic and Atmospheric Administration.15 pp.
NOAA, 2000, GNOME User’s Manual, NOAA ORR HAZMAT Response Division, June 2000, 82 pp.
NOAA 2002a, GNOME User’s Manual, NOAA ORR HAZMAT Response Division, 91 pp. Downloadable at: http://response.restoration.noaa.gov/software/gnome/pdfs/GNOME_Manual.pdf
NOAA, 2002b, HAZMAT Modeling Products for Spill and Response Planning, NOAA ORR HAZMAT Response Division, 46 pp, Downloadable at: http://response.restoration.noaa.gov/oilaids/pdfs/products.pdf.
NOAA, 2002c, Trajectory Analysis Handbook, NOAA ORR HAZMAT Response Division, January 2002, 42 pp, Downloadable at: http://response.restoration.noaa.gov/oilaids/trajanal/pdfs/trajanalysis.pdf
Parris, T., 2002, Tools for Environmental Emergency Response, Environment, October, 2002, Downloadable at: http://www.findarticles.com/cf_dls/m1076/8_44/92378046/p1/article.jhtml.
UNESCO, 2003, The Integrated, Strategic Design Plan for the Coastal Ocean Observations Module of the Global Ocean Observing System, GOOS Report No. 125; IOC Information Documents Series N°1183, 191 pp, downloadable at: http://ioc.unesco.org/goos/docs/doclist.htm.
USCG, 1999, Ten Years Later...Oil Spill Prevention and Response in the United States, Proceedings of Marine Safety Council, Volume 56, Number 1, 18pp. Downloadable at: http://www.uscg.mil/hq/g-m/nmc/pubs/proceed/insert99.pdf.
USCG, 2004, Hazardous Materials Response Special Teams Capabilities and Contact Handbook, USCG, January 2004, 191 pp, downloadable at: http://www.uscg.mil/hq/g-m/HAZMAT%20Response%20Special%20Teams%20Handbook.pdf
34
NASA ESA Directorate Coastal Management Team
Washington Department of Ecology, 2003, Puget Sound Trajectory Analysis Planner (TAP) Technical Documentation. Spill Prevention, Preparedness, and Response Program, Publication 03-08-007, July 2003, 32 pp. http://www.ecy.wa.gov/pubs/0308007.pdf (accessed March 30, 2004).
Wojtaszek, K., 2003, Application of transport model for building contingency maps of oil spills on the North Sea, M.S. Thesis, Delft University of Technology, 71 pp., Downloadable at: http://ssor.twi.tudelft.nl/~risk/files/Katarzyna_Wojtaszek_thesis.pdf.
35
NASA ESA Directorate Coastal Management Team
Appendix A. Glossary
Beaching – Oil coming ashore.
Biodegradation – Breakdown of oil by microbes into smaller compounds, eventually to water and carbon dioxide.
Benchmark – A standard by which a product can be measured or judged (i.e., How did the decision support system that assimilated NASA measurements compare in its operation, function, and performance to the earlier version?). The benchmarking process is required to support adoption of innovative solutions into operational environments that affect life and property.
Convergence - Areas where surface waters “come together.” They are natural collection areas for oil, especially tarballs.
Diffusion – Large-scale turbulence that mixes spilled oil.
Dispersion – Breakup of oil into small droplets that are mixed into the water by sea energy. If the droplets are small enough, they remain in the water column.
Decision Support Tool (DST) – Computer-based information-processing and analysis software used for scenario modeling and decision-making support. A DST uses a knowledge base of information with a problem-solving strategy that may routinely assimilate measurements and/or model predictions in support of the decision making process. The DST typically provides a graphical user interface (GUI) to facilitate human inputs and to convey outputs. Outputs from a DST would typically be used for aiding decision making at the given government level (e.g., local). Outputs from multiple DSTs may be used in developing and establishing policy.
DST Evaluation Process – The process of identifying and assessing DSTs developed by Federal agencies and other partners that are a priority to citizens of our Nation, that can be enhanced by NASA ESE results, and that develop the specifications for how a candidate DST can be augmented by assimilating NASA ESE observations and predictions.
Dissolution – Mixing of the water-soluble components of oil into the water.
Diurnal Tide – Coastal areas with one high tide and one low tide each day.
Emulsification – Small water droplets or water mixed into the liquid oil, thickening it to a “chocolate mousse” consistency. Water content often reaches 50–80%.
Evaporation – Conversion of liquid to a gaseous phase.
Flotsam – Garbage, or detritus, on the water surface.
Flushing – Turnover of water from an estuary or harbor.
A-1
DST Evaluation Report for General NOAA Oil Modeling Environment
Forecast Trajectory – A trajectory that assumes that all of the information that is input into the model (winds, currents, tides, etc.) is exactly correct. Also known as the “best guess” trajectory because it represents our best guess of where the spilled oil will go.
Freshwater-Saltwater Interface – Type of convergence formed when river water flows into the sea and spreads out over the seawater. Like tidal convergences, this interface is a natural collection area for oil.
GIS Output Mode – A GNOME mode in which you can export model output in geographic information system (GIS) compatible format. GIS Output Mode is primarily used for spatial or GIS analysis. Use of this mode requires training from NOAA HAZMAT.
GNOME Analyst – A NOAA application, formerly known as TAT, that converts “best guess” splot number and position data into oil density contours and converts “minimum regret” splot location data into an uncertainty bounding contour.
GNOME Splot File (for GNOME Analyst) – An output file format available in GIS Output and Diagnostic modes that provides a single time snapshot of the spill model for GNOME Analyst.
GNOME Splot File Series (for GNOME Analyst) – An output file format available in GIS Output and Diagnostic modes that produces hourly files throughout the animation of the spill model for GNOME Analyst.
Hindcast – In spill modeling, a model run for some time in the future is called a forecast, predicting future fate and trajectory of the spill. When you know the actual spill situation and want to create model conditions to represent that situation for a time in the past, you are creating a hindcast. Modelers use hindcasts to test how changes to the model conditions affect the results. HAZMAT modelers use hindcasts to test their simulation of the most recent events, with the goal of making their next forecast more accurate.
Line Source – In GNOME, a line source simulates a spill from a vessel that is leaking as it is drifting, or an observation of a slick from an unknown source.
Location File – Files containing generalized information about the tides, currents, and shorelines of a given region. GNOME uses this information and the information that you provide to set up the trajectory model.
Longshore Currents – Currents produced by waves obliquely approaching gently sloping beaches.
Mass Balance – The fate of different portions of a spill due to the trajectory, the pollutant type, and the weathering that the pollutant has undergone.
Minimum Regret Trajectory – A trajectory that incorporates uncertainties in the model. It shows areas of the map that could be affected if, for example, the wind blows from a somewhat different direction than you have specified, or if the currents in the area flow somewhat faster or slower than expected. It represents other possibilities of where the spill might go.
Mixed, Semi-Diurnal Tide – Two tidal cycles where the high water/low water sequences occur twice a day at different levels.
A-2
NASA ESA Directorate Coastal Management Team
Modeling – Ability to develop mathematical models used to predict the effects of a hazardous material release, including tabular and graphical summaries of the rate of release, simulated model results, and emissions and meteorological inputs and predictions.
Model Modes – Levels in which GNOME can be run. GNOME was designed with three model modes: Standard Mode, GIS Output Mode, and Diagnostic Mode. Standard and GIS Output Modes must use Location Files to run. Diagnostic Mode can use Location Files or user files. GIS Output Mode and Diagnostic Mode require training from NOAA HAZMAT.
Model Settings – User-specified parameters (i.e., details) used to produce model output, or a “spill movie.” You need to enter the Start Date and Start Time for your spill movie to begin and a Run Duration for the movie. You can also indicate whether you would like the model to compensate for uncertainty in the input data.
Monitoring – Ability to detect the presence of and regularly scrutinize levels of known or unknown liquids, solids, gases, or vapors. This can include the use of advanced detection equipment to provide standard confined space and accumulative readings to identify and establish the exclusion zones after contamination spread.
MOSS – Map Overlay Statistical System: a public domain GIS package and format used in GNOME.
Movement and Fate –The direction in which the spill moves, and the physical/chemical changes that occur to the oil over time.
Neap Tide – The opposite of spring tides; the tidal range between high and low water is smallest and occurs near the first and last lunar quarters.
NOAA Standard Splot Files (for GIS) – An output file format available in GIS Output and Diagnostic modes that produces a single view of the spill that can be viewed in ArcView, using the ArcView extension.
NOAA Standard Splot File Series (for GIS) – An output file format available in GIS Output and Diagnostic modes that produces hourly files throughout the animation of the spill model. These files can be viewed in ArcView, using the ArcView extension.
"No-Notice" Drill – A response drill in which no advance notice is given to the responding parties (government, industry, and/or contractors) to exercise and test spill preparations and readiness.
Non-Weathering Pollutant – A pollutant type that does not change chemically or physically over time in the marine environment.
Observational Data – On-scene measurements (winds, currents, and oil location).
Overflight – An airplane or helicopter flight over a spill area to determine the location and extent of the spill. Overflights are critical for making good forecasts.
A-3
DST Evaluation Report for General NOAA Oil Modeling Environment
Overflight Assessment – Ability to evaluate an affected area, which could include a geographical survey of the site and possible monitoring with advanced detection instruments, via means of aviation.
Photo-Oxidation – Changes made by sunlight to a spilled oil’s physical and chemical properties.
Point/Line Source Splots – A type of spill that can be modeled in GNOME to represent a point or line source. See Point Source and Line Source.
Point Source – In GNOME, a point source represents either an instantaneous spill (catastrophic release) or an oil release that occurs over time at a particular location (e.g., a stationary vessel or pipeline leak).
Pollutant Age – The number of hours that the pollutant has been in the water. When you are using GNOME's overflight tools, the pollutant age is the time of the overflight minus the time of the spill.
Pollutant Types – The oil and oil products for which GNOME can calculate weathering information.
Progressive Wave – Energy is transmitted through the water, but water particles move in an oscillatory manner.
QuickTime Movie (.mov) – A “movie” animation of a modeled spill, produced hourly, that will run as a stand-alone file viewable with the QuickTime player.
Refloating – Oil that has come ashore and re-floated off the shoreline.
Reinitialize – To reset or restart GNOME with different initial conditions.
Reinitialized Trajectory – A trajectory that incorporates the observations made during an overflight of the spill area. Spill particles are sprayed on the map to represent the last observed location and extent of the spill.
Remote Sensing Data Resolution – Parameters of remote sensing data collection and delivery in regards to spatial, spectral, radiometric, signal, temporal, and other characteristics of data quality.
Run Duration – The amount of time that you would like the model, or “spill movie,” to run. The minimum time for a run duration is 1 hour; the maximum time is 3 days.
Scenario – A description of where, how, how much, and what type of oil has spilled, and the current environmental conditions.
Sedimentation – Adhesion of oil to solid particles in the water column.
Semi-Diurnal Tide – Two tidal cycles where the high waterflow water sequences occur twice a day at the same level.
Splots – Tiny, representative pieces of spilled oil in a GNOME spill trajectory. They appear as small “pollutant particles” on the map when you run your spill; however, different types of splots are represented in different ways. In any trajectory that includes a "minimum regret" solution, black splots
A-4
NASA ESA Directorate Coastal Management Team
represent GNOME’s best guess of where spilled oil will go. (For all black splots, wind and model data are assumed to be correct.) Red splots represent the "minimum regret" area for the same spill. When splots beach, they change to tiny x’s on land regions of the map. Beached “best guess” splots are shown as black x’s; beached “minimum regret” splots are shown as red x’s. In a trajectory that has been sprayed with GNOME's Spray Can tool, blue splots represent the area where oil has been observed in an overflight of the spill.
Sprayed Splots – A type of spill that can be modeled in GNOME to represent the observations made during an overflight of the spill area. Tiny pollutant particles (splots) are added to the spill scenario with the GNOME Spray Can tool. These particles appear blue on the map until the trajectory is run.
Spring Tide – The very highest and the very lowest tide, which occur twice a month when the moon is either new or full.
Standard Mode – The most automated mode of GNOME. In Standard Mode, a Location File loads information into GNOME, then GNOME prompts you for information it needs to run your model. In this mode, you can print a picture or create a "movie" of your trajectory. Standard Mode is not flexible enough to be used for spill response; however, it is an excellent tool for simulating spills and for building intuition regarding oil spill trajectories at specific locations.
Standing Wave – As a tidal wave reaches the end of a bay or estuary, the wave is reflected back toward the entrance.
Surface Tension – Tendency for molecules to stick together and present the smallest surface to the air.
Tarballs – Weathered oil that has formed a pliable ball. Size may vary from pinhead to 30 cm.
TAT – A NOAA application, now known as GNOME Analyst, that converts “best guess” splot number and position data into oil density contours and converts “minimum regret” splot location data into an uncertainty bounding contour.
Tidal Excursion – Degree of influence of the tides on movement of the oil.
Turbulent Mixing – Random bulk movements of water, caused by high winds and currents, that tear oil slicks into smaller patches that are distributed over a wider area.
Trajectory – The direction and pattern of movement of spilled oil over time.
Uncertainty – Our knowledge that observations and forecasts are not perfect. GNOME always produces a "best guess” trajectory but will also include the possibility of inaccuracies in a "minimum regret" trajectory if you request it in your Model Settings. Refers to “confidence limits,” or the degree to which the spill forecast may be relied upon to be accurate.
Uncertainty Trajectory - A trajectory that incorporates uncertainties in the model. It shows areas of the map that could be impacted if, for example, the wind blows from a somewhat different direction than you have specified, or if the currents in the area flow somewhat faster or slower than expected. It represents other possibilities of where the spill might go.
A-5
DST Evaluation Report for General NOAA Oil Modeling Environment
Unified Command – Representatives of the party responsible for an oil spill, and the State and Federal governments that are in charge of the spill response.
Variable Wind – Wind that is changing speed and direction frequently.
Verification and Validation (V&V) – Processes used in remote sensing data quality assurance assessments. Verification refers to a life cycle process to ensure that the products being developed meet the stated specifications (functional, performance, and design). Validation refers to a process to ensure that the completed products (e.g., software, algorithm(s), and model(s)) effectively serve the functional requirements.
Viscosity – A measure of fluid’s resistance to flow.
Weathering – Physical and chemical changes that a pollutant undergoes while it is exposed to the environment. In the marine environment, a pollutant can change in its density, viscosity (resistance to flow), rate of evaporation, and dispersion into the water column, and the rate at which an oil-in-water mixture may form. For oil spills, weathering refers to changes in physical and chemical characteristics of spilled oil due to evaporation, dissolution, oxidation, sedimentation, and biodegradation. The weathering behaviors of different pollutants are critical to predicting their trajectories. GNOME uses a simple weathering model; NOAA HAZMAT's oil weathering program, ADIOS2, provides more detailed estimates of the expected characteristics and behavior of oil spilled into the marine environment.
Wind Data File – An output file format available in GIS Output and Diagnostic modes that saves wind records as a text file for use in NOAA HAZMAT's oil weathering program, ADIOS2.
Wind Direction –The direction from which the wind is blowing.
A-6
NASA ESA Directorate Coastal Management Team
Appendix B. Acronyms
ACT Applied Coherent Technology, Inc.
ADIOS2 Automated Data Inquiry for Oil Spills Version 2
ADCIRC Advanced Circulation Model
AMSR-E Advanced Microwave Scanning Radiometer for the EOS
ASTER Advanced Spaceborne Thermal Emission and Reflectance Radiometer
AVHRR Advanced Very High Resolution Radiometer
CATS NOAA’s Current Analysis for Trajectories software
DAAC Distributed Active Archive Center
DSS Decision Support System
DST Decision Support Tool
ECCO Estimating the Circulation and Climate of the Ocean
EOS Earth Observing System
EPA Environmental Protection Agency
ERS European Remote Sensing Satellite
ESA Earth Science Applications Directorate
ESE Earth Science Enterprise
ETM+ Enhanced Thematic Mapper Plus
FEMA Federal Emergency Management Agency
GIS Geographic Information System
GNOME General NOAA Oil Modeling Environment
GRACE Gravity Recovery and Climate Experiment
GSFC Goddard Space Flight Center
B-1
DST Evaluation Report for General NOAA Oil Modeling Environment
HAZMAT Hazardous Materials Response Division of NOAA Office of Response and Restoration (OR&R)
HAZUS-MH Hazards U.S. – Multi-Hazard
HDF Hierarchical Data File
HIRLAM High Resolution Limited Area Model
ICCOPR Interagency Coordinating Committee on Oil Pollution Research
JPL Jet Propulsion Laboratory
LAS Live Access Server
LRC Langley Research Center
MISR Multi-angle Imaging Spectroradiometer
MITgcm Massachusetts Institute of Technology General Circulation Model
MODIS Moderate Resolution Imaging Spectroradiometer
MOSS Map Overlay Statistical System, a public domain GIS package
MMS Mineral Management Service
NCCOS National Centers for Coastal Ocean Science
NCOM Naval Coastal Ocean Model
netCDF network Common Data File
NOAA National Oceanic and Atmospheric Administration
NPOESS National Polar-Orbiting Operational Environmental Satellite System
NPP NPOESS Preparatory Project
NRL Naval Research Laboratory
NRT Near Real Time
NWS National Weather Service
OGCM Ocean General Circulation Model
B-2
NASA ESA Directorate Coastal Management Team
OPA Oil Pollution Act of 1990
OR&R NOAA Office of Response and Restoration
OSSM On-Scene Spill Model developed and used by NOAA
OSTM Ocean Surface Topography Mission
QuikSCAT Quick Scatterometer
REASoN CAN Research, Education and Applications Solutions Network Cooperative Agreement Notice
ROMS Regional Ocean Modeling System
SAR Synthetic Aperture Radar
SCRUM S-Coordinates Rutgers University Model
SeaWiFS Sea-viewing Wide Field-of-view Sensor
SSC Stennis Space Center
SSH Sea Surface Height
SST Sea Surface Temperature
TAP Trajectory Analysis Planner
TMI TRMM Microwave Imager
TRMM Tropical Rainfall Measuring Mission
USACE U.S. Army Corps of Engineers
USCG U.S. Coast Guard
USGS U.S. Geological Survey
UV Ultraviolet
V&V Verification & Validation
VIIRS Visible/Infrared Imager/Radiometer Suite
WAM Wave Model
B-3
DST Evaluation Report for General NOAA Oil Modeling Environment
WWW3 WaveWatch III
B-4
NASA ESA Directorate Coastal Management Team
Appendix C. System Engineering Approach
The NASA Decision Support System (DSS) or Decision Support Tool (DST) evaluation process is part of the systems engineering approach outlined in Figure 2, which is designed to integrate NASA measurements and predictions effectively within a DST. The approach entails evaluation, verification and validation (V&V), and benchmarking of the DST.
The evaluation phase of the systems engineering approach involves understanding the baseline operations of the DST and defining the requirements for, and technical feasibility of, Earth science and remote sensing tools and methods for addressing DST needs. The V&V phase of the systems engineering approach includes measuring the performance characteristics of data, information, technologies, and/or methods, and assessing the ability of these tools to meet the requirements of the DST. Benchmarking of a DST is the process of measuring the performance of the DST according to specified standards and reference points to document its value and to identify areas for improvement. Assessing the performance of an original DST without enhancements (Evaluation Phase) creates the baseline, and then performance of the enhanced DST is assessed and compared with the baseline. The steps of the system’s engineering approach need not be strictly linear and sequential (refer to Figure 11).
C-1
NASA ESA Directorate Coastal Management Team
D-1
Appendix D. Remote Sensing of Oil Spills
A great deal of literature is now available regarding efforts to use remote sensing for oil spill monitoring, both operationally and for research (e.g., Fingus and Brown, 2000; Engelhart, 1999; NOAA, 1996a; and Goodman, 1990). On major spills, NOAA deploys aircraft and personnel to remotely sense and map the location and conditions of oil spills (NOAA, 1996a). NOAA also employs buoys and drifter devices equipped with probes to collect environmental information in coastal waters pertaining to the spill.
Aircraft remote sensing technologies include use of side looking airborne radar (SLAR), oblique visible aerial photography and video cameras, and thermal and ultraviolet (UV) imagery. Aerial photography and video cameras are used, often with filters, usually from an oblique angle of around 53º (Fingus and Brown, 2000). As an all-weather and day/night technique, SLAR imagery can be useful for detecting slicks, although the wind speed needs to be within a certain range for SLAR to be most effective. Under certain conditions, thermal remote sensing can be used to detect oil spills, apparently because of the lowered temperature of oil-covered water. Successful detection apparently depends in part on the type of oil and spatial resolution of the thermal data. UV remote sensing can also help. However, both thermal and UV imagery of oil spill areas show false positives. Other, more experimental sensors are being developed and tested for oil spill monitoring, including hyperspectral and LIDAR fluorescence. The latter has potential for measuring oil spill thickness as well. Airborne remote sensing, though more timely, can also be very expensive to conduct. Practically all of these methods can produce false positive detections and therefore are employed with caution and are validated against other oceanographic data collected in situ.
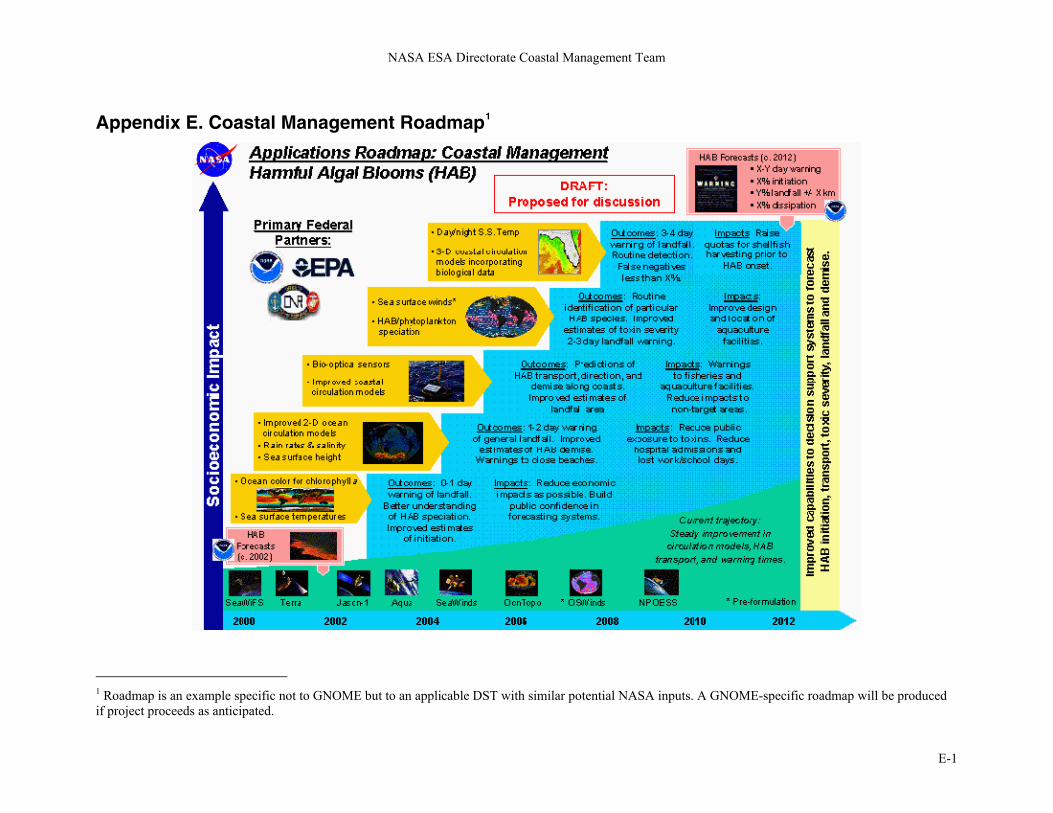
NASA ESA Directorate Coastal Management Team
E-1
1 Roadmap is an example specific not to GNOME but to an applicable DST with similar potential NASA inputs. A GNOME-specific roadmap will be produced if project proceeds as anticipated.
Appendix E. Coastal Management Roadmap1
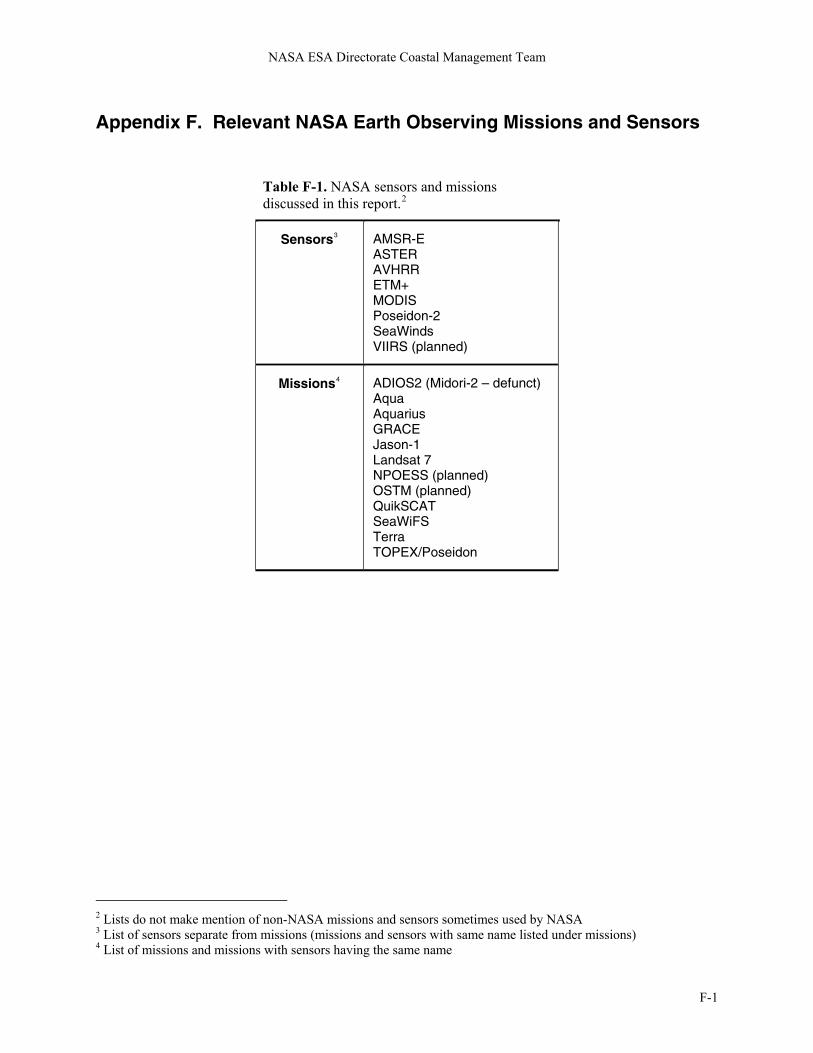
NASA ESA Directorate Coastal Management Team
Appendix F. Relevant NASA Earth Observing Missions and Sensors
Table F-1. NASA sensors and missions discussed in this report.2
Sensors3 AMSR-E ASTER AVHRR ETM+ MODIS Poseidon-2 SeaWinds VIIRS (planned)
Missions4 ADIOS2 (Midori-2 – defunct) Aqua Aquarius GRACE Jason-1 Landsat 7 NPOESS (planned) OSTM (planned) QuikSCAT SeaWiFS Terra TOPEX/Poseidon
2 Lists do not make mention of non-NASA missions and sensors sometimes used by NASA 3 List of sensors separate from missions (missions and sensors with same name listed under missions) 4 List of missions and missions with sensors having the same name
F-1
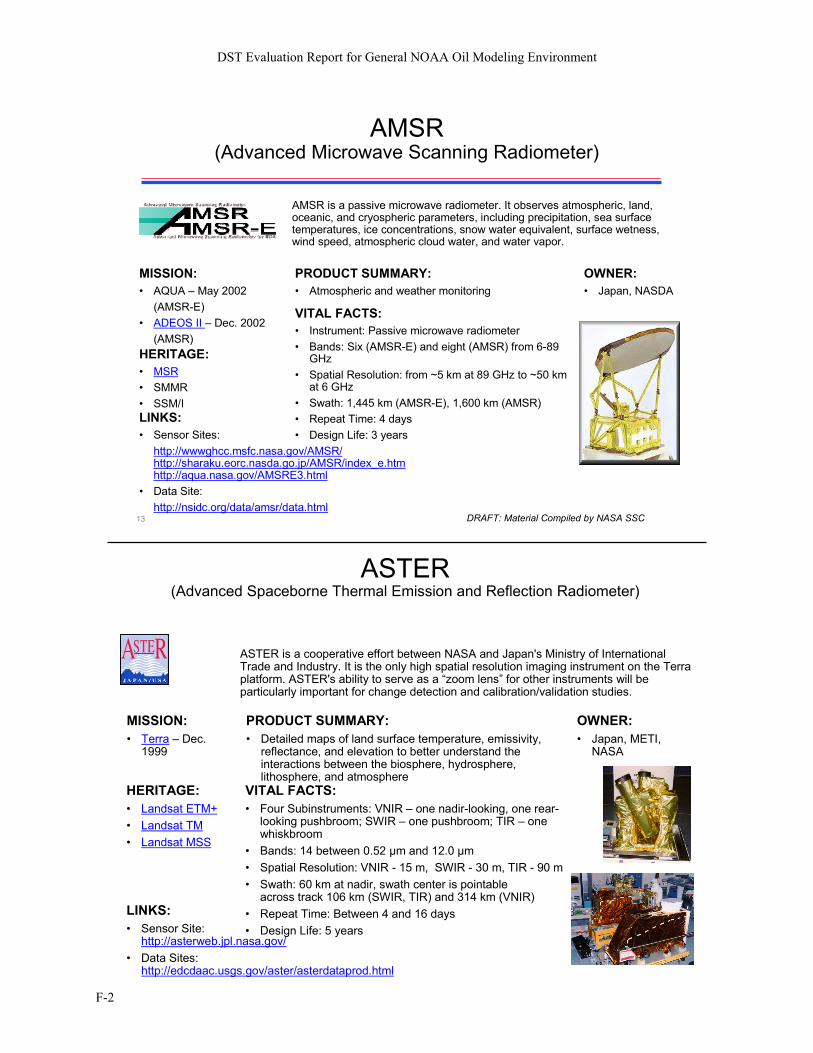
DST Evaluation Report for General NOAA Oil Modeling Environment
F-2
VITAL FACTS:• Instrument: Passive microwave radiometer• Bands: Six (AMSR-E) and eight (AMSR) from 6-89
GHz• Spatial Resolution: from ~5 km at 89 GHz to ~50 km
at 6 GHz• Swath: 1,445 km (AMSR-E), 1,600 km (AMSR)• Repeat Time: 4 days• Design Life: 3 years
MISSION:• AQUA – May 2002
(AMSR-E)• ADEOS II – Dec. 2002
(AMSR)
AMSR is a passive microwave radiometer. It observes atmospheric, land, oceanic, and cryospheric parameters, including precipitation, sea surface temperatures, ice concentrations, snow water equivalent, surface wetness, wind speed, atmospheric cloud water, and water vapor.
LINKS:• Sensor Sites:
http://wwwghcc.msfc.nasa.gov/AMSR/
OWNER:• Japan, NASDA
AMSR(Advanced Microwave Scanning Radiometer)
HERITAGE:• MSR• SMMR• SSM/I
http://sharaku.eorc.nasda.go.jp/AMSR/index_e.htmhttp://aqua.nasa.gov/AMSRE3.html
13 DRAFT: Material Compiled by NASA SSC
• Data Site:http://nsidc.org/data/amsr/data.html
PRODUCT SUMMARY:• Atmospheric and weather monitoring
ASTER(Advanced Spaceborne Thermal Emission and Reflection Radiometer)
VITAL FACTS:• Four Subinstruments: VNIR – one nadir-looking, one rear-
looking pushbroom; SWIR – one pushbroom; TIR – one whiskbroom
• Bands: 14 between 0.52 µm and 12.0 µm• Spatial Resolution: VNIR - 15 m, SWIR - 30 m, TIR - 90 m• Swath: 60 km at nadir, swath center is pointable
across track 106 km (SWIR, TIR) and 314 km (VNIR) • Repeat Time: Between 4 and 16 days• Design Life: 5 years
MISSION:• Terra – Dec.
1999
ASTER is a cooperative effort between NASA and Japan's Ministry of International Trade and Industry. It is the only high spatial resolution imaging instrument on the Terra platform. ASTER's ability to serve as a “zoom lens” for other instruments will be particularly important for change detection and calibration/validation studies.
LINKS:• Sensor Site:
http://asterweb.jpl.nasa.gov/• Data Sites:
http://edcdaac.usgs.gov/aster/asterdataprod.html
HERITAGE:• Landsat ETM+• Landsat TM• Landsat MSS
OWNER:• Japan, METI,
NASA
PRODUCT SUMMARY:• Detailed maps of land surface temperature, emissivity,
reflectance, and elevation to better understand the interactions between the biosphere, hydrosphere, lithosphere, and atmosphere
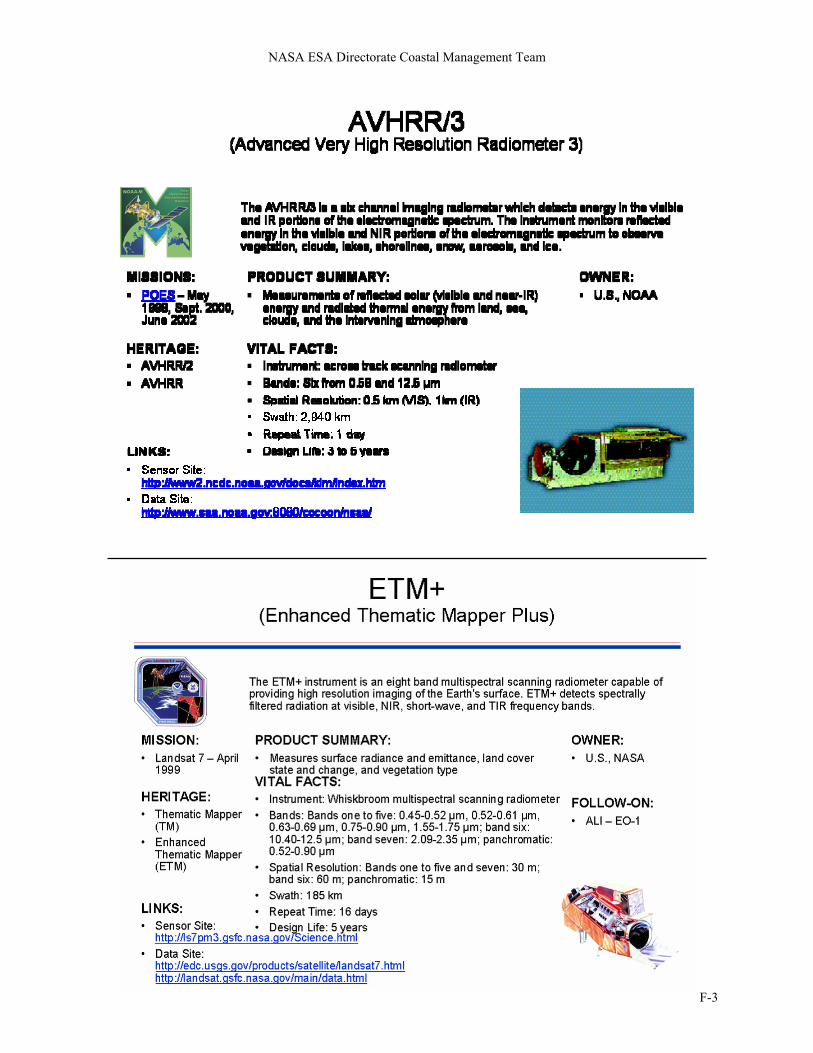
NASA ESA Directorate Coastal Management Team
F-3
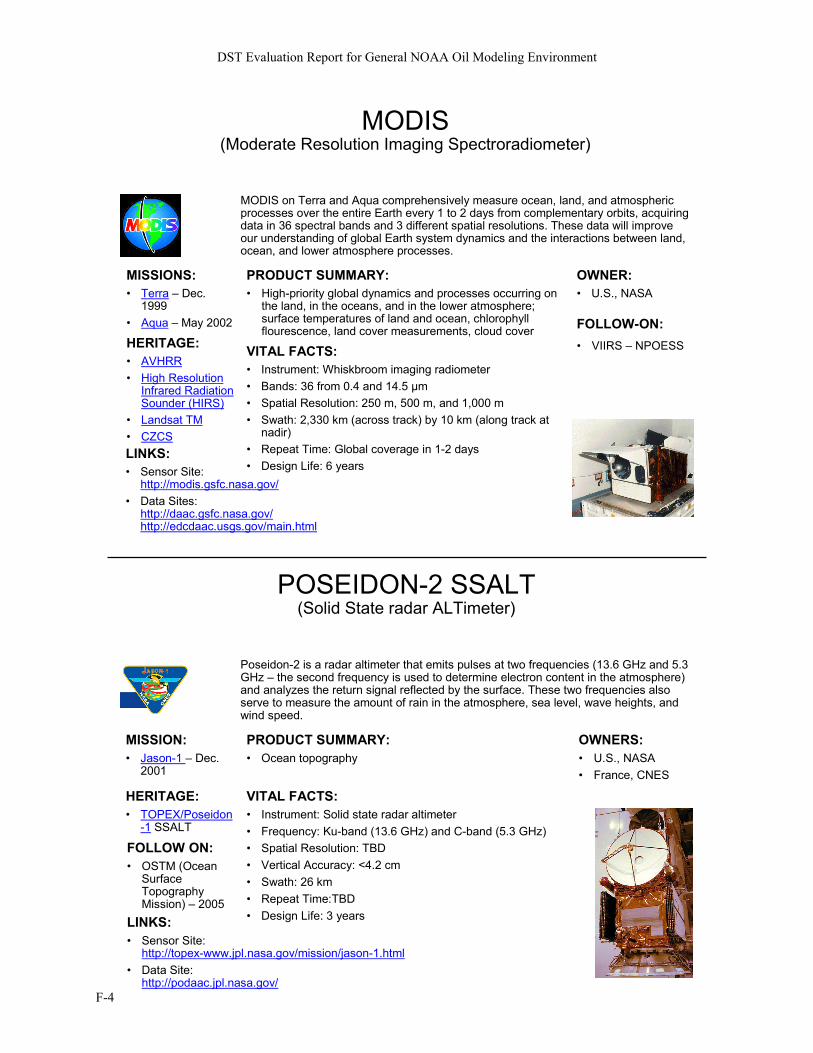
DST Evaluation Report for General NOAA Oil Modeling Environment
F-4
MODIS(Moderate Resolution Imaging Spectroradiometer)
VITAL FACTS:• Instrument: Whiskbroom imaging radiometer• Bands: 36 from 0.4 and 14.5 µm• Spatial Resolution: 250 m, 500 m, and 1,000 m• Swath: 2,330 km (across track) by 10 km (along track at
nadir)• Repeat Time: Global coverage in 1-2 days• Design Life: 6 years
MISSIONS:• Terra – Dec.
1999• Aqua – May 2002
MODIS on Terra and Aqua comprehensively measure ocean, land, and atmospheric processes over the entire Earth every 1 to 2 days from complementary orbits, acquiring data in 36 spectral bands and 3 different spatial resolutions. These data will improve our understanding of global Earth system dynamics and the interactions between land, ocean, and lower atmosphere processes.
LINKS:• Sensor Site:
http://modis.gsfc.nasa.gov/
OWNER:• U.S., NASA
PRODUCT SUMMARY:• High-priority global dynamics and processes occurring on
the land, in the oceans, and in the lower atmosphere; surface temperatures of land and ocean, chlorophyll flourescence, land cover measurements, cloud cover FOLLOW-ON:
• VIIRS – NPOESSHERITAGE:• AVHRR• High Resolution
Infrared Radiation Sounder (HIRS)
• Data Sites:http://daac.gsfc.nasa.gov/http://edcdaac.usgs.gov/main.html
• Landsat TM• CZCS
POSEIDON-2 SSALT(Solid State radar ALTimeter)
Poseidon-2 is a radar altimeter that emits pulses at two frequencies (13.6 GHz and 5.3 GHz – the second frequency is used to determine electron content in the atmosphere) and analyzes the return signal reflected by the surface. These two frequencies also serve to measure the amount of rain in the atmosphere, sea level, wave heights, and wind speed.
VITAL FACTS:• Instrument: Solid state radar altimeter• Frequency: Ku-band (13.6 GHz) and C-band (5.3 GHz)• Spatial Resolution: TBD• Vertical Accuracy: <4.2 cm• Swath: 26 km• Repeat Time:TBD• Design Life: 3 years
MISSION:• Jason-1 – Dec.
2001
LINKS:• Sensor Site:
http://topex-www.jpl.nasa.gov/mission/jason-1.html
PRODUCT SUMMARY:• Ocean topography
OWNERS:• U.S., NASA• France, CNES
HERITAGE:• TOPEX/Poseidon
-1 SSALT
FOLLOW ON:• OSTM (Ocean
Surface Topography Mission) – 2005
• Data Site:http://podaac.jpl.nasa.gov/
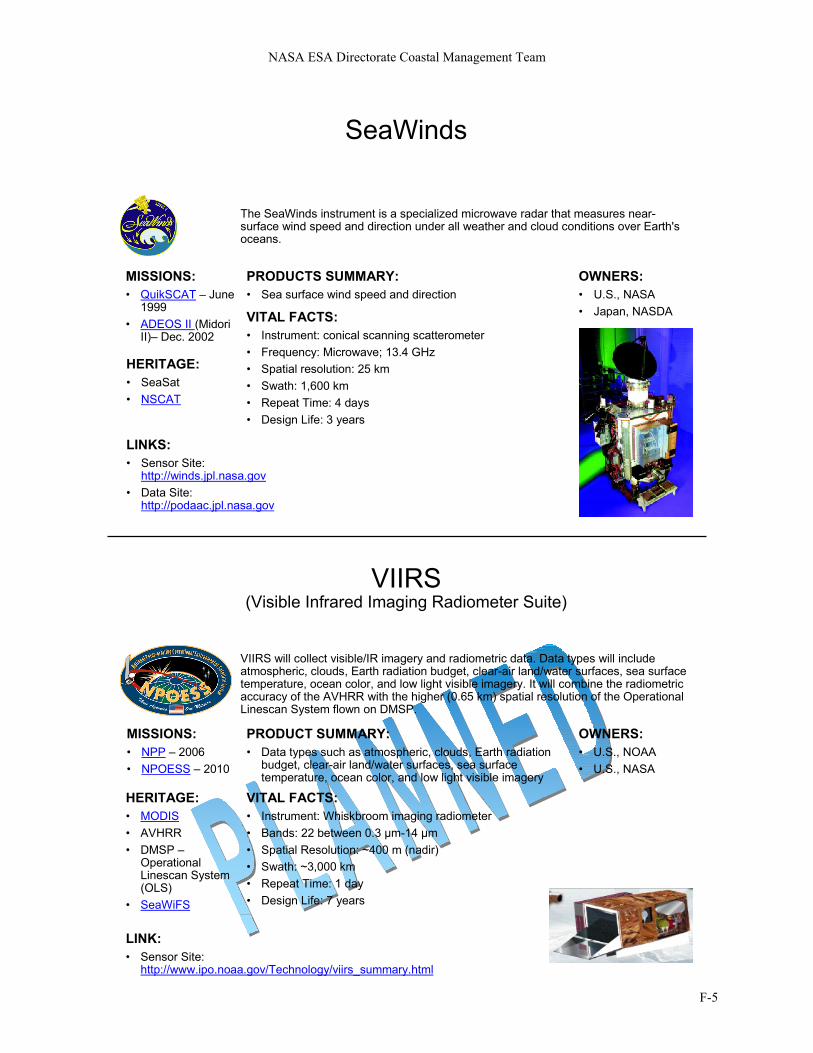
NASA ESA Directorate Coastal Management Team
F-5
VIIRS(Visible Infrared Imaging Radiometer Suite)
VITAL FACTS:• Instrument: Whiskbroom imaging radiometer• Bands: 22 between 0.3 µm-14 µm• Spatial Resolution: ~400 m (nadir)• Swath: ~3,000 km • Repeat Time: 1 day• Design Life: 7 years
MISSIONS:• NPP – 2006• NPOESS – 2010
VIIRS will collect visible/IR imagery and radiometric data. Data types will include atmospheric, clouds, Earth radiation budget, clear-air land/water surfaces, sea surface temperature, ocean color, and low light visible imagery. It will combine the radiometric accuracy of the AVHRR with the higher (0.65 km) spatial resolution of the Operational Linescan System flown on DMSP.
LINK:• Sensor Site:
http://www.ipo.noaa.gov/Technology/viirs_summary.html
HERITAGE:• MODIS• AVHRR• DMSP –
Operational Linescan System (OLS)
• SeaWiFS
OWNERS:• U.S., NOAA• U.S., NASA
PRODUCT SUMMARY:• Data types such as atmospheric, clouds, Earth radiation
budget, clear-air land/water surfaces, sea surface temperature, ocean color, and low light visible imagery
SeaWinds
VITAL FACTS:• Instrument: conical scanning scatterometer• Frequency: Microwave; 13.4 GHz• Spatial resolution: 25 km• Swath: 1,600 km• Repeat Time: 4 days• Design Life: 3 years
MISSIONS:• QuikSCAT – June
1999• ADEOS II (Midori
II)– Dec. 2002
The SeaWinds instrument is a specialized microwave radar that measures near-surface wind speed and direction under all weather and cloud conditions over Earth's oceans.
LINKS:• Sensor Site:
http://winds.jpl.nasa.gov• Data Site:
http://podaac.jpl.nasa.gov
HERITAGE:• SeaSat• NSCAT
OWNERS:• U.S., NASA• Japan, NASDA
PRODUCTS SUMMARY:• Sea surface wind speed and direction
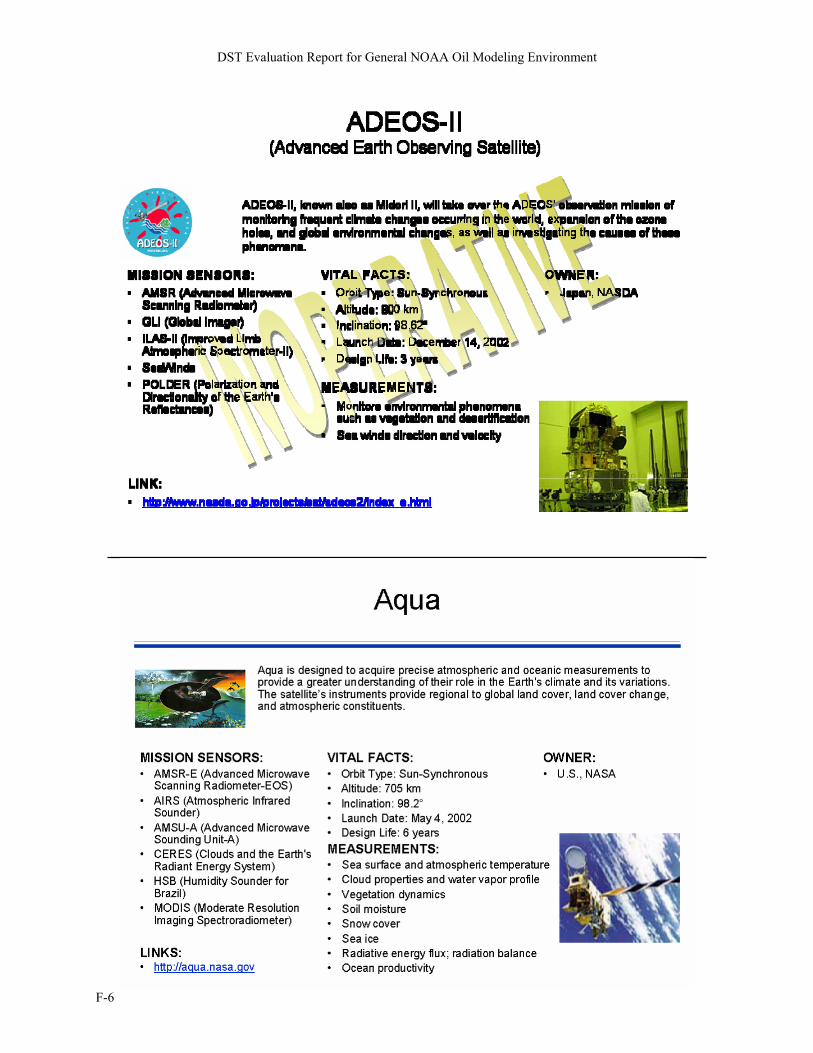
DST Evaluation Report for General NOAA Oil Modeling Environment
F-6
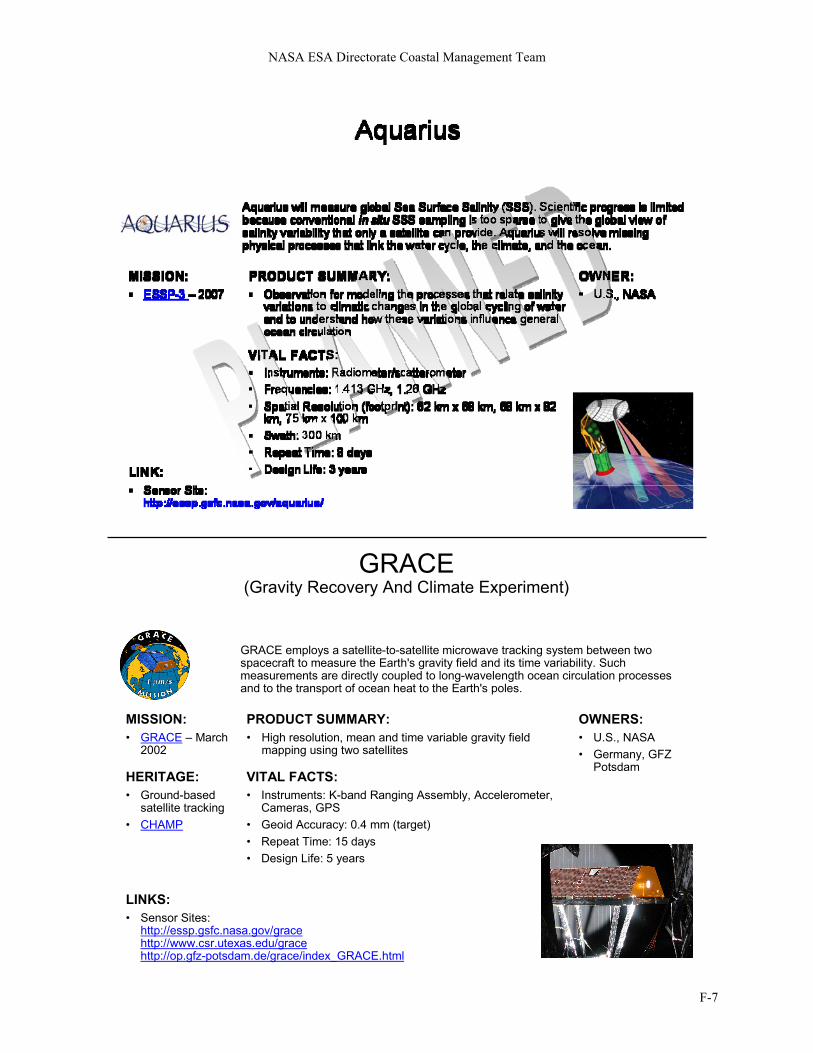
NASA ESA Directorate Coastal Management Team
F-7
GRACE(Gravity Recovery And Climate Experiment)
VITAL FACTS:• Instruments: K-band Ranging Assembly, Accelerometer,
Cameras, GPS• Geoid Accuracy: 0.4 mm (target)• Repeat Time: 15 days• Design Life: 5 years
MISSION:• GRACE
OWNERS:• U.S., NASA• Germany, GFZ
Potsdam
– March 2002
LINKS:• Sensor Sites:
http://essp.gsfc.nasa.gov/grace
PRODUCT SUMMARY:• High resolution, mean and time variable gravity field
mapping using two satellites
GRACE employs a satellite-to-satellite microwave tracking system between two spacecraft to measure the Earth's gravity field and its time variability. Such measurements are directly coupled to long-wavelength ocean circulation processes and to the transport of ocean heat to the Earth's poles.
HERITAGE:• Ground-based
satellite tracking• CHAMP
http://www.csr.utexas.edu/gracehttp://op.gfz-potsdam.de/grace/index_GRACE.html
DST Evaluation Report for General NOAA Oil Modeling Environment
F-8
VITAL FACTS:• Orbit Type: Non Sun-Synchronous
Altitude: 1,336 km• Inclination: 66° • Launch Date: December 7, 2001• Design Life: 3 years
MISSION SENSORS:• DORIS (Doppler Orbitography
and Radiopositioning Integrated by Satellite) receiver
• JMR (Jason Microwave Radiometer )
• LRA (Laser Retroreflector Array)• Poseidon-2 SSALT-2 (Solid
State radar ALTimeter)• TRSR-GPS Receiver
Jason-1 is a joint mission between France and the U.S. to monitor global ocean circulation, to improve global climate predictions, and to monitor events such as El Niño Southern Oscillation conditions and ocean eddies.
OWNERS:• U.S., NASA• France, CNES
JASON-1
MEASUREMENTS:• Brightness temperature • Water vapor content • Liquid water content• Ocean topography and circulation
LINKS:• http://sealevel.jpl.nasa.gov• http://topex-www.jpl.nasa.gov/mission/jason-1.html
NASA ESA Directorate Coastal Management Team
F-9
NPOESS(National Polar-orbiting Operational Environmental Satellite System)
VITAL FACTS:• Orbit Type: Sun-Synchronous• Altitude: 833 km• Inclination: 98.75° • Launch Date: September 1, 2010• Design Life: 5 years
MISSION SENSORS:• VIIRS (Visible/Infrared
Imager/Radiometer Suite)• CMIS (Conical Microwave
Imager/Sounder)• CrIS (Crosstrack Infrared
Sounder)• GPSOS (Global Positioning
System Occultation Sensor)• OMPS (Ozone Mapping and
Profiler Suite)• SESS (Space Environment
Sensor Suite)• TIM (Total Irradiance Monitor)• SIM (Spectral Irradiance
Monitor)
NPOESS will provide the U.S. with an enduring capability to measure atmospheric, land, and oceanic environmental parameters globally. The system will provide timely and accurate weather and environmental data to weather forecasters, military commanders, civilian leaders, and the scientific community. The current plan is for the NPOESS constellation to consist of three polar-orbiting satellites.
LINKS:• http://www.ipo.noaa.gov/index2.html
OWNERS:• U.S., NASA• U.S., NOAA
MEASUREMENTS:• Atmospheric temperature, water vapor
profiles, and auroral boundary traits• Electron density and ionospheric
profiles• Ozone distribution• Total solar irradiance and solar
spectral irradiance• Earth radiation budget, land/water and
sea surface temperature, ocean color, and low light imagery
DST Evaluation Report for General NOAA Oil Modeling Environment
F-10
NASA ESA Directorate Coastal Management Team
F-11
VITAL FACTS:• Orbit Type: Non Sun-Synchronous• Altitude: 1,336 km• Inclination: 66° • Launch Date: August 10, 1992• Design Life: 5 years (exceeded)
MISSION SENSORS:• DORIS (Doppler Orbitography
and Radiopositioning Integrated by Satellite) receiver
• GPSDR (Global Positioning System Demonstration Receiver)
• LRA (Laser Retroreflector Array)• TMR (TOPEX Microwave
Radiometer)• Poseidon-1 SSALT-1 (Solid
State radar ALTimeter-1)• TOPEX altimeter
TOPEX/Poseidon is a joint mission between France and the U.S. to monitor global ocean circulation, to improve global climate predictions, and to monitor events such as El Niño Southern Oscillation conditions and ocean eddies.
LINK:• http://topex-www.jpl.nasa.gov/
OWNERS:• U.S., NASA• France, CNES
TOPEX/Poseidon(Topographic Experiment/Poseidon)
MEASUREMENTS:• Ocean topography• Brightness temperature • Water vapor content • Liquid water content• Geodesy/gravity
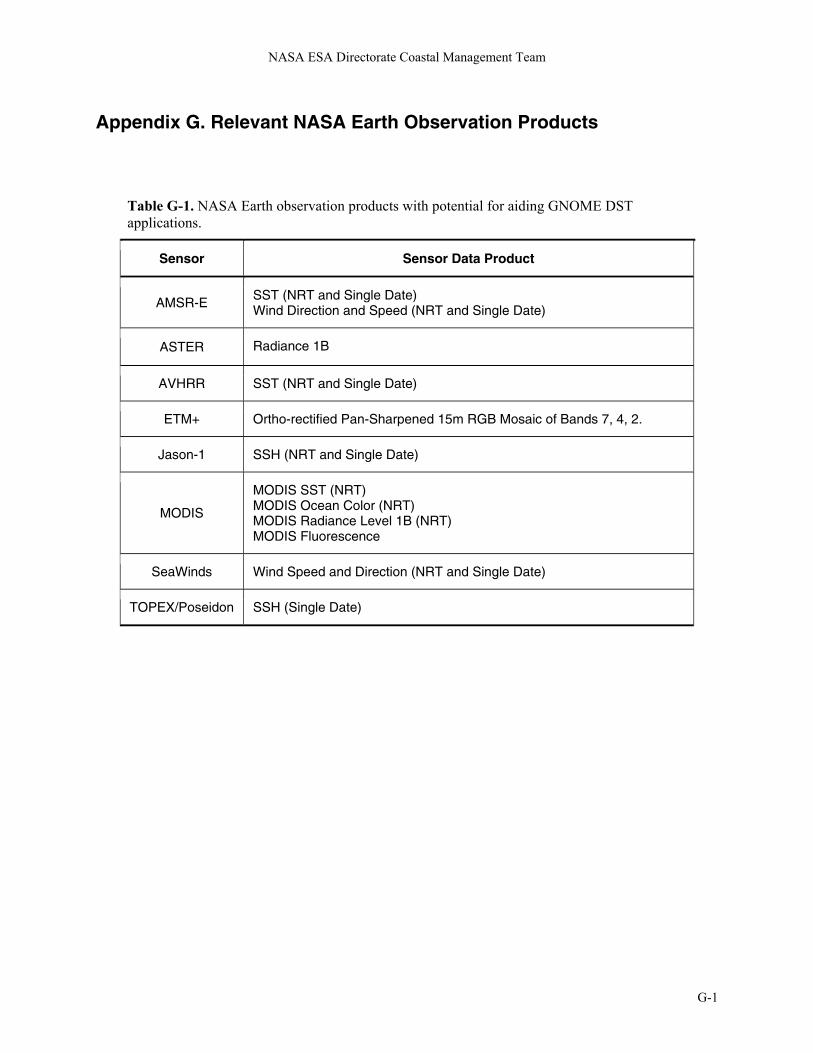
NASA ESA Directorate Coastal Management Team
Appendix G. Relevant NASA Earth Observation Products
Table G-1. NASA Earth observation products with potential for aiding GNOME DST applications.
Sensor Sensor Data Product
AMSR-E SST (NRT and Single Date) Wind Direction and Speed (NRT and Single Date)
ASTER Radiance 1B
AVHRR SST (NRT and Single Date)
ETM+ Ortho-rectified Pan-Sharpened 15m RGB Mosaic of Bands 7, 4, 2.
Jason-1 SSH (NRT and Single Date)
MODIS
MODIS SST (NRT) MODIS Ocean Color (NRT) MODIS Radiance Level 1B (NRT) MODIS Fluorescence
SeaWinds Wind Speed and Direction (NRT and Single Date)
TOPEX/Poseidon SSH (Single Date)
G-1
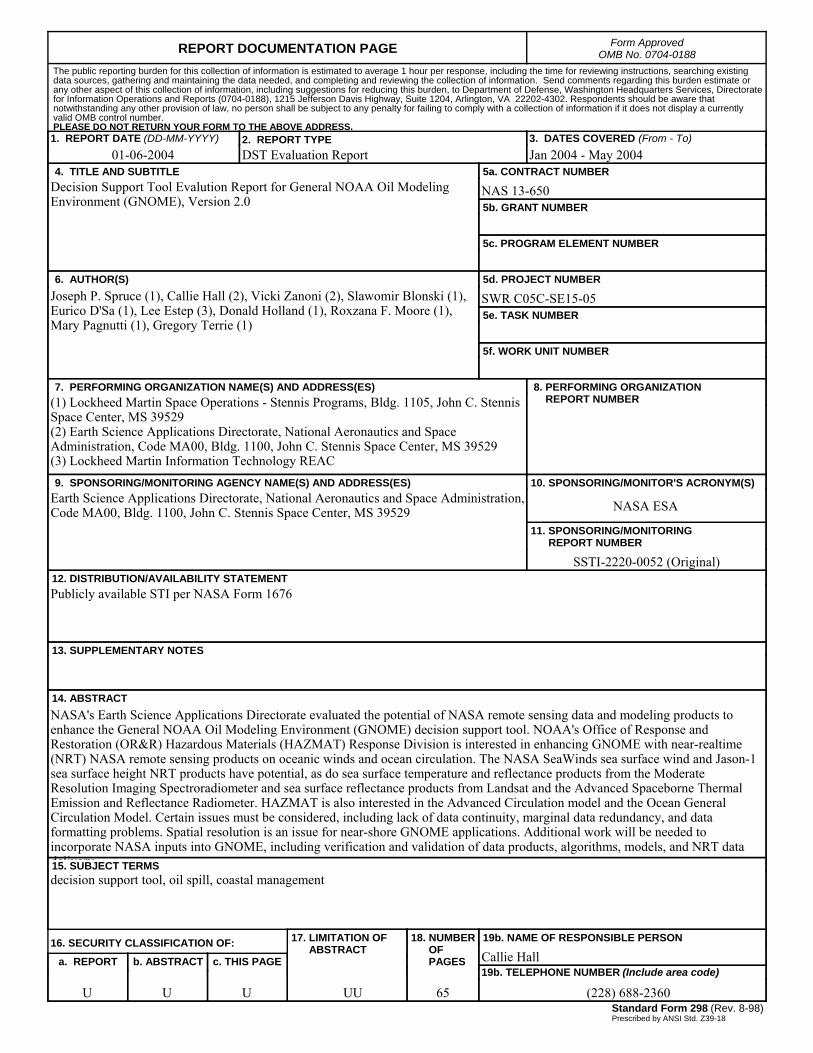
REPORT DOCUMENTATION PAGE Form ApprovedOMB No. 0704-0188
1. REPORT DATE (DD-MM-YYYY)01-06-2004
2. REPORT TYPE DST Evaluation Report
4. TITLE AND SUBTITLEDecision Support Tool Evalution Report for General NOAA Oil Modeling Environment (GNOME), Version 2.0
5a. CONTRACT NUMBER
NAS 13-650
6. AUTHOR(S)Joseph P. Spruce (1), Callie Hall (2), Vicki Zanoni (2), Slawomir Blonski (1), Eurico D'Sa (1), Lee Estep (3), Donald Holland (1), Roxzana F. Moore (1), Mary Pagnutti (1), Gregory Terrie (1)
7. PERFORMING ORGANIZATION NAME(S) AND ADDRESS(ES)(1) Lockheed Martin Space Operations - Stennis Programs, Bldg. 1105, John C. Stennis Space Center, MS 39529(2) Earth Science Applications Directorate, National Aeronautics and Space Administration, Code MA00, Bldg. 1100, John C. Stennis Space Center, MS 39529(3) Lockheed Martin Information Technology REAC 9. SPONSORING/MONITORING AGENCY NAME(S) AND ADDRESS(ES)Earth Science Applications Directorate, National Aeronautics and Space Administration, Code MA00, Bldg. 1100, John C. Stennis Space Center, MS 39529
8. PERFORMING ORGANIZATION REPORT NUMBER
10. SPONSORING/MONITOR'S ACRONYM(S)
NASA ESA
13. SUPPLEMENTARY NOTES
12. DISTRIBUTION/AVAILABILITY STATEMENTPublicly available STI per NASA Form 1676
19b. NAME OF RESPONSIBLE PERSON
Callie Hall
14. ABSTRACTNASA's Earth Science Applications Directorate evaluated the potential of NASA remote sensing data and modeling products to enhance the General NOAA Oil Modeling Environment (GNOME) decision support tool. NOAA's Office of Response and Restoration (OR&R) Hazardous Materials (HAZMAT) Response Division is interested in enhancing GNOME with near-realtime (NRT) NASA remote sensing products on oceanic winds and ocean circulation. The NASA SeaWinds sea surface wind and Jason-1 sea surface height NRT products have potential, as do sea surface temperature and reflectance products from the Moderate Resolution Imaging Spectroradiometer and sea surface reflectance products from Landsat and the Advanced Spaceborne Thermal Emission and Reflectance Radiometer. HAZMAT is also interested in the Advanced Circulation model and the Ocean General Circulation Model. Certain issues must be considered, including lack of data continuity, marginal data redundancy, and data formatting problems. Spatial resolution is an issue for near-shore GNOME applications. Additional work will be needed to incorporate NASA inputs into GNOME, including verification and validation of data products, algorithms, models, and NRT data delivery15. SUBJECT TERMSdecision support tool, oil spill, coastal management
18. NUMBER OF PAGES
6519b. TELEPHONE NUMBER (Include area code)
(228) 688-2360
a. REPORT
U
c. THIS PAGE
U
b. ABSTRACT
U
17. LIMITATION OF ABSTRACT
UU
Prescribed by ANSI Std. Z39-18Standard Form 298 (Rev. 8-98)
3. DATES COVERED (From - To)Jan 2004 - May 2004
5b. GRANT NUMBER
5c. PROGRAM ELEMENT NUMBER
5d. PROJECT NUMBER
SWR C05C-SE15-055e. TASK NUMBER
5f. WORK UNIT NUMBER
11. SPONSORING/MONITORING REPORT NUMBER
SSTI-2220-0052 (Original)
16. SECURITY CLASSIFICATION OF:
The public reporting burden for this collection of information is estimated to average 1 hour per response, including the time for reviewing instructions, searching existing data sources, gathering and maintaining the data needed, and completing and reviewing the collection of information. Send comments regarding this burden estimate or any other aspect of this collection of information, including suggestions for reducing this burden, to Department of Defense, Washington Headquarters Services, Directorate for Information Operations and Reports (0704-0188), 1215 Jefferson Davis Highway, Suite 1204, Arlington, VA 22202-4302. Respondents should be aware that notwithstanding any other provision of law, no person shall be subject to any penalty for failing to comply with a collection of information if it does not display a currently valid OMB control number.PLEASE DO NOT RETURN YOUR FORM TO THE ABOVE ADDRESS.