Embed Size (px)
Citation preview

www.coneval.gob.mx
Key elements of evaluation as a decision making tool: the Specific Performance Evaluation (EED)
experience in MexicoAuthor(s): Hortensia Pérez, Analysis and Results Follow-Up Director, CONEVAL Thania de la Garza, General Director of Evaluation, CONEVAL
September, 2011

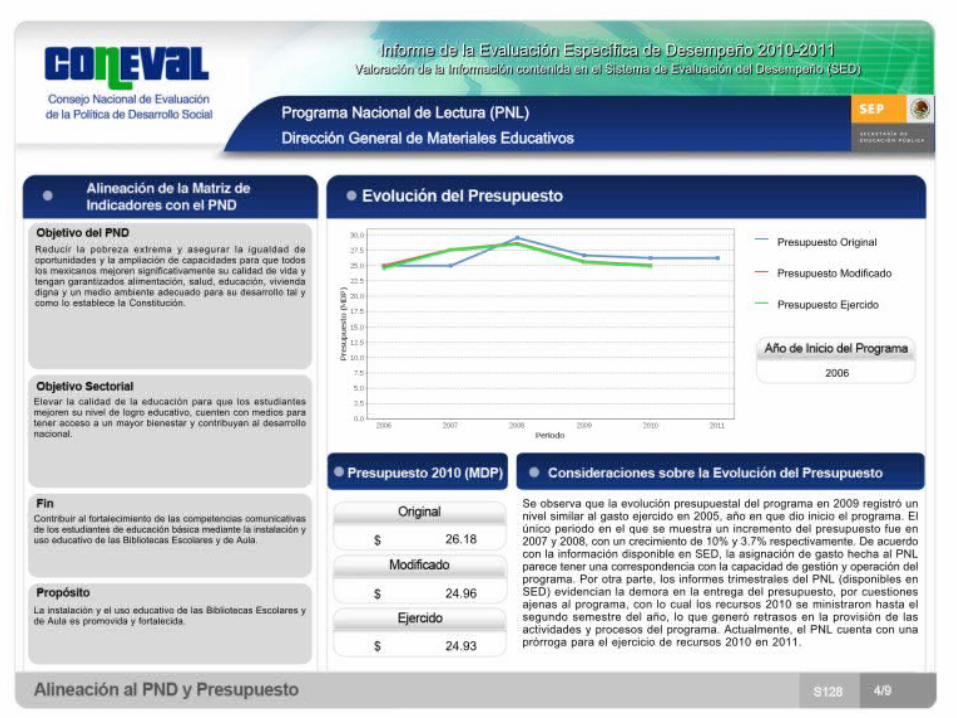
Social Policy Planning: Policies and Programs Evaluations
Why an evaluation?
Make better decisions
Improvement of policies
and programsAccountability

Results:Measure if a program
solves the original problem
Results:Measure if a program
solves the original problem
M&E System
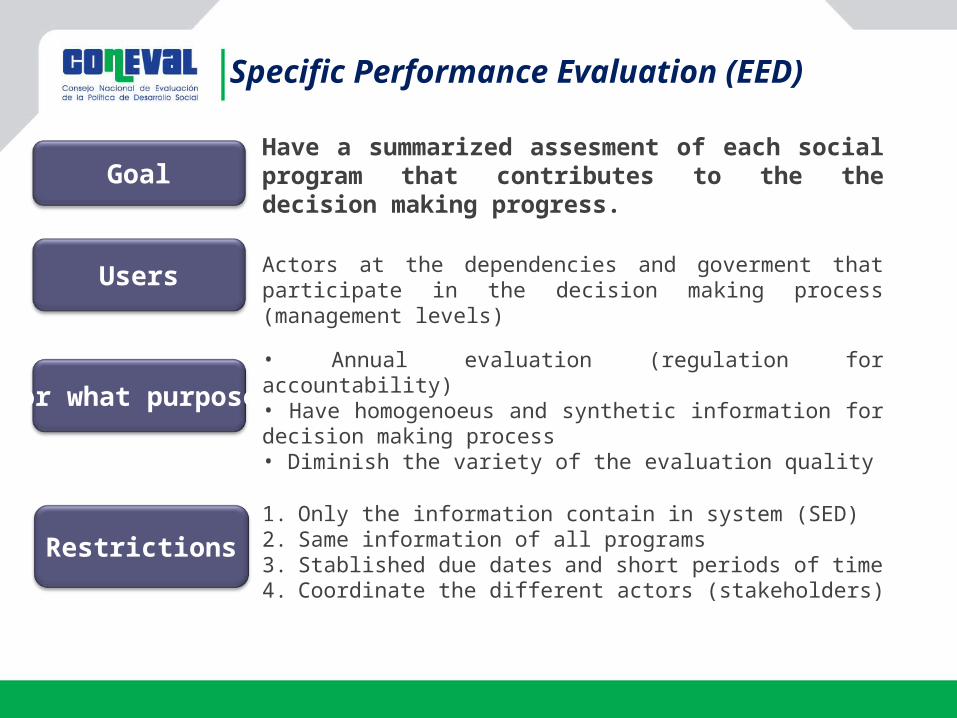
Have a summarized assesment of each social program that contributes to the the decision making progress.
Actors at the dependencies and goverment that participate in the decision making process (management levels)
Goal
Users
For what purpose?• Annual evaluation (regulation for accountability)• Have homogenoeus and synthetic information for decision making process• Diminish the variety of the evaluation quality
Restrictions1. Only the information contain in system (SED)2. Same information of all programs 3. Stablished due dates and short periods of time4. Coordinate the different actors (stakeholders)
Specific Performance Evaluation (EED)

Specific Performance Evaluation (EED)
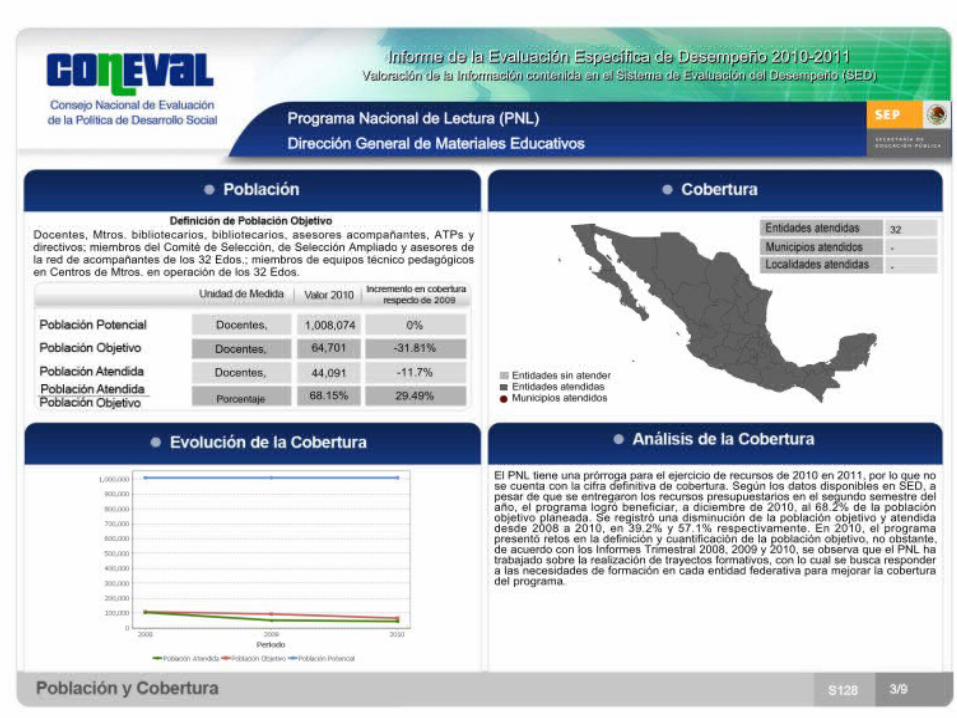
Coverage
Follow-up
Products
Results
SED SIEED
Evaluator assesment


Descriptive Data EED
Year # Programs
EED 2008-2009 131
EED 2009-2010 127
EED 2010-2011 133
<80 80-120 >120 SD
41 172 72 20
13.4%
56.4%
23.6%
6.6%
020406080
100120140160180200
# In
dica
tors
Results IndicatorsEED 2010-2011
<80 80-120 >120 SD
10 370 143 9
1.9
69.5%
26.9%
1.7%
0
50
100
150
200
250
300
350
400
# In
dica
tors
Service and Management IndicatorsEED 2010-2011

Specific Performance Evaluation (EED)Key Elements
Homogenoeus
format
Practical tool
A few pages
Specific information at each page
Same language
Feedback practicesMeetings with
the stakeholders
Experts in
different areas