Embed Size (px)
Citation preview
LEARNING OUTCOMES
T4-2 * Plug-In T4 Decision Making Using Excel 2007
Decision Making Using Excel 2007
IntroductionMost of the decision-analysis tools on the market focus on one specific analytical tech-nique, like simulation or decision trees. They may be tailored to a specific industry need, such as insurance claims modeling. Furthermore, the cost of these tools can run into the tens of thousands, even millions, of dollars—such as SAS and Cognos. One integrated set of tools that combines the best analytical methods, can be applied to different prob-lems, and is reasonably priced is Microsoft Excel 2007.
The measure of any business intelligence solution is its ability to derive knowledge from data, as discussed in the core units of this book. This plug-in will examine a few of the advanced business-analysis tools that have the capability to identify patterns, trends, and rules and create “what-if” analyses. There are four areas in this plug-in:
The IF function is used to conduct conditional tests on values and formulas.
The Goal Seek function is used to find an unknown value that produces a desired result.
The Solver function is used to calculate an optimum solution based on several vari-ables and constraints.
The Scenario Manager function is used to create and evaluate a collection of “what-if” scenarios containing multiple input values.
Creating Formulas Using the IF FunctionThe IF logical function will return one value if a condition is TRUE and another value if the condition is FALSE. Use the IF function when you want to compare two items in your workbook. The IF function looks like this:
=IF(logical_test,value_if_true,value_if_false)
1.2.
3.
4.
Describe the use of the IF function.Compare the functions of Goal Seek and Solver.List the advantages of using the Scenario Manager.
1.2.3.
P L U G - I N
T4LEARNING OUTCOMES
haa10778_plugint04.indd 2haa10778_plugint04.indd 2 7/23/07 4:38:34 PM7/23/07 4:38:34 PM
Plug-In T4 Decision Making Using Excel 2007 * T4-3
*
Logical_test is any value or expression that can be evaluated to TRUE or FALSE. For example, A10 = 100 is a logical expression; if the value in cell A10 is equal to 100, the expression evaluates to TRUE. Otherwise, the expression evaluates to FALSE. This argument can use any com-parison calculation operator.
Value_if_true is the value that is returned if the logical_test is TRUE. For example, if this argument is the text string “Within budget” and the logical_test argument evaluates to TRUE, then the IF function displays the text “Within budget.” Note: Value_if_true can be another formula.
Value_if_false is the value that is returned if the logical_test is FALSE. For example, if this argument is the text string “Over budget” and the logical_test argument evaluates to FALSE, then the IF function displays the text “Over budget.” Note: Value_if_false can be another formula.
To use the IF function follow these steps:
Select the cell in which you want to enter the function.
Click the Formulas tab, then click the Insert Function button.
Click IF from the list of Logical functions and click OK.
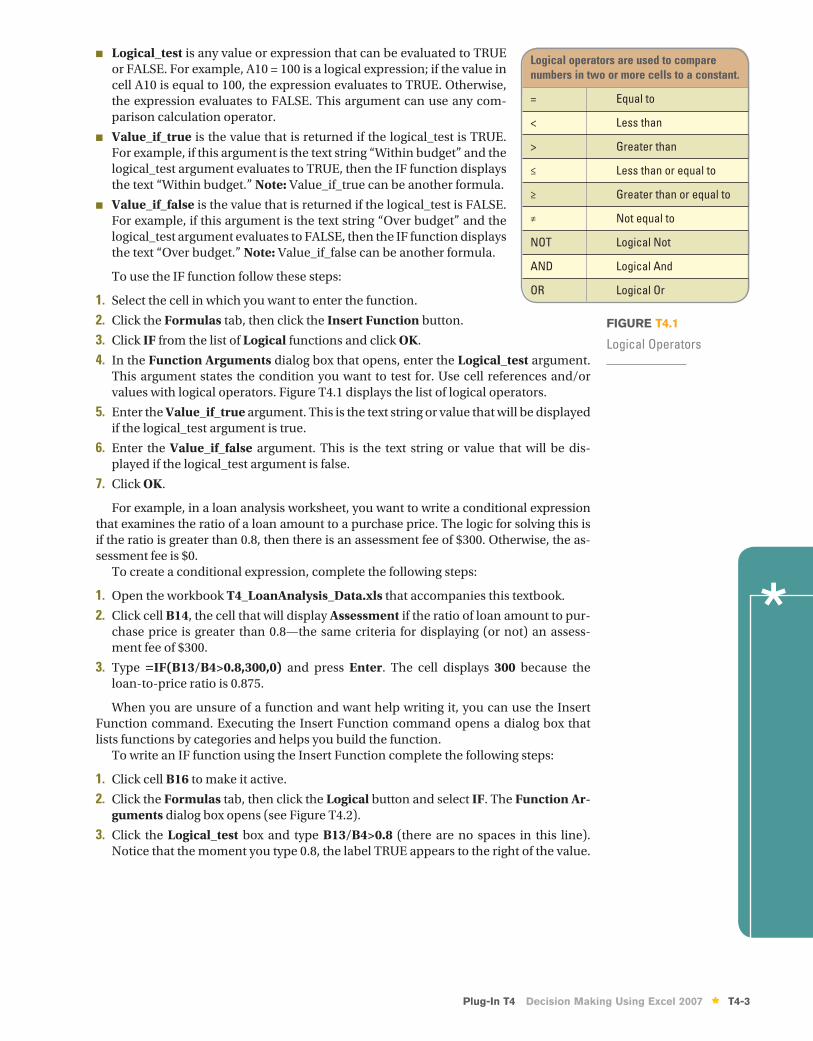
In the Function Arguments dialog box that opens, enter the Logical_test argument. This argument states the condition you want to test for. Use cell references and/or values with logical operators. Figure T4.1 displays the list of logical operators.
Enter the Value_if_true argument. This is the text string or value that will be displayed if the logical_test argument is true.
Enter the Value_if_false argument. This is the text string or value that will be dis-played if the logical_test argument is false.
Click OK.
For example, in a loan analysis worksheet, you want to write a conditional expression that examines the ratio of a loan amount to a purchase price. The logic for solving this is if the ratio is greater than 0.8, then there is an assessment fee of $300. Otherwise, the as-sessment fee is $0.
To create a conditional expression, complete the following steps:
Open the workbook T4_LoanAnalysis_Data.xls that accompanies this textbook.
Click cell B14, the cell that will display Assessment if the ratio of loan amount to pur-chase price is greater than 0.8—the same criteria for displaying (or not) an assess-ment fee of $300.
Type =IF(B13/B4>0.8,300,0) and press Enter. The cell displays 300 because the loan-to-price ratio is 0.875.
When you are unsure of a function and want help writing it, you can use the Insert Function command. Executing the Insert Function command opens a dialog box that lists functions by categories and helps you build the function.
To write an IF function using the Insert Function complete the following steps:
Click cell B16 to make it active.
Click the Formulas tab, then click the Logical button and select IF. The Function Ar-guments dialog box opens (see Figure T4.2).
Click the Logical_test box and type B13/B4>0.8 (there are no spaces in this line). Notice that the moment you type 0.8, the label TRUE appears to the right of the value.
■
■
■
1.2.3.4.
5.
6.
7.
1.2.
3.
1.2.
3.
FIGURE T4.1
Logical Operators
Logical operators are used to comparenumbers in two or more cells to a constant.
= Equal to
< Less than
> Greater than
≤ Less than or equal to
≥ Greater than or equal to
≠ Not equal to
NOT Logical Not
AND Logical And
OR Logical Or
haa10778_plugint04.indd 3haa10778_plugint04.indd 3 7/23/07 4:38:35 PM7/23/07 4:38:35 PM
T4-4 * Plug-In T4 Decision Making Using Excel 2007
That indicates the current value of the expression based on the condition you just completed.
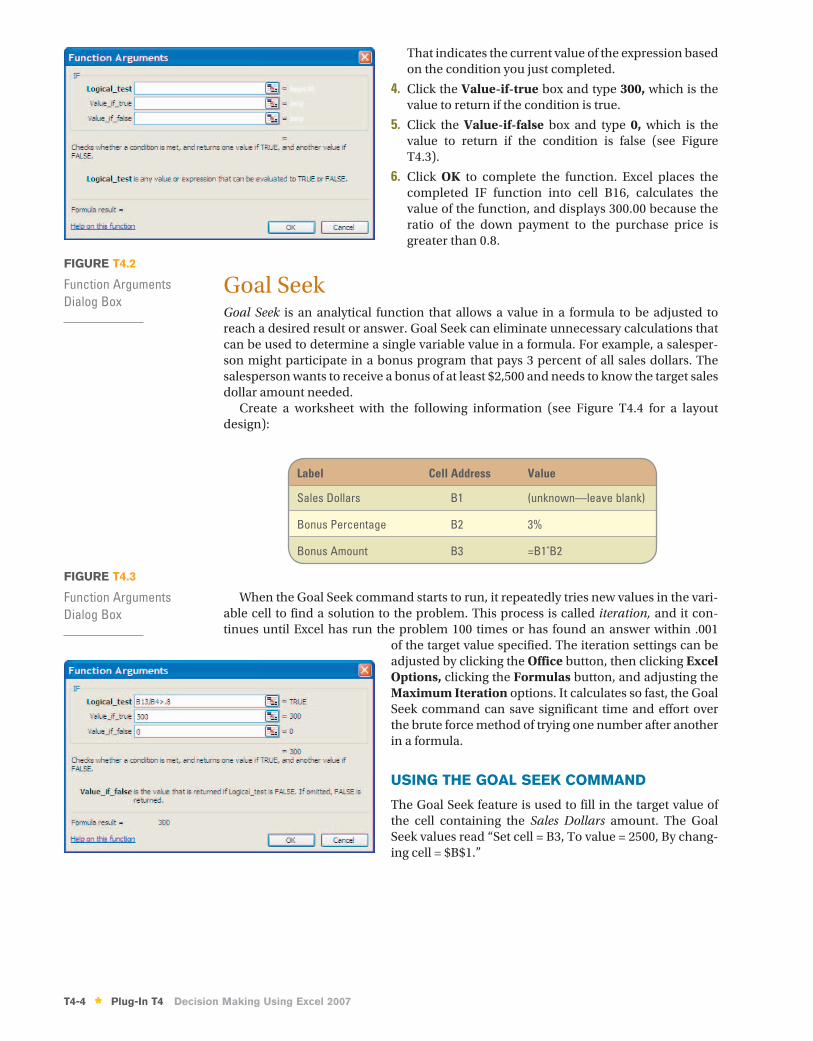
Click the Value-if-true box and type 300, which is the value to return if the condition is true.
Click the Value-if-false box and type 0, which is the value to return if the condition is false (see Figure T4.3).
Click OK to complete the function. Excel places the completed IF function into cell B16, calculates the value of the function, and displays 300.00 because the ratio of the down payment to the purchase price is greater than 0.8.
Goal SeekGoal Seek is an analytical function that allows a value in a formula to be adjusted to reach a desired result or answer. Goal Seek can eliminate unnecessary calculations that can be used to determine a single variable value in a formula. For example, a salesper-son might participate in a bonus program that pays 3 percent of all sales dollars. The salesperson wants to receive a bonus of at least $2,500 and needs to know the target sales dollar amount needed.
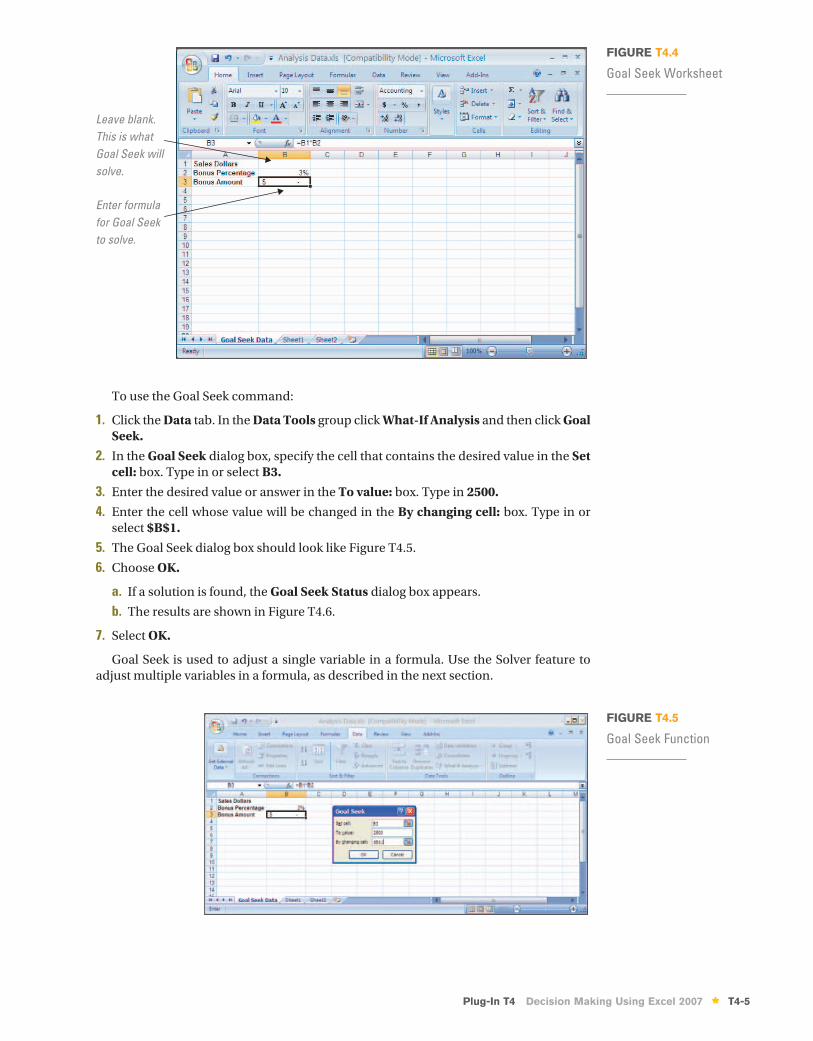
Create a worksheet with the following information (see Figure T4.4 for a layout design):
4.
5.
6.
FIGURE T4.2
Function Arguments Dialog Box
FIGURE T4.3
Function Arguments Dialog Box
When the Goal Seek command starts to run, it repeatedly tries new values in the vari-able cell to find a solution to the problem. This process is called iteration, and it con-tinues until Excel has run the problem 100 times or has found an answer within .001
of the target value specified. The iteration settings can be adjusted by clicking the Office button, then clicking Excel Options, clicking the Formulas button, and adjusting the Maximum Iteration options. It calculates so fast, the Goal Seek command can save significant time and effort over the brute force method of trying one number after another in a formula.
USING THE GOAL SEEK COMMAND
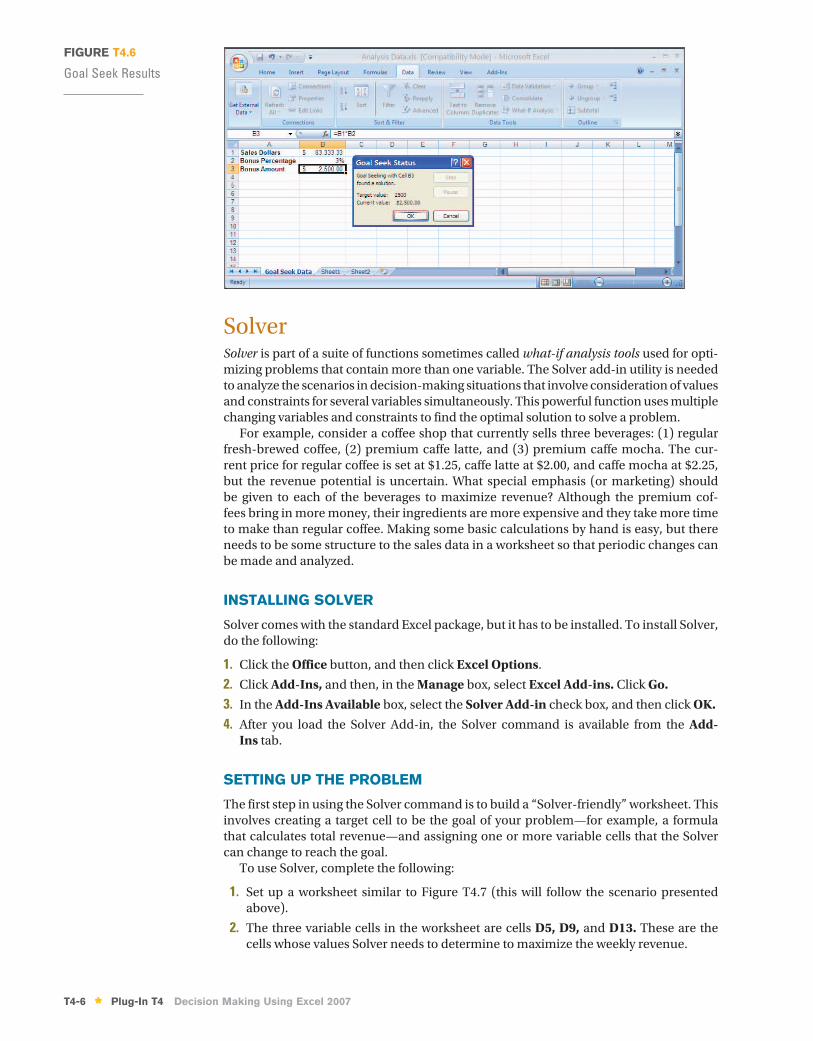
The Goal Seek feature is used to fill in the target value of the cell containing the Sales Dollars amount. The Goal Seek values read “Set cell = B3, To value = 2500, By chang-ing cell = $B$1.”
Label Cell Address Value
Sales Dollars B1 (unknown—leave blank)
Bonus Percentage B2 3%
Bonus Amount B3 =B1*B2
haa10778_plugint04.indd 4haa10778_plugint04.indd 4 7/23/07 4:38:36 PM7/23/07 4:38:36 PM
Plug-In T4 Decision Making Using Excel 2007 * T4-5
To use the Goal Seek command:
Click the Data tab. In the Data Tools group click What-If Analysis and then click Goal Seek.
In the Goal Seek dialog box, specify the cell that contains the desired value in the Set cell: box. Type in or select B3.
Enter the desired value or answer in the To value: box. Type in 2500.
Enter the cell whose value will be changed in the By changing cell: box. Type in or select $B$1.
The Goal Seek dialog box should look like Figure T4.5.
Choose OK.
If a solution is found, the Goal Seek Status dialog box appears.
The results are shown in Figure T4.6.
Select OK.
Goal Seek is used to adjust a single variable in a formula. Use the Solver feature to adjust multiple variables in a formula, as described in the next section.
1.
2.
3.4.
5.6.
a.b.
7.
Enter formula for Goal Seek to solve.
Leave blank. This is what Goal Seek will solve.
FIGURE T4.4
Goal Seek Worksheet
FIGURE T4.5
Goal Seek Function
haa10778_plugint04.indd 5haa10778_plugint04.indd 5 7/23/07 4:38:37 PM7/23/07 4:38:37 PM
T4-6 * Plug-In T4 Decision Making Using Excel 2007
SolverSolver is part of a suite of functions sometimes called what-if analysis tools used for opti-mizing problems that contain more than one variable. The Solver add-in utility is needed to analyze the scenarios in decision-making situations that involve consideration of values and constraints for several variables simultaneously. This powerful function uses multiple changing variables and constraints to find the optimal solution to solve a problem.
For example, consider a coffee shop that currently sells three beverages: (1) regular fresh-brewed coffee, (2) premium caffe latte, and (3) premium caffe mocha. The cur-rent price for regular coffee is set at $1.25, caffe latte at $2.00, and caffe mocha at $2.25, but the revenue potential is uncertain. What special emphasis (or marketing) should be given to each of the beverages to maximize revenue? Although the premium cof-fees bring in more money, their ingredients are more expensive and they take more time to make than regular coffee. Making some basic calculations by hand is easy, but there needs to be some structure to the sales data in a worksheet so that periodic changes can be made and analyzed.
INSTALLING SOLVER
Solver comes with the standard Excel package, but it has to be installed. To install Solver, do the following:
Click the Office button, and then click Excel Options.
Click Add-Ins, and then, in the Manage box, select Excel Add-ins. Click Go.
In the Add-Ins A vailable box, select the Solver Add-in check box, and then click OK.
After you load the Solver Add-in, the Solver command is available from the Add-Ins tab.
SETTING UP THE PROBLEM
The first step in using the Solver command is to build a “Solver-friendly” worksheet. This involves creating a target cell to be the goal of your problem—for example, a formula that calculates total revenue—and assigning one or more variable cells that the Solver can change to reach the goal.
To use Solver, complete the following:
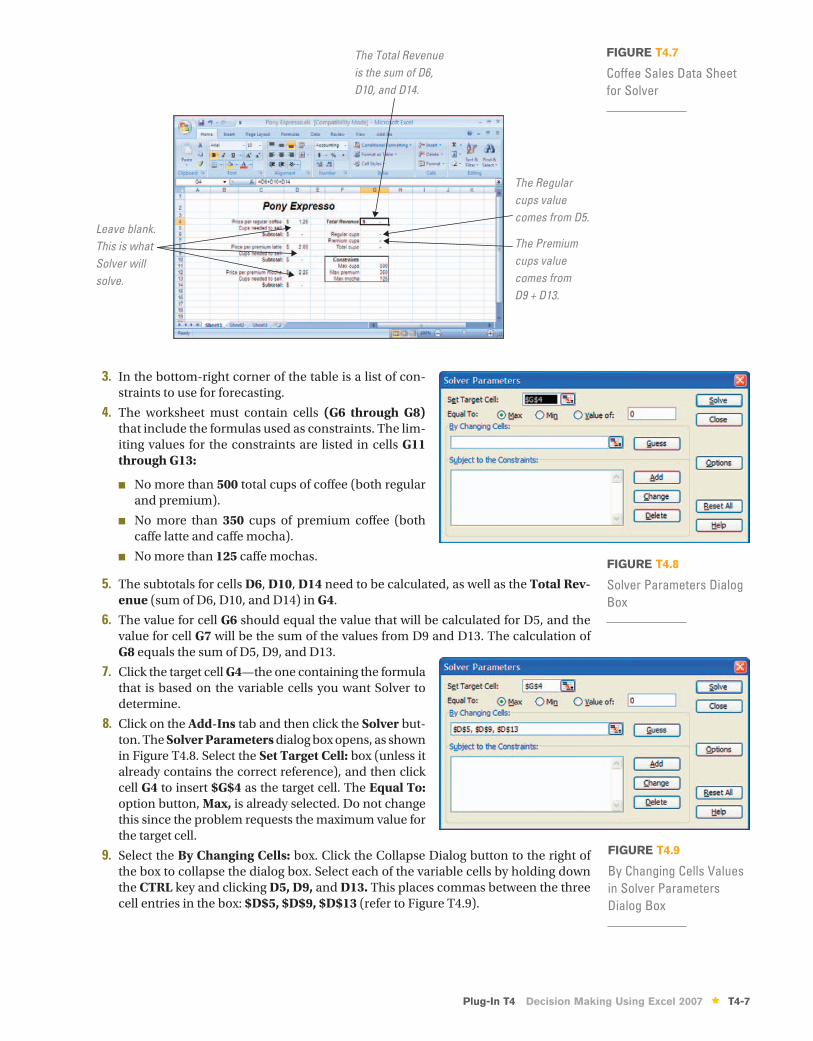
1. Set up a worksheet similar to Figure T4.7 (this will follow the scenario presented above).
2. The three variable cells in the worksheet are cells D5, D9, and D13. These are the cells whose values Solver needs to determine to maximize the weekly revenue.
1.2.3.4.
FIGURE T4.6
Goal Seek Results
haa10778_plugint04.indd 6haa10778_plugint04.indd 6 7/23/07 4:38:38 PM7/23/07 4:38:38 PM
Plug-In T4 Decision Making Using Excel 2007 * T4-7
3. In the bottom-right corner of the table is a list of con-straints to use for forecasting.
4. The worksheet must contain cells (G6 through G8) that include the formulas used as constraints. The lim-iting values for the constraints are listed in cells G11 through G13:
No more than 500 total cups of coffee (both regular and premium).
No more than 350 cups of premium coffee (both caffe latte and caffe mocha).
No more than 125 caffe mochas.
5. The subtotals for cells D6, D10, D14 need to be calculated, as well as the Total Rev-enue (sum of D6, D10, and D14) in G4.
6. The value for cell G6 should equal the value that will be calculated for D5, and the value for cell G7 will be the sum of the values from D9 and D13. The calculation of G8 equals the sum of D5, D9, and D13.
7. Click the target cell G4—the one containing the formula that is based on the variable cells you want Solver to determine.
8. Click on the Add-Ins tab and then click the Solver but-ton. The Solver Parameters dialog box opens, as shown in Figure T4.8. Select the Set Target Cell: box (unless it already contains the correct reference), and then click cell G4 to insert $ G$4 as the target cell. The Equal To: option button, Max, is already selected. Do not change this since the problem requests the maximum value for the target cell.
9. Select the By Changing Cells: box. Click the Collapse Dialog button to the right of the box to collapse the dialog box. Select each of the variable cells by holding down the CTRL key and clicking D5, D9, and D13. This places commas between the three cell entries in the box: $D$5, $D$9, $D$13 (refer to Figure T4.9).
■
■
■
Leave blank. This is what Solver will solve.
The Total Revenue is the sum of D6, D10, and D14.
The Regular cups value comes from D5.
The Premium cups value comes fromD9 + D13.
FIGURE T4.7
Coffee Sales Data Sheet for Solver
FIGURE T4.8
Solver Parameters Dialog Box
FIGURE T4.9
By Changing Cells Values in Solver Parameters Dialog Box
haa10778_plugint04.indd 7haa10778_plugint04.indd 7 7/23/07 4:38:38 PM7/23/07 4:38:38 PM
T4-8 * Plug-In T4 Decision Making Using Excel 2007
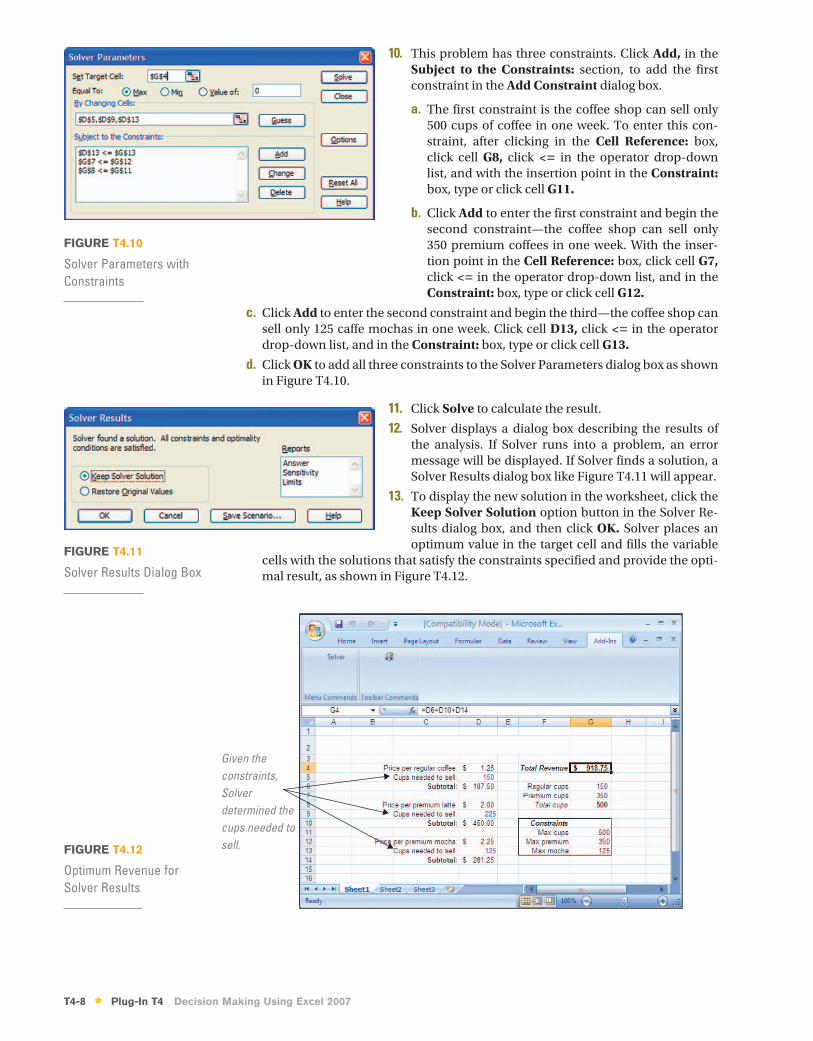
10. This problem has three constraints. Click Add, in the Subject to the Constraints: section, to add the first constraint in the Add Constraint dialog box.
The first constraint is the coffee shop can sell only 500 cups of coffee in one week. To enter this con-straint, after clicking in the Cell Reference: box, click cell G8, click <= in the operator drop-down list, and with the insertion point in the Constraint: box, type or click cell G11.
Click Add to enter the first constraint and begin the second constraint—the coffee shop can sell only 350 premium coffees in one week. With the inser-tion point in the Cell Reference: box, click cell G7, click <= in the operator drop-down list, and in the Constraint: box, type or click cell G12.
Click Add to enter the second constraint and begin the third—the coffee shop can sell only 125 caffe mochas in one week. Click cell D13, click <= in the operator drop-down list, and in the Constraint: box, type or click cell G13.
Click OK to add all three constraints to the Solver Parameters dialog box as shown in Figure T4.10.
11. Click Solve to calculate the result.
12. Solver displays a dialog box describing the results of the analysis. If Solver runs into a problem, an error message will be displayed. If Solver finds a solution, a Solver Results dialog box like Figure T4.11 will appear.
13. To display the new solution in the worksheet, click the Keep Solver Solution option button in the Solver Re-sults dialog box, and then click OK. Solver places an optimum value in the target cell and fills the variable
cells with the solutions that satisfy the constraints specified and provide the opti-mal result, as shown in Figure T4.12.
a.
b.
c.
d.
FIGURE T4.10
Solver Parameters with Constraints
FIGURE T4.11
Solver Results Dialog Box
Given the constraints, Solver determined the cups needed to sell.FIGURE T4.12
Optimum Revenue for Solver Results
haa10778_plugint04.indd 8haa10778_plugint04.indd 8 7/23/07 4:38:39 PM7/23/07 4:38:39 PM
Plug-In T4 Decision Making Using Excel 2007 * T4-9
EDITING A SOLVER FORECAST
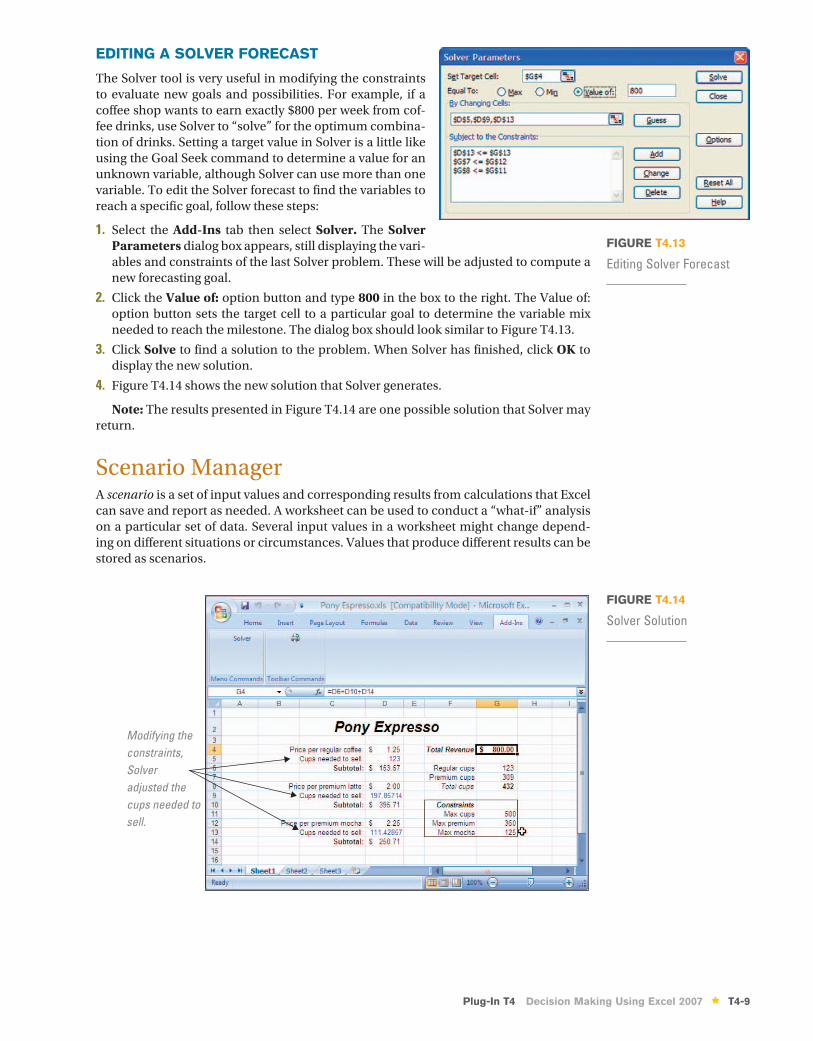
The Solver tool is very useful in modifying the constraints to evaluate new goals and possibilities. For example, if a coffee shop wants to earn exactly $800 per week from cof-fee drinks, use Solver to “solve” for the optimum combina-tion of drinks. Setting a target value in Solver is a little like using the Goal Seek command to determine a value for an unknown variable, although Solver can use more than one variable. To edit the Solver forecast to find the variables to reach a specific goal, follow these steps:
Select the Add-Ins tab then select Solver. The Solver Parameters dialog box appears, still displaying the vari-ables and constraints of the last Solver problem. These will be adjusted to compute a new forecasting goal.
Click the Value of: option button and type 800 in the box to the right. The Value of: option button sets the target cell to a particular goal to determine the variable mix needed to reach the milestone. The dialog box should look similar to Figure T4.13.
Click Solve to find a solution to the problem. When Solver has finished, click OK to display the new solution.
Figure T4.14 shows the new solution that Solver generates.
Note: The results presented in Figure T4.14 are one possible solution that Solver may return.
Scenario ManagerA scenario is a set of input values and corresponding results from calculations that Excel can save and report as needed. A worksheet can be used to conduct a “what-if” analysis on a particular set of data. Several input values in a worksheet might change depend-ing on different situations or circumstances. Values that produce different results can be stored as scenarios.
1.
2.
3.
4.
FIGURE T4.13
Editing Solver Forecast
Modifying the constraints, Solver adjusted the cups needed to sell.
FIGURE T4.14
Solver Solution
haa10778_plugint04.indd 9haa10778_plugint04.indd 9 7/23/07 4:38:40 PM7/23/07 4:38:40 PM
T4-10 * Plug-In T4 Decision Making Using Excel 2007
Excel’s Scenario Manager allows 32 different scenarios or groups of values to be de-fined. The Scenario Manager can then be used to selectively display the desired values or scenario in the worksheet. The Scenario Manager eliminates the need to have multiple copies of the same worksheet representing different situations. For each group of input values a scenario must be named and stored before it can be used.
SETTING UP SCENARIOS
Each group of input values or scenarios must be named and stored before it can be used. Scenarios are stored with the worksheet. To set up a scenario:
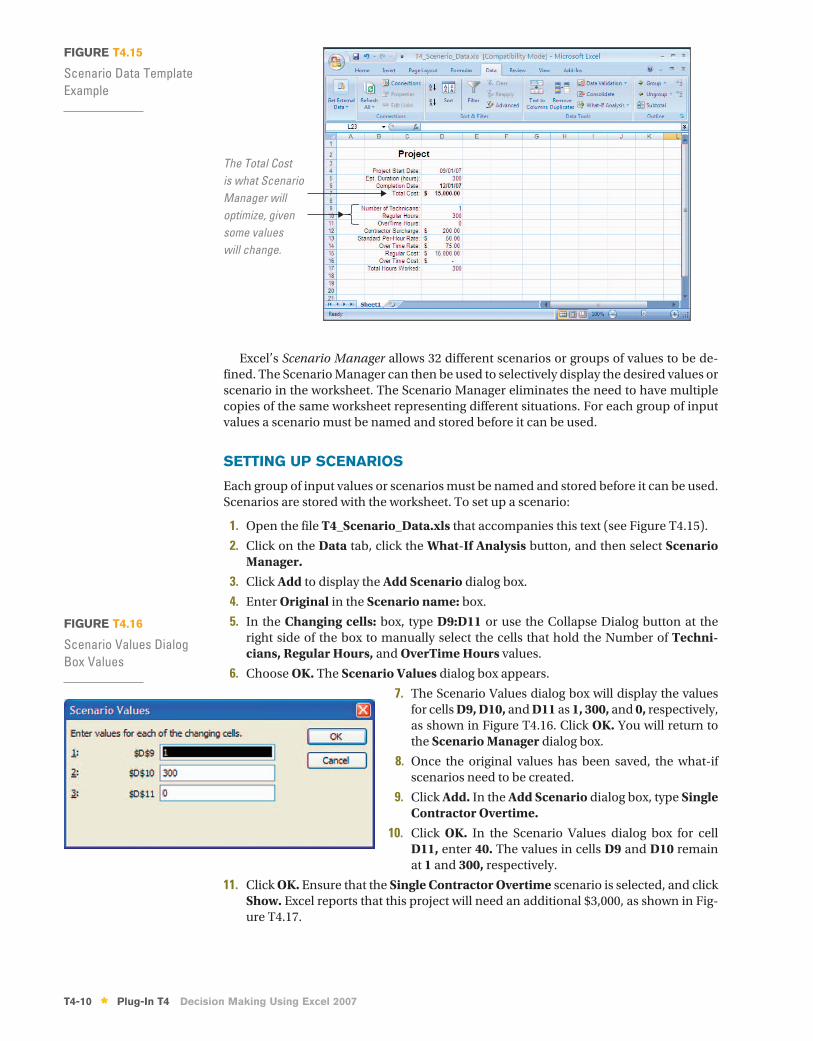
1. Open the file T4_Scenario_Data.xls that accompanies this text (see Figure T4.15).
2. Click on the Data tab, click the What-If Analysis button, and then select Scenario Manager.
3. Click Add to display the Add Scenario dialog box.
4. Enter Original in the Scenario name: box.
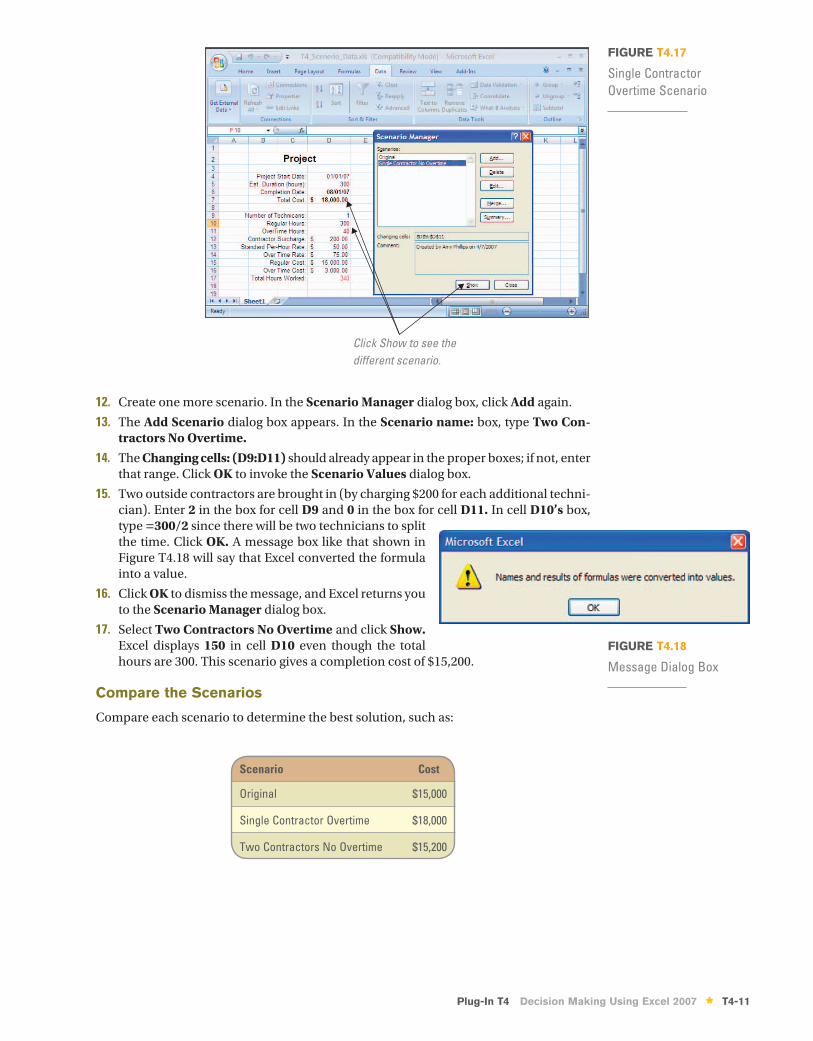
5. In the Changing cells: box, type D9:D11 or use the Collapse Dialog button at the right side of the box to manually select the cells that hold the Number of Techni-cians, Regular Hours, and OverTime Hours values.
6. Choose OK. The Scenario Values dialog box appears.
7. The Scenario Values dialog box will display the values for cells D9, D10, and D11 as 1, 300, and 0, respectively, as shown in Figure T4.16. Click OK. You will return to the Scenario Manager dialog box.
8. Once the original values has been saved, the what-if scenarios need to be created.
9. Click Add. In the Add Scenario dialog box, type Single Contractor Overtime.
10. Click OK. In the Scenario Values dialog box for cell D11, enter 40. The values in cells D9 and D10 remain at 1 and 300, respectively.
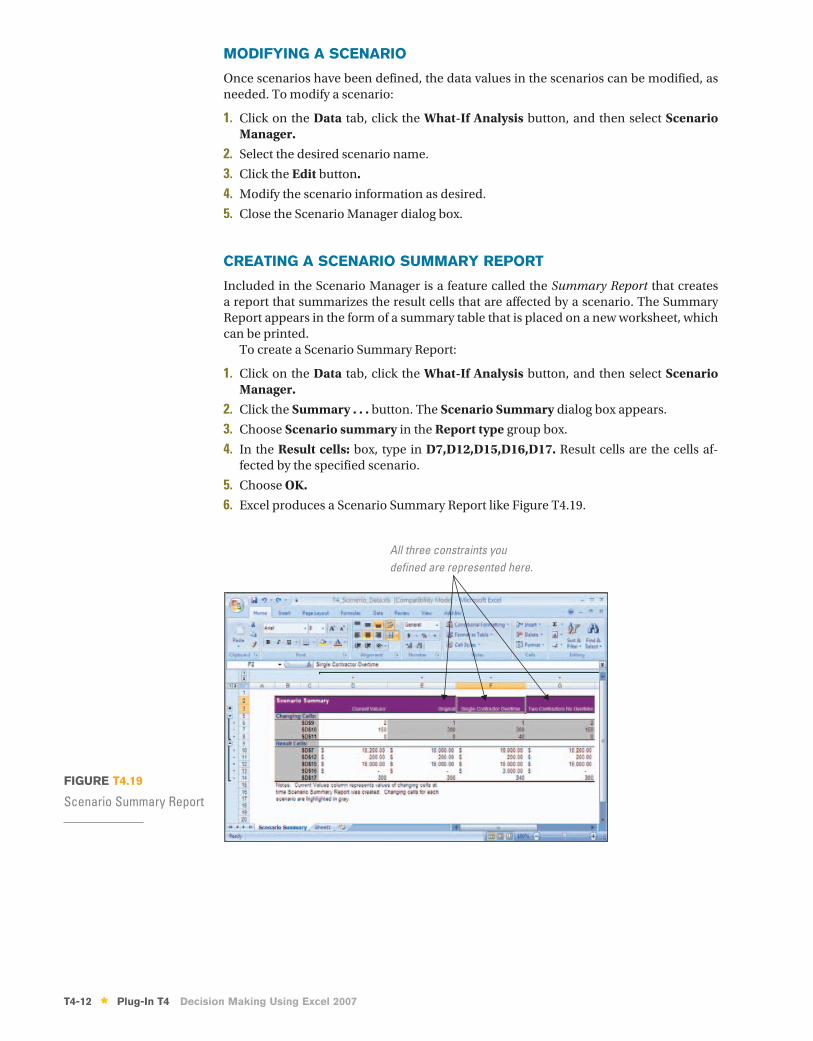
11. Click OK. Ensure that the Single Contractor Overtime scenario is selected, and click Show. Excel reports that this project will need an additional $3,000, as shown in Fig-ure T4.17.
The Total Cost is what Scenario Manager will optimize, given some values will change.
FIGURE T4.15
Scenario Data Template Example
FIGURE T4.16
Scenario Values Dialog Box Values
haa10778_plugint04.indd 10haa10778_plugint04.indd 10 7/23/07 4:38:41 PM7/23/07 4:38:41 PM
Plug-In T4 Decision Making Using Excel 2007 * T4-11
12. Create one more scenario. In the Scenario Manager dialog box, click Add again.
13. The Add Scenario dialog box appears. In the Scenario name: box, type Two Con-tractors No Overtime.
14. The Changing cells: (D9:D11) should already appear in the proper boxes; if not, enter that range. Click OK to invoke the Scenario Values dialog box.
15. Two outside contractors are brought in (by charging $200 for each additional techni-cian). Enter 2 in the box for cell D9 and 0 in the box for cell D11. In cell D10’s box, type =300/2 since there will be two technicians to split the time. Click OK. A message box like that shown in Figure T4.18 will say that Excel converted the formula into a value.
16. Click OK to dismiss the message, and Excel returns you to the Scenario Manager dialog box.
17. Select Two Contractors No Overtime and click Show. Excel displays 150 in cell D10 even though the total hours are 300. This scenario gives a completion cost of $15,200.
Compare the Scenarios
Compare each scenario to determine the best solution, such as:
Click Show to see the different scenario.
FIGURE T4.17
Single Contractor Overtime Scenario
FIGURE T4.18
Message Dialog Box
Scenario Cost
Original $15,000
Single Contractor Overtime $18,000
Two Contractors No Overtime $15,200
haa10778_plugint04.indd 11haa10778_plugint04.indd 11 7/23/07 4:38:42 PM7/23/07 4:38:42 PM
T4-12 * Plug-In T4 Decision Making Using Excel 2007
MODIFYING A SCENARIO
Once scenarios have been defined, the data values in the scenarios can be modified, as needed. To modify a scenario:
Click on the Data tab, click the What-If Analysis button, and then select Scenario Manager.
Select the desired scenario name.
Click the Edit button.
Modify the scenario information as desired.
Close the Scenario Manager dialog box.
CREATING A SCENARIO SUMMARY REPORT
Included in the Scenario Manager is a feature called the Summary Report that creates a report that summarizes the result cells that are affected by a scenario. The Summary Report appears in the form of a summary table that is placed on a new worksheet, which can be printed.
To create a Scenario Summary Report:
Click on the Data tab, click the What-If Analysis button, and then select Scenario Manager.
Click the Summary . . . button. The Scenario Summary dialog box appears.
Choose Scenario summary in the Report type group box.
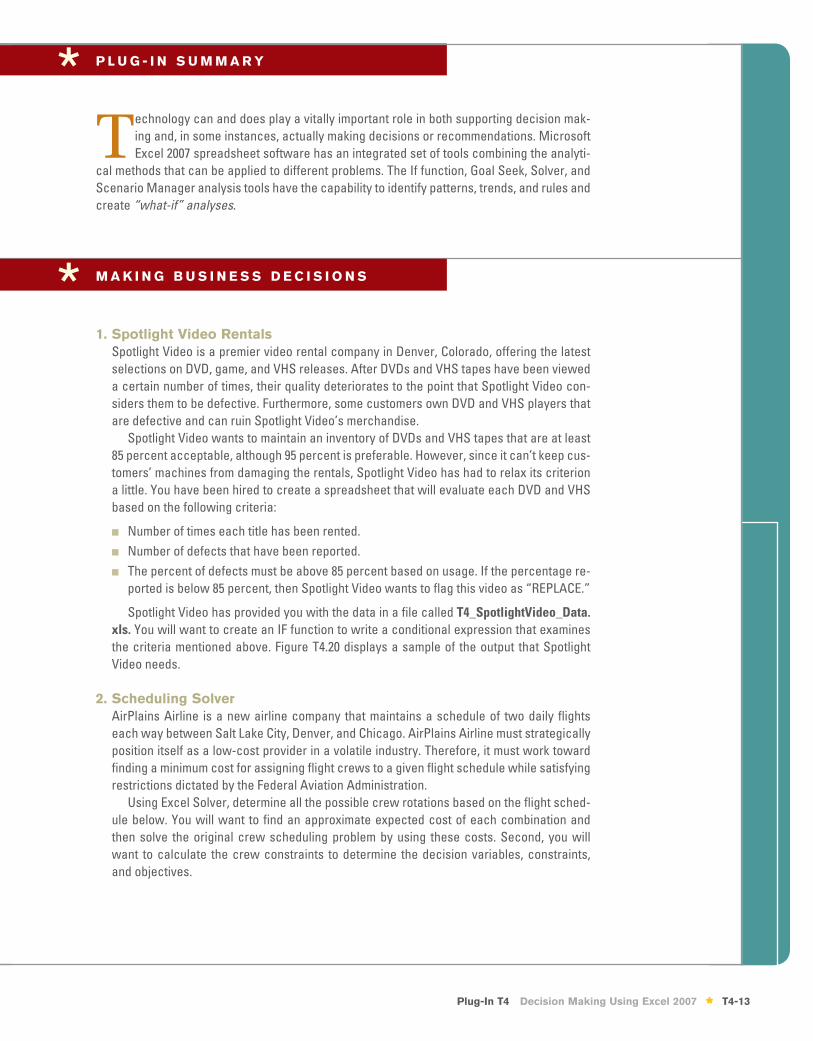
In the Result cells: box, type in D7,D12,D15,D16,D17. Result cells are the cells af-fected by the specified scenario.
Choose OK.
Excel produces a Scenario Summary Report like Figure T4.19.
1.
2.3.4.5.
1.
2.3.4.
5.6.
All three constraints you defined are represented here.
FIGURE T4.19
Scenario Summary Report
haa10778_plugint04.indd 12haa10778_plugint04.indd 12 7/23/07 4:38:44 PM7/23/07 4:38:44 PM
Plug-In T4 Decision Making Using Excel 2007 * T4-13
Technology can and does play a vitally important role in both supporting decision mak-ing and, in some instances, actually making decisions or recommendations. Microsoft Excel 2007 spreadsheet software has an integrated set of tools combining the analyti-
cal methods that can be applied to different problems. The If function, Goal Seek, Solver, and Scenario Manager analysis tools have the capability to identify patterns, trends, and rules and create “what-if” analyses.
P L U G - I N S U M M A R Y
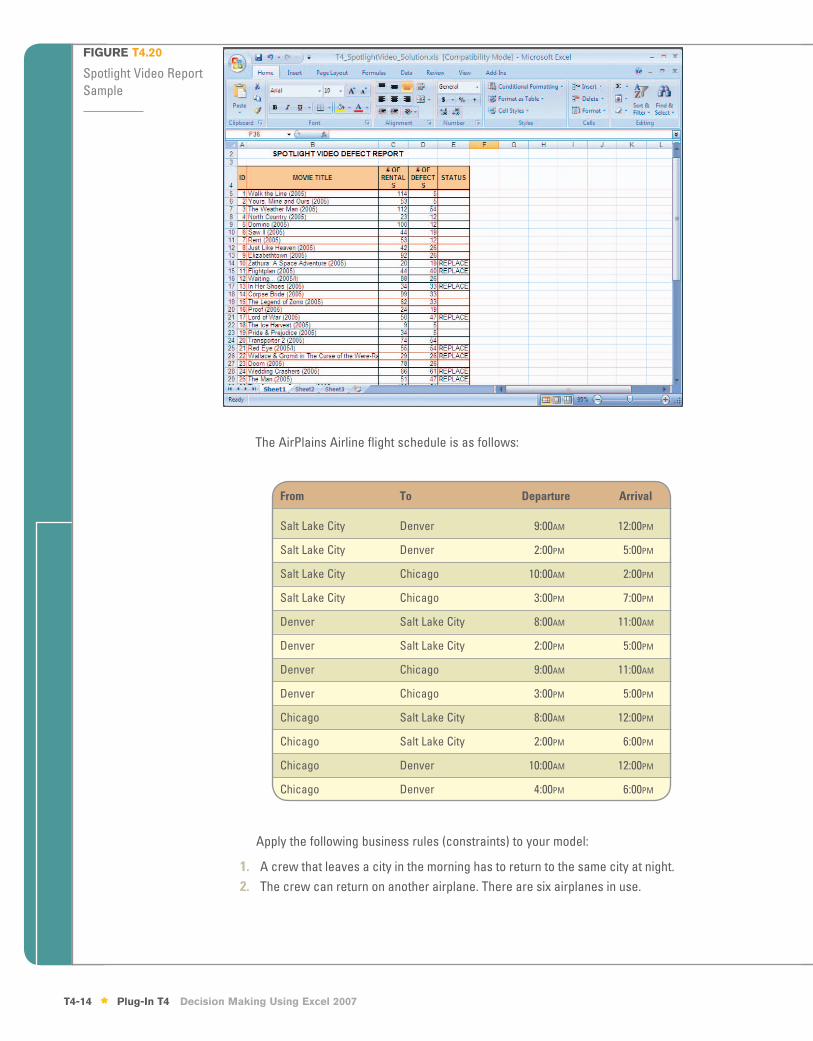
1. Spotlight Video RentalsSpotlight Video is a premier video rental company in Denver, Colorado, offering the latest selections on DVD, game, and VHS releases. After DVDs and VHS tapes have been viewed a certain number of times, their quality deteriorates to the point that Spotlight Video con-siders them to be defective. Furthermore, some customers own DVD and VHS players that are defective and can ruin Spotlight Video’s merchandise.
Spotlight Video wants to maintain an inventory of DVDs and VHS tapes that are at least 85 percent acceptable, although 95 percent is preferable. However, since it can’t keep cus-tomers’ machines from damaging the rentals, Spotlight Video has had to relax its criterion a little. You have been hired to create a spreadsheet that will evaluate each DVD and VHS based on the following criteria:
Number of times each title has been rented.Number of defects that have been reported.The percent of defects must be above 85 percent based on usage. If the percentage re-ported is below 85 percent, then Spotlight Video wants to flag this video as “REPLACE.”
Spotlight Video has provided you with the data in a file called T4_SpotlightVideo_Data.xls. You will want to create an IF function to write a conditional expression that examines the criteria mentioned above. Figure T4.20 displays a sample of the output that Spotlight Video needs.
2. Scheduling SolverAirPlains Airline is a new airline company that maintains a schedule of two daily flights each way between Salt Lake City, Denver, and Chicago. AirPlains Airline must strategically position itself as a low-cost provider in a volatile industry. Therefore, it must work toward finding a minimum cost for assigning flight crews to a given flight schedule while satisfying restrictions dictated by the Federal Aviation Administration.
Using Excel Solver, determine all the possible crew rotations based on the flight sched-ule below. You will want to find an approximate expected cost of each combination and then solve the original crew scheduling problem by using these costs. Second, you will want to calculate the crew constraints to determine the decision variables, constraints, and objectives.
■
■
■
M A K I N G B U S I N E S S D E C I S I O N S*
*
haa10778_plugint04.indd 13haa10778_plugint04.indd 13 7/23/07 4:38:45 PM7/23/07 4:38:45 PM
T4-14 * Plug-In T4 Decision Making Using Excel 2007
The AirPlains Airline flight schedule is as follows:
FIGURE T4.20
Spotlight Video Report Sample
From To Departure Arrival
Salt Lake City Denver 9:00AM 12:00PM
Salt Lake City Denver 2:00PM 5:00PM
Salt Lake City Chicago 10:00AM 2:00PM
Salt Lake City Chicago 3:00PM 7:00PM
Denver Salt Lake City 8:00AM 11:00AM
Denver Salt Lake City 2:00PM 5:00PM
Denver Chicago 9:00AM 11:00AM
Denver Chicago 3:00PM 5:00PM
Chicago Salt Lake City 8:00AM 12:00PM
Chicago Salt Lake City 2:00PM 6:00PM
Chicago Denver 10:00AM 12:00PM
Chicago Denver 4:00PM 6:00PM
Apply the following business rules (constraints) to your model:
A crew that leaves a city in the morning has to return to the same city at night.The crew can return on another airplane. There are six airplanes in use.
1.2.
haa10778_plugint04.indd 14haa10778_plugint04.indd 14 7/23/07 4:38:45 PM7/23/07 4:38:45 PM
Plug-In T4 Decision Making Using Excel 2007 * T4-15
When a crew is flying, the cost is $200 per hour.When a crew is waiting or returning, the cost is $75 per hour.
3. DVD SalesHans Hultgren, the sales manager for DVD Sales, wants to maximize his profit on the sale of portable DVD players. He already has two portable models he plans to sell:
3.4.
Products Retail Price Wholesale Cost
Panasonic DVD– LS50 $349.95 $192.47
Mintek MDP– 1810 $199.95 $109.99
Hans needs your help in calculating his maximum profit. First, he would like you to use the Web to locate the retail price of two other portable DVD players not listed in the table above. The wholesale price of each unit is 55 percent of the retail price for both units you find. Hans has two constraints:
Hans has $200,000 to purchase new DVD players. The total wholesale cost of the four types of DVD units must be less than $200,000.Hans must purchase a minimum of 100 units of each player from his wholesaler.
You want to use Excel Solver to maximize the total profit for Hans with the constraints mentioned above and limiting the number of units to positive integers.
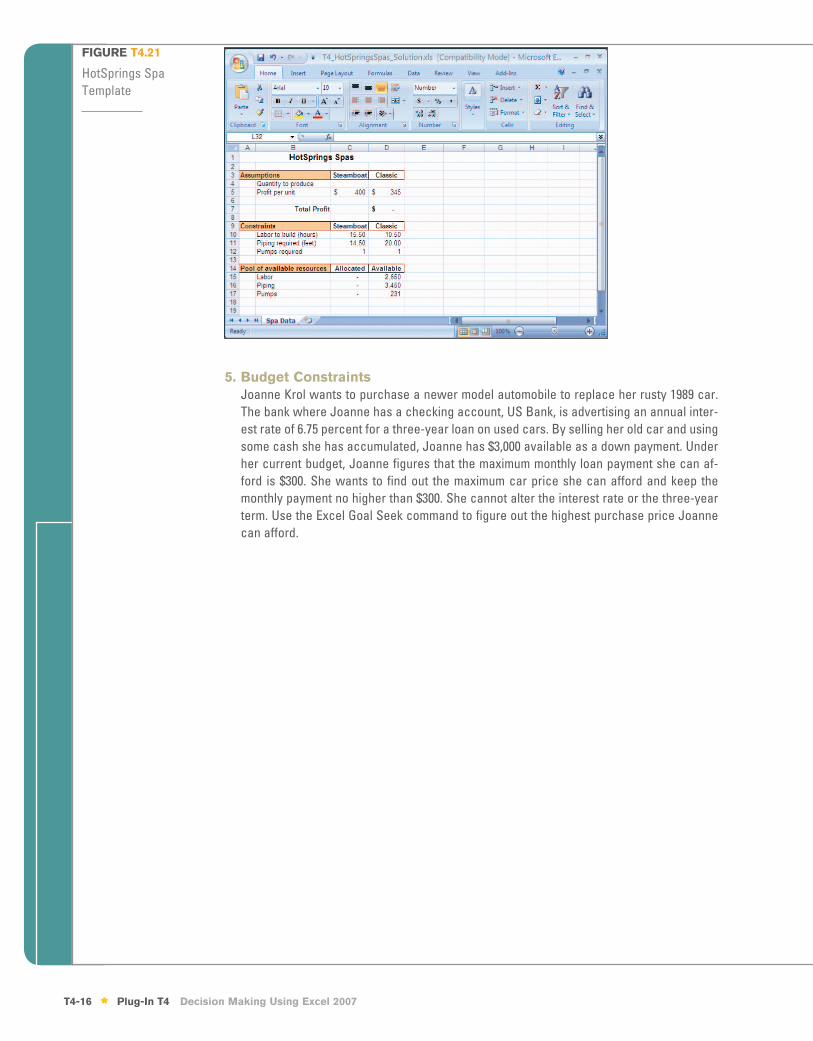
4. Maximizing ProfitHotSprings Spas manufactures and sells two spa models: the Steamboat and the Classic. HotSprings Spas receives spa bodies from another manufacturer and then adds a pump and tubing to circulate the water. The Steamboat model demands 15.5 hours of labor and 14.5 feet of tubing. The Classic model requires 10.5 hours of labor and uses 20 feet of tubing. Based on selling patterns, the owner, Deborah Liebson, has determined that the Steamboat model generates a profit of $400 per unit, and each Classic model generates $345 profit. While Deborah would like a large labor capacity and sufficient tubing and motors to build any number of spas, her resources are limited. For the next production period, Deborah has 2,650 labor hours, 3,450 feet of tubing, and 231 pumps available. Deborah needs assistance in figuring out how many Steamboat and Classic models to build in order to maximize her profit. Given the constraints above, use Solver to assist Deborah in her what-if analysis.
Deborah has provided you with a screen shot of a template you can use to get started (see Figure T4.21).
1.
2.
haa10778_plugint04.indd 15haa10778_plugint04.indd 15 7/23/07 4:38:47 PM7/23/07 4:38:47 PM
T4-16 * Plug-In T4 Decision Making Using Excel 2007
5. Budget Constraints Joanne Krol wants to purchase a newer model automobile to replace her rusty 1989 car. The bank where Joanne has a checking account, US Bank, is advertising an annual inter-est rate of 6.75 percent for a three-year loan on used cars. By selling her old car and using some cash she has accumulated, Joanne has $3,000 available as a down payment. Under her current budget, Joanne figures that the maximum monthly loan payment she can af-ford is $300. She wants to find out the maximum car price she can afford and keep the monthly payment no higher than $300. She cannot alter the interest rate or the three-year term. Use the Excel Goal Seek command to figure out the highest purchase price Joanne can afford.
FIGURE T4.21
HotSprings Spa Template
haa10778_plugint04.indd 16haa10778_plugint04.indd 16 7/23/07 4:38:47 PM7/23/07 4:38:47 PM