Embed Size (px)
Citation preview
MICROSOFT EXCEL AND SHAREPOINT TRAININGS
Kigali 12-30 June 2017
Okhla Industrial Area , Phase-1 New Delhi-110020 www.3alearningsolutions.com/[email protected]
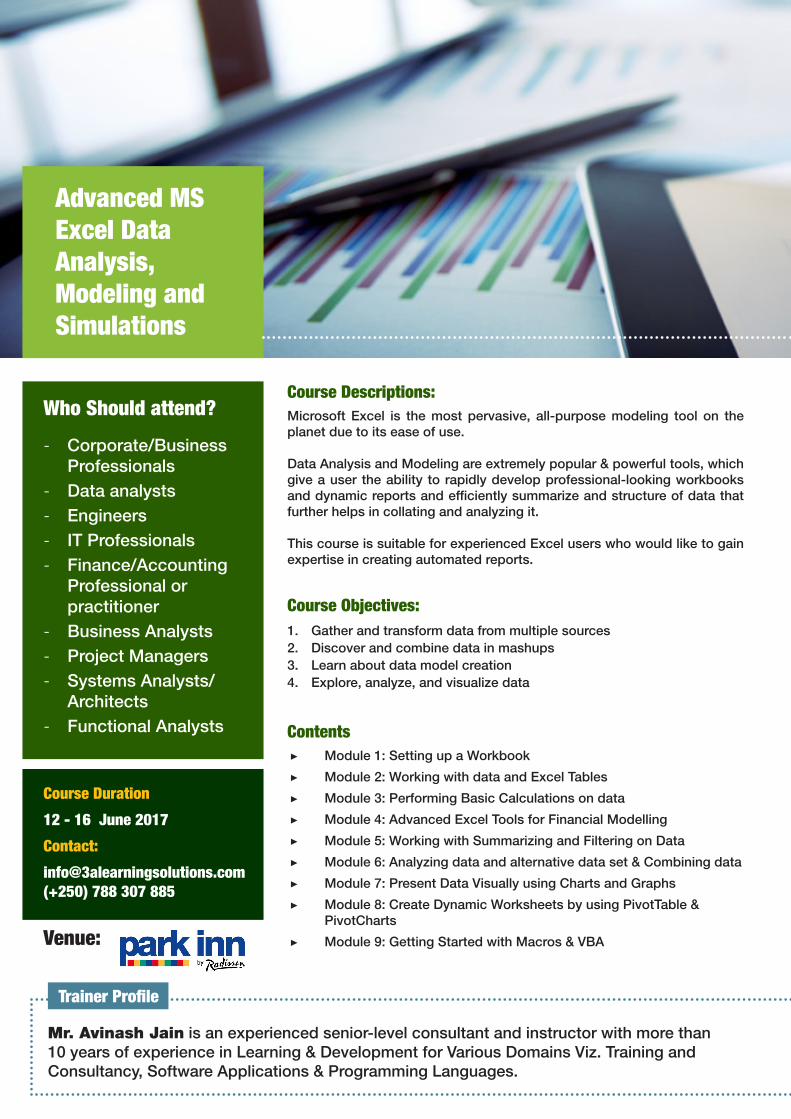
Course Descriptions:Microsoft Excel is the most pervasive, all-purpose modeling tool on the planet due to its ease of use.
Data Analysis and Modeling are extremely popular & powerful tools, which give a user the ability to rapidly develop professional-looking workbooks and dynamic reports and efficiently summarize and structure of data that further helps in collating and analyzing it.
This course is suitable for experienced Excel users who would like to gain expertise in creating automated reports.
Contents ▶ Module 1: Setting up a Workbook
▶ Module 2: Working with data and Excel Tables
▶ Module 3: Performing Basic Calculations on data
▶ Module 4: Advanced Excel Tools for Financial Modelling
▶ Module 5: Working with Summarizing and Filtering on Data
▶ Module 6: Analyzing data and alternative data set & Combining data
▶ Module 7: Present Data Visually using Charts and Graphs
▶ Module 8: Create Dynamic Worksheets by using PivotTable & PivotCharts
▶ Module 9: Getting Started with Macros & VBA
Advanced MS Excel Data Analysis, Modeling and Simulations
Trainer Profile
Course Duration
12 - 16 June 2017
Contact:
[email protected](+250) 788 307 885
Venue:
Who Should attend?
- Corporate/Business Professionals
- Data analysts - Engineers - IT Professionals - Finance/Accounting
Professional or practitioner
- Business Analysts - Project Managers - Systems Analysts/
Architects - Functional Analysts
Course Objectives:1. Gather and transform data from multiple sources2. Discover and combine data in mashups3. Learn about data model creation4. Explore, analyze, and visualize data
Mr. Avinash Jain is an experienced senior-level consultant and instructor with more than 10 years of experience in Learning & Development for Various Domains Viz. Training and Consultancy, Software Applications & Programming Languages.
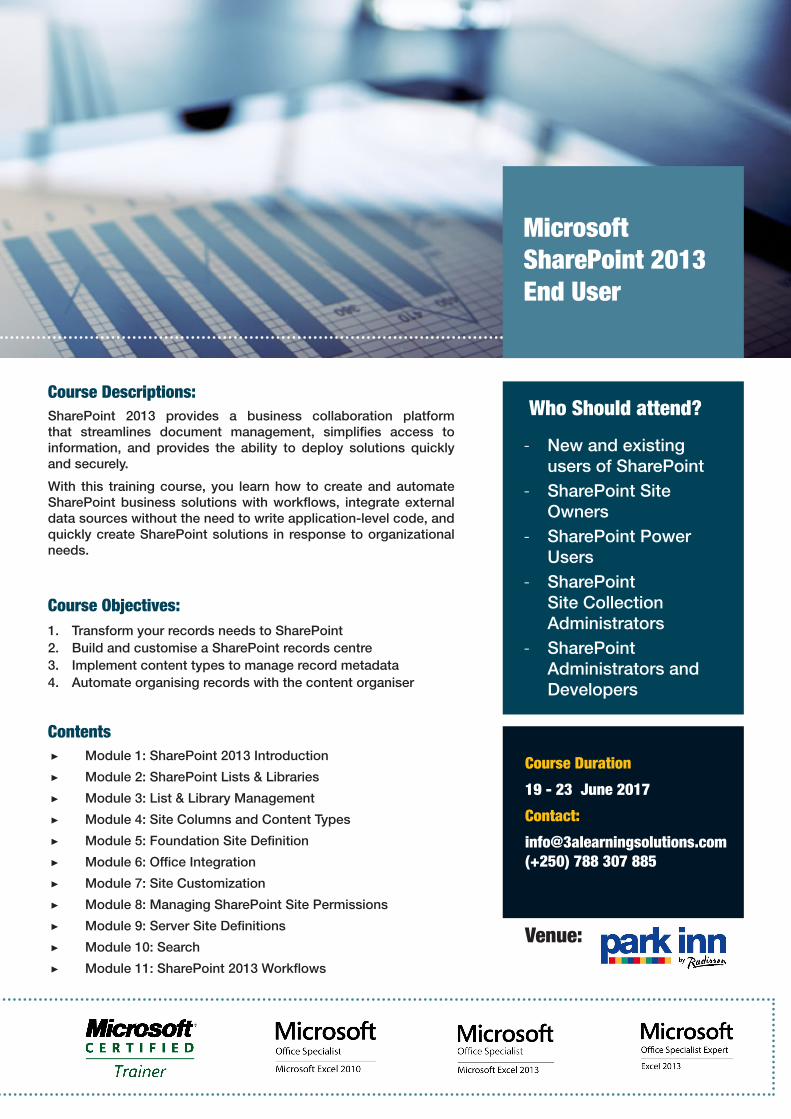
Course Descriptions:SharePoint 2013 provides a business collaboration platform that streamlines document management, simplifies access to information, and provides the ability to deploy solutions quickly and securely.
With this training course, you learn how to create and automate SharePoint business solutions with workflows, integrate external data sources without the need to write application-level code, and quickly create SharePoint solutions in response to organizational needs.
Contents ▶ Module 1: SharePoint 2013 Introduction
▶ Module 2: SharePoint Lists & Libraries
▶ Module 3: List & Library Management
▶ Module 4: Site Columns and Content Types
▶ Module 5: Foundation Site Definition
▶ Module 6: Office Integration
▶ Module 7: Site Customization
▶ Module 8: Managing SharePoint Site Permissions
▶ Module 9: Server Site Definitions
▶ Module 10: Search
▶ Module 11: SharePoint 2013 Workflows
Microsoft SharePoint 2013 End User
Course Duration
19 - 23 June 2017
Contact:
[email protected](+250) 788 307 885
Venue:
Who Should attend?
- New and existing users of SharePoint
- SharePoint Site Owners
- SharePoint Power Users
- SharePoint Site Collection Administrators
- SharePoint Administrators and Developers
Course Objectives:1. Transform your records needs to SharePoint2. Build and customise a SharePoint records centre3. Implement content types to manage record metadata4. Automate organising records with the content organiser
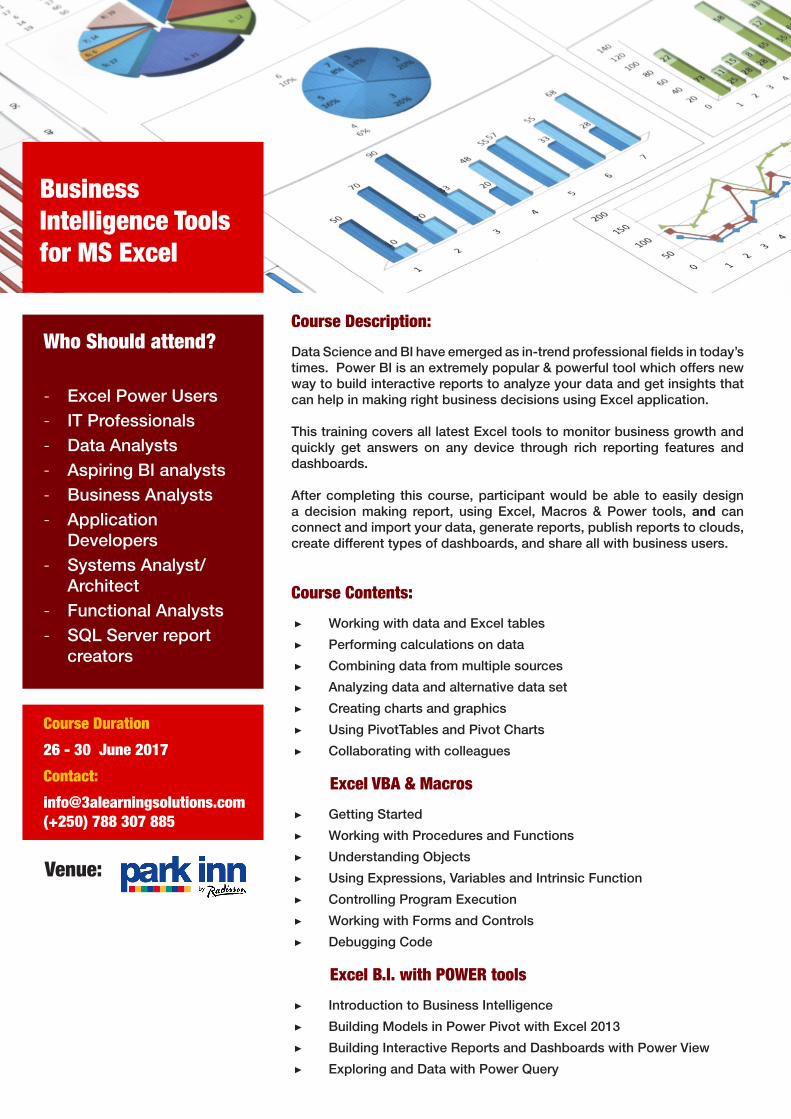
Course Description:
Data Science and BI have emerged as in-trend professional fields in today’s times. Power BI is an extremely popular & powerful tool which offers new way to build interactive reports to analyze your data and get insights that can help in making right business decisions using Excel application.
This training covers all latest Excel tools to monitor business growth and quickly get answers on any device through rich reporting features and dashboards.
After completing this course, participant would be able to easily design a decision making report, using Excel, Macros & Power tools, and can connect and import your data, generate reports, publish reports to clouds, create different types of dashboards, and share all with business users.
Course Contents:
▶ Working with data and Excel tables
▶ Performing calculations on data
▶ Combining data from multiple sources
▶ Analyzing data and alternative data set
▶ Creating charts and graphics
▶ Using PivotTables and Pivot Charts
▶ Collaborating with colleagues
Excel VBA & Macros
▶ Getting Started
▶ Working with Procedures and Functions
▶ Understanding Objects
▶ Using Expressions, Variables and Intrinsic Function
▶ Controlling Program Execution
▶ Working with Forms and Controls
▶ Debugging Code
Excel B.I. with POWER tools
▶ Introduction to Business Intelligence
▶ Building Models in Power Pivot with Excel 2013
▶ Building Interactive Reports and Dashboards with Power View
▶ Exploring and Data with Power Query
Venue:
Who Should attend?
- Excel Power Users - IT Professionals - Data Analysts - Aspiring BI analysts - Business Analysts - Application
Developers - Systems Analyst/
Architect - Functional Analysts - SQL Server report
creators
Course Duration
26 - 30 June 2017
Contact:
[email protected](+250) 788 307 885
Business Intelligence Tools for MS Excel