Embed Size (px)
Citation preview

Debt Investor Update – 16/17 Results12 April 2017
Alan Stewart – CFO
Lynda Heywood – Group Treasurer

2
Positive sales growth1 Strong profit growth2 Strong cash generation3
A year of strong performance
£47.9bn £49.9bn
FY 15/16 FY 16/17
+4.3%
£2.1bn£2.3bn
FY 15/16 FY 16/17
+9.1%
1. Group sales growth at actual rates on a comparable days and a continuing operations basis.2. Group operating profit before exceptional items on a continuing operations basis.3. Retail cash generated from operations on a continuing operations basis.
£985m£1,280m
FY 15/16 FY 16/17
+30%

3
Customers recommend1 Colleague engagement2 Supplier viewpoint3
A year of strong performance
60%
70%
77%
FY 14/15 FY 15/16 FY 16/17
1. Reflects % of Fans minus % of Critics answering the question “Based on your visit, how likely is that you would recommend the following to a friend or colleague?” for large stores.2. Reflects % of colleagues recommending Tesco as a great place to work as part of “What Matters To You?” survey undertaken every January and August for the Group.3. Reflects % of suppliers responding positively when asked “Overall how satisfied are you with your experience of working with Tesco?” as part of the annual Supplier Viewpoint survey.
0
5
10
15
20
25
1 FY 14/15 FY 15/16 FY 16/17
NPS +6FY 16/17
70%
81% 83%
FY 14/15 FY 15/16 FY 16/17

4
+1.6% +1.7% +140,000
Volume-based recovery Transaction growth Increasing footfall1
A year of strong performance - UK
1. Data from Kantar Worldpanel – change in customer numbers from Feb 16 to Feb 17.

5
A year of strong performance - UK
1. 3Q 15/16 adjusted for the impact of non-repeated coupons in the prior year.2. Shows volume outperformance. Data is for Tesco Weeks 1-52 and is sourced from IRI Retail AdvantageTM, global insight providers to the retail industry.
IRI market definition excludes Aldi and Lidl.
(7.0)%
4.0%
1Q 2Q 3Q 4Q 1Q 2Q 3Q 4Q 1Q 2Q 3Q 4Q 1Q 2Q 3Q 4Q 1Q 2Q 3Q 4Q 1Q 2Q 3Q 4Q2011/12 2012/13 2013/14 2015/161 2016/172014/15
0.0% 1.0% 2.0% 3.0% 4.0% 5.0%
General Merchandise
Packaged
Fresh
Total Food
Total Store
Market Outperformance2
FY 16/17
(3.0)% (2.0)% (1.0)% 0.0% 1.0% 2.0% 3.0% 4.0% 5.0%
General Merchandise
Packaged
Fresh
Total Food
Total Store
Market Outperformance2
4Q 16/17
UK like-for-like volume

6
+0.5%
Asia +4.0%Europe+0.5%
Volume growth Sales growth1 Portfolio simplification
A year of consolidation – International
1. Sales growth ay constant exchange rates on a comparable days basis.

7
Our six strategic drivers – a progress update
1. A differentiated brand
2. Reduce operating costs
3. Generate £9bn cash
4. Max the mix
5. Maximise value from property
6. Innovation
• YouGov most improved brand
• £226m of cost savings
• Group operating margin of 2.3%
• Released £0.5bn value
• 2,422 new products, PayQwiqFree From Retailer of the Year
• £2.3bn retail cash generation

8
Group performance
Continuing operations FY 16/17Change
constant rates
Change actual rates
Group sales (exc. VAT, exc. Fuel)1 £49.9bn 1.1% 4.3%
Group operating profit before exceptional items £1,280m 24.9% 29.9%
Exceptional items £(263)m n/m n/m
Group statutory operating profit £1,017m (11.8)% (5.1)%
Group PBT before exceptional items and net pension finance costs £842m 54.1% 71.8%
Diluted EPS before exceptional items and net pension finance costs 7.90p - 40.8%
1. Change shown on a comparable days basis.

9
Segmental performance
Sales Operating profit before exceptional items
FY 16/17 FY 15/16Change
constant rates 1
Changeactualrates1 FY 16/17 FY 15/16
Change constant
rates Changeactual rates
UK & ROI £37.7bn £37.2bn 0.6% 1.4% £803m £503m 57.7% 59.6%
International £11.2bn £9.7bn 2.1% 15.2% £320m £320m (12.5)% 0.0%
Bank £1.0bn £1.0bn 6.0% 6.0% £157m £162m (3.1)% (3.1)%
Group £49.9bn £47.9bn 1.1% 4.3% £1,280m £985m 24.9% 29.9%
1. Change shown on a comparable days basis.

10
FY 16/17 FY 15/16
Net impairment1 £(6)m £(423)m
Restructuring and redundancy £(199)m £(126)m
Tesco Bank customer redress £(45)m -
Interchange settlement £57m -
Property transactions £165m £156m
Provision for SFO and FCA obligations £(235)m -Past service credit and associated costs arising on UK defined benefit pension scheme - £480m
Total exceptional items in operating profit £(263)m £87m
Exceptional items
1. Net impairment of property, plant and equipment, onerous lease provisions and intangible assets.

11
Finance income and costs
FY 16/17 FY 15/16
Interest received £48m £29m
IAS 32 and 39 ‘Financial instruments’ - fair value measurements £61m £(19)m
Interest payable £(523)m £(490)m
Capitalised interest £6m £6m
IAS 19 net pension finance costs £(113)m £(155)m
Net finance costs1 £(521)m £(629)m
1. Statutory net finance costs include a £(244)m (FY 15/16 £(220)m) impact from FX losses on translation of balances received from Korea disposal being held in a non-Sterling subsidiary.

12
1,690
2,278
201
387
(582)
(952)744
286
133
219 1,381
Cash flow fromretail operations
Impact fromexceptionals and
Turkey
Underlying workingcapital
Retail cashgenerated from
operations
Interest and Tax Capex Free cash flow Net impact ofdisposals
Net impact ofproperty disposals
Other Reduction in netdebt
Movement in net debt£m
1. Before buyback of property
1

13
Capex on existing space / existing businesses
Asia£262m
UK & ROI£731m
Europe£141m
Capex on new space / new businesses
Capital expenditure
Excludes capex on Tesco Bank and dunnhumby

14
£8.5bn
£5.1bn
£3.7bn
FY 14/15 FY 15/16 FY 16/17
Net debt
£9.4bn
£7.8bn£7.4bn
FY 14/15 FY 15/16 FY 16/17
Lease commitments
Total indebtedness
£3.9bn
£2.6bn
£5.5bn
FY 14/15 FY 15/16 FY 16/17
Pension deficit

15
Property1
FY 16/17 FY 15/16
% selling space ownedUK & ROI 52% 52%International 74% 71%Group 63% 61%% total property owned - by value2
UK & ROI 50% 47%International 78% 75%Group 57% 54%
1. Based on continuing operations and does not include impact of April 17 British Land transaction.2. Excluding fixtures and fittings.

16
Pension scheme
• IAS 19 deficit calculation impacted by drop in corporate yields –no change in underlying cash commitments to pension members
• Asset de-risking strategy completed• Continued strong performance of scheme assets• Long-term deficit funding plan of £270m per annum cash contribution • Triennial valuation process started in March 2017

17
Improving debt metrics
FY 16/17 1H 16/17 FY 15/16Net Debt/ EBITDA1 1.6x 2.1x 2.7xFixed Charge Cover2 2.2x 2.0x 1.9xTotal indebtedness ratio3 5.0x 5.6x 5.1x
1. EBITDA is based on continuing operations (excluding Turkey)2. EBITDAR/(Interest + Rent)3. Net Debt + pension deficit + NPV of lease obligations / EBITDAR

18
Credit ratings
Agency Long Term Rating Short Term Rating Outlook
S & P BB+ B Stable
Fitch BB+ B Stable
Moody's Ba1 NP Stable
Stable outlook from all three credit rating agencies

19
Credit spread performance
Source: Bloomberg.
50
100
150
200
250
300
350
400
450
500
Jun-2014 Oct-2014 Feb-2015 Jun-2015 Oct-2015 Feb-2016 Jun-2016 Oct-2016 Feb-2017
Tesco 5 year CDSItraxx CrossoverItraxx Europe (IG)

20
0
1
2
3
YE 1617 Available Cash
Interest Bearing Debt
Undrawn Committed Facilities
Strong liquidity position vs upcoming maturities
Weighted average maturity: 9.5 yearsWeighted average rate at year end: 4.08%

21
£3.0bn available cash (Retail ex Bank)
• excludes £0.8bn set aside for Booker
• net of overdrafts and cash in transit
£4.4bn of undrawn committed facilities
• £2.0bn maturing 2019
• £2.4bn maturing 2021
Liquidity Sources
£9.4bn
£10.2bn
£7.4bn
FY 15/16 HY 16/17 FY 16/17
Undrawn Committed Facilities Available Cash
Total Liquidity

22
Outstanding Debt & Funding Programmes
Funding Programmes SizeEuro Commercial Paper £2bnUS Commercial Paper $4bnEMTN Programme £15bn
Principal outstanding is shown after the impact of hedgingExcludes Tesco Bank and accrued interest
80% of outstanding debt is hedged back to GBP (remainder is in EUR)
£11bn £11bn
£9bn
FY 15/16 HY 16/17 FY 16/17
34%
40%
14%
12%GBP - MTN £3.0bn
EUR - MTN £3.5bn
USD - 144A £1.2m
GBP - Secured Debt £1.1bn
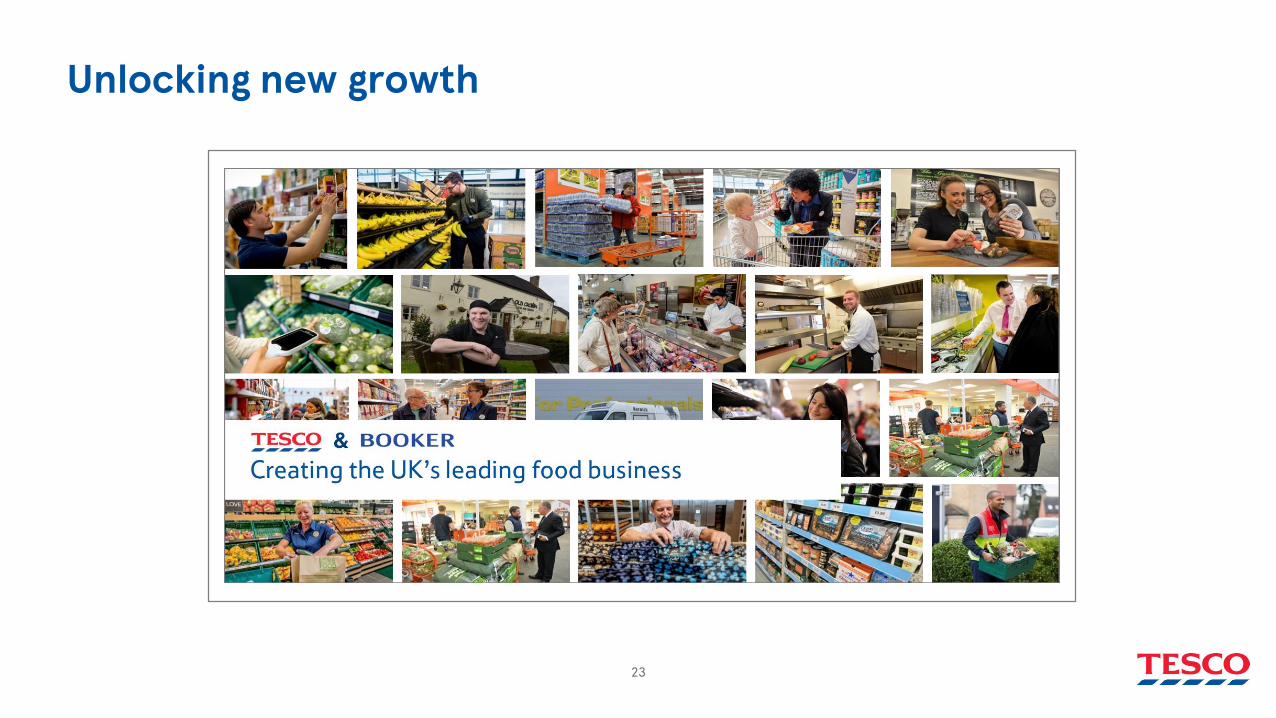
23
Unlocking new growth

24
PRODUCT CHANNELS CUSTOMER
The UK’s leading food business
In home
Out of
home
Improved choice / rangeEnhanced volume for efficiency
e.g. full crop utilisationEXISTING
NEW
Fresh Packaged GM Clothing Professional
Large stores
Small stores
Online
Wholesale
Incremental to standalone 3.5% - 4% margin ambition

25
Growth Synergies Multiple
The UK’s leading food business
At least£25m
At least£175m
9x EV/EBITinc. synergies

26
Core Core New
Geography Product Channel
Industryleading
> WACC2 years
Expertise Returns
£85bn market
growing at 3.8%
Growth1
1. Out of home market forecast for ‘15-’18.
&

27
Summary.• Continuing to deliver on our six strategic drivers• Results ahead of our expectations
- 30% increase in Group operating profit before exceptional items- 60% increase in UK & ROI operating profit before exceptional items- Improved cash generation including a £387m underlying working capital benefit
• Further improvement in credit metrics as debt repaid• Proposed merger with Booker unlocks new growth• Well-placed to prosper in a challenging environment

28
Appendix – Debt Metric Calculations
(£m) FY1617 H1 1617 (LTM) FY1516Net Debt 3.7 4.3 5.1Pension Deficit 5.5 5.9 2.6NPV of operating leases 7.4 7.8 7.8Total Indebtedness 16.7 18.0 15.5EBITDAR 3.3 3.2 3.1Total indebtedness ratio 5.0x 5.6x 5.1xEBITDA 2.3 2.1 1.9Net Debt/EBITDA 1.6x 2.1x 2.7xOperating Lease Expense 1.0 1.1 1.1Finance Costs 0.5 0.5 0.5Fixed Charges 1.5 1.6 1.6Fixed Charge cover ratio 2.2x 2.0x 1.9x

29
Disclaimer.This document may contain forward-looking statements that may or may not prove accurate. For example, statements regarding expected revenue growth and operating margins, market trends and our product pipeline are forward-looking statements. Phrases such as "aim", "plan", "intend", "anticipate", "well-placed", "believe", "estimate", "expect", "target", "consider" and similar expressions are generally intended to identify forward-looking statements. Forward-looking statements involve known and unknown risks, uncertainties and other factors that could cause actual results to differ materially from what is expressed or implied by the statements. Any forward-looking statement is based on information available to Tesco as of the date of the statement. All written or oral forward-looking statements attributable to Tesco are qualified by this caution. Tesco does not undertake any obligation to update or revise any forward-looking statement to reflect any change in circumstances or in Tesco’s expectations.