Embed Size (px)
Citation preview

D E B O R A H G O R D O N
A D A M B R A N D T
J O U L E B E R G E R S O N
J O N AT H A N K O O M E Y
C R E A T I N G A G L O B A L O I L - C L I M A T E I N D E X

D E B O R A H G O R D O N
A D A M B R A N D T
J O U L E B E R G E R S O N
J O N AT H A N K O O M E Y
C R E A T I N G A G L O B A L O I L - C L I M A T E I N D E X

© 2015 Carnegie Endowment for International Peace. All rights reserved.
Carnegie does not take institutional positions on public policy issues; the views represented herein are the authors’ own and do not necessarily reflect the views of Carnegie, its staff, or its trustees.
No part of this publication may be reproduced or transmitted in any form or by any means without permis-sion in writing from the Carnegie Endowment. Please direct inquiries to:
Carnegie Endowment for International Peace Publications Department 1779 Massachusetts Avenue, NW Washington, DC 20036 P: +1 202 483 7600 F: +1 202 483 1840 CarnegieEndowment.org
This publication can be downloaded at no cost at CarnegieEndowment.org/pubs.

GORDON | BRANDT | BERGERSON | KOOMEY iii
CONTENTS
ACRONYMS ............................................................................................................................ v
ACKNOWLEDGMENTS .................................................................................................... vii
ABOuT ThE AuThORS ..................................................................................................... ix
SuMMARY ...............................................................................................................................1
INTRODuCTION ...................................................................................................................3
OIL 2.0 ......................................................................................................................................7
ThE MOST ChALLENGING OILS ................................................................................... 11
CREATING AN OIL-CLIMATE INDEx ........................................................................... 13
MODELING upSTREAM OIL EMISSIONS ................................................................... 15
MODELING MIDSTREAM OIL EMISSIONS ................................................................21
iv KNOW YOUR OIL
CARNEGIE ENDOWMENT fOR INTERNATIONAL PEACE
MODELING DOWNSTREAM OIL EMISSIONS .........................................................29
OvERALL RESuLTS fROM OCI phASE I .................................................................... 35
fINDINGS AND RECOMMENDATIONS fROM OCI phASE I ............................. 39
ADDRESSING TOMORROW’S OIL-CLIMATE ChALLENGES .............................. 47
AppENDIx: OIL DATA GApS ........................................................................................... 51
NOTES ................................................................................................................................... 55
CARNEGIE ENDOWMENT fOR INTERNATIONAL pEACE .................................. 59

GORDON | BRANDT | BERGERSON | KOOMEY v
AGO — Atmospheric Gas Oil
ANS — Alaska North Slope
API — measure (in degrees) of an oil’s gravity or weight
AR — Atmospheric Residue
bbl — Barrel
C-B — Coke Burned
CNR — Catalytic Naphtha Reformer
CO2 — Carbon Dioxide
CO2 eq. — Carbon Dioxide Equivalent (including all GHGs)
dilbit — Diluted Bitumen
FCC — Fluid Catalytic Cracking
GHGs — Greenhouse Gases
GIS — Geographic Information System
ACRONYMS

vi KNOW YOUR OIL
CARNEGIE ENDOWMENT FOR INTERNATIONAL PEACE
GO — Gas Oil
GO-HC — Gas Oil-Hydrocracker
GOR — Gas-to-Oil Ratio
HC — Hydrocracker
HVGO — Heavy Vacuum Gas Oil
kg — Kilogram
km — Kilometer
LCA — Life-Cycle Assessment
LSR — Light Straight Run
LTO — Light Tight Oil
LVGO — Light Vacuum Gas Oil
mbd — Million barrels per day, also termed “mbpd”
MJ — Megajoule (unit of energy)
OCI — Oil-Climate Index
OPEC — Organization of the Petroleum Exporting Countries
OPEM — Oil Products Emissions Module
OPGEE — Oil Production Greenhouse Gas Emissions Estimator
PRELIM — Petroleum Refinery Life-cycle Inventory Model
RFG — Refinery Fuel Gas
SCO — Synthetic Crude Oil
SMR — Steam Methane Reformer
SOR — Steam-to-Oil Ratio
tonne — Metric Ton
VR — Vacuum Residue

GORDON | BRANDT | BERGERSON | KOOMEY vii
THIS WORK WOULD not have been possible without support from the blue moon fund, Oak Foundation, William and Flora Hewlett Foundation, ClimateWorks Foundation, and the Rockefeller Family Fund. Support from the Energy Foundation was also timely and helpful. We thank all of these organizations for their generosity. In particular, Dr. Ji-Qiang Zhang, Kristin Tracz, Tyler Gibson, Leslie Harroun, Margarita Parra, Joe Ryan, Anthony Eggert, Charles McElwee, Patty Monahan, Heidi Binko, and Larry Shapiro have provided important insights and encouragement throughout the development of the Oil-Climate Index project.
So many colleagues at the Carnegie Endowment were engaged and helped this project flourish. Thank you to Jessica Tuchman Mathews for her ongoing encouragement and to Ambassador William J. Burns, the new president of the Carnegie Endowment, who arrived just as the first phase of the index was concluding. Eugene Tan (Carnegie junior fellow, 2014–2015) worked tirelessly and provided tremendous project support. To the entire Carnegie communications team, you are amazing. We are indebted to Tom Carver, Tim Martin, Rebecca White, Samuel Brase, Jocelyn Soly, Ilonka Oszvald, Courtney Griffith, Jessica Katz, Lauren Dueck, Nick Parrott, and everyone else on the sixth floor. Oil data was a constant quest throughout the development of the Oil-Climate Index, and the Carnegie Endowment Library staff, Kathleen Higgs, Christopher Lao-Scott, and Keigh Hammond,
ACKNOWLEDGMENTS

viii KNOW YOUR OIL
CARNEGIE ENDOWMENT fOR INTERNATIONAL PEACE
were incredibly helpful in digging up assays. Julia Judson-Rea, David Livingston, Anisha Mehta, and David Burwell were there from the start and their support was incredibly valuable.
Numerous Stanford University colleagues contributed significantly to the project, includ-ing Kourosh Vafi, Sharad Bharadwaj, Yuchi Sun, Jacob Englander, and Zachary Schmidt (Analytics Press). Thank you to our University of Calgary colleagues who provided their continued research support, including Kavan Motazedi and former colleague Jessica Abella, as well as Heather MacLean from the University of Toronto.
We were very fortunate to have Development Seed onboard to create the OCI web tool. The entire team was phenomenal. Thank you to those experts who attended the Carnegie Endowment OCI Workshop in September 2014 and provided excellent feedback on our project, including Andrew Nicholls (Pacific Northwest National Laboratory), Anthony Andrews (Congressional Research Service), Bill Morrow (Lawrence Berkeley National Laboratory), Chris Malins (International Council on Clean Transportation), Erin Flanagan (Pembina Institute), Fabrice Vareille (U.S. Geological Survey), Greg Cooney (Booz Allen Hamilton and National Energy Technology Laboratory), Hassan El-Houjeiri (Shell), Ian Laurenzi (ExxonMobil), Jeremy Martin (Union of Concerned Scientists), Jim Duffy (California Air Resources Board), Michael Wang (Argonne National Laboratory), Nusa Urbancic (Transport & Environment), Quindi Franco (U.S. Government Accountability Office), Matthew McManus (U.S. Department of State, Energy & Natural Resources Bureau), Dean Bears, Trevor Demayo, and Susann Nordrum (Chevron), and Carmen Difiglio and Peter Whitman (U.S. Department of Energy).
Naturally, this report’s contents remain entirely the responsibility of its authors.

GORDON | BRANDT | BERGERSON | KOOMEY ix
dEBORAH GORdON is director of and a senior associate in the Energy and Climate Program at the Carnegie Endowment for International Peace. Her research focuses on the climate implications of unconventional oil and fossil fuels in the United States and around the world. Gordon founded the transportation program at the Union of Concerned Scientists, taught at the Yale School of Forestry and Environmental Studies, and worked at the U.S. Department of Energy’s Lawrence Berkeley National Laboratory. She began her career as a chemical engineer with Chevron and received a master’s degree in public policy from the University of California, Berkeley, where she developed DRIVE+, the first vehicle “feebate” policy proposal.
From 1996 to 2010, Gordon ran a successful consulting practice specializing in transporta-tion, energy, and environmental policy. She has served on National Academy of Sciences committees and the Transportation Research Board’s Energy Committee. Gordon has authored and contributed chapters to numerous books. The most recent, Two Billion Cars (with Daniel Sperling), provides a road map for navigating the biggest global environmental challenges of this century—cars and oil (Oxford University Press, 2009).
AdAm BRANdT is an assistant professor in the Department of Energy Resources Engineering at Stanford University. His research focuses on reducing the greenhouse gas
ABOUT THE AUTHORS

x KNOW YOUR OIL
CARNEGIE ENDOWMENT fOR INTERNATIONAL PEACE
impacts of energy production and consumption, with a focus on fossil energy systems. His research interests include life-cycle assessment of petroleum production and natural gas extraction. A particular interest of his is in unconventional fossil fuel resources such as oil sands, oil shale, and hydraulically fractured oil and gas resources. He also researches computational optimization of emissions mitigation technologies, such as carbon dioxide capture systems. Brandt received his doctorate from the Energy and Resources Group at the University of California, Berkeley.
JOULE BERGERSON is an assistant professor in the Chemical and Petroleum Engineering Department and the Center for Environmental Engineering Research and Education in the Schulich School of Engineering at the University of Calgary. Her primary research interests are systems-level analysis of energy system investment and management for policy and decisionmaking. The focus of Bergerson’s work is develop-ing tools and frameworks for the assessment of prospective technology options and their policy implications from a life-cycle perspective. To date, her work has addressed fossil- fuel-derived electricity, oil sands development, carbon capture and storage, renewable energy, and energy storage technologies.
JONATHAN KOOmEY is a research fellow at the Steyer-Taylor Center for Energy Policy and Finance at Stanford University. He has worked for more than two decades at the Lawrence Berkeley National Laboratory and has been a visiting professor at Stanford University, Yale University, and the University of California, Berkeley’s Energy and Resources Group. He was a lecturer in management at Stanford’s Graduate School of Business in the spring of 2013. Koomey holds master’s and doctoral degrees from the Energy and Resources Group at the University of California, Berkeley, and a bachelor’s in history of science from Harvard University. He is the author or co-author of nine books and more than 200 articles and reports. He is also one of the leading international experts on the economics of reducing greenhouse gas emissions, the effects of information tech-nology on resource use, and the energy use and economics of data centers. Koomey is the author of Turning Numbers Into Knowledge: Mastering the Art of Problem Solving (which has been translated into Chinese and Italian) and Cold Cash, Cool Climate: Science-Based Advice for Ecological Entrepreneurs (both books were published by Analytics Press).

GORDON | BRANDT | BERGERSON | KOOMEY 1
SUmmARY
OIL IS CHANGING. Conventional oil resources are dwindling as tight oil, oil sands, heavy oils, and others emerge. Technological advances mean that these unconventional hydrocarbon deposits in once-unreachable areas are now viable resources. Meanwhile, scientific evidence is mounting that climate change is occurring, but the climate impacts of these new oils are not well understood. The Carnegie Endowment’s Energy and Climate Program, Stanford University, and the University of Calgary have developed a first-of-its-kind Oil-Climate Index (OCI) to compare these resources.
ALL OILS ARE NOT CREATEd EqUAL
• Thirty global test oils were modeled during Phase 1 of the index.
• Greenhouse gas (GHG) emissions were analyzed throughout the entire oil supply chain—oil extraction, crude transport, refining, marketing, and product combustion and end use.
• There is an over 80 percent difference in total GHG emissions per barrel of the lowest GHG-emitting Phase 1 oil and the highest.
2 KNOW YOUR OIL
CARNEGIE ENDOWMENT fOR INTERNATIONAL PEACE
• Climate impacts vary whether crudes are measured based on their volumes, their products’ monetary values, or their products’ energy delivered.
• The GHG emission spread between oils is expected to grow as new, unconventional oils are identified.
• Each barrel of oil produces a variety of marketable products. Some are used to fuel cars and trucks, while others—such as petcoke and fuel oils—flow to different sectors. Developing policies that account for leakage of GHG emissions into all sectors is critical.
• The variations in oils’ climate impacts are not sufficiently factored into policymak-ing or priced into the market value of crudes or their petroleum products.
• As competition among new oils for market share mounts, it will be increasingly important to consider climate risks in prioritizing their development.
NExT STEPS FOR THE OCI
• In order to guide energy and climate decisionmaking, investors need to make realistic asset valuations and industry must make sound infrastructure plans. Policymakers need to condition permits, set standards, and price carbon. And the public needs information and incentives to make wise energy choices.
• The OCI can shape how these stakeholders address the climate impacts of oil, and the use of the index can foster critical public-private discussions about these issues.
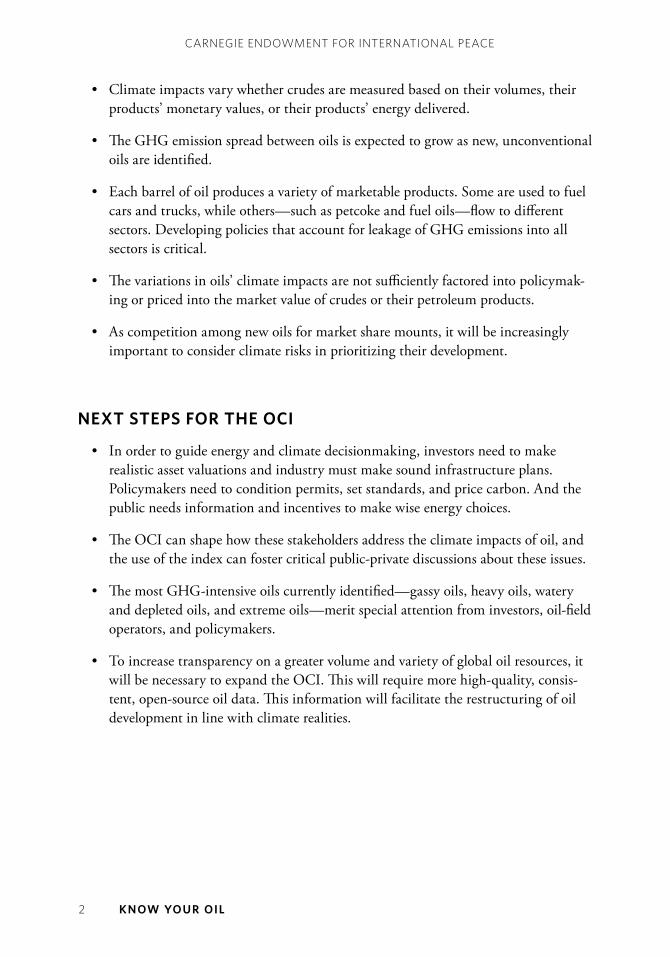
• The most GHG-intensive oils currently identified—gassy oils, heavy oils, watery and depleted oils, and extreme oils—merit special attention from investors, oil-field operators, and policymakers.
• To increase transparency on a greater volume and variety of global oil resources, it will be necessary to expand the OCI. This will require more high-quality, consis-tent, open-source oil data. This information will facilitate the restructuring of oil development in line with climate realities.

GORDON | BRANDT | BERGERSON | KOOMEY 3
INTROdUCTION
THE CHARACTER OF oil is changing. Consumers may not notice the transforma-tion—prices have fluctuated, but little else appears to have changed at the gas pump. Behind the scenes, though, the definition of oil is shifting in substantial ways. There is oil trapped tightly in shale rock, and oil pooled many miles below the oceans. Oil can be found in boreal forests, Arctic permafrost, and isolated geologic formations. Some oils are as thick as molasses or as gummy as tar, while others are solid or contain vastly more water or gas than normal.
Oil resources were once fairly homo-geneous, produced using conventional means and refined into a limited number of end products by relatively simple methods. This is no longer the case. Advancements in technology mean that a wider array of hydro-carbon deposits in once-unreachable areas are now viable, extractable resources. And the techniques to turn these unconventional oils into petroleum products are becoming increasingly complex.
As oil is changing, so, too, is the global climate. The year 2014 ranked as the earth’s warmest since 1880. Fossil fuels—oil along with coal and methane gas—are the major culprits.
As oil is changing, so, too, is the global climate.

4 KNOW YOUR OIL
CARNEGIE ENDOWMENT fOR INTERNATIONAL PEACE
The only way to determine the climate impacts of these previously untapped resources—and to compare how they stack up against one another—is to assess their greenhouse gas (GHG) emissions at each stage in the oil supply chain: exploration, extraction, processing, refining, transport, and end use. The more energy it takes to carry out these processes, the greater the impact on the climate. And in the extreme case of some of these oils, it may take nearly as much energy to produce, refine, and transport them as they provide to consumers. Moreover, each oil yields a different slate of petroleum products with different combustion characteristics and climate footprints.
The Oil-Climate Index (OCI) is a metric that takes into account the total life-cycle GHG emissions of individual oils—from upstream extraction to midstream refining to downstream end use. It offers a powerful, yet user-friendly, tool that allows investors, policymakers, industry, the public, and other stakeholders to compare crudes and assess their climate consequences both before development decisions are made as well as once operations are in progress. The Oil-Climate Index will also inform oil and climate policy making.
The index highlights two central facts: The fate of the entire oil barrel is critical to understanding and designing policies that reduce a crude oil’s climate impacts. And oils’ different climate impacts are not currently identified or priced into the market value of
competing crudes or their petro-leum products. As such, different oils may in fact entail very different carbon risks for resource owners or developers.
Analysis of the first 30 test oils to be modeled with the index reveals
that emission differences between oils are far greater than currently acknowledged. Wide emission ranges exist whether values are calculated per barrel of crude, per megajoule of products, or per dollar value of products, and it is expected that these emission ranges could grow as new, unconventional oils are identified.
There are several critical variables that lead to these variations in oils’ life-cycle climate emissions. They include how gas trapped with the oil is handled by producers, whether significant steam is required for oil production, if a lot of water is present as the oil res-ervoir depletes, how heavy (viscous) or deep the oil is, what type of refinery is used, and whether bottom-of-the-barrel products like petroleum coke (known as petcoke) are com-busted. Given these factors, the most climate-intensive oils currently identified—gassy oils, heavy oils, watery and depleted oils, and extreme oils—require special attention from investors, operators, and policymakers.
different oils may entail very different carbon risks for resource
owners or developers.

GORDON | BRANDT | BERGERSON | KOOMEY 5
Expanding the index to include more global oils is necessary in order to compare greater volumes of crudes. This requires more transparent, high-quality, consistent, accessible, open-source data. As competition mounts between new oils, information about emerging resources is needed to increase market efficiency, expand choices, leverage opportunities, and address climate challenges.


GORDON | BRANDT | BERGERSON | KOOMEY 7
OIL 2.0
Advancements in technology that have unlocked unconventional hydrocarbon deposits in once-unreachable areas are costly and risky in both private and social terms.
CONCERNS ABOUT OIL scarcity beset the world for nearly half a century, but that may no longer be the overriding worry. Larger questions loom about the changing nature of oil resources, their unknown characteristics, their climate and other environmental impacts, and policies to safely guide their development and use.
Indeed, there are thousands of oils avail-able globally for production and use. The earth is stocked with a surfeit of hydrocar-bons. As of 2013, there are an estimated 24 trillion barrels of oil in place, of which 6 trillion barrels are deemed technologi-cally recoverable.
These resources take different forms—from rocky kerogen to sludgy tar to vola-tile gassy liquids. They exist under vastly different conditions: deep and shallow; onshore and offshore; pooled and dispersed; and in deserts, permafrost, rainforests, and grasslands. An evolving array of techniques must be employed to transform them into a myriad of petroleum products, some more valuable than others, which flow in all directions to every economic sector and most household products.

8 KNOW YOUR OIL
CARNEGIE ENDOWMENT fOR INTERNATIONAL PEACE
Advancements in technology that have unlocked unconventional hydrocarbon deposits in once-unreachable areas are costly and risky in both private and social terms. Many of these advancements result in larger GHG emissions than traditional extraction methods, and some oils have more than 80 percent higher emissions per barrel than others (see figure 1).
Consider a few examples. For California’s Midway Sunset oil field, a sizable portion of the oil’s own energy content is used before any of the petroleum products the field ultimately provides reach consumers. This century-old oil field requires large volumes of steam to be injected into the reservoir to loosen the oil and allow it to flow. Generating this steam requires up to one-third of the energy content of the oil itself, in the form of natural gas. The water content of this oil is high and therefore takes extra energy to lift. Much of its oil is very heavy and requires energy-intensive, complex refining techniques. The combina-tion of energy used in extraction and refining means almost half of Midway Sunset’s total greenhouse gas emissions are released before the resource even gets to market.
900
800
700
600
500
400
0
Ligh
t
Conv
entio
nal
Ultr
a-D
eep
Hig
h G
as
Hea
vy
Dep
lete
d/W
ater
y O
il
Hig
h St
eam
Hig
h Fl
are
Extr
a-H
eavy
Oil-Climate Category
Tota
l GH
G E
mis
sion
s(k
g CO
2 eq
./bb
l cru
de)
FIGURE 1GHG Emission Ranges for 30 Phase 1 OCI Test Oils, by Category
Source: Authors’ calculations (calculations will be made available online at CarnegieEndowment.org)
Notes: “X” represents average GHG emissions for OCI test oils in each oil category. Extra-heavy oils include oil sands.

GORDON | BRANDT | BERGERSON | KOOMEY 9
Other oils, such as Norway Ekofisk, fare much better in these regards. This light oil is more easily produced. Extraction operations are tightly regulated by the Norwegian gov-ernment; as such, the gas produced with the oil is gathered and sold instead of burned (or flared) on-site and wasted. Ekofisk oil is processed by the simplest hydroskimming refin-ery, and less than 10 percent of its greenhouse gases are emitted before it gets to market.
Oil markets, meanwhile, are durable given the lack of ready substitutes. Oil consumption has marched steadily upward, from 77 million barrels per day (mbd) in 2000 to 92 mbd in 2014, despite a major global economic downturn. Oil dominates the transportation sector, providing 93 percent of motor-ized transportation energy. Overall, the oil sector is responsible for a reported 35 percent of global GHG emissions.
Parsing oils by their climate impacts allows multiple stakeholders, each with their own objectives, to consider climate risks in prioritizing the development of future oils and the adoption of greater policy oversight of today’s oils. While objectives of stakeholders may vary (for example, environmental nongovernmental organizations may have different perspectives than investors), all actors would be better served by accurate, transparent measures of climate risk associated with different oils.
All actors would be better served by accurate, transparent measures of climate risk associated with different oils.


GORDON | BRANDT | BERGERSON | KOOMEY 11
THE mOST CHALLENGING OILS
EVEN WITH THE decline in oil prices that began in August 2014, there remains fierce competition between diverse global oils. A few of them are more challenging in terms of climate change than others.
• Gassy oils: Oil fields typically have some natural gas (or methane) and other lighter gases (ethane and others) associated with them. The more gas that is present, the more challenging and costly it is to safely manage these commodities. When the gas associated with certain gassy oils is not handled properly, usually due to lack of appropriate equipment, the gas is burned or released as a waste byproduct. Both flaring and venting operations are damaging to the climate as they release carbon dioxide, methane, and other GHG emissions. Oils that resort to these practices can result in at least 75 percent larger GHG footprints than comparable light oils that do not flare. Flaring policies vary. For example, it has been illegal to flare associated gas in Norway since the 1970s, making these oils some of the lowest emitting oils produced today.
• Heavy oils: The heavier the oil, the more heat, steam, and hydrogen required to extract, transport, and transform it into high-value petroleum products like gasoline and diesel. These high-carbon oils also yield higher shares of bottom-of-the-barrel products like petcoke that are often priced to sell. The heaviest oils have total GHG footprints that can be nearly twice as large as lighter oils.
12 KNOW YOUR OIL
CARNEGIE ENDOWMENT fOR INTERNATIONAL PEACE
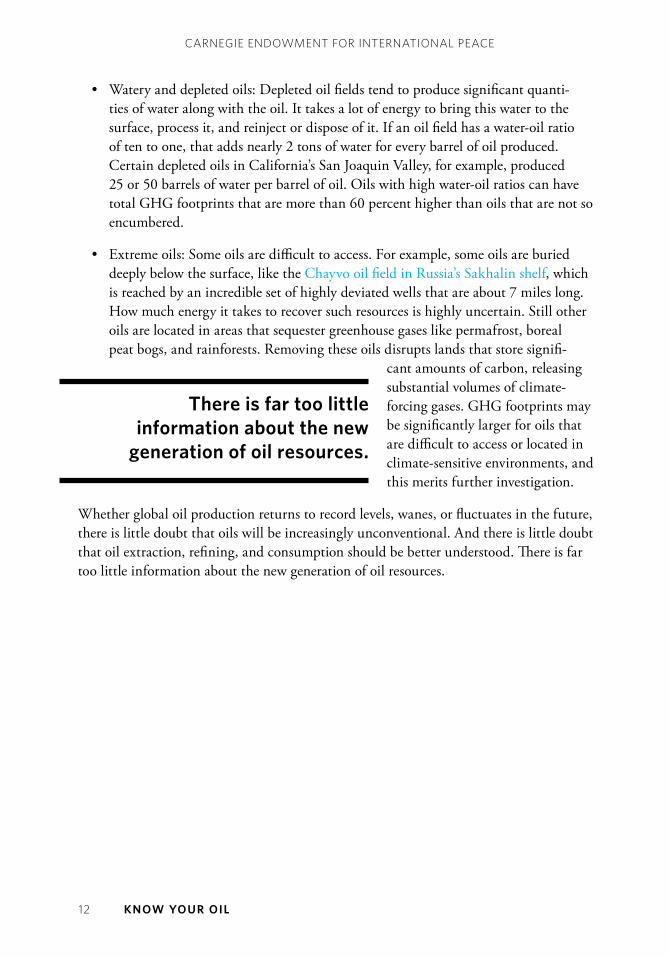
• Watery and depleted oils: Depleted oil fields tend to produce significant quanti-ties of water along with the oil. It takes a lot of energy to bring this water to the surface, process it, and reinject or dispose of it. If an oil field has a water-oil ratio of ten to one, that adds nearly 2 tons of water for every barrel of oil produced. Certain depleted oils in California’s San Joaquin Valley, for example, produced 25 or 50 barrels of water per barrel of oil. Oils with high water-oil ratios can have total GHG footprints that are more than 60 percent higher than oils that are not so encumbered.
• Extreme oils: Some oils are difficult to access. For example, some oils are buried deeply below the surface, like the Chayvo oil field in Russia’s Sakhalin shelf, which is reached by an incredible set of highly deviated wells that are about 7 miles long. How much energy it takes to recover such resources is highly uncertain. Still other oils are located in areas that sequester greenhouse gases like permafrost, boreal peat bogs, and rainforests. Removing these oils disrupts lands that store signifi-
cant amounts of carbon, releasing substantial volumes of climate-forcing gases. GHG footprints may be significantly larger for oils that are difficult to access or located in climate-sensitive environments, and this merits further investigation.
Whether global oil production returns to record levels, wanes, or fluctuates in the future, there is little doubt that oils will be increasingly unconventional. And there is little doubt that oil extraction, refining, and consumption should be better understood. There is far too little information about the new generation of oil resources.
There is far too little information about the new
generation of oil resources.

GORDON | BRANDT | BERGERSON | KOOMEY 13
CREATING AN OIL-CLImATE INdEx
AS THE CHANGING climate results in higher social costs, the environmental limita-tions on oil production and consumption will have more significant effects than the industry has heretofore acknowledged.1 Recent research has shown that to keep the earth from warming more than 2 degrees Celsius from preindustrial times—the limit set in the 2009 Copenhagen Accord as the threshold for “dangerous” human interference in the climate system—at least one-third of the world’s oil reserves should not be burned or the carbon from refined oil products’ combustion should be safely stored.2 Investors and companies facing such constraints will need data on the total life-cycle emissions from the exploration, extraction, transportation, refining, and combustion of oil resources, data that do not now exist, at least not in a consistent, transparent, and peer-reviewed way.
The Oil-Climate Index is designed to fill that void by analyzing total GHG emissions (including all co-products) for given crudes using three different functional units, or dif-ferent metrics, for comparison. The first version of the index includes: emissions per barrel of crude produced, emissions per energy content of all final petroleum products, and emissions per dollar value of all petroleum products sold.
The Oil-Climate Index uses the following open-source tools to evaluate actual emissions associated with an individual oil’s supply chain:

14 KNOW YOUR OIL
CARNEGIE ENDOWMENT fOR INTERNATIONAL PEACE
• OPGEE (Oil Production Greenhouse Gas Emissions Estimator), developed by Adam Brandt at Stanford University,3 evaluates upstream oil emissions from extraction to transport to the refinery inlet.
• PRELIM (Petroleum Refinery Life-Cycle Inventory Model), developed by Joule Bergerson at the University of Calgary,4 evaluates refining emissions and petroleum product yields.
• OPEM (Oil Products Emissions Module), developed by Deborah Gordon and Eugene Tan at the Carnegie Endowment for International Peace’s Energy and Climate Program and Jonathan Koomey at Stanford University’s Steyer-Taylor Center for Energy Policy and Finance, calculates the emissions that result from the transport and end use of all oil products yielded by a given crude. An overriding goal of the module is to include and thereby avoid carbon leakage from petroleum co-products.
While oil type, production specifications, and geography were initial factors in selecting oils to model in Phase 1 of the Oil-Climate Index, data availability turned out to be the over-riding factor. The oils modeled in the first phase are found around the world (see table 1). Oils were analyzed across the entire value chain—the series of transformations and move-ments from an oil’s origin to the consumption of the slate of petroleum products it yields.
TABLE 1Locations of 30 Phase 1 OCI Test Oils
United States
Canada EuropeSub-SaharanAfrica
Eurasia Middle East &North Africa
Latin America & Caribbean
Asia-Pacific
U.S. California Midway Sunset
Canada Midale—Saskatchewan Nigeria Obagi UK Brent Russia
ChayvoIraq
ZubairBrazilLula
BrazilFrade
VenezuelaHamaca
China Bozhong
Indonesia Duri
Kuwait Ratawi
Kazakhstan Tengiz
Azerbaijan Azeri Light
UK Forties
Norway Ekofisk
Nigeria Bonny
Nigeria Agbami
Angola Girassol
Angola Kuito
Canada Syncrude Synthetic
(SCO)—Alberta
Canada Suncor Synthetic A
(SCO)—Alberta
Canada Suncor Synthetic H
(SCO)—Alberta
Canada Cold Lake (Dilbit)—Alberta
Canada Hibernia—Newfoundland
U.S. California South Belridge
U.S. California Wilmington
U.S. Alaska North Slope
U.S. Gulf Mars
U.S. Gulf Thunder Horse
Note: SCO is synthetic crude oil from upgraded oil sands; dilbit is diluted bitumen (a mixture of bitumen and diluent made from natural gas liquids, condensate, and other light hydrocarbons).

GORDON | BRANDT | BERGERSON | KOOMEY 15
mOdELING UPSTREAm OIL EmISSIONS
UNEARTHING OIL ANd preparing it for transport to a refinery is the first step in the value chain. The processes involved differ from oil to oil. Together, exploration, production, surface processing, and transport of crude oil to the refinery inlet comprise upstream operations, and the resulting GHG emissions are modeled in OPGEE (see figure 2).
OPGEE PHASE 1 RESULTS
Crudes vary significantly in their upstream GHG impacts. To date, OPGEE has been run on approximately 300 global crudes, many of which are in California and Canada. This represents more upstream crude runs than any other modeling effort, including the National Energy Technology Laboratory’s Development of Baseline Data and Analysis of Life Cycle Greenhouse Gas Emissions of Petroleum-Based Fuels (twelve crudes in November 2008); the Jacobs Consultancy’s Life Cycle Assessment Comparison of North American and Imported Crudes (thirteen crudes in 2009); TIAX Consulting’s Comparison of North American and Imported Crude Oil Lifecycle GHG Emissions (nine crudes in 2009); and IHS Consulting’s Comparing GHG Intensity of the Oil Sands and the Average U.S. Crude Oil (28 crudes in 2014).

16 KNOW YOUR OIL
CARNEGIE ENDOWMENT fOR INTERNATIONAL PEACE
For the purposes of the Oil-Climate Index, it was critical that data were available to simultaneously model both upstream and midstream emissions. This narrowed the field down to 30 OCI test oils for the first phase.
There is large variation in upstream emissions across the 30 test oils. The oil with the highest emissions intensity has approximately twelve times the emissions of the lowest-intensity oil (see figure 3).
WHAT dRIVES UPSTREAm EmISSIONS?
The emissions from different oils have different origins. UK Brent, for example, emits most of its GHG emissions during surface processing, while California South Belridge emits more due to the steam used during production (see figure 4). Other upstream emis-sions drivers include the gas produced with the oil that may be flared or vented, depend-ing on local conditions.
Oil location—including geography and ecosystem (such as desert, Arctic, jungle, forest, and offshore)—determines how disruptive extraction is to land use. When oil
FIGURE 2OPGEE Model Schematic
User Inputs and
Results
Energy Gathering Sheet
Exploration Drilling &Development
SteamInjection
Electric GridData
DriversData
Fuel Cycle(upstream
data)
EmissionFactors
FuelProperties
Conversion Factors
Other InputData
GasBalance
Venting,Flaring, &Fugitives
Production & Extraction
SurfaceProcessing Maintenance Waste
DisposalCrude
TransportBitumen
Extraction &Upgrading
GHG EmissionsGathering Sheet
Main User Interaction
Gathering Sheets
Main Calculations
Support Sheets
Source: Stanford University, Oil Production Greenhouse Gas Emissions Estimator

GORDON | BRANDT | BERGERSON | KOOMEY 17
development activities change land use, this affects the land’s biological (soil and plants) carbon storage capacity. The more naturally stored carbon that is released, the more greenhouse gases are emitted.
An oil field’s location, its distance to transport hubs, and refinery selection determine the method that is used to move the resource and the resulting transport emissions. Pipelines, railroads, or trucks are used to ship the oil overland. Barges move oil over inland water-ways, and seaborne crude shipments rely on marine tankers. In the first phase of the Oil-Climate Index, it was assumed as a default that all crude is sent to the city of Houston
FIGURE 3OPGEE GHG Emission Results for 30 Phase 1 OCI Test Oils
300
250
200
150
100
50
0
Ups
trea
m G
HG
Em
issi
ons
(kg
CO2 eq
./bb
l cru
de)
Oil Field Country and Name
Chi
na B
ozho
ngN
iger
ia O
bagi
U.S
. Cal
iforn
ia M
idw
ay S
unse
tC
anad
a Sy
ncru
de S
ynth
etic
(SCO
)In
done
sia
Dur
iVe
nezu
ela
Ham
aca
Nig
eria
Bon
nyC
anad
a Su
ncor
Syn
thet
ic A
(SCO
)C
anad
a Su
ncor
Syn
thet
ic H
(SCO
)U
K Br
ent
Can
ada
Cold
Lak
e (D
ilbit)
U.S
. Cal
iforn
ia S
outh
Bel
ridge
U.S
. Ala
ska
Nor
th S
lope
Russ
ia C
hayv
oIra
q Zu
bair
Can
ada
Mid
ale
U.S
. Cal
iforn
ia W
ilmin
gton
Nig
eria
Agb
ami
Braz
il Lu
laU
K Fo
rtie
sA
ngol
a G
irass
olA
ngol
a Ku
itoKu
wai
t Rat
awi
U.S
. Gul
f Mar
sA
zerb
aija
n A
zeri
Ligh
tBr
azil
Frad
eU
.S. G
ulf T
hund
er H
orse
Kaza
khst
an T
engi
zC
anad
a H
iber
nia
Nor
way
Eko
fisk
Source: Authors’ calculations
Note: Unlike the other OCI test oils, Cold Lake dilbit is not composed of a full barrel of oil. It is about 75 percent bitumen mixed with diluent to allow it to flow.

18 KNOW YOUR OIL
CARNEGIE ENDOWMENT fOR INTERNATIONAL PEACE
in Texas. As of January 2014, the U.S. states of Texas and Louisiana had more refining capacity than any nation, including China and Russia.5
FIGURE 4Drivers of Upstream GHG Emissions for 30 Phase 1 OCI Test Oils
400
300
200
100
0
-100
-200
Ups
trea
m G
HG
Em
issi
ons (
kg C
O2 eq
./bb
l cru
de)
TransportMisc.DiluentVenting, Flaring, andFugitive EmissionsWasteMaintenanceUpgradingProcessingProductionDrillingExploration
Accounting
Chi
na B
ozho
ng
N
iger
ia O
bagi
U
.S. C
alifo
rnia
Mid
way
Sun
set
C
anad
a Sy
ncru
de S
ynth
etic
(SCO
)
In
done
sia
Dur
i
V
enez
uela
Ham
aca
Nig
eria
Bon
ny
Can
ada
Sunc
or S
ynth
etic
A (S
CO)
C
anad
a Su
ncor
Syn
thet
ic H
(SCO
)
UK
Bren
t
C
anad
a Co
ld L
ake
(Dilb
it)
U
.S. C
alifo
rnia
Sou
th B
elrid
ge
U.S
. Ala
ska
Nor
th S
lope
R
ussi
a C
hayv
oIra
q Zu
bair
Can
ada
Mid
ale
U.S
. Cal
iforn
ia W
ilmin
gton
Nig
eria
Agb
ami
Braz
il Lu
laU
K Fo
rtie
sA
ngol
a G
irass
olA
ngol
a Ku
itoKu
wai
t Rat
awi
U.S
. Gul
f Mar
sA
zerb
aija
n A
zeri
Ligh
tBr
azil
Frad
eU
.S. G
ulf T
hund
er H
orse
Kaza
khst
an T
engi
zC
anad
a H
iber
nia
Nor
way
Eko
fisk
Oil Field Country and Name
Source: Authors’ calculations
Notes: Unlike the other OCI test oils, Cold Lake dilbit is not composed of a full barrel of oil. O�-site emissions accounting can be a credit (negative) or debit (positive).

GORDON | BRANDT | BERGERSON | KOOMEY 19
OPGEE analysis points to a number of factors that result in particularly high upstream emissions:
• The methods used to recover extra-heavy (bitumen) and heavy oils often involve putting significant amounts of energy in to heat up resources so they can flow, con-suming 10–30 percent of the energy content of the produced crude. These oils also typically have significant water-handling and treatment needs, and pumping water is energy-intensive.
• Ultra-light and light oils that have a high level of associated gas may be flared if gas-handling infrastructure is inadequate or missing. Disposing of this gas through flaring instead of gathering and selling it results in additional carbon dioxide emis-sions. This wasteful practice produces GHG emissions with no economic benefit.
• Hydraulically fractured oils can vent methane emissions due to gas flowback, which is when vapors return to the surface. This can happen when an oil well has been drilled and the piping and tubing infrastructure that has been put in place for ongoing production cannot adequately contain the gas associated with the oil.
• Conventional oil formations that are depleted and are running out of oil resources can produce significant quantities of water or require increased injection of sub-stances to induce oil production.
OPGEE CHALLENGES
The largest source of uncertainty in OPGEE is the lack of information on global oil fields. Many operators and many regions of the world have few formal data publication requirements. Data quality is also an ongoing issue in modeling upstream emissions (see the appendix for details).
OPGEE utilizes about 50 data inputs, from simple entries like the name of the country where an oil field is located to challenging-to-obtain information such as an oil field’s productivity index (expressed in daily production per unit pressure). Substantial research is involved in gathering OPGEE modeling data, which can be obtained from agencies, reports, scientific literature, and industry references.
OPGEE can function with limited data. The model has a comprehensive set of defaults and smart defaults that can fill in missing data. The more data found for a particular field, the more specific and less generic the emissions estimate becomes. All data are used to determine smarter default values over time.

20 KNOW YOUR OIL
CARNEGIE ENDOWMENT fOR INTERNATIONAL PEACE
As with all life-cycle assessment (LCA) models, boundaries must be drawn around the analysis. The handling of co-products that cross boundaries along the oil supply chain, from extraction to refining to end use, presents methodological challenges. For example, resulting GHG emissions from condensates of light liquids, like ethane, that can be stripped off and sold before oil is transported to a refinery are not expressly included in OPGEE. Emissions associated with exploration occur at the beginning of an oil field development project and are spread over the life of the field. Extraction emissions that occur routinely are estimated at a point in time and assumed to recur over the lifetime of the oil field.
OPGEE treats liquid petroleum as the principal product of upstream processes. Emissions associated with electricity generated on-site or natural gas produced that is gathered, sold, and not flared is credited back or deducted from total emissions in OPGEE accounting (see figure 4 above).6 Any emissions from co-products like petcoke that are associated with upgrading heavy oils upstream of the refinery—as can be the case with Canadian bitumen and Venezuelan heavy oils—are not included in OPGEE unless the production process directly consumes petcoke (as in some oil-sands-based integrated mining and upgrading operations). Emissions from net production of petcoke have been included in the OPEM downstream combustion module.
Recent studies have found that uncertainty in OPGEE’s results is reduced after learning three to four key pieces of data about an oil field.7 After learning the ten most important pieces of information about an oil field, there is typically little benefit to learning the remaining data.
Imprecise data reporting introduces additional uncertainty. Errors in applying the model can lead to further uncertainty.
The key variables to enhance model precision include: steam-to-oil and water-to-oil ratios, flaring rates, and crude density (measured as API gravity). Less important variables in the OPGEE model’s ability to analyze GHG emissions include gas-to-oil ratios, oil produc-tion rates, and depth (except in extreme cases).

GORDON | BRANDT | BERGERSON | KOOMEY 21
Modeling MidstreaM oil eMissions
refineries are akin to a professional chef ’s kitchen. Instead of edible organic foodstuff, the ingredients are hydrogen, carbon, oxygen, and a multitude of impurities. Refinery equipment—effectively the stoves, refrigerators, pressure cookers, mixers, and bowls—heats, cleaves, blends, and reconfigures the massive flows of hydrocarbons it is fed.
Refining used to be a relatively simple process that involved applying heat to boil oil and separating it into its main components. But the changing nature of oil demands changes in refineries.
PRELIM is the first open-source refinery model that estimates energy and GHG emissions associated with various crudes processed in different refinery types using different processing equipment. It provides a more detailed investigation into the impacts crude quality and refinery configurations have on energy use and GHG emissions than what has been presented in the public realm to date. PRELIM can run a single crude or a blend of oils, and when combined with OPGEE, the model provides the second of the three components in the improved oil life-cycle assessment.
PRELIM influences the Oil-Climate Index in two important ways. It estimates mid-stream GHG emissions, and it predicts what petroleum commodities the refinery pro-duces. The type and amount of products vary with a refinery’s design.
the changing nature of oil demands changes in refineries.

22 KNOW YOUR OIL
CARNEGIE ENDOWMENT fOR INTERNATIONAL PEACE
mATCHING OILS TO REFINERIES
Every refinery is unique in terms of the combination of equipment it uses, the blends of crudes it is optimized for, and ultimately the type and amount of products it sells. Matching oil characteristics with refining infrastructure in order to meet end-use product demand is the midstream goal.
PRELIM attempts to represent many of these possible refinery configurations by includ-ing three different types of refinery—hydroskimming, medium conversion, or deep con-version—and ten combinations of processing units within refinery categories (see figure 5). One configuration, for example, employs a coking unit in a deep conversion refinery to reject high levels of carbon in the form of petcoke. Another example is configuring a refinery with hydrotreating for adding hydrogen.
The inputs and outputs of each refinery process unit are estimated using characteristics about individual process units from existing literature and industry-expert input as well as characteristics of the crude or crude blend.
Technically, each crude can be blended and processed in many different refinery configu-rations, but in practice crude oils are best matched to certain configurations. PRELIM selects the default refinery configuration that best suits a crude oil based on its properties (API gravity and sulfur content). This means that light and sweet (low sulfur) crudes will be processed in simpler refineries and heavy and sour (high sulfur) crudes will be directed to complex deep conversion refineries.
Specifically, PRELIM matches refineries with crudes as follows:
• Deep conversion refinery: heavy crude with any sulfur level
• Medium conversion refinery: medium sweet crude (22 to 32 API, with less than 0.5 percent sulfur content by weight); medium sour crude (22 to 32 API with more than 0.5 percent sulfur content by weight); and light sour crude (over 32 API with more than 0.5 percent sulfur content by weight)
• Hydroskimming refinery: light sweet crude over 32 API and less than 0.5 percent sulfur content by weight
While API gravity and sulfur are good indicators of a default refinery type, they are not sufficient to determine refinery GHG emissions. Therefore, the user of the model can override the default refinery configuration. For example, California Midway Sunset oil, with a reported API gravity as high as 22.6 and as low as the teens, was run through a deep conversion rather than a medium conversion refinery. Once the refinery configura-tion is selected, detailed information about the particular oil is needed well beyond API gravity and sulfur content of the whole crude.

GORDON | BRANDT | BERGERSON | KOOMEY 23
FIGURE 5Refinery Configurations in PRELIM
Isomerization
Merox Unit
Desalting
DieselHydrotreating
Gas OilHydrocracking
Gas OilHydrotreating
Fluid CatalyticCracking
Alkylation
COKEor
HYDROCRACKING RESIDUALS
HEAVY FUEL OIL
HEATINGFUEL OIL
DIESEL
JET FUEL
GASOLINE
Heavy NaphthaHydrotreating
VR UpgradingDelayed Coking
orHydrocracking
NaphthaCatalytic
ReformingNaphtha
Hydrotreating
KeroseneHydrotreating
CRUDE
180˚C
80˚CLSR
290˚C
340˚C
399˚CAGO
399+˚CAR
525+˚CVR
454˚CLVGO
525˚CHVGO
C-B
Coker or HCGO
Source: Petroleum Refinery Life-Cycle Inventory Model
Note: See list of acronyms for more information.
GAS
Refinery fuel gas
Intermediate Products
HydrogenT
SMR
REFINERY TYPEHydroskimmingMedium ConversionDeep Conversion

24 KNOW YOUR OIL
CARNEGIE ENDOWMENT fOR INTERNATIONAL PEACE
PRELIm PHASE 1 RESULTS
During Phase 1, sufficient data were collected on 57 oils to run through PRELIM using a float case that allows the model to determine petroleum product yields rather than fixing production volumes.8 The results for those 30 test oils where there was sufficient data to also run OPGEE show that midstream GHG emissions vary by a factor of seven (see figure 6).
FIGURE 6PRELIM GHG Emission Results for 30 Phase 1 OCI Test Oils
120
100
80
60
40
20
0
Mid
stre
am G
HG
Em
issi
ons
(kg
CO2
eq./
bbl c
rude
)
Oil Field Country and Name
U.S
. Cal
iforn
ia S
outh
Bel
ridge
Can
ada
Sunc
or S
ynth
etic
H (S
CO)
U.S
. Cal
iforn
ia W
ilmin
gton
Indo
nesi
a D
uri
Braz
il Fr
ade
U.S
. Cal
iforn
ia M
idw
ay S
unse
tC
hina
Boz
hong
Can
ada
Cold
Lak
e (D
ilbit)
Can
ada
Sync
rude
Syn
thet
ic (S
CO)
Braz
il Lu
laU
K Fo
rtie
sC
anad
a M
idal
eKa
zakh
stan
Ten
giz
Iraq
Zuba
irU
.S. G
ulf M
ars
Ang
ola
Gira
ssol
Ang
ola
Kuito
U.S
. Ala
ska
Nor
th S
lope
Can
ada
Hib
erni
aU
.S. G
ulf T
hund
er H
orse
Kuw
ait R
ataw
iN
iger
ia B
onny
Nig
eria
Oba
giVe
nezu
ela
Ham
aca
Russ
ia C
hayv
oU
K Br
ent
Can
ada
Sunc
or S
ynth
etic
A (S
CO)
Nig
eria
Agb
ami
Nor
way
Eko
fisk
Aze
rbai
jan
Aze
ri Li
ght
Source: Authors’ calculations
Notes: The 30 test oils were run through a delayed coking refinery as well. Hydrocracking facilities are also possible to model in PRELIM. Medium and deep conversion refineries use fluid catalytic cracking (FCC) and gas oil-hydrocracking (GO-HC) processes. Unlike the other OCI test oils, Cold Lake dilbit is not composed of a full barrel of oil.
HydroskimmingMedium ConversionDeep Conversion
REFINERY TYPE

GORDON | BRANDT | BERGERSON | KOOMEY 25
WHAT dRIVES mIdSTREAm EmISSIONS?
Recent work with PRELIM finds a number of factors that lead to high amounts of emis-sions during midstream petroleum operations (see figure 7). PRELIM is also useful in identifying where GHG emissions can be reduced in the refining process.
Crude quality and the selected process units employed (that is, the refinery configura-tion), as well as the energy efficiency of the process units, all play important roles in deter-mining the energy requirements and emissions of an individual crude (or a crude blend).
The unique amount of hydrogen required to process each crude is the major driver of refinery energy use and GHG emissions. The amount is dictated by the quality of the
FIGURE 7Drivers of Midstream GHG Emissions for 30 Phase 1 OCI Test Oils
Mid
stre
am G
HG
Em
issi
ons
(kg
CO2
eq./
bbl c
rude
)
120
100
80
60
40
20
0
U.S
. Cal
iforn
ia S
outh
Bel
ridge
Can
ada
Sunc
or S
ynth
etic
H (S
CO)
U.S
. Cal
iforn
ia W
ilmin
gton
Indo
nesi
a D
uri
Braz
il Fr
ade
U.S
. Cal
iforn
ia M
idw
ay S
unse
tC
hina
Boz
hong
Can
ada
Cold
Lak
e (D
ilbit)
Can
ada
Sync
rude
Syn
thet
ic (S
CO)
Braz
il Lu
laU
K Fo
rtie
sC
anad
a M
idal
eKa
zakh
stan
Ten
giz
Iraq
Zuba
irU
.S. G
ulf M
ars
Ang
ola
Gira
ssol
Ang
ola
Kuito
U.S
. Ala
ska
Nor
th S
lope
Can
ada
Hib
erni
aU
.S. G
ulf T
hund
er H
orse
Kuw
ait R
ataw
iN
iger
ia B
onny
Nig
eria
Oba
giVe
nezu
ela
Ham
aca
Russ
ia C
hayv
oU
K Br
ent
Can
ada
Sunc
or S
ynth
etic
A (S
CO)
Nig
eria
Agb
ami
Nor
way
Eko
fisk
Aze
rbai
jan
Aze
ri Li
ght
Oil Field Country and Name
Source: Authors’ calculations
Note: Unlike the other OCI test oils, Cold Lake dilbit is not composed of a full barrel of oil.
Electricity
Hydrogen via Steam Methane ReformerFluid Catalytic Cracking Catalyst Regeneration
HeatSteam
DRIVERS

26 KNOW YOUR OIL
CARNEGIE ENDOWMENT fOR INTERNATIONAL PEACE
crude entering the refinery. Lighter crudes yield more hydrogen when refined, while heavier crudes lack hydrogen and often utilize hydrogen inputs during refining.
Based on this analysis, the top three ways to reduce GHG emissions at refineries that process heavier crude are to reduce the amount of hydrogen consumed, increase hydrogen production efficiency (and/or lower the GHG emissions intensity of hydrogen production), and capture carbon dioxide from the most concentrated, highest volume refinery sources. Those sources include fluid catalytic cracking units used to produce additional gasoline and steam methane reformer units used to make hydrogen on-site from natural gas.9
PRELIm CHALLENGES
Many experts think that a crude oil’s API gravity and sulfur content are reliable predic-tors of refinery GHG emissions. This, however, is a fallacy that has long hampered the collection of the full range of data needed to model midstream emissions.
OCI results illustrate this point. Ranking oils by their PRELIM emissions from high to low and plotting them in this order yields little or no correlation with API gravity (see figure 8). A similar mismatch results for sulfur and hydrogen content.
Similar to OPGEE, PRELIM faces typical LCA challenges such as data quality, trans-parency, and availability, as well as ambiguity associated with analysis boundaries and assumptions. Given the complexity and uniqueness of operating refineries and crudes produced around the world, any model that attempts to estimate refinery emissions will always include uncertainties. The major sources of uncertainty in PRELIM stem from gathering input data from the public realm and the fact that PRELIM results can be sen-
sitive to many dynamic parameters.
An oil assay, or a chemical analysis of crude, reported in a consistent format is a particularly important PRELIM input. Assays provide extensive, detailed experimental data for refiners to establish the compatibility of a crude oil with a particular petroleum refinery. These data also determine if indi-vidual crudes fulfill market-driven
product yield, quality, and demand, and they are used to determine if a refined crude will meet environmental, safety, and other standards. Assays guide plant operation, develop-ment of product schedules, and examination of future processing ventures. They supply
Given the complexity and uniqueness of operating refineries
and crudes produced around the world, any model that attempts to
estimate refinery emissions will always include uncertainties.

GORDON | BRANDT | BERGERSON | KOOMEY 27
engineering companies with crude oil analyses for their process design of petroleum refin-ing plants, and they help determine companies’ crude oil prices and set cost penalties for unwanted impurities and other undesirable properties.
PRELIM requires detailed oil assays that are routinely collected (specifics are available in the appendix).10 Unfortunately, assay data reports are often inconsistent, lacking permis-sion to use or reprint, or unavailable publicly at all. Standardized, updated, and consistent public oil assays that measure the same factors and abide by the same temperature cut points are needed to understand midstream oil emissions and product volumes that drive downstream emissions.
This situation calls for more robust oil data collection and reporting. Not only does such accuracy affect climate change impact estimates, it also can have safety impacts. Knowing an oil’s characteristics can determine how to establish operating procedures for different oils when they move by rail, pipeline, and other transport modes.
FIGURE 8API Gravity of 30 Phase 1 OCI Test Oils in Order of PRELIM GHG Emissions
U.S
. Cal
iforn
ia S
outh
Bel
ridge
Can
ada
Sunc
or S
ynth
etic
H (S
CO)
U.S
. Cal
iforn
ia W
ilmin
gton
Indo
nesi
a D
uri
Braz
il Fr
ade
U.S
. Cal
iforn
ia M
idw
ay S
unse
tC
hina
Boz
hong
Can
ada
Cold
Lak
e (D
ilbit)
Can
ada
Sync
rude
Syn
thet
ic (S
CO)
Braz
il Lu
laU
K Fo
rtie
sC
anad
a M
idal
eKa
zakh
stan
Ten
giz
Iraq
Zuba
irU
.S. G
ulf M
ars
Ang
ola
Gira
ssol
Ang
ola
Kuito
U.S
. Ala
ska
Nor
th S
lope
Can
ada
Hib
erni
aU
.S. G
ulf T
hund
er H
orse
Kuw
ait R
ataw
iN
iger
ia B
onny
Nig
eria
Oba
giVe
nezu
ela
Ham
aca
Russ
ia C
hayv
oU
K Br
ent
Can
ada
Sunc
or S
ynth
etic
A (S
CO)
Nig
eria
Agb
ami
Nor
way
Eko
fisk
Aze
rbai
jan
Aze
ri Li
ght
50454035302520151050
API
Gra
vity
(deg
rees
)
Oil Field Country and NameSource: Authors’ calculations
High PRELIM Emissions Low PRELIM Emissions
Extr
a -H
eavy
Hea
vyM
ediu
mLi
ght
Ultr
a-Li
ght


GORDON | BRANDT | BERGERSON | KOOMEY 29
mOdELING dOWNSTREAm OIL EmISSIONS
THE TRANSPORTATION OF crude oil from the field to the refinery is captured in the OPGEE model. But there are also emissions from transporting petroleum products—gasoline, diesel, jet fuel, and other co-products—from the refinery outlet to domestic and global markets. This transport and use of refined petroleum products are the final inputs needed to calculate an oil’s GHG emissions. OPEM uses the product outputs from PRELIM to calculate emissions from transport and end use (see figure 9).
The globalization of the oil sector has increased movement of these products in recent years. Refineries are no longer located predominantly in regions where demand is greatest. The United States, for example, has been refining a growing surplus of diesel fuel that it exports to Europe and Asia. Default values have been included in the Oil-Climate Index’s downstream module according to a given route that petroleum products may take from Houston (where OPGEE assumes all crudes are refined) to the northeastern United States. This represents a lower bound for transport emissions; it does not consider long-distance international petroleum trade. The amount of GHG emissions from product transport varies depending on the methods used and distances traveled, but current OPEM defaults result in a lower bound of transport emissions at 1 to 2 percent of total emissions.

30 KNOW YOUR OIL
CARNEGIE ENDOWMENT fOR INTERNATIONAL PEACE
While transport emissions are minor relative to those stemming from other parts of the life cycle, end use dominates oil’s GHG emissions. Prior LCA calculations have histori-cally compared oil to alternative transport fuels.11 As such, GHG emissions were mea-sured predominantly on the basis of gasoline or diesel yields. But significant and variable emissions result from use of an oil’s entire product slate, including petrochemical feed-stock, which will be formally added to the product slate in OCI Phase 2, and bottom-of-the-barrel co-products like petcoke, fuel oil, bunker fuel (known as bunker C), and asphalt. This highlights the fact that the fate of the entire oil barrel is critical to under-standing and designing policies that reduce an oil’s GHG emissions.
FIGURE 9PRELIM Product Outputs for 30 Phase 1 OCI Test Oils
U.S. California WilmingtonU.S. California Midway SunsetU.S. California South Belridge
Indonesia DuriBrazil Frade
Brazil LulaUK Forties
Canada Cold Lake (Dilbit)China Bozhong
Venezuela HamacaCanada Suncor Synthetic H (SCO)
Kazakhstan TengizU.S. Gulf Thunder HorseU.S. Alaska North Slope
Iraq ZubairCanada Hibernia
Canada MidaleCanada Syncrude Synthetic (SCO)
U.S. Gulf MarsAngola GirassolNorway Ekofisk
UK BrentRussia ChayvoNigeria ObagiNigeria BonnyAngola Kuito
Nigeria AgbamiKuwait Ratawi
Canada Suncor Synthetic A (SCO)Azerbaijan Azeri Light
0 20,000 40,000 60,000 80,000 1 00,000 120,000 140,000
Oil F
ield
Cou
ntry
and
Nam
e
Barrels of Product per 100,000 Barrels of Crude
Gasoline Diesel Jet/Aviation Fuel Fuel Oil Bunker C Fuel Petcoke Refinery Fuel Gas
Source: Authors’ calculations
Notes: Petcoke production is total for refinery (for heavy oils) and upstream upgrading (for SCO). PRELIM currently assumes allrefinery fuel gas (RFG) is used in the refining process. Unlike the other OCI test oils, Cold Lake dilbit is not composed of a full barrel of oil.

GORDON | BRANDT | BERGERSON | KOOMEY 31
PROdUCT TRANSPORT EmISSIONS
Three variables determine the emissions from the transportation of refined products: mode, distance, and the mass of the product. Different transport modes have different emission intensities.12 If a tonne (metric ton) of fuel is shipped 1 kilometer, tanker trucks have the highest GHG emissions (0.09 kilograms of carbon dioxide equivalent per tonne-kilometer) while ocean-going crude carriers have the smallest emissions per tonne-kilome-ter (0.003 kilograms). Rail and pipeline emission factors are 0.02 and 0.01, respectively. For example, an average heavy-duty tanker truck moving a tonne of gasoline 1 kilometer emits as much as an ocean tanker moving a tonne 30 kilometers.
The energy needed and greenhouse gases emitted transporting refined products increases with distance and mass. PRELIM product outputs (converted from barrels to tonnes using reported product densities) are used to determine how much is transported to the market-place; however, the distance that gasoline, diesel, jet fuel, petcoke, and other products are transported is difficult to determine. Limited and inconsistent data exist on the distances that products travel because there is no global agency or group to collect and audit such data. Collecting such data is also challenging because products are often shipped around the globe, trades tend to involve multiple actors that are frequently private firms, and product flows are highly dynamic, driven by changing supply and demand.
For the first phase of the Oil-Climate Index, default values for downstream product transport emissions represent a rough estimate of a typical (but not an average) distance traveled by truck and ocean tanker for the total mass of petroleum products for each crude. For example, default values of 2,414 kilometers (roughly 1,500 miles) by pipeline from Houston to the New York–New Jersey region and then 380 kilometers (about 236 miles) by tanker truck to the Boston region were selected.
ENd-USE COmBUSTION EmISSIONS
Most hydrocarbon products are used to release energy to power cars, trucks, planes, trains, generators, and power plants. However, some petroleum products, like asphalt, hydrogen, and the refinery gases that make up petrochemical feedstock, derive their greatest economic value without being burned.
In order to calculate GHG emissions from petroleum product combustion for sample oils, each product’s emission factor needs to be identified. The U.S. Environmental Protection Agency has been measuring, tracking, and updating emission factors since 1972.
Each barrel of combusted petroleum products has different emissions, ranging from gaso-line at 370 kilograms of CO2 equivalent per barrel to petcoke at 645 (see figure 10). The

32 KNOW YOUR OIL
CARNEGIE ENDOWMENT fOR INTERNATIONAL PEACE
quantity of products produced from a given crude from PRELIM determines the overall emissions from combustion for that oil.
OPEm PHASE 1 RESULTS
Although the downstream combustion of petroleum products accounts for the largest portion of overall emissions, there is variability between oils—a 45 percent spread between the combustion emissions of the 30 OCI test oils (see figure 11). The heaviest
FIGURE 10Petroleum Product Combustion-Related Emission Factors
700
600
500
400
300
200
100
0
0.12
0.1
0.08
0.06
0.04
0.02
0
GHGs/Barrel Crude
GHGs/Megajoule Products
Com
bust
ion
GHG
Emiss
ions
2(k
g CO
eq.
/bbl
of p
etro
leum
pro
duct
)
Petroleum Product Outputs
Combustion GH
G Emissions
(kg CO2 eq./ M
J of petroleum product)
Gas
olin
e
Jet /
Aviat
ion
Fuel
Dies
el
Fuel
Oil
Petc
oke
Bunk
er C
Fuel
Light
Ends
(Refi
nery
Fuel
Gas
)
Asp
halt
Notes: Emission factors most recently updated in April 2014.
* Light ends can be used as petrochemical feedstock, and refinery fuel gas (RFG) is a subset of light ends. When the resource is not combusted, it results in no GHG emissions; but when it is burned as RFG, it has an estimated emission factor ranging from 160 to 370 kilograms of CO2 equivalent per barrel.
** Asphalt is not burned and, therefore, has no direct combustion emission factor when it is used to pave roadways, but it may result in emissions of up to 500 kilograms CO2 equivalent per barrel product when heated for road oil or roofing or combusted for other uses.
Source: U.S. Environmental Protection Agency, “Emission Factors for Greenhouse Gas Inventories,” www.epa.gov/climateleadership/documents/emission-factors.pdfSource: U.S. Environmental Protection Agency, “Emission Factors for Greenhouse Gas Inventories,” www.epa.gov/climateleadership/documents/emission-factors.pdf

GORDON | BRANDT | BERGERSON | KOOMEY 33
oils have higher combustion emissions while lighter oils have lower combustion emissions. Canada’s Suncor Synthetic H synthetic crude oil (or SCO), an upgraded bitumen-based oil sand, has combustion emissions of nearly 565 kilograms of CO2 equivalent per barrel of crude, whereas Kazakhstan Tengiz oil is estimated to yield a petroleum product slate that emits 390 kilograms per barrel. This range of absolute variation (155 kilograms CO2 equivalent GHG emissions) is almost equal to the absolute range in upstream emissions shown in figure 3.
FIGURE 11OPEM GHG Emission Results for 30 Phase 1 OCI Test Oils
Can
ada
Sunc
or S
ynth
etic
H (S
CO)
Can
ada
Sunc
or S
ynth
etic
A (S
CO)
Vene
zuel
a H
amac
aC
anad
a Sy
ncru
de S
ynth
etic
(SCO
)U
.S. C
alifo
rnia
Sou
th B
elrid
geC
hina
Boz
hong
U.S
. Cal
iforn
ia W
ilmin
gton
Nig
eria
Bon
nyN
iger
ia O
bagi
Braz
il Fr
ade
Can
ada
Cold
Lak
e (D
ilbit)
Indo
nesi
a D
uri
U.S
. Cal
iforn
ia M
idw
ay S
unse
tA
ngol
a G
irass
olA
ngol
a Ku
itoBr
azil
Lula
U.S
. Gul
f Mar
sC
anad
a H
iber
nia
U.S
. Ala
ska
Nor
th S
lope
Aze
rbai
jan
Aze
ri Li
ght
Kuw
ait R
ataw
iIra
q Zu
bair
Russ
ia C
hayv
oU
.S. G
ulf T
hund
er H
orse
Nor
way
Eko
fisk
Can
ada
Mid
ale
UK
Bren
tU
K Fo
rtie
sN
iger
ia A
gbam
iKa
zakh
stan
Ten
giz
600
500
400
300
200
100
0
Dow
nstre
am G
HG
Emiss
ions
(kg
CO2
eq./
bbl c
rude
)
Oil Field Country and NameSource: Authors’ calculations
Note: Unlike the other OCI test oils, Cold Lake dilbit is not composed of a full barrel of oil.
LightConventionalHigh Gas
Ultra-DeepHeavyDepleted/Watery Oil
High SteamHigh FlareExtra-Heavy

34 KNOW YOUR OIL
CARNEGIE ENDOWMENT fOR INTERNATIONAL PEACE
OPEm CHALLENGES
The main uncertainties that arise regarding downstream emissions are related to product outputs from PRELIM. Combustion emission factors, which have been measured for decades, are updated routinely, and have less uncertainty associated with them, although as product specifications and engines change over time, so too will emission factors. And small changes in emission factors can lead to large changes in total emissions given large product output volumes.
Product transport emissions, meanwhile, are highly uncertain. But they are thought to be relatively small, except in possible extreme cases. The routes and distances different prod-ucts take from the refinery to market are highly variable and largely opaque. Changing trade patterns are rarely disaggregated by product. Domestic as well as transnational petroleum product movements are often not made public. Without origin-to-destination data from refineries to end point, it is highly uncertain what modes and distances prod-ucts travel and the emissions they cause.

GORDON | BRANDT | BERGERSON | KOOMEY 35
OVERALL RESULTS FROm OCI PHASE 1
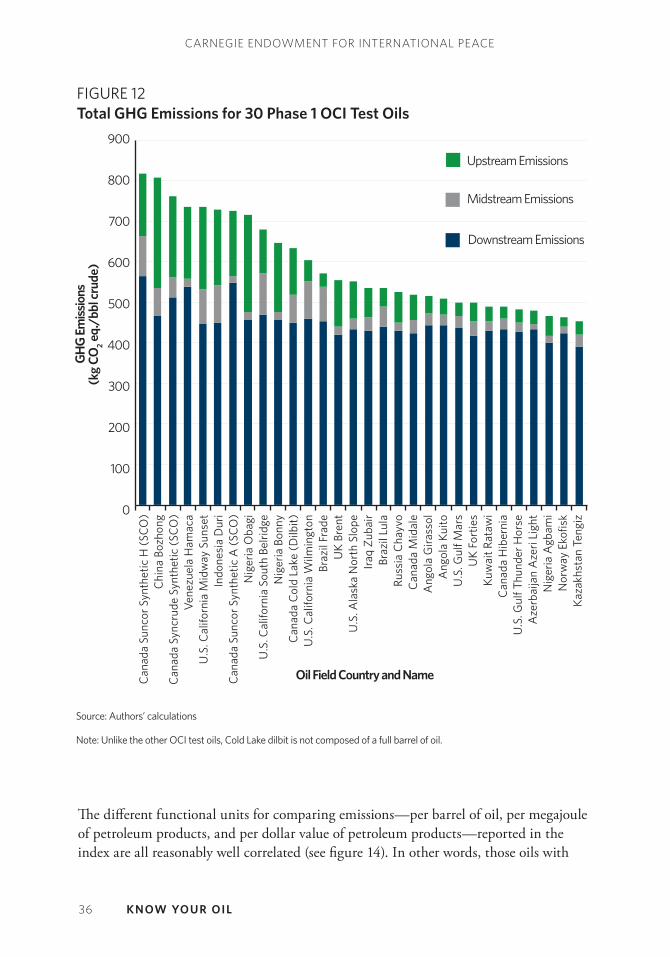
PUTTING THE PIECES of the Oil-Climate Index together results in the total GHG footprint for different oils. Results are reported per barrel of crude input (see figure 12). There is an over 80 percent difference between the highest GHG-emitting oil and the lowest on a per barrel basis. Since the selection of which oils to analyze in Phase 1 was influenced by data availability, it is impossible to know if this sample includes the full range of oils’ emissions.
The share of total GHG emissions from different parts of the oil supply chain varies widely by oil. OPGEE emissions range from under 5 percent to 33 percent for different oils, PRELIM emissions range from 3 to 15 percent, and OPEM emissions range from 60 to 90 percent.
The Oil-Climate Index selects oil volume (per barrel of crude) as the default basis. But emissions are also reported per unit of energy (per megajoule of product), or by product value (in dollars of product) (see figure 13).
When emissions are calculated per megajoule or dollar value of petroleum products deliv-ered, a similar, variable relationship holds as when measured per barrel of crude oil.
36 KNOW YOUR OIL
CARNEGIE ENDOWMENT FOR INTERNATIONAL PEACE
The different functional units for comparing emissions—per barrel of oil, per megajoule of petroleum products, and per dollar value of petroleum products—reported in the index are all reasonably well correlated (see figure 14). In other words, those oils with
FIGURE 12Total GHG Emissions for 30 Phase 1 OCI Test Oils
Can
ada
Sunc
or S
ynth
etic
H (S
CO)
Chi
na B
ozho
ngC
anad
a Sy
ncru
de S
ynth
etic
(SCO
)Ve
nezu
ela
Ham
aca
U.S
. Cal
iforn
ia M
idw
ay S
unse
tIn
done
sia
Dur
iC
anad
a Su
ncor
Syn
thet
ic A
(SCO
)N
iger
ia O
bagi
U.S
. Cal
iforn
ia S
outh
Bel
ridge
Nig
eria
Bon
nyC
anad
a Co
ld L
ake
(Dilb
it)U
.S. C
alifo
rnia
Wilm
ingt
onBr
azil
Frad
eU
K Br
ent
U.S
. Ala
ska
Nor
th S
lope
Iraq
Zuba
irBr
azil
Lula
Russ
ia C
hayv
oC
anad
a M
idal
eA
ngol
a G
irass
olA
ngol
a Ku
itoU
.S. G
ulf M
ars
UK
Fort
ies
Kuw
ait R
ataw
iC
anad
a H
iber
nia
U.S
. Gul
f Thu
nder
Hor
seA
zerb
aija
n A
zeri
Ligh
tN
iger
ia A
gbam
iN
orw
ay E
kofis
kKa
zakh
stan
Ten
giz
900
800
700
600
500
400
300
200
100
0
GH
G Em
issio
ns(k
g CO
2 eq
./bb
l cru
de)
Source: Authors’ calculations
Note: Unlike the other OCI test oils, Cold Lake dilbit is not composed of a full barrel of oil.
Oil Field Country and Name
Upstream Emissions
Midstream Emissions
Downstream Emissions

GORDON | BRANDT | BERGERSON | KOOMEY 37
greater per barrel GHG emission footprints, such as extra-heavy synthetic crude oils from Canada, heavier depleted oils from California, and highly flared oils from Nigeria, appear to also have higher emissions per U.S. dollar and per megajoule.
FIGURE 13Total GHG Emissions per Megajoule (left) and per Dollar (right) for 30 Phase 1 OCI Test Oils
12
10
8
6
4
2
0
Note: Petcoke prices are from 2014 data; all other petroleum products are from 2015 data. Unlike the other OCI test oils, Cold Lake dilbit is not composed of a full barrel of oil.
Chi
na B
ozho
ngC
anad
a Su
ncor
Syn
thet
ic H
(SCO
)C
anad
a Sy
ncru
de S
ynth
etic
(SCO
)C
anad
a Su
ncor
Syn
thet
ic A
(SCO
)In
done
sia
Dur
iU
.S. C
alifo
rnia
Mid
way
Sun
set
Vene
zuel
a H
amac
aN
iger
ia O
bagi
U.S
. Cal
iforn
ia S
outh
Bel
ridge
Can
ada
Cold
Lak
e (D
ilbit)
Nig
eria
Bon
nyU
.S. C
alifo
rnia
Wilm
ingt
onU
K Br
ent
Braz
il Fr
ade
U.S
. Ala
ska
Nor
th S
lope
Iraq
Zuba
irRu
ssia
Cha
yvo
Can
ada
Mid
ale
Braz
il Lu
laU
K Fo
rtie
sN
iger
ia A
gbam
iA
ngol
a G
irass
olA
ngol
a Ku
itoKa
zakh
stan
Ten
giz
U.S
. Gul
f Mar
sKu
wai
t Rat
awi
U.S
. Gul
f Thu
nder
Hor
seA
zerb
aija
n A
zeri
Ligh
tC
anad
a H
iber
nia
Nor
way
Eko
fisk
GH
G E
mis
sion
s(k
g of
CO
2 eq.
/MJ o
f pet
role
um p
rodu
cts)
0.16
0.14
0.12
0.10
0.08
0.06
0.04
0.02
0
GH
G Em
issions(kg CO
2 eq./2015 dollar value of petroleum products)
Oil Field Country and Name
GHGs/Megajoule Products
GHGs/2015 Dollar Value
Sources: Authors’ calculations; U.S. Energy Information Administration, “Spot Prices,” February 9, 2015, www.eia.gov/dnav/pet/pet_pri_spt_s1_d.htm; U.S. Energy Information Administration, “Refiner Petroleum Product Prices by Sales Type,” February 9, 2015, www.eia.gov/dnav/pet/pet_pri_refoth_dcu_nus_m.htm; and Argus Media Ltd., “Energy Argus: Petroleum Coke,” July 2014, www.argusmedia.com/~/media/-Files/PDFs/Samples/Energy-Argus-Petroleum-Coke.pdf?la=en

38 KNOW YOUR OIL
CARNEGIE ENDOWMENT fOR INTERNATIONAL PEACE
FIGURE 14Parity Charts of OCI Functional Units for 30 Phase 1 OCI Test Oils
Source: Authors’ calculations
Notes: 1 equals highest value in all graphs. Petcoke prices are from 2014; all other petroleum products are from 2015 data.
1
0.9
0.8
0.7
0.6
0.5
1
0.9
0.8
0.7
0.6
0.5
1
0.9
0.8
0.7
0.6
0.50.5 0.6 0.7 0.8 0.9 1 0.5 0.6 0.7 0.8 0.9 1 0.5 0.6 0.7 0.8 0.9 1
Relative Emissions per Barrel of Crude
Relative Emissions per Megajoule of Petroleum Product
Relative Emissions per Barrel of Crude
Relat
ive Em
issio
ns p
er 2
015
Dol
lar V
alue o
f Pet
roleu
m P
rodu
ct
Relat
ive Em
issio
ns p
er 2
015
Dol
lar V
alue o
f Pet
roleu
m P
rodu
ct
Rela
tive
Emiss
ions
per
Meg
ajou
le o
f Pet
role
um P
rodu
ct

GORDON | BRANDT | BERGERSON | KOOMEY 39
FINdINGS ANd RECOmmENdATIONS FROm OCI PHASE 1
THE OIL-CLImATE INdEx was developed to alert stakeholders to the full array of climate impacts of oil from various perspectives, with an eye toward informing invest-ment, development, operations, and governance of the oil supply chain. The index provides new knowledge that these stakeholders can take into account to make more informed, strategic, and durable decisions about oil development.
KNOW YOUR OIL
For certain oils, the end products cast nearly as large a GHG footprint as the greenhouse gases produced to extract, refine, and transport them to market (see figure 15). Of the Phase 1 test oils, in addition to Canada Syncrude Synthetic (SCO) and China Bozhong, California Midway Sunset, Indonesia Duri, and Nigeria Obagi have some of the highest costs in climate terms.
Investors, policymakers, and other stakeholders must evaluate oils based on their individual energy factors and GHG emissions, which vary significantly from oil to oil, and take this information into account when making public and private decisions.

40 KNOW YOUR OIL
CARNEGIE ENDOWMENT fOR INTERNATIONAL PEACE
Investors, policymakers, and other stakeholders must evaluate oils based on their individ-ual energy factors and GHG emissions, which vary significantly from oil to oil, and take this information into account when making public and private decisions.
OPEN-SOURCE INFORmATION IS KEY
New knowledge about oil is a critical ingredient for climate decisionmaking. As new oil and other oil-bearing hydrocarbon resources are discovered and technology advances to facilitate their development, new challenges will surface. If history is any guide, this
FIGURE 15Comparing GHG Emissions of Oil Supply Chain Inputs and Outputs for 30 Phase 1 OCI Test Oils
600
500
400
300
200
100
0
GH
G E
mis
sion
s(k
g CO
2 eq
./bb
l cru
de)
Chi
na B
ozho
ngU
.S. C
alifo
rnia
Mid
way
Sun
set
Indo
nesi
a D
uri
Nig
eria
Oba
giC
anad
a Su
ncor
Syn
thet
ic H
(SCO
)C
anad
a Sy
ncru
de S
ynth
etic
(SCO
)U
.S. C
alifo
rnia
Sou
th B
elrid
geVe
nezu
ela
Ham
aca
Nig
eria
Bon
nyC
anad
a Co
ld L
ake
(Dilb
it)C
anad
a Su
ncor
Syn
thet
ic A
(SCO
)U
.S. C
alifo
rnia
Wilm
ingt
onU
K Br
ent
Braz
il Fr
ade
U.S
. Ala
ska
Nor
th S
lope
Iraq
Zuba
irC
anad
a M
idal
eBr
azil
Lula
Russ
ia C
hayv
oU
K Fo
rtie
sA
ngol
a G
irass
olA
ngol
a Ku
itoN
iger
ia A
gbam
iU
.S. G
ulf M
ars
Kaza
khst
an T
engi
zKu
wai
t Rat
awi
U.S
. Gul
f Thu
nder
Hor
seC
anad
a H
iber
nia
Aze
rbai
jan
Aze
ri Li
ght
Nor
way
Eko
fisk
Oil Field Country and Name
OPGEE, PRELIM, and OPEM Transport EmissionsOPEM Combustion Emissions
Source: Authors’ calculations
Note: Unlike the other OCI test oils, Cold Lake dilbit is not composed of a full barrel of oil.

GORDON | BRANDT | BERGERSON | KOOMEY 41
information will likely be inconsistent and randomly reported by industry, governments, and the media. Intellectual property restrictions will limit the usability of data. And arbitrary restrictions on government data collection will make the task of full life-cycle assessment of emissions much more difficult.
Open-source information about oil should be made more accessible and widely available through reporting guidelines and regulatory reform that requires consistent, comparable, and verifiable data (see appendix for more details).
CREATE NEW OIL-CLImATE CLASSIFICATIONS
Total GHG emissions are found to be generally higher in certain classes of oils. The Oil-Climate Index identifies three oil categories that (per barrel) result in higher GHG emissions than other oils: extra-heavy oils, oils whose associated gas is flared, and oils that are high in water or in largely depleted fields with large steam requirements during production (see table 2).
As oils become more unconventional over time, the number and types of oil classifica-tions that are common today are likely to expand. For example, developments related to organic kerogen strewn throughout sedimentary rocks, oils buried in permafrost and elsewhere in the Arctic, bitumen trapped in solid carbonate formations or surrounded by water, turning coal or gas into liquid petroleum products, methane gas trapped in ice, or refinery designs that produce new types of petroleum products could require adding categories of oils to the index in the future.
High GasUltra-Deep
TABLE 2Designated Oil-Climate Categories for 30 Phase 1 OCI Test Oils
Light Conventional Heavy Depleted/Watery Oil
High Steam
High Flare Extra-Heavy
Azerbaijan Azeri Light
Kazakhstan Tengiz
Norway Ekofisk
Kuwait Ratawi
Canada Hibernia
U.S. Alaska North Slope
Angola Kuito
Brazil Frade
U.S. CaliforniaMidway Sunset
UK Brent
U.S. California South Belridge
U.S. California Wilmington
UK Forties
Indonesia Duri
China Bozhong
Nigeria Obagi
Nigeria Bonny
Canada Suncor Synthetic H (SCO)
Canada Suncor Synthetic A (SCO)
Canada Syncrude Synthetic (SCO)
Canada Cold Lake (Dilbit)
Venezuela Hamaca
Russia Chayvo
Brazil Lula
U.S. Gulf Mars
U.S. Gulf Thunder
HorseNigeria Agbami
Angola Girassol
Iraq ZubairCanada Midale

42 KNOW YOUR OIL
CARNEGIE ENDOWMENT fOR INTERNATIONAL PEACE
THINK BEFORE BUILdING INFRASTRUCTURE
Because infrastructure lasts for generations, has opportunity costs, and has significant public impacts—as demonstrated by the debate over pipelines and refinery expansions—crudes should be compared before massive private investments are made in developing the increasingly diverse array of oil resources. It will also be important to analyze OCI impacts alongside shifting oil costs. Oil investments and their climate impacts need to be disaggregated by region, by oil, and throughout the oil supply chain.
To facilitate smart investment, stakeholders should improve the monitoring and reporting of oil capital expenditures in line with the OCI analysis as they relate to the GHG emis-sions expected for individual oil plays.
ExPLORE OPPORTUNITIES FOR GHG EmISSION REdUCTION
The GHG emissions from the 30 test oils run in OCI Phase 1 have a production-weighted average of 570 kilograms CO2 equivalent per barrel oil. Emissions range from 450 to 820 kilograms CO2 equivalent per barrel—nearly a difference of a factor of two in their climate intensity.
This wide range in GHG emissions opens the door for reducing the climate footprint of global oils. This could include extending current federal regulatory requirements for Environmental Impact Statements—documents prepared to describe the effects of proposed activities on the environment—to report oil assays and other OCI-relevant data during oil exploration. Low-emission oils could be slated for new development before high-GHG oils. There could be permit conditions placed on existing oil operations that
bring high-GHG-emitting oils in line with average emitters. And employing best practices to improve operations, such as banning venting and nonemergency flaring, could reduce GHG emissions from exist-ing oil supply chains.
Upstream emissions—from explora-tion to production to oil transport to refining—have the greatest variability in their GHG emissions
depending on venting, flaring, heat, and steam processing inputs. On the one hand, high-gas oils require infrastructure and operational expertise so they do not vent or flare their associated gas. On the other, oils that require significant heat and steam require more
Regulators and governments worldwide need to focus more
on best practices to encourage producers, refiners, and traders
to reduce greenhouse gases from high-emissions operations.

GORDON | BRANDT | BERGERSON | KOOMEY 43
sophisticated methods to generate lower GHG inputs, such as co-generation, solar heat, and other techniques.
Regulators and governments worldwide need to focus more on best practices to encourage producers, refiners, and traders to reduce greenhouse gases from high-emissions opera-tions. Different equipment, better handling, and improved management techniques will need to be employed over time to reduce GHG emissions.
Investors who choose to finance energy projects need to know what oils they are investing in. They should use their leverage to bring oil assays and other OCI-relevant oil data into the public domain and defer backing the development of high-GHG oils until technology is available or policies are adopted to reduce their climate footprints.
RECONCILE OIL ECONOmICS WITH GHG EmISSIONS
Oils’ relative GHG emissions are not a major factor in the market price of crude oil, oil production costs, or the market value of the petroleum product slate from a given barrel of crude. Some crude oils with high GHG emissions, such as oil sands, are more expen-sive to produce, while others, such as high-GHG extra-heavy oils, are less expensive to produce. Still others, such as offshore U.S. Gulf of Mexico oil, have highly variable pro-duction costs but are not as GHG emission intensive.
While it is difficult to access oil cost data, the limited or weak relationship between an oil’s GHG emissions and its production cost factors used by Rystad Energy can be dem-onstrated (see figure 16). Comparing Rystad’s production cost curve to the OCI GHG emission supply curve shows that production costs identified by industry oil categories do not align with social costs imposed by GHG emissions. Greater oil price transparency is necessary to fully assess the relationship between GHG emissions and oil prices.
Oil’s economic and environmental performance may, in fact, trend in the wrong direction: the more valuable the product yield, the higher the oil’s GHG emissions (see figure 17).
Climate policy must take into account the total GHG footprint of the oil supply chain. Otherwise, market forces will continue to override climate concerns.
Addressing this issue requires designing public policies (especially regulatory requirements for oil assays and OCI-related data that are needed to design carbon taxes and other policy mechanisms) to differentiate between global oils. Comprehensive upstream, mid-stream, and downstream emissions must be factored into climate policies—both current implicit shadow prices used by industry and investors and future explicit carbon taxes and other policies.

44 KNOW YOUR OIL
CARNEGIE ENDOWMENT fOR INTERNATIONAL PEACE
ExPANd THE OCI mOdELS
The 30 test oils modeled in the Oil-Climate Index account for approximately 4.5 million barrels per day of production, or 5 percent of global output. Hundreds more oils remain to be evaluated.
In order to accurately compare oils, both those in current production and those poised for future production, the index must be expanded to include a greater number, array, and volume of global oils. It would also allow further analysis of oil types, emission ranges within oil categories, exploration of new oil categories, and identification of outliers.
This expansion begins with the underlying models. Their upgrade requires improved oil data collection (discussed more in the appendix), which in turn will lead to updating and fine-tuning OCI input models. Including more global oils and accounting for new upstream, midstream, and downstream operations are central to the OCI effort.
FIGURE 16Oil Supply Cost Curve With GHG Emission Ranges for 30 Phase 1 OCI Test Oils
$120
$100
$80
$60
$40
$20
$0
900
800
700
600
500
400
0
Glo
bal L
iqui
d Su
pply
Cos
t Cur
ve(2
014
dolla
rs/b
bl c
rude
)G
HG
Emissions
(kg CO2 eq./bbl crude)
Total 2020 Liquid Production(million barrels of oil equivalent per day)
0 20 40 60 80 100
OnshoreMiddle East Shelf
DeepwaterOnshoreRow
Ultra-DeepwaterExtra-
Heavy Oil
OnshoreRussia
NAMShale
Right AxisEmissionsRange
Sources: Rystad Energy (supply cost curve), authors’ calculations (GHG emission ranges)
Note: The 30 Phase 1 OCI test oils did not contain any onshore Russian or North American (NAM) shale oils. If data permits, these oils will be added in OCI Phase 2 results.
Average Emissions
Oil Sands

GORDON | BRANDT | BERGERSON | KOOMEY 45
Update OPGEE
Model verification needs to continue, which involves conducting tests with process simulation software. Real-world cases with operating data could still be used. In addition, an improved flaring analysis that more accurately uses global satellite flaring databases should be integrated because flaring is responsible for high GHG emissions from some gassy oils but not others. Real-time satellite data can determine which oils are flared and how much they are flared; this information is necessary to regulate and monitor these emissions. Flaring GHG emissions must be expanded beyond carbon dioxide to include black carbon formation and the treatment of fugitive methane emissions, which are often unintended and not adequately modeled.
Expand PRELIM
PRELIM will need to be updated and expanded to include a float case, crude blending, and hydrogen surplus credits from lighter oils. A more detailed assessment of refinery fuel
FIGURE 17Market Value Versus GHG Emissions for 30 Phase 1 OCI Test Oils
850
800
750
700
650
600
550
500
450
400$40 $45 $50 $55 $60 $65 $70 $75 $80 $85
GH
G E
mis
sion
s(k
g CO
2 eq
./bb
l cru
de)
Estimated Market Value of Petroleum Products Produced by a Barrel of Crude(2015 dollars/bbl crude)
Source: Authors’ calculations
Note: Petcoke prices are from 2014; all other prices are from 2015.
Extra-HeavyHigh FlareHigh SteamDepleted/Watery OilHeavy
Ultra-DeepHigh Gas
Conventional
Light
Linear estimate; R2=0.55
46 KNOW YOUR OIL
CARNEGIE ENDOWMENT fOR INTERNATIONAL PEACE
gas, asphalt, and bunker fuel needs to be undertaken. Statistical analysis of actual refin-ery operations will be necessary to explore variability and uncertainty in order to further update the PRELIM model.
Update OPEM
Product flows must be further disaggregated to track actual refinery outputs and create smart defaults for transport emissions. Improved harmonization between oils and refin-eries must be built into these models. The refinery selected by OPGEE for a particular oil needs to align with the starting point of petroleum product transport in OPEM. Opportunities for policies and best practices should be explored to reduce GHG emission impacts from downstream transport and other oil uses.
BUILd OUT THE OCI WEB TOOL
A user-friendly OCI web tool has been developed by a team at the Carnegie Endowment for International Peace to inform stakeholders about the results of the modeling of the 30 test oils. The tool permits novice and experienced users alike to explore the index, input-ting user-defined data or manipulating the underlying models themselves. In subsequent versions, new oils will be added to the web tool along with the updates to OPGEE, PRELIM, and OPEM detailed above.
This tool should be used to evaluate policies currently in force or under continued devel-opment, including oil emission intensity standards (for example, California’s Low Carbon Fuel Standard Program and the European Union’s Fuel Quality Directive). It can also be used to develop best practices (oil production and refinery operating decisions) and advance more targeted identification of high-GHG oils throughout the supply chain.
GORDON | BRANDT | BERGERSON | KOOMEY 47
AddRESSING TOmORROW’S OIL-CLImATE CHALLENGES
dESPITE JOHN d. ROCKEFELLER’S successful corporate marketing, there is no standard oil. Likewise, there is no single GHG emission calculus that applies to oils overall. Tracing a GHG emissions supply curve that plots the 30 OCI test oils in terms of their current production volumes and GHG emissions shows how disaggregated oils are in terms of their climate impacts (see figure 18).
Throughout the twentieth century, conventional oils were more plentiful and homoge-neous than today’s unconventional resources. The technological capacity now exists to turn coal and natural gas into liquid petroleum products—in fact, some in China, Qatar, and elsewhere are already doing this. Plastics can be converted back into oil. Extreme heat can be used to accelerate geologic time and turn kerogen, deposited naturally in rocks, into diesel fuel. Abundant methane hydrate supplies—natural gas crystals frozen in the world’s oceans and elsewhere—may someday be tapped and then transformed into liquid fuels.
With technology evolving to tap and transform diverse hydrocarbons into liquid oil resources, the oil business has expanded and greatly diversified. It now encompasses international oil companies, independent oil operators, national oil companies, traders, oligarchs, totalitarian regimes, and all governments across the world.
These advances will bring new opportunities and challenges. Reimagined enhanced oil recovery techniques that inject gases and liquids of all sorts will unearth heavier and more

48 KNOW YOUR OIL
CARNEGIE ENDOWMENT fOR INTERNATIONAL PEACE
depleted oils. Refining innovations will change petroleum products and yield new oil co-products. Expanding refining capacity in China, Nigeria, Saudi Arabia, Singapore, and elsewhere will continue to shift product transport worldwide. Traders will increase their stake in the oil supply chain to benefit from arbitrage amid future oil market volatility.
Meanwhile, in the twentieth century, climate change was not fully recognized as the major global threat it has since become. But global warming is now undeniably a matter of public record.
FIGURE 18Oil-Climate Index Emissions Supply Curve for 30 Phase 1 OCI Test Oils
0 0.5 1 1.5 2 2.5 3 3.5 4 4.5
Tota
l GH
G E
mis
sion
s (k
g CO
2 /b
bl cr
ude)
eq.
Oil Production as of 2013 (millions of barrels per day)
Kaza
khst
an T
engi
z
Nor
way
Eko
fisk
Nig
eria
Agb
ami
Aze
rbai
jan
Aze
ri Li
ght
Can
ada
Hib
erni
a
Kuw
ait R
ataw
iU
K Fo
rtie
sU
.S. G
ulf M
ars
Ang
ola
Kuito
Ang
ola
Gira
ssol
Can
ada
Mid
ale
Russ
ia C
hayv
o
Braz
il Lu
la
U.S
. Ala
ska
Nor
th S
lope
UK
Bren
tBr
azil
Frad
eU
.S. C
alifo
rnia
Wilm
ingt
on
Can
ada
Cold
Lak
e (D
ilbit)
Nig
eria
Bon
nyU
.S. C
alifo
rnia
Sou
th B
elrid
geN
iger
ia O
bagi
Can
ada
Sunc
or S
ynth
etic
A (S
CO)
Indo
nesi
a D
uri
U.S
. Cal
iforn
ia M
idw
ay S
unse
t
Vene
zuel
a H
amac
a
Can
ada
Sync
rude
Syn
thet
ic (S
CO)
Chi
na B
ozho
ng
Can
ada
Sunc
or S
ynth
etic
H (S
CO)
900
800
700
600
500
400
300
200
100
0
Iraq
Zuba
ir
U.S
. Gul
f Thu
nder
Hor
se
Source: Authors’ calculations
Note: Unlike the other OCI test oils, Cold Lake dilbit is not composed of a full barrel of oil.

GORDON | BRANDT | BERGERSON | KOOMEY 49
Tomorrow, oils will compete fiercely against other oils for market share in a warming world. In fact, this struggle has already begun. Oil markets are reeling as supplies are maintained in the face of softening global demand, and the Organization of the Petroleum Exporting Countries (OPEC) and North America (the United States, Canada, and Mexico) each expect the other to cut back production.
The progression from simpler to more complex oil value chains calls for more informa-tion, smarter decisionmaking, and sound policy guidance. The Oil-Climate Index offers
FIGURE 18Oil-Climate Index Emissions Supply Curve for 30 Phase 1 OCI Test Oils
0 0.5 1 1.5 2 2.5 3 3.5 4 4.5
Tota
l GH
G E
mis
sion
s (k
g CO
2 /b
bl cr
ude)
eq.
Oil Production as of 2013 (millions of barrels per day)
Kaza
khst
an T
engi
z
Nor
way
Eko
fisk
Nig
eria
Agb
ami
Aze
rbai
jan
Aze
ri Li
ght
Can
ada
Hib
erni
a
Kuw
ait R
ataw
iU
K Fo
rtie
sU
.S. G
ulf M
ars
Ang
ola
Kuito
Ang
ola
Gira
ssol
Can
ada
Mid
ale
Russ
ia C
hayv
o
Braz
il Lu
la
U.S
. Ala
ska
Nor
th S
lope
UK
Bren
tBr
azil
Frad
eU
.S. C
alifo
rnia
Wilm
ingt
on
Can
ada
Cold
Lak
e (D
ilbit)
Nig
eria
Bon
nyU
.S. C
alifo
rnia
Sou
th B
elrid
geN
iger
ia O
bagi
Can
ada
Sunc
or S
ynth
etic
A (S
CO)
Indo
nesi
a D
uri
U.S
. Cal
iforn
ia M
idw
ay S
unse
t
Vene
zuel
a H
amac
a
Can
ada
Sync
rude
Syn
thet
ic (S
CO)
Chi
na B
ozho
ng
Can
ada
Sunc
or S
ynth
etic
H (S
CO)
900
800
700
600
500
400
300
200
100
0
Iraq
Zuba
ir
U.S
. Gul
f Thu
nder
Hor
se
Source: Authors’ calculations
Note: Unlike the other OCI test oils, Cold Lake dilbit is not composed of a full barrel of oil.

50 KNOW YOUR OIL
CARNEGIE ENDOWMENT fOR INTERNATIONAL PEACE
the means to comprehensively compare oils so climate impacts can be factored into financing, development, operating, and government oversight decisions. All stakeholders
need better information about the GHG emissions embodied in the oil supply chain in order to avoid unin-tended climate consequences.
The large divergence in the climate impacts of global oils underscores the need to pick and choose wisely among resource options. End-use strategies that reduce the combus-
tion of petroleum products—such as improved vehicle fuel efficiency, greater use of alternative fuels, and new mobility options—will no doubt be critical. But demand-side strategies, while necessary, are not sufficient. Oil supply-side strategies must contribute to the solution set as well.
Investors and industry need to make durable asset valuations and infrastructure decisions that will not be stranded by future climate policies and outcomes. Policymakers need up-to-date knowledge to approve permits, set standards, price carbon, and adopt better gover-nance practices overall. And the public needs robust open-source information about oil to better understand the trade-offs between global oils in order to make wise energy choices.
The Oil-Climate Index can shape how consumers and industry approach future oil production and can guide the policies used to address oil-climate concerns. The first phase of the index highlights the large variation in GHG emissions between global oils. Incorporating the index into private and public decisionmaking and expanding this tool to account for a greater share of global oils are critical to reducing the climate impacts of the oil sector.
All stakeholders need better information about the GHG
emissions embodied in the oil supply chain in order to avoid
unintended climate consequences.
GORDON | BRANDT | BERGERSON | KOOMEY 51
APPENdIx: OIL dATA GAPS
OIL mARKETS CANNOT function efficiently without transparent, high-quality infor-mation. Comprehensive information is also a necessary condition for effective policymaking. Oils’ inherent chemical characteristics, their operational specifications, and how they differ from one another under varying sets of conditions are critical informational inputs.
In seeking to obtain and verify these needed oil data, several obstacles have been encountered:
• Oil data inconsistencies: There are hundreds of different global oils and no standard-ized format for oil assays. This makes it virtually impossible to compare oils.
• Data cannot be used without companies’ permission: The oil industry publishes assays, and the fine print can present problems. For example, users who wish to comply with companies’ policies have to obtain permission to reproduce oil data in any format. Therefore, some of the oil data that is available for viewing is not truly “open source” in practice.
• Data is not for sale: Up-to-date, comprehensive oil databases are held by the private sector, often oil consultancies. The price to obtain oil data is typically very high. But even if think tanks and academics can afford the hundreds of thousands of dollars to purchase oil data, it is not necessarily for sale. For example, after lengthy negotiations, a firm would not sell oil data even to academic scholars who were viewed as competitors.

52 KNOW YOUR OIL
CARNEGIE ENDOWMENT fOR INTERNATIONAL PEACE
• Government limitations to collecting data: The U.S. Department of Energy is limited in its reach to expand oil-reporting requirements. For example, one of the authors was told that the department could not establish consistent report-ing requirements for oil data because the U.S. Office of Management and Budget considers oil data collection a duplication of effort from a budgetary perspective. This means that policymakers and the public are at the behest of industry to divulge information that may not be timely, accurate, or consistent.
Publicly available information, at a minimum, must contain expanded data collection as summarized in the figure below.
Open Source Oil-Climate modelingOPGEE (Oil Production Greenhouse Gas Emissions Estimator) Upstream Production data1. Extraction method specifications (primary, secondary, EOR, other)
2. Level of activity per unit production
• Water-to-oil ratio (for primary and secondary production)• Steam-to-oil ratio (for tertiary production)
3. Location (onshore, offshore, with GIS coordinates)
4. Flaring rate
5. Venting rate (level of fugitive emissions)
PRELIm (Petroleum Refinery Life-Cycle Inventory Model) midstream Refining data1. Reporting on updated refinery process energy requirement data
2. Refinery changes that affect petroleum product specifications and quality (especially for bottom- and top-of-the-barrel products that are not regulated for use in vehicle engines)
3. Oil assay parameters (specified below) and reported consistently for each global oil
Each parameter (except MCR/CCR) must be specified at each cut temperature, and cut temperature ranges must be standardized, as specified below or in another consistent format.
Note: Cut temperatures are currently reported out using a variety of inconsistent formats.
• API Gravity
• Density
• Sulfur content (wt %)
• Nitrogen content (mass ppm)
• Hydrogen content
• Volume/Mass Flow (% recovery)
• Micro-carbon residue (MCR) or Conradson carbon residue (CCR)
• Viscosity (cST at 100 °C) for Vacuum Residuum
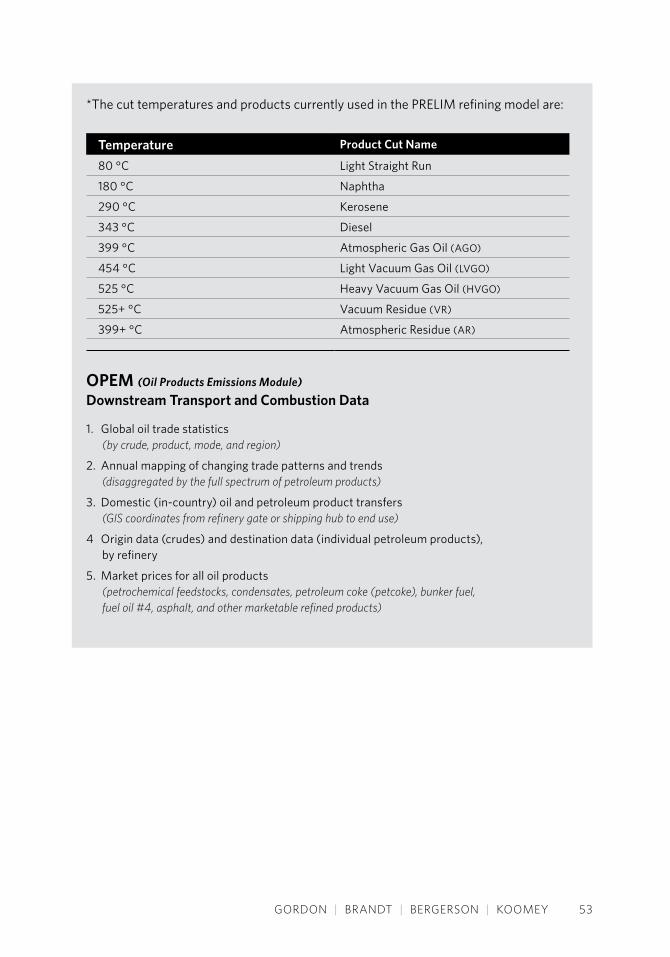
GORDON | BRANDT | BERGERSON | KOOMEY 53
*The cut temperatures and products currently used in the PRELIM refining model are:
Temperature Product Cut Name
80 °C Light Straight Run
180 °C Naphtha
290 °C Kerosene
343 °C Diesel
399 °C Atmospheric Gas Oil (AGO)
454 °C Light Vacuum Gas Oil (LVGO)
525 °C Heavy Vacuum Gas Oil (HVGO)
525+ °C Vacuum Residue (VR)
399+ °C Atmospheric Residue (AR)
OPEm (Oil Products Emissions Module) downstream Transport and Combustion data
1. Global oil trade statistics (by crude, product, mode, and region)
2. Annual mapping of changing trade patterns and trends (disaggregated by the full spectrum of petroleum products)
3. Domestic (in-country) oil and petroleum product transfers (GIS coordinates from refinery gate or shipping hub to end use)
4 Origin data (crudes) and destination data (individual petroleum products), by refinery
5. Market prices for all oil products (petrochemical feedstocks, condensates, petroleum coke (petcoke), bunker fuel, fuel oil #4, asphalt, and other marketable refined products)


GORDON | BRANDT | BERGERSON | KOOMEY 55
NOTES
1 Christophe McGlade and Paul Ekins, “The Geographical Distribution of Fossil Fuels Unused When Limiting Global Warming to 2 °C,” Nature 517, no. 7533 (2015): 187–90, http://dx.doi.org/10.1038/nature14016.
2 Jonathan Koomey, “Moving Beyond Benefit-Cost Analysis of Climate Change,” Environmental Research Letters 8, no. 041005, December 2, 2013, http://iopscience.iop.org/1748-9326/8/4/041005; Malte Meinshausen, Nicolai Meinshausen, William Hare, Sarah C. B. Raper, Katja Frieler, Reto Knutti, David J. Frame, and Myles R. Allen, “Greenhouse-Gas Emission Targets for Limiting Global Warming to 2 Degrees C,” Nature 458 (April 30, 2009): 1158–62, www.nature.com/nature/journal/v458/n7242/full/nature08017.html; University College of London, “Which Fossil Fuels Must Remain in the Ground to Limit Global Warming?” January 7, 2015, www.ucl.ac.uk/news/news-articles/0115/070115-fossil-fuels; http://unfccc.int/resource/docs/2009/cop15/eng/l07.pdf.
3 OPGEE was developed by Hassan El-Houjeiri, Kourosh Vafi, Scott McNally, and Adam Brandt at Stanford University. Significant assistance was provided by James Duffy of the California Air Resources Board. The State of California adopted OPGEE, the first open-source GHG emissions tool for oil and gas operations, through rulemaking for the development of California’s Low Carbon Fuel Standard in November 2012. New OPGEE versions have since been released. The version of OPGEE used in generating this report is OPGEE version 1.1 draft D. For the OPGEE User Guide and Technical Documentation see https://pangea.stanford.edu/researchgroups/eao/research/opgee-oil-production-greenhouse-gas-emissions-estimator.

56 KNOW YOUR OIL
CARNEGIE ENDOWMENT fOR INTERNATIONAL PEACE
4 PRELIM was developed by Jessica Abella, Kavan Motazedi, and Joule Bergerson at the University of Calgary. The following individuals and institutions have been involved in the development of the open-source PRELIM model: researchers on the LCAOST project includ-ing Professor Heather MacLean; Natural Resources Canada; Alberta Innovates: Energy and Environment Solutions; Carbon Management Canada; National Science and Engineering Research Council of Canada; Carnegie Endowment for International Peace; LCAOST Oil Sands Industry Consortium. For PRELIM User Guide and Technical Documentation see http://ucalgary.ca/lcaost/PRELIM.
5 “Worldwide Refineries—Capacities as of Jan. 1, 2014,” Oil & Gas Journal, December 31, 2014.
6 Emissions are calculated according to the displacement of like products by energy value. Any natural gas produced and then exported off-site is assumed to displace average natural gas emis-sions calculated in the GREET (Greenhouse Gases, Regulated Emissions, and Energy Use in Transportation) model. Any electricity generated on-site displaces GREET natural gas-based electric power.
7 See the following papers for analysis of OPGEE estimate improvement with increas-ing data availability: A. R. Brandt, Y. Sun, and K. Vafi, “Uncertainty in Regional-Average Petroleum GHG Intensities: Countering Information Gaps With Targeted Data Gathering,” Environmental Science & Technology, DOI: 10.1021/es505376t, 2014; K. Vafi, A. R. Brandt, “Uncertainty of Oil Field GHG Emissions Resulting From Information Gaps: A Monte Carlo Approach,” Environmental Science & Technology, DOI: 10.1021/es502107s, 2014.
8 The “fixed” case, where the volumes of final products are set and the amount of input crude varies to provide the final product slate, is currently in development. The “fixed” case will be capable of either fixing the gasoline to diesel ratio or a specific set of final product volumes.
9 Jessica P. Abella and Joule A. Bergerson, “Model to Investigate Energy and Greenhouse Gas Emissions Implications of Refining Petroleum: Impacts of Crude Quality and Refinery Configuration,” Environmental Science & Technology 46, no. 24 (2012): 13037–13047, DOI: 10.1021/es3018682, http://pubs.acs.org/doi/abs/10.1021/es3018682.
10 Incomplete assays containing as few as four fractions and high-temperature simulated distilla-tion (HTSD) curves can be put into PRELIM, but this introduces uncertainty that can affect emission outputs.
11 Pioneers in this field include: Argonne National Laboratory GREET Lifecycle Model (Greenhouse Gases, Regulated Emissions, and Energy Use in Transportation Model), https://greet.es.anl.gov; Lifecycle Associates, www.lifecycleassociates.com; Natural Resources Canada GHGenius Model, www.ghgenius.ca; International Council on Clean Transportation, www.theicct.org/info/assets/RoadmapV1/ICCT%20Roadmap%20Model%20Version%201-0%20Documentation.pdf; Jacobs Consultancy, http://eipa.alberta.ca/media/39640/life%20cycle%20analysis%20jacobs%20final%20report.pdf; and others.
12 GREET 1 2013, sheet “EF,” Table 2.3, “Emission Factors of Fuel Combustion: Feedstock and Fuel Transportation From Product Origin to Product Destination Back to Product Origin (Grams per mmBtu of Fuel Burned),” Energy Intensities were taken from GREET 1 2014 on the properties page “Step Parameters” for each mode of transport, respectively.


CARNEGIE ENdOWmENT FOR INTERNATIONAL PEACE
The Carnegie Endowment for International Peace is a unique global network of policy research centers in Russia, China, Europe, the Middle East, and the United States. Our mission, dating back more than a century, is to advance the cause of peace through analy-sis and development of fresh policy ideas and direct engagement and collaboration with decisionmakers in government, business, and civil society. Working together, our centers bring the inestimable benefit of multiple national viewpoints to bilateral, regional, and global issues.
The Carnegie Energy and Climate Program engages global experts working on issues relating to energy technology, environmental science, and political economy to develop practical solutions for policymakers around the world. The program aims to provide the leadership and the policy framework necessary to minimize the risks that stem from global climate change and to reduce competition for scarce resources.


D E B O R A H G O R D O N
A D A M B R A N D T
J O U L E B E R G E R S O N
J O N AT H A N K O O M E Y
C R E A T I N G A G L O B A L O I L - C L I M A T E I N D E X