Embed Size (px)
Citation preview
DEALERS’ VIEW OF WARRANTY: SGS GLOBAL WARRANTY SATISFACTION SURVEY RESULTS FOR THE UNITED STATES
WARRANTY ADMINISTRATION SYSTEMS SERVE TO IMPROVE AFTER SALES PROCESSES AND BUILD LONG-TERM CUSTOMER LOYALTY
JULY 2014
AUTHORS
Roland Gagel
Global Automotive Sector Manager, SGS
Mike Holmes
Automotive Development Manager, SGS North America
1
The North American Dealer Warranty Survey 2014 is part of the first ever global warranty satisfaction survey of automotive dealers. It has intensively researched the business areas of sales, aftersales and warranty from interviews with 480 dealers in the United States representing 16 brands. The results will enable those responsible for warranties at vehicle manufacturers to understand their brand’s position compared to the competition. It gives a clear benchmark for the warranty controlling processes of hotlines, field force and audits.
The trend of some key results between the survey in 2014 versus the previous survey conducted in 2013 will aid organizations to understand the effectiveness of any changes implemented in the period between.
The 2014 survey, conducted between March and April, indicates overall satisfaction with the ease of warranty handling, goodwill policies and extended warranty programs with findings based on high-level analysis that lends support to the conclusions of this paper*.
I. EXECUTIVE SUMMARY
CONTENTSI. EXECUTIVE SUMMARY 1
II. THE ROLE OF WARRANTY ADMINISTRATION FOR DEALER
AND CUSTOMER SATISFACTION 2
III. SCOPE OF THE STUDY 3
IV. RESULTS IN DETAIL 5
V. MAIN FINDINGS 19
VI. CONCLUSIONS 19
*In this whitepaper results are compared
against a similar warranty satisfaction
survey completed by SGS in 2013.
2
The goal was to evaluate franchised dealers satisfaction of the key tools for modern warranty management, which are supplied to them by vehicle manufacturers. Original Equipment Manufacturers (OEMs) provide support and controls for their dealers when repairing vehicles during the new vehicle warranty period, and out-of-warranty under goodwill guidelines.
The focus of the study was the overall processes and dealer perception of the warranty management system which was evaluated in four main areas:
• Ease of conducting business
• Warranty control mechanisms
• Policy and extended warranty
• Satisfaction with the payment terms
In particular, warranty management that involves OEM personnel and their
service providers, each of whom plays a vital role in the cost structure of an OEM, was researched. When looking at the cost levels of call centres, field force and auditors, an OEM has to carefully evaluate if their deployed resources contribute to warranty cost control and to dealer and customer satisfaction or whether they are counterproductive.
One underlying assumption of the study is that inefficient warranty processes that dissatisfy dealers also create dissatisfaction with customers. Therefore, the survey asked for details on potential warranty operations improvement areas from the dealers’ viewpoint.
Finally, in addition to the 2013 survey, questions regarding the warranty IT system and the effective support of customer loyalty by the OEMs’ warranty programs were evaluated.
II. THE ROLE OF WARRANTY ADMINISTRATION FOR DEALER AND CUSTOMER SATISFACTION
INEFFICIENT WARRANTY PROCESSES THAT DISSATISFY DEALERS ALSO CREATE DISSATISFACTION WITH CUSTOMERS.
3
SCOPE AND PARAMETERS
The study was conducted on behalf of SGS between March and April 2014 by an independent and well recognized market research company based in the US. Dealer data was retrieved from the internet and the method used was Computer Assisted Telephone Interviews (CATI). The preferred role of the interviewed person was warranty administrator, service manager or service advisor (i.e. those people in a dealership that work daily on warranty related matters).
Countries within the scope
• United States
Brands within the scope and grouping of OEMs
The survey included 16 brands grouped into 3 segments of manufacturers:
Asian
• Honda
• Hyundai
• KIA
• Mazda
• Mitsubishi
• Nissan
• Subaru
• Toyota
US Domestic
• Chrysler
• Ford Motor Company
• General Motors
European
• Audi
• BMW
• Mercedes Benz
• Volkswagen
• Volvo
The grouping was done in order to
enable publication of the study to
a wide audience. The study results
with detailed brand information are
not published and will only be made
available to interested parties under non-
disclosure agreements.
Size of the samples
Thirty dealers per brand were randomly selected from dealer address data files available on the internet. Multi-branded dealers were asked to answer the questions referring to their ‘main brand’, as identified by the dealer themselves.
SURVEY QUESTIONS
The goal of the study was to have easily understood questions that yielded comparable answers between dealers. Except for Q17-Q19, no verbatim answers were recorded, only categorized answers to questions. Seven new questions were added to this 2014 edition of the survey.
Brand background
Q1. What is your main brand?
Key questions (Satisfaction Index)
Q2. When you think about warranty and administration, how would you rate warranty processing with your OEM? (This question is later referred to as the index question.)
Q3. How has it developed over the past 5 years?
III. SCOPE OF THE STUDY
Warranty administration groups
Q4. Is there a warranty field force?
Q5. How satisfied are you with the warranty field force?
Q6. Is there a warranty hotline?
Q7. How satisfied are you with the warranty hotline?
Q8. Is there a warranty audit by your OEM?
Q9. How satisfied are you with the warranty audit?
Q10. How satisfied are you with the warranty IT system of your OEM?
Goodwill and extended warranty
products
Q11. How do you rate the administration of your main brand’s goodwill ?
Q12. How do you rate the actual level of policy goodwill that is granted, for your OEM?
Q13. How do you rate the handling of the extended warranty products of your OEM?
Q14. How satisfied are you with the actual coverage of the extended warranty products your OEM offers?
4
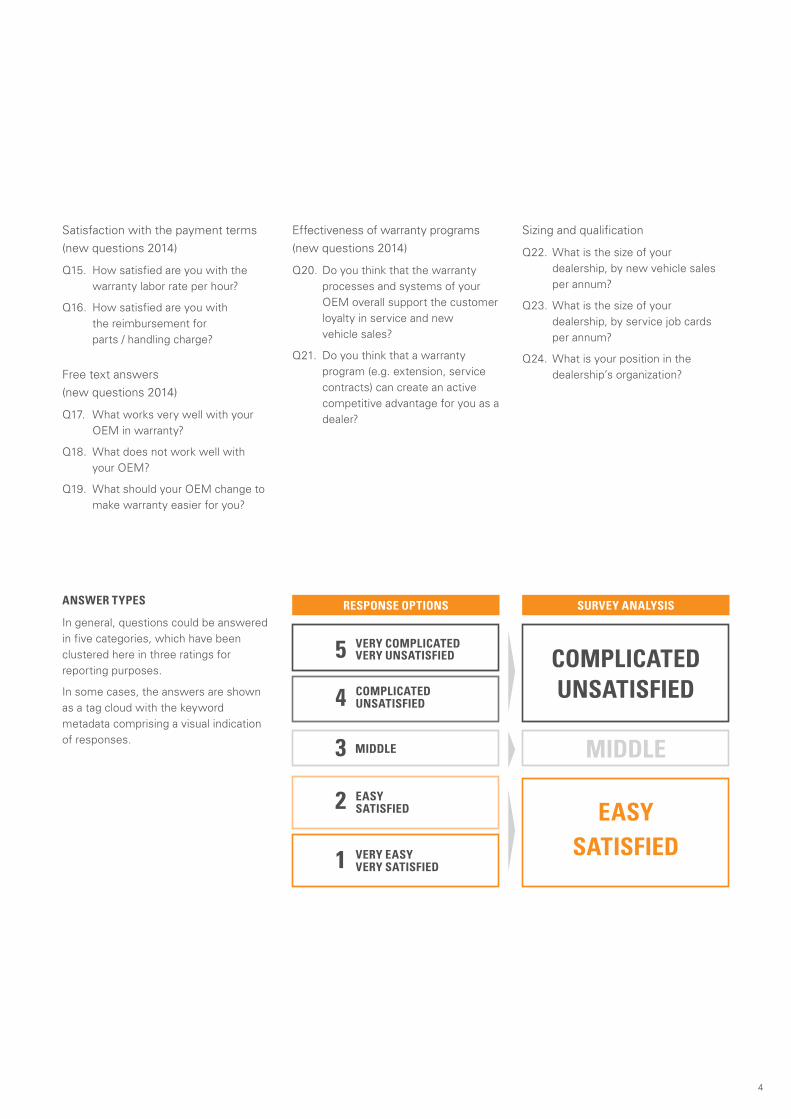
Satisfaction with the payment terms
(new questions 2014)
Q15. How satisfied are you with the warranty labor rate per hour?
Q16. How satisfied are you with the reimbursement for parts / handling charge?
Free text answers
(new questions 2014)
Q17. What works very well with your OEM in warranty?
Q18. What does not work well with your OEM?
Q19. What should your OEM change to make warranty easier for you?
Effectiveness of warranty programs
(new questions 2014)
Q20. Do you think that the warranty processes and systems of your OEM overall support the customer loyalty in service and new vehicle sales?
Q21. Do you think that a warranty program (e.g. extension, service contracts) can create an active competitive advantage for you as a dealer?
Sizing and qualification
Q22. What is the size of your dealership, by new vehicle sales per annum?
Q23. What is the size of your dealership, by service job cards per annum?
Q24. What is your position in the dealership’s organization?
ANSWER TYPES
In general, questions could be answered in five categories, which have been clustered here in three ratings for reporting purposes.
In some cases, the answers are shown as a tag cloud with the keyword metadata comprising a visual indication of responses.
RESPONSE OPTIONS SURVEY ANALYSIS
COMPLICATEDUNSATISFIED
MIDDLE
EASYSATISFIED
5
4 3 MIDDLE
2
1
VERY COMPLICATED VERY UNSATISFIED
COMPLICATEDUNSATISFIED
EASYSATISFIED
VERY EASYVERY SATISFIED

5
Q2. WHEN YOU THINK ABOUT
WARRANTY AND ADMINISTRATION,
HOW WOULD YOU RATE WARRANTY
PROCESSING WITH YOUR OEM?
Overall results
• Asian brands continue to outpace both European and Domestic
• All 3 groups make improvements since 2013 results
• Domestic brands improved 17% (from 55% to 72%) and rate higher than European
• Industry average 75% (increase of 10% from 65% in 2013 survey)
IV. RESULTS IN DETAIL
STRONG IMPROVEMENT ACROSS INDUSTRY COMPARED TO 2013.
ASIAN BRANDS CONTINUE TO OUTPACE EUROPEAN AND DOMESTIC.
DOMESTIC BRANDS IMPROVED 17% SINCE 2013 SURVEY RESULTS.
Brand results:
• European brands finished below the industry average (75%) despite an 8% improvement over 2013 results
• Gap of 37% between the highest and lowest ratings
WARRANTY ADMINISTRATION FROM A DEALER POINT OF VIEW (%)
COMPLICATED MIDDLE EASY INDUSTRY AVERAGE
100
90
80
70
60
50
40
30
20
10
0US Domestic AsianEuropean
*Industry Average
WARRANTY ADMINISTRATION FROM A DEALER POINT OF VIEW (%)
COMPLICATED MIDDLE EASY BEST AND WORST IN CLASS
100
90
80
70
60
50
40
30
20
10
0 T W D S C Z P N * Q F G A L R X B
6
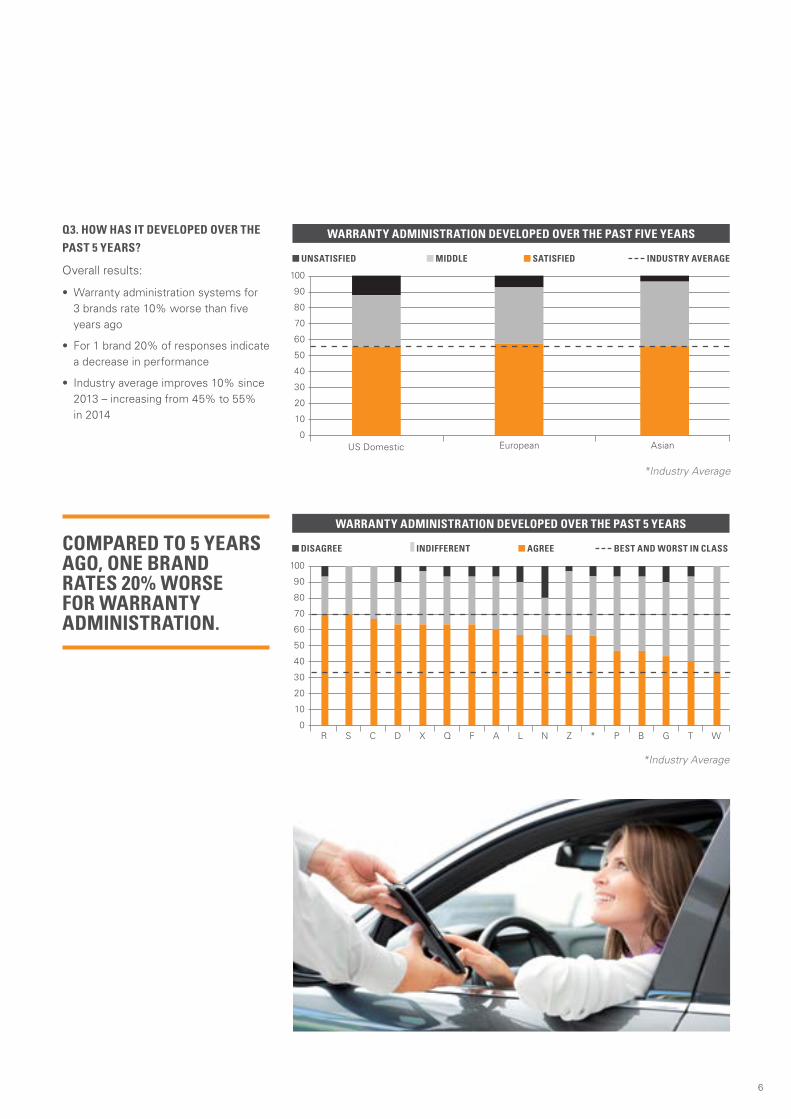
Q3. HOW HAS IT DEVELOPED OVER THE
PAST 5 YEARS? Overall results:
• Warranty administration systems for 3 brands rate 10% worse than five years ago
• For 1 brand 20% of responses indicate a decrease in performance
• Industry average improves 10% since 2013 – increasing from 45% to 55% in 2014
COMPARED TO 5 YEARS AGO, ONE BRAND RATES 20% WORSE FOR WARRANTY ADMINISTRATION.
*Industry Average
*Industry Average
WARRANTY ADMINISTRATION DEVELOPED OVER THE PAST FIVE YEARS
UNSATISFIED MIDDLE SATISFIED INDUSTRY AVERAGE
100
90
80
70
60
50
40
30
20
10
0US Domestic AsianEuropean
WARRANTY ADMINISTRATION DEVELOPED OVER THE PAST 5 YEARS
DISAGREE INDIFFERENT AGREE BEST AND WORST IN CLASS
100
90
80
70
60
50
40
30
20
10
0 R S C D X Q F A L N Z * P B G T W
7
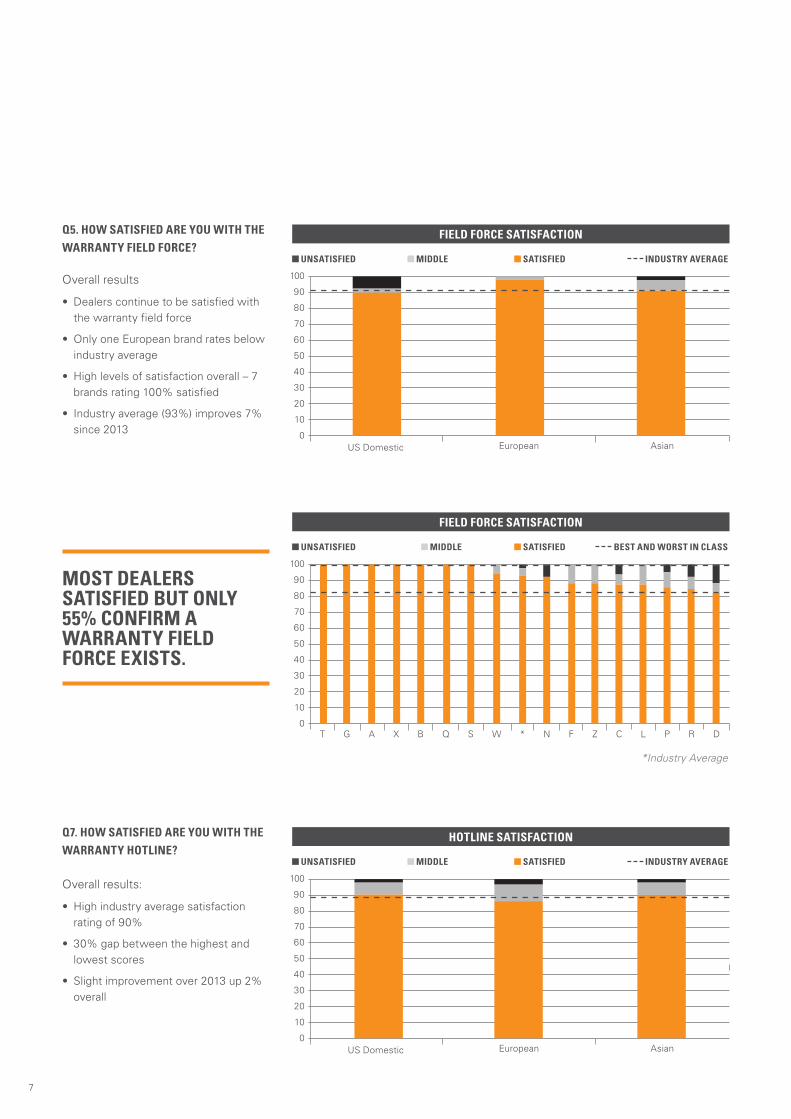
Q7. HOW SATISFIED ARE YOU WITH THE
WARRANTY HOTLINE?
Overall results:
• High industry average satisfaction rating of 90%
• 30% gap between the highest and lowest scores
• Slight improvement over 2013 up 2% overall
FIELD FORCE SATISFACTIONQ5. HOW SATISFIED ARE YOU WITH THE
WARRANTY FIELD FORCE? Overall results
• Dealers continue to be satisfied with the warranty field force
• Only one European brand rates below industry average
• High levels of satisfaction overall – 7 brands rating 100% satisfied
• Industry average (93%) improves 7% since 2013
UNSATISFIED MIDDLE SATISFIED INDUSTRY AVERAGE
100
90
80
70
60
50
40
30
20
10
0
MOST DEALERS SATISFIED BUT ONLY 55% CONFIRM A WARRANTY FIELD FORCE EXISTS.
*Industry Average
FIELD FORCE SATISFACTION
UNSATISFIED MIDDLE SATISFIED BEST AND WORST IN CLASS
100
90
80
70
60
50
40
30
20
10
0
US Domestic AsianEuropean
T G A X B Q S W * N F Z C L P R D
HOTLINE SATISFACTION
UNSATISFIED MIDDLE SATISFIED INDUSTRY AVERAGE
100
90
80
70
60
50
40
30
20
10
0US Domestic AsianEuropean
8
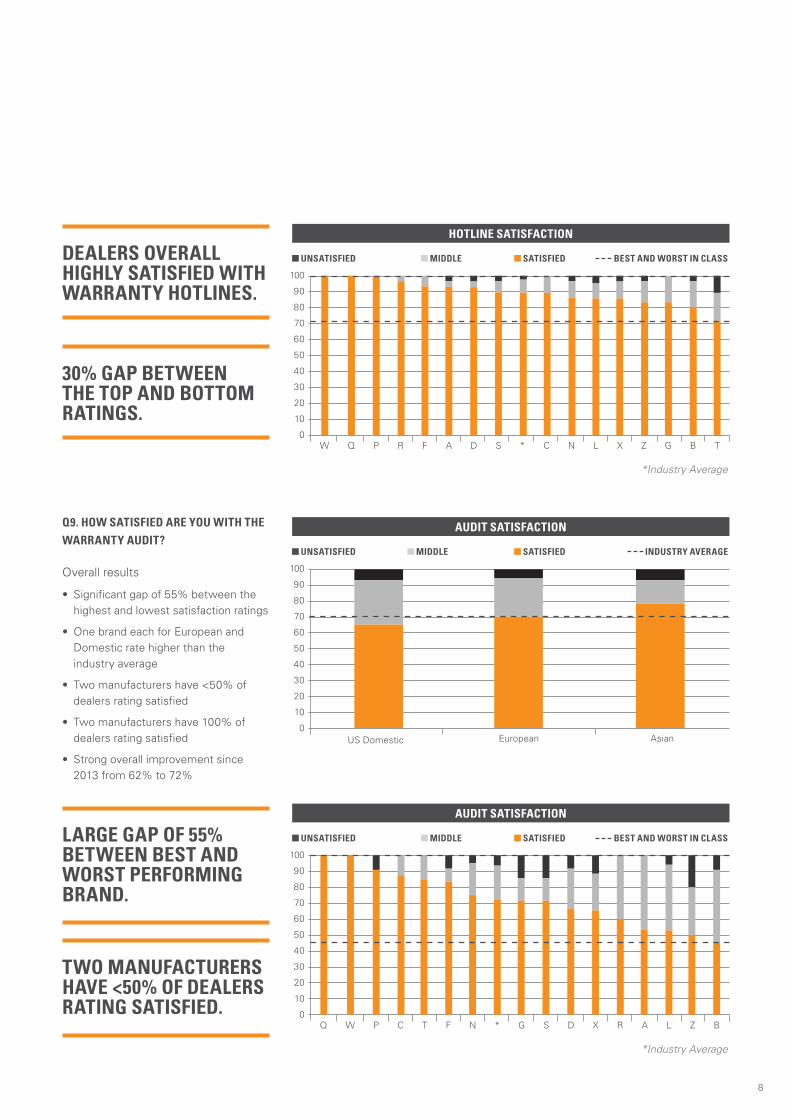
Q9. HOW SATISFIED ARE YOU WITH THE
WARRANTY AUDIT? Overall results
• Significant gap of 55% between the highest and lowest satisfaction ratings
• One brand each for European and Domestic rate higher than the industry average
• Two manufacturers have <50% of dealers rating satisfied
• Two manufacturers have 100% of dealers rating satisfied
• Strong overall improvement since 2013 from 62% to 72%
DEALERS OVERALL HIGHLY SATISFIED WITH WARRANTY HOTLINES.
30% GAP BETWEEN THE TOP AND BOTTOM RATINGS.
AUDIT SATISFACTION
UNSATISFIED MIDDLE SATISFIED INDUSTRY AVERAGE
100
90
80
70
60
50
40
30
20
10
0US Domestic AsianEuropean
*Industry Average
LARGE GAP OF 55% BETWEEN BEST AND WORST PERFORMING BRAND.
TWO MANUFACTURERS HAVE <50% OF DEALERS RATING SATISFIED.
AUDIT SATISFACTION
UNSATISFIED MIDDLE SATISFIED BEST AND WORST IN CLASS
100
90
80
70
60
50
40
30
20
10
0 Q W P C T F N * G S D X R A L Z B
*Industry Average
HOTLINE SATISFACTION
UNSATISFIED MIDDLE SATISFIED BEST AND WORST IN CLASS
100
90
80
70
60
50
40
30
20
10
0 W Q P R F A D S * C N L X Z G B T
9
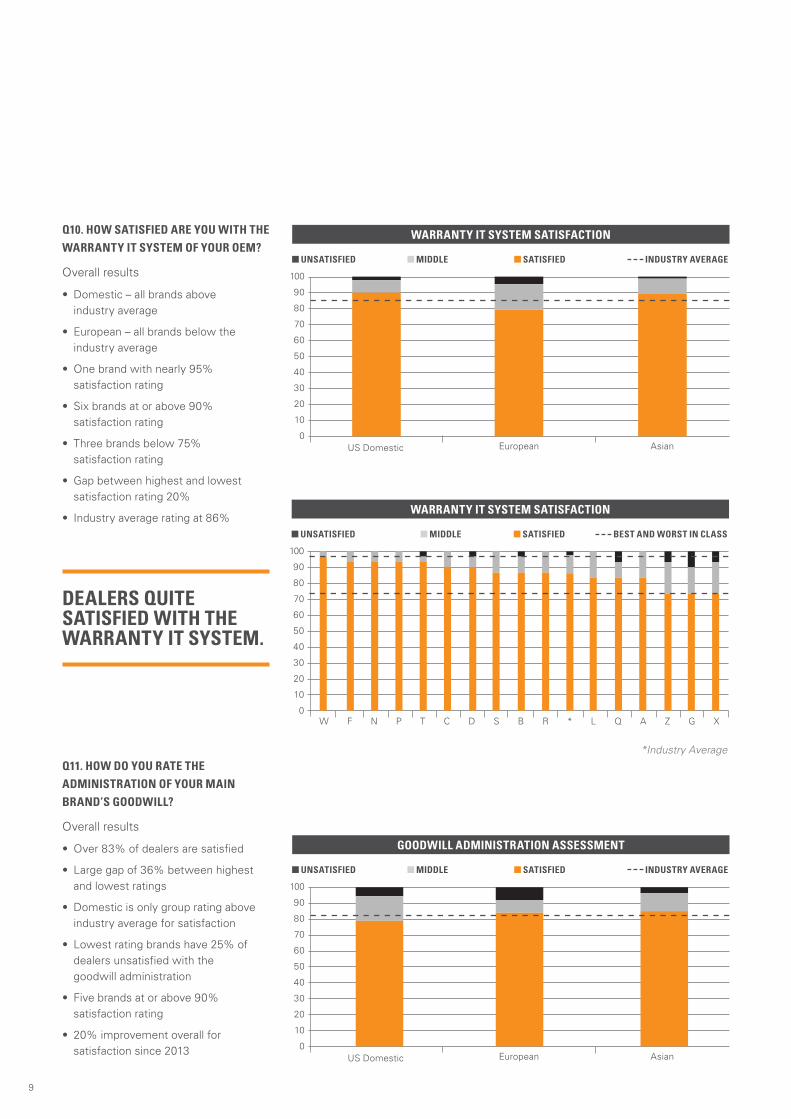
Q10. HOW SATISFIED ARE YOU WITH THE
WARRANTY IT SYSTEM OF YOUR OEM?
Overall results
• Domestic – all brands above industry average
• European – all brands below the industry average
• One brand with nearly 95% satisfaction rating
• Six brands at or above 90% satisfaction rating
• Three brands below 75% satisfaction rating
• Gap between highest and lowest satisfaction rating 20%
• Industry average rating at 86%
Q11. HOW DO YOU RATE THE
ADMINISTRATION OF YOUR MAIN
BRAND’S GOODWILL?
Overall results
• Over 83% of dealers are satisfied
• Large gap of 36% between highest and lowest ratings
• Domestic is only group rating above industry average for satisfaction
• Lowest rating brands have 25% of dealers unsatisfied with the goodwill administration
• Five brands at or above 90% satisfaction rating
• 20% improvement overall for satisfaction since 2013
DEALERS QUITE SATISFIED WITH THE WARRANTY IT SYSTEM.
WARRANTY IT SYSTEM SATISFACTION
UNSATISFIED MIDDLE SATISFIED INDUSTRY AVERAGE
100
90
80
70
60
50
40
30
20
10
0US Domestic AsianEuropean
*Industry Average
WARRANTY IT SYSTEM SATISFACTION
UNSATISFIED MIDDLE SATISFIED BEST AND WORST IN CLASS
100
90
80
70
60
50
40
30
20
10
0 W F N P T C D S B R * L Q A Z G X
GOODWILL ADMINISTRATION ASSESSMENT
UNSATISFIED MIDDLE SATISFIED INDUSTRY AVERAGE
100
90
80
70
60
50
40
30
20
10
0US Domestic AsianEuropean
10
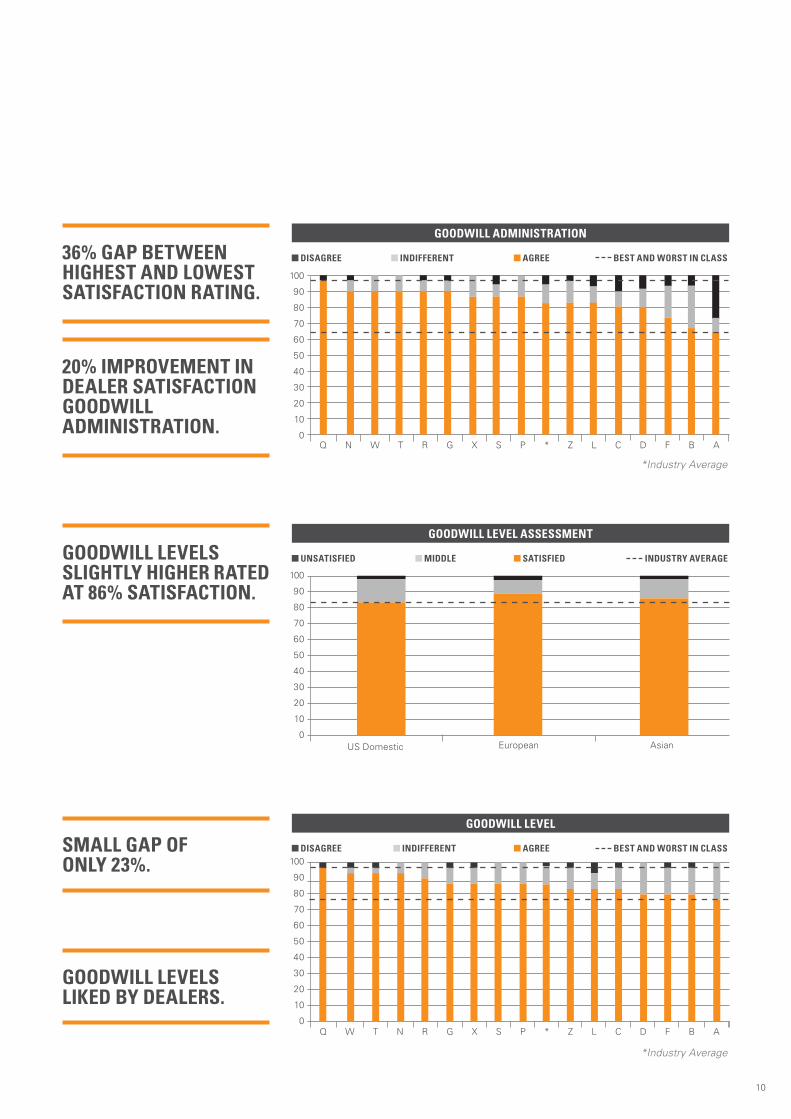
36% GAP BETWEEN HIGHEST AND LOWEST SATISFACTION RATING.
20% IMPROVEMENT IN DEALER SATISFACTION GOODWILL ADMINISTRATION.
GOODWILL LEVELS SLIGHTLY HIGHER RATED AT 86% SATISFACTION.
GOODWILL LEVELS LIKED BY DEALERS.
SMALL GAP OF ONLY 23%.
*Industry Average
*Industry Average
GOODWILL LEVEL
GOODWILL ADMINISTRATION
DISAGREE INDIFFERENT AGREE BEST AND WORST IN CLASS
DISAGREE INDIFFERENT AGREE BEST AND WORST IN CLASS
100
90
80
70
60
50
40
30
20
10
0
100
90
80
70
60
50
40
30
20
10
0
Q W T N R G X S P * Z L C D F B A
Q N W T R G X S P * Z L C D F B A
GOODWILL LEVEL ASSESSMENT
UNSATISFIED MIDDLE SATISFIED INDUSTRY AVERAGE
100
90
80
70
60
50
40
30
20
10
0US Domestic AsianEuropean

11
Q13. HOW DO YOU RATE THE HANDLING
OF THE EXTENDED WARRANTY
PRODUCTS OF YOUR OEM?
Overall results
• With one exception all other brands in European are below industry average
• Domestic provides best handling of extended warranty products, but Asian almost at same levels
• Significant gap (40%) between highest and lowest rating
• Improvement in industry average since 2013 – 7% overall from 75% to 82% satisfaction rating
ONE BRAND WITH MORE THAN 25% OF DEALERS RATING UNSATISFIED.
HANDLING EXTENDED WARRANTY PRODUCTS
UNSATISFIED MIDDLE SATISFIED INDUSTRY AVERAGE
100
90
80
70
60
50
40
30
20
10
0US Domestic AsianEuropean
*Industry Average
EXTENDED WARRANTY PRODUCTS HANDLING
UNSATISFIED MIDDLE SATISFIED BEST AND WORST IN CLASS
100
90
80
70
60
50
40
30
20
10
0 N P T D C G S * Z L Q R B W F A X
12
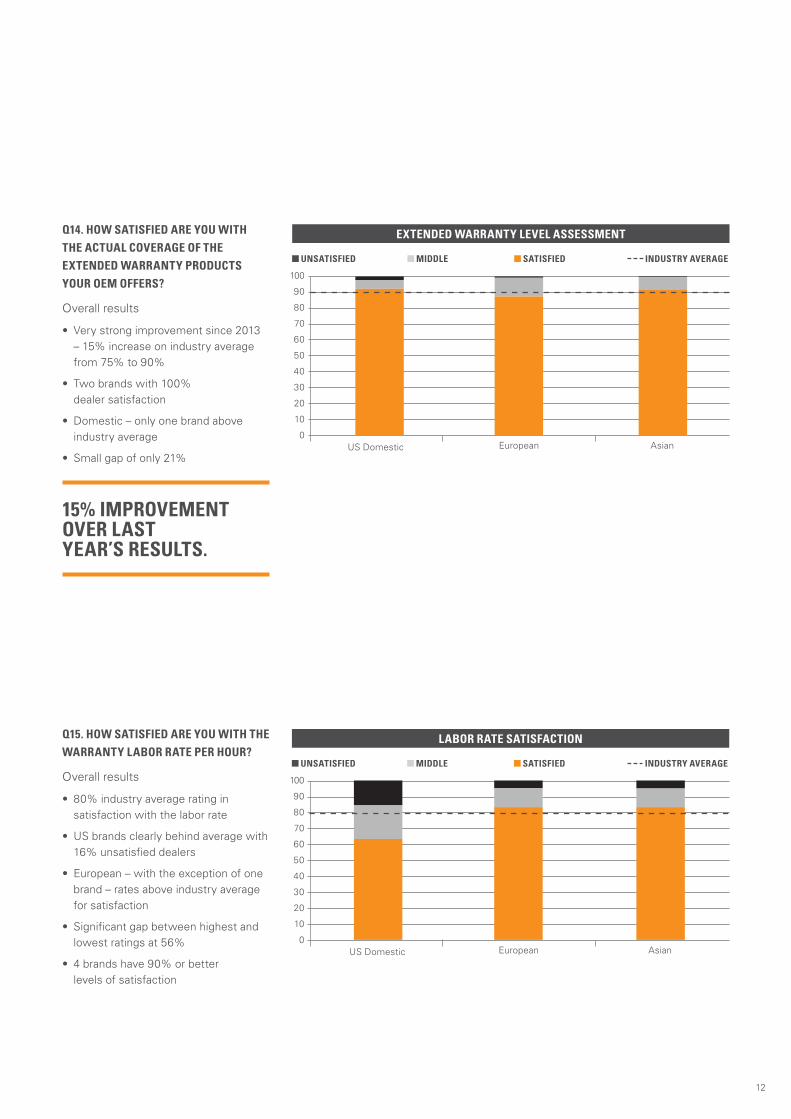
Q15. HOW SATISFIED ARE YOU WITH THE
WARRANTY LABOR RATE PER HOUR?
Overall results
• 80% industry average rating in satisfaction with the labor rate
• US brands clearly behind average with 16% unsatisfied dealers
• European – with the exception of one brand – rates above industry average for satisfaction
• Significant gap between highest and lowest ratings at 56%
• 4 brands have 90% or better levels of satisfaction
Q14. HOW SATISFIED ARE YOU WITH
THE ACTUAL COVERAGE OF THE
EXTENDED WARRANTY PRODUCTS
YOUR OEM OFFERS?
Overall results
• Very strong improvement since 2013 – 15% increase on industry average from 75% to 90%
• Two brands with 100% dealer satisfaction
• Domestic – only one brand above industry average
• Small gap of only 21%
15% IMPROVEMENT OVER LAST YEAR’S RESULTS.
LABOR RATE SATISFACTION
UNSATISFIED MIDDLE SATISFIED INDUSTRY AVERAGE
100
90
80
70
60
50
40
30
20
10
0US Domestic AsianEuropean
EXTENDED WARRANTY LEVEL ASSESSMENT
UNSATISFIED MIDDLE SATISFIED INDUSTRY AVERAGE
100
90
80
70
60
50
40
30
20
10
0US Domestic AsianEuropean
13
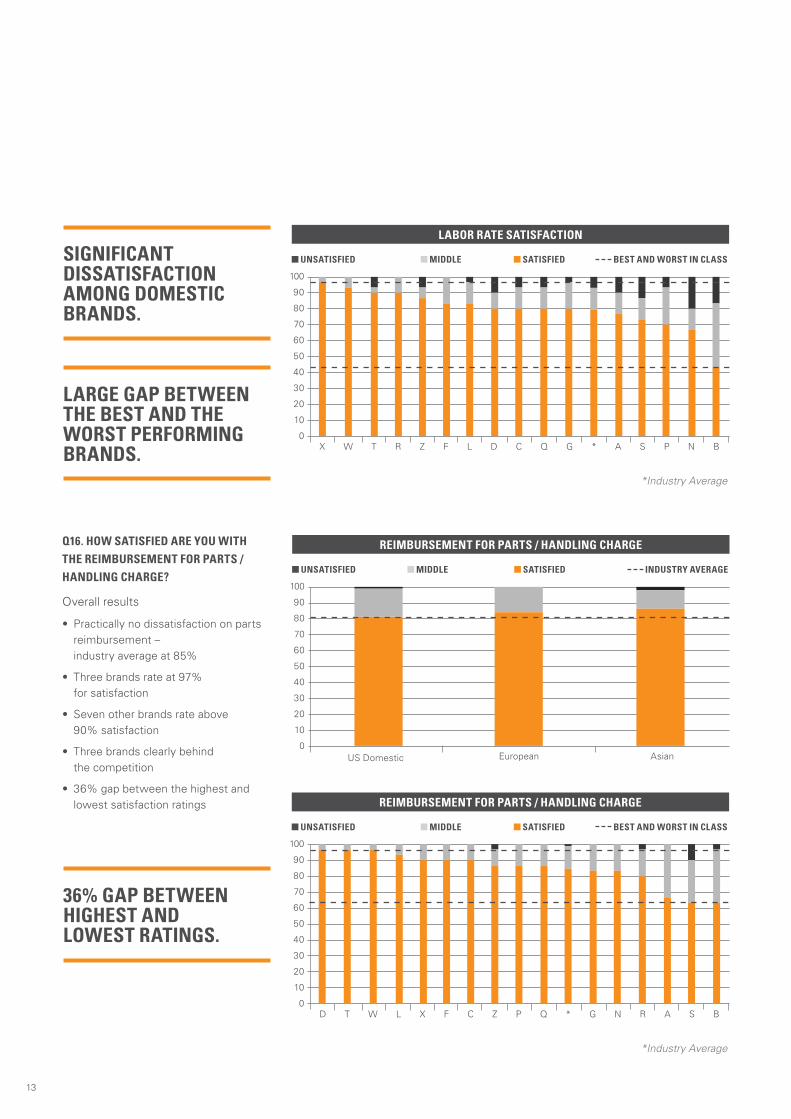
SIGNIFICANT DISSATISFACTION AMONG DOMESTIC BRANDS.
LARGE GAP BETWEEN THE BEST AND THE WORST PERFORMING BRANDS.
36% GAP BETWEEN HIGHEST AND LOWEST RATINGS.
*Industry Average
*Industry Average
LABOR RATE SATISFACTION
REIMBURSEMENT FOR PARTS / HANDLING CHARGE
UNSATISFIED MIDDLE SATISFIED BEST AND WORST IN CLASS
UNSATISFIED MIDDLE SATISFIED BEST AND WORST IN CLASS
100
90
80
70
60
50
40
30
20
10
0
100
90
80
70
60
50
40
30
20
10
0
X W T R Z F L D C Q G * A S P N B
D T W L X F C Z P Q * G N R A S B
Q16. HOW SATISFIED ARE YOU WITH
THE REIMBURSEMENT FOR PARTS /
HANDLING CHARGE?
Overall results
• Practically no dissatisfaction on parts reimbursement – industry average at 85%
• Three brands rate at 97% for satisfaction
• Seven other brands rate above 90% satisfaction
• Three brands clearly behind the competition
• 36% gap between the highest and lowest satisfaction ratings
REIMBURSEMENT FOR PARTS / HANDLING CHARGE
UNSATISFIED MIDDLE SATISFIED INDUSTRY AVERAGE
100
90
80
70
60
50
40
30
20
10
0US Domestic AsianEuropean

14
15
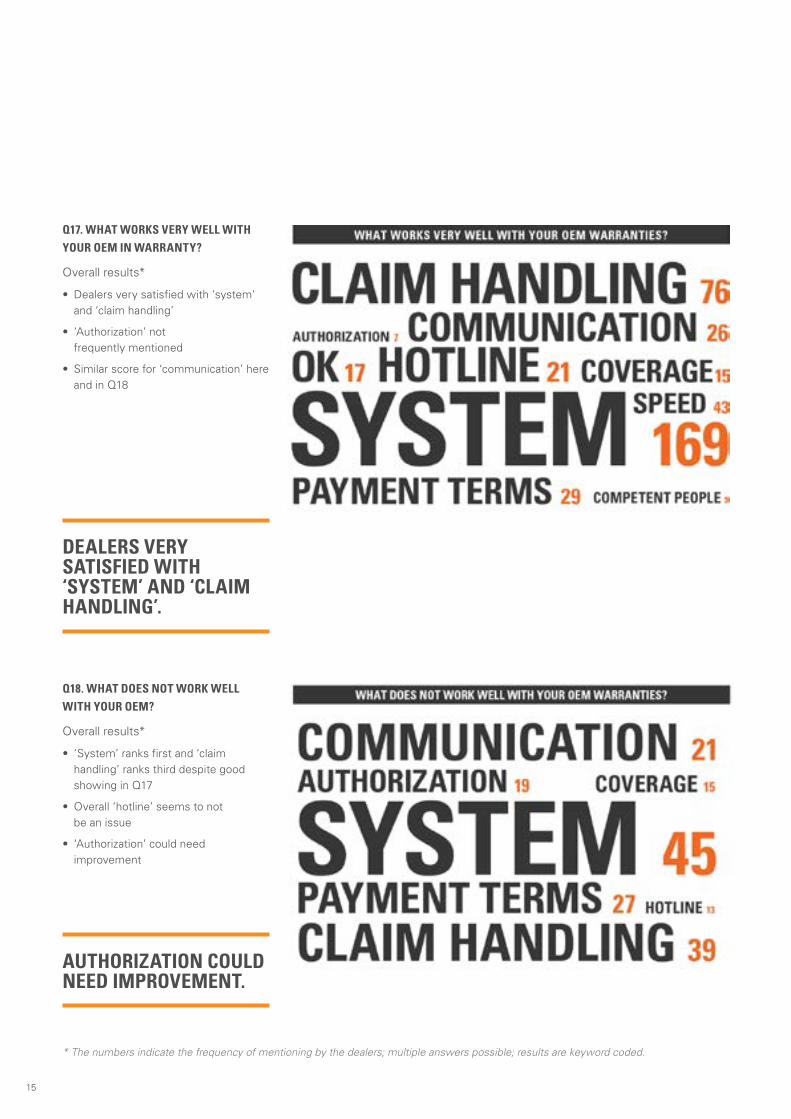
Q17. WHAT WORKS VERY WELL WITH
YOUR OEM IN WARRANTY?
Overall results*
• Dealers very satisfied with ‘system’ and ‘claim handling’
• ‘Authorization’ not frequently mentioned
• Similar score for ‘communication’ here and in Q18
Q18. WHAT DOES NOT WORK WELL
WITH YOUR OEM?
Overall results*
• ‘System’ ranks first and ‘claim handling’ ranks third despite good showing in Q17
• Overall ‘hotline’ seems to not be an issue
• ‘Authorization’ could need improvement
* The numbers indicate the frequency of mentioning by the dealers; multiple answers possible; results are keyword coded.
DEALERS VERY SATISFIED WITH ‘SYSTEM’ AND ‘CLAIM HANDLING’.
AUTHORIZATION COULD NEED IMPROVEMENT.

16
Q19. WHAT SHOULD YOUR OEM CHANGE
TO MAKE WARRANTY EASIER FOR YOU?
Overall results*
• ‘System’ is the key aspect to focus on changing
• ‘Training’ is not considered to be an issue that needs changing
• ‘Claim handling’ is also a key area to address
POTENTIALLY CHANGING SYSTEMS WOULD MAKE WARRANTIES EASIER.
17
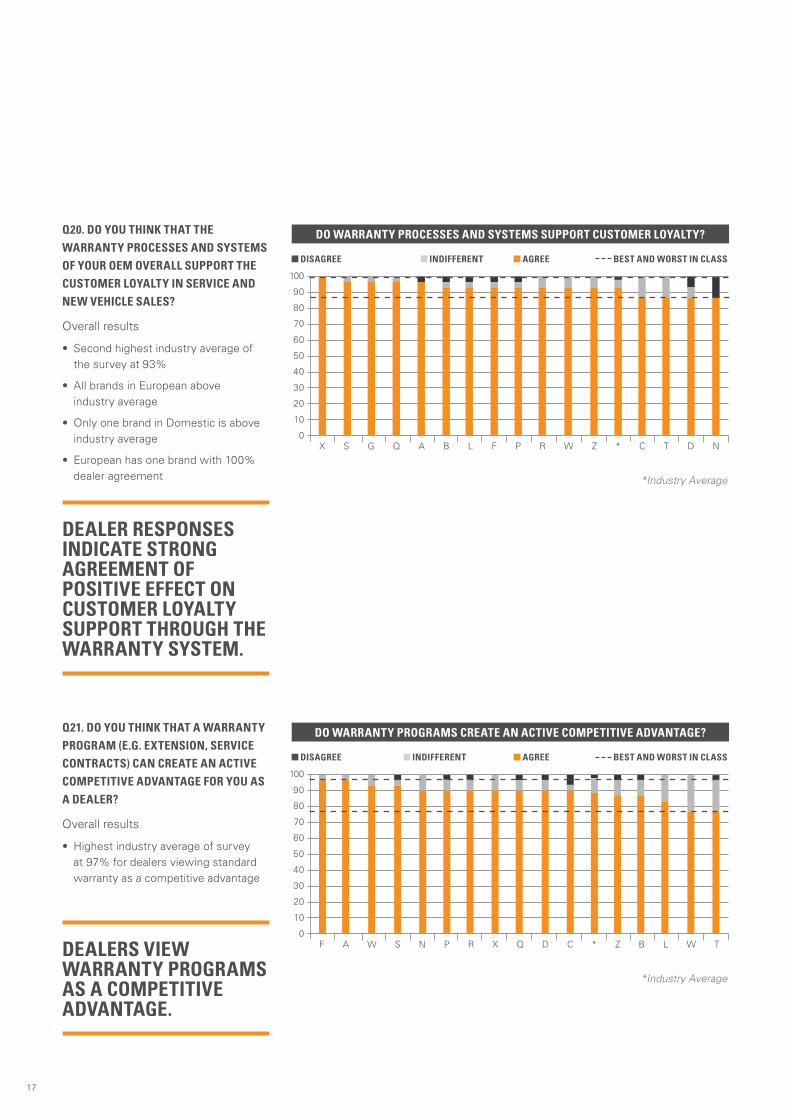
Q20. DO YOU THINK THAT THE
WARRANTY PROCESSES AND SYSTEMS
OF YOUR OEM OVERALL SUPPORT THE
CUSTOMER LOYALTY IN SERVICE AND
NEW VEHICLE SALES?
Overall results
• Second highest industry average of the survey at 93%
• All brands in European above industry average
• Only one brand in Domestic is above industry average
• European has one brand with 100% dealer agreement
Q21. DO YOU THINK THAT A WARRANTY
PROGRAM (E.G. EXTENSION, SERVICE
CONTRACTS) CAN CREATE AN ACTIVE
COMPETITIVE ADVANTAGE FOR YOU AS
A DEALER?
Overall results
• Highest industry average of survey at 97% for dealers viewing standard warranty as a competitive advantage
DEALERS VIEW WARRANTY PROGRAMS AS A COMPETITIVE ADVANTAGE.
DEALER RESPONSES INDICATE STRONG AGREEMENT OF POSITIVE EFFECT ON CUSTOMER LOYALTY SUPPORT THROUGH THE WARRANTY SYSTEM.
*Industry Average
DO WARRANTY PROCESSES AND SYSTEMS SUPPORT CUSTOMER LOYALTY?
DISAGREE INDIFFERENT AGREE BEST AND WORST IN CLASS
100
90
80
70
60
50
40
30
20
10
0 X S G Q A B L F P R W Z * C T D N
*Industry Average
DO WARRANTY PROGRAMS CREATE AN ACTIVE COMPETITIVE ADVANTAGE?
DISAGREE INDIFFERENT AGREE BEST AND WORST IN CLASS
100
90
80
70
60
50
40
30
20
10
0 F A W S N P R X Q D C * Z B L W T
18
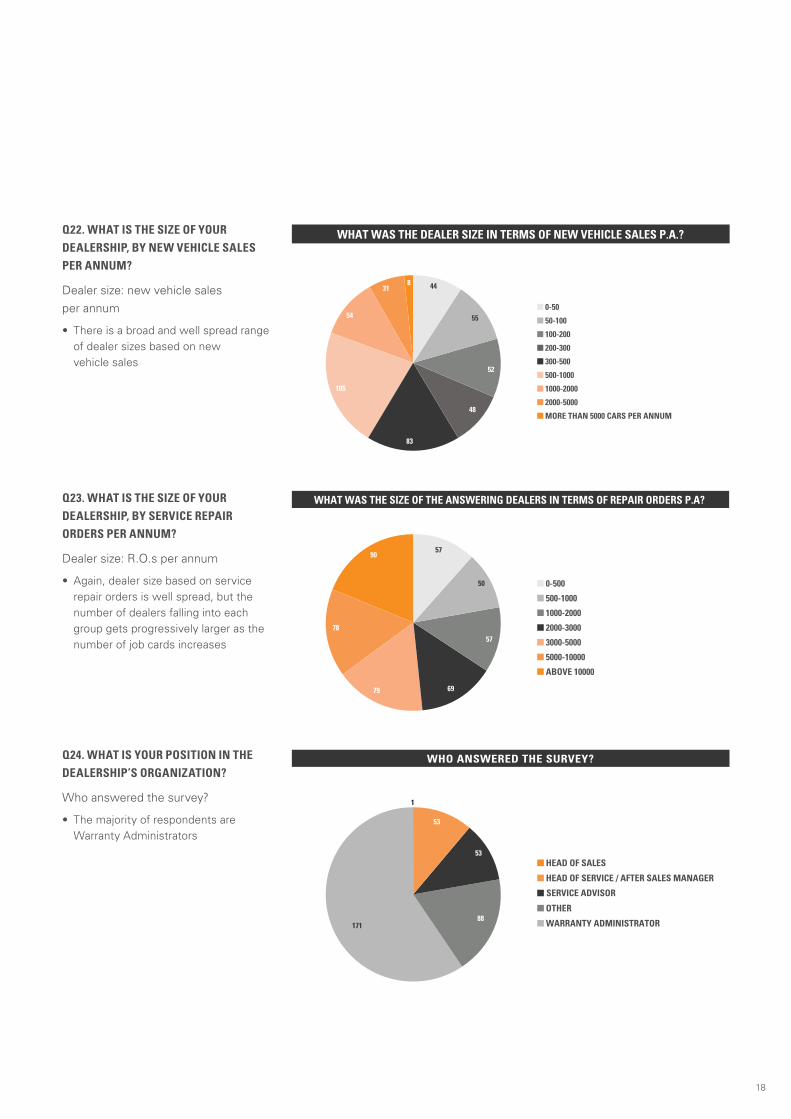
Q22. WHAT IS THE SIZE OF YOUR
DEALERSHIP, BY NEW VEHICLE SALES
PER ANNUM?
Dealer size: new vehicle sales
per annum
• There is a broad and well spread range of dealer sizes based on new vehicle sales
Q23. WHAT IS THE SIZE OF YOUR
DEALERSHIP, BY SERVICE REPAIR
ORDERS PER ANNUM?
Dealer size: R.O.s per annum
• Again, dealer size based on service repair orders is well spread, but the number of dealers falling into each group gets progressively larger as the number of job cards increases
Q24. WHAT IS YOUR POSITION IN THE
DEALERSHIP’S ORGANIZATION?
Who answered the survey?
• The majority of respondents are Warranty Administrators
19
VI. CONCLUSIONSWhen compared to the rest of the world, the United States offers the longest warranty coverage of any region. Warranties of four or more years are the standard, rather than the exception. Accordingly, warranty has become increasingly important in the aftersales process. However, it is not just the warranty itself that counts but also how the aftersales processes are handled during the warranty period. This includes ensuring a customer feels appreciated and responded to concerning their problems, issues and needs during a warranty period.
Aftersales processes require permanent optimization to successfully support customer loyalty and repurchase. This is the case because aftersales processes form the foundation of the relationship with the customer and determine the depth of loyalty to the brand and the dealer.
Aftersales processes must therefore enable dealers to service the customer requirements optimally and with minimum disruption to customer vehicle use. Any time a customer has to visit the dealer’s service facility it is an opportunity to reinforce their decision to remain loyal to the dealer. If the visit can meet the customer’s needs in a simple and efficient manner, it goes a long way to increasing brand loyalty. Most OEMs in the US fully understand the challenge of warranty management and the importance of dealer and customer satisfaction, and are not just focused on controlling warranty costs (albeit an important issue in itself).
However, in a market with soaring sales and strong competition to improve the warranty processes, some OEMs seem to be less focused on or not yet made the commitment to simplify their processes and empower their dealers.
The main findings of the survey are summarized as follows:
• Strong industry improvement overall at 10% versus 2013 results
• Asian dealers continue to be the most satisfied
• Asian brands continue to outpace European and Domestic
• Domestic brands improved 17% versus 2013 survey results
• Only one brand shows a significant number of dealers (20%) stating warranty deteriorated in the last five years
• Dealers’ satisfaction with the performance of the OEM field force increased from a very high 86% in 2013 results to an even higher 93% in the 2014 survey
• Except for one brand with 10% dissatisfied dealers, hotline performance is not an issue
• Audit satisfaction varies greatly between the best and worst performing brands – with a large gap of 55% separating these brands
and some brands with a significant percentage of unsatisfied dealers
• Warranty IT system works well for most dealers but some brands in the European OEMs rating less favourably
• European – highest dealer satisfaction ratings for warranty labor rate and policies that support customer loyalty
• Domestic dealers not enthused about labor rate levels
• 80% of dealers satisfied with goodwill procedures
SIGNIFICANT INDUSTRY IMPROVEMENT OF 10% VERSUS 2013.
AUDIT SATISFACTION GAP 55% TOP TO BOTTOM.
DEALERS MOST SATISFIED WITH ASIAN BRANDS.
AFTERSALES PROCESSES FORM THE FOUNDATION OF THE RELATIONSHIP WITH THE CUSTOMER.
DEVELOP WARRANTY OPERATION TO OVERALL AFTERSALES PROCESS ANALYSIS AND IMPROVEMENT.
V. MAIN FINDINGS
Brands with major issues in the handling of goodwill or the extended warranty contracts take the risk of creating dissatisfied dealers who do not meet the expectations of customers, coupled with an ineffective use of warranty funds due to cumbersome processes. These issues need to be reviewed and improved upon to meet market expectations.
20
For OEMs to ensure their future competitiveness in this area it is critical that they analyze what processes need to be improved so that they can contribute to a positive customer experience. Those OEMs that do focus on aftersales satisfaction will be able to capitalize on the current booming market and increase their market share, profitability and brand loyalty. If an OEM is not committed to improvement in this vital area then they will quickly fall behind their competition.
Possible future actions for OEMs:
• Convert every touch point with dealers to a value adding opportunity
• Develop consultative auditing and coaching for aftersales process analysis
• Focus on improving the audit process and use it as a learning and development opportunity (in European and Domestic, only one brand in each rates higher than industry average)
• Domestic brands should investigate the cause of their low satisfaction ratings from dealers for the labor rate – one brand in particular rates as low as 42%
• European brands have an opportunity to improve their dealer results regarding warranty administration – all European brands rate below industry average
• Constantly benchmark the effectiveness of warranty policies to ensure that the overall result improves the customer experience
WARRANTY PROCESS IS INCREASINGLY IMPORTANT FOR SUSTAINABLE REVENUES IN AFTERSALES.
OEM MUST USE THE MOMENTUM OF THE BOOMING MARKET TO SIMPLIFY PROCESSES.
21
ABOUT THE AUTHORS
Mike Holmes Automotive Development Manager,
SGS North America
Mr. Holmes joined SGS in July of 2013 as the Automotive Development Manager for North America. His primary responsibilities are focused upon growing SGS market share in partnerships with OEMs in North America.
His professional career spans all phases of the automotive industry with management positions with both European and Asian manufacturers in sales, training and fixed operations. He spent a significant part of his career with Mercedes-Benz of North America where he directed the Regional Sales Operations in the southeast.
Mr. Holmes has extensive experience in the development and delivery of improvement strategies and has a
unique combination of management experiences at the regional, national and international level.
He attended Georgetown University and the University of Maryland with degrees in English and Secondary Education.
Roland Gagel
Global Automotive Sector Manager, SGS
Roland Gagel is the Global Sector Manager for SGS Automotive, responsible for growing and developing SGS’ automotive audits and performance management business with manufacturers and suppliers. He joined SGS 2011 after 15 years of extensive experience in the automotive sector. He started his career with General Motors Europe Purchasing Organisation at Adam Opel AG in Rüsselsheim. After holding a buyers position in Advance Purchasing, Roland was responsible for the QS 9000 (now ISO/TS 16949) certification of GM Europe’s suppliers.
Joining the Aftersales Organisation in 2001, he then moved into warranty; first in the area of supplier cost recovery, and then in operational warranty management of the Opel Germany Warranty team. Between 2008 and 2011, he was the head of European Warranty Operations of GM and led several projects to increase cost control within the dealer field while reducing warranty administration expenses.
Being the author of several warranty related studies and whitepapers, Roland is a frequent speaker at global warranty conferences in Europe and the US.
Roland was born and raised in Wiesbaden, Germany. He holds a joint masters degree in mechanical engineering and business administration from the Technical University Darmstadt.
ABOUT SGS
SGS is the world’s leading inspection, verification, testing and certification company. SGS is recognized as the global benchmark for quality and integrity. With more than 80,000 employees, SGS operates a network of over 1,650 offices and laboratories around the world.
SGS can support you in the goals of ensuring dealer franchise satisfaction by using our experience in the automotive industry and benchmarking best practices. We deliver results
and analysis in a concise, clear and meaningful format; and make recommendations for action plans on any issues arising with dealers to ensure the improvement of your business.
Enhancing processes, systems and skills is fundamental to your ongoing success and sustained growth. We enable you to continuously improve, transforming your services and value chain by increasing performance, managing risks, better meeting stakeholder requirements, and managing sustainability.
With a global presence, we have a history of successfully executing large-scale, complex international projects. Our people speak the language, understand the culture of the local market and operateglobally in a consistent, reliable and effective manner.
FOR MORE INFORMATION VISIT
WWW.SGS.COM OR CONTACT
TO VIEW THE RESULTS OF THE 2014 WARRANTY MANAGEMENT SURVEYS IN BRAZIL, CHINA AND THE EU AND TO DOWNLOAD COMPLIMENTARY WHITE PAPERS VISIT WWW.SGS.COM/WHITEPAPERS.

22
COPYRIGHT NOTICE
© SGS Group Management SA – 2014 – All rights reserved - SGS is a registered trademark of SGS Group Management SA.
This study is the property of SGS Group Management SA and all intellectual property therein, including all proprietary and confidential information, know-how, designs and/
or data, remains vested in and is owned by SGS Group Management SA. This document may also contain information, drawings, designs or plans owned by Third Parties
and such information may be proprietary and confidential and protected by intellectual property rights of such Third Parties. This document may not be used, copied, and/or
reproduced by any means, electronic or mechanical, in whole or in part for any purpose, unless such usage, copying and/or reproduction has been specifically permitted in
writing by SGS Group Management SA and necessary royalty arrangements are concluded. Requests should be addressed to SGS ICS GmbH, Roland Gagel, Im Maisel 14,
65232 Taunusstein.
WWW.SGS.COM
© S
GS
Gro
up
Man
agem
ent
SA
– 2
014
– A
ll ri
ght
s re
serv
ed
- SG
S is
a r
eg
iste
red
trad
emar
k of
SG
S G
rou
p M
anag
emen
t S
A.