Embed Size (px)
Citation preview
DI
SC
US
SI
ON
P
AP
ER
S
ER
IE
S
Forschungsinstitut zur Zukunft der ArbeitInstitute for the Study of Labor
De Jure and De Facto Determinants of Power:Evidence from Mississippi
IZA DP No. 6741
July 2012
Graziella BertocchiArcangelo Dimico
De Jure and De Facto Determinants of
Power: Evidence from Mississippi
Graziella Bertocchi University of Modena, CEPR, CHILD and IZA
Arcangelo Dimico Queen’s University of Belfast
Discussion Paper No. 6741 July 2012
IZA
P.O. Box 7240 53072 Bonn
Germany
Phone: +49-228-3894-0 Fax: +49-228-3894-180
E-mail: [email protected]
Any opinions expressed here are those of the author(s) and not those of IZA. Research published in this series may include views on policy, but the institute itself takes no institutional policy positions. The Institute for the Study of Labor (IZA) in Bonn is a local and virtual international research center and a place of communication between science, politics and business. IZA is an independent nonprofit organization supported by Deutsche Post Foundation. The center is associated with the University of Bonn and offers a stimulating research environment through its international network, workshops and conferences, data service, project support, research visits and doctoral program. IZA engages in (i) original and internationally competitive research in all fields of labor economics, (ii) development of policy concepts, and (iii) dissemination of research results and concepts to the interested public. IZA Discussion Papers often represent preliminary work and are circulated to encourage discussion. Citation of such a paper should account for its provisional character. A revised version may be available directly from the author.
IZA Discussion Paper No. 6741 July 2012
ABSTRACT
De Jure and De Facto Determinants of Power: Evidence from Mississippi*
We evaluate the empirical relevance of de facto vs. de jure determinants of political power in the U.S. South between the end of the nineteenth and the beginning of the twentieth century. We apply a variety of estimation techniques to a previously unexploited dataset on voter registration by race covering the counties of Mississippi in 1896, shortly after the introduction of the 1890 voting restrictions encoded in the state constitution. Our results indicate that de jure voting restrictions reduce black registration but that black disfranchisement starts well before 1890 and is more intense where a black majority represents a threat to the de facto power of white elites. Moreover, the effect of race becomes stronger after 1890 suggesting that the de jure barriers may have served the purpose of institutionalizing a de facto condition of disfranchisement. JEL Classification: J15, N41, O43, P16 Keywords: race, voting, institutions, education, inequality Corresponding author: Graziella Bertocchi Dipartimento di Economia Politica Viale Berengario, 51 41121 Modena Italy E-mail: [email protected]
* We would like to thank workshop participants at ECINEQ 2011, Singapore Management University, Tufts University, Boston University, New York University and Brown University, for helpful comments on a previous draft. Generous financial support from Fondazione Cassa di Risparmio di Modena and the Italian University Ministry is gratefully acknowledged.
2
1. Introduction
Recent advances in comparative development have investigated the determinants and the influence
of institutions. In order to understand the coexistence of change and persistence in institutional
dynamics, a crucial distinction has been drawn between de jure and de facto sources of political
power (Acemoglu and Robinson, 2008a,b). De facto power is power that is not allocated by de jure
institutions such as voting legislation or elections, but rather is possessed by a social group as a
result of wealth, violence, or other means. In the context of the U.S. South during the Restoration de
jure power took the form of suffrage restrictions, while de facto control reflected the inter-racial
conflict between the white elites and the black descendants of slaves. The goal of this paper is to
investigate empirically the relative strength of these alternative although interrelated sources of
power. More specifically, we analyse the determinants of electoral outcomes such as voter
registration and turnout, with special focus on their racial distribution, on the basis of previously
unexploited data covering the counties of Mississippi at the end of the nineteenth century. These
data represent a unique source of information on voter registration by race at the county level.
Between the end of the nineteenth and the beginning of the twentieth century southern U.S. states
introduced a series of procedures and laws aimed at disfranchising a large share of the population.
The majority of these laws took the form of poll taxes and literacy tests which prevented poor and
illiterates from casting their vote. African Americans and poor whites were the main target of these
rules. In fact, by ensuring their support to the Republican and to the Populist parties these groups
represented a serious threat to the aspirations of the wealthy white landowners who were mainly
represented by the Democratic party. In order to insulate the political system from these challenges
to their hegemony, white Democrats introduced barriers to voting meant to exclude the majority of
blacks and poor whites from the southern electorate.
The effectiveness of these procedures is still largely debated. While some scholars believe in an
effective power of the disfranchisement schemes in restricting electorate suffrage (e.g., Kousser,
1974), others forcefully question it (e.g., Bond, 1934, 1939; Key, 1949; Ogden, 1958). In particular
Key argues that de jure disfranchisement is the result of a condition of de facto disfranchisement -
mainly grounded on race - which restricted the electorate even before these laws were passed.
According to Key’s fait accompli hypothesis, the white elite was able to push these laws through the
assemblies only because political participation had already been suppressed through the use of
extralegal forces, violence, intimidation, and a growing hegemony of the white plantation elite
represented by Democrats. The feeling that such a state of violence and fraud could not be
3
perpetuated for long and the increasing abuse of power in public office led to the passage in State
Constitutions of de jure procedures (Wharton, 1947).
This paper contributes to the above literature by providing evidence on the importance of de facto
vs. de jure political power, that is, of race vs. suffrage, in the U.S. South. Mississippi represents an
ideal starting point for such an investigation. In the past, it had one the highest proportion of slaves
(52 percent in 1860, third after South Carolina and Louisiana) and in 2000 still had the highest
proportion of blacks (37 percent if we exclude the District of Columbia with 60 percent). The state
was one of the first to enact de jure disfranchisement provisions in 1890. Moreover, in economic
terms, it has always been one of the most backward states of the U.S., with the lowest income per
capita ($15,853) in 2000.
In November 1890 a new constitution replaced the Mississippi constitution of 1869. New
qualifications for voters required that “each elector (1) Be a male citizen; (2) Be twenty-one years
of age or over; (3) Be a resident of the State two years and of the election district or municipality
one year; (4) Be registered to vote; (5) Be not disqualified by reason of insanity, idiocy, or
conviction of certain crimes; (6) Be able to read any section of the State Constitution, or be able to
understand it when read to him, or to a give reasonable interpretation of it; (7) Have paid all taxes
by February of the year in which he desires to vote and produce evidence of payment. This includes
payment of an annual poll tax of two dollars.” Therefore, in addition to longer residence
requirements, the novelties introduced by the new constitution were a literacy test and a poll tax,
both as prerequisites for registration. A complete re-registration was required before the first
election following the 1st of January 1892.
In order to conduct our analysis of the effect of the new constitution we use a previously
unexploited source of official statistics for the state of Mississippi that we collected from the United
States v. Mississippi Interrogatory Answers. “The Interrogatory Answers collection is the result of a
1962 action brought by the “USA government against the State of Mississippi (…), alleging that the
defendants had violated the voting rights of African American citizens. The U.S. District Court for
the Southern District of Mississippi dismissed the complaint, but the Supreme Court reversed the
suit on appeal in March 1965. However, Congress passed the Voting Rights Act of 1965 before the
District Court reconsidered the case (…). The information outlined in the interrogatory answers
provide detailed data and sources that illuminate the difficulties African Americans faced in
Mississippi when they attempted to exercise their right to vote between 1890 and 1963.” (University
of Mississippi Libraries, Digital Collections). In particular, the Interrogatory Answers contain cross-
4
sectional county-level data on voter registration by race for the 1896 presidential election.
We merge this source with data on total voter turnout for presidential elections and we exploit the
correlation between black registration and turnout in 1896 in order to reconstruct data on black
registration in Mississippi at the end of the 19th century. We compare the resulting estimates with
those in Kousser (1974) and Redding and James (2001) and we use them in order to investigate the
determinants of electoral outcomes. Next, in order to identify the causal effect of voting restrictions
vs. racial factors, we compare results from a difference and difference approach with results from a
cross-county regressions. We find that black registration in Mississippi declines after the de jure
innovations of 1890 but is also strongly reduced in the presence of a larger black share. Finally, we
also investigate whether voting restrictions ultimately matter in economic terms as predicted by
distributive politics models. We find that political participation does influence both educational
policies and economic inequality.
The main message emerging from our investigation can be summarized as follows: on the one hand,
as argued by Kousser (1974), we find a clear effect of the legislation on political outcomes; on the
other, as maintained by Key (1949), the process of black disfranchisement starts well before the
introduction of the new constitution and disfranchisement is stronger in counties where a black
majority represents a threat. Moreover, the effect of the black share becomes stronger after 1890,
suggesting that the de jure barriers may have served the purpose of institutionalizing a de facto
condition of disfranchisement.
The rest of the paper is organized as follows. Section 2 summarizes the related literature. Section 3
presents results for the imputed estimates of black registration. Section 4 reports the difference in
difference estimates. Section 5 contains the cross county evidence. Section 6 looks at education
policies and inequality. Section 7 concludes and illustrates the relevance of our results for
understanding the ongoing debate about electoral legislation and racial discrimination in the U.S.
2. Related literature
Earlier empirical contributions on the effects of suffrage restrictions in the U.S. South, including
Kousser (1973, 1974) and Redding and James (2001), rely on ecological regressions in order to
reconstruct the racial pattern of voter behavior during the late nineteenth and the early twentieth
century. As a response to the paucity of data organized by race, these techniques exploit the
variation in the racial components of the eligible population, together with the available data on
5
overall turnout, to estimate registration, turnout and party shares for blacks and whites, either at a
county or at a state level. While Kousser (1974) strongly rejects Key’s (1949) fait accompli
hypothesis, Redding and James (2001) acknowledge the cumulative influence of violence and
intimidation against blacks, especially in the presence of a large black population.
More recent empirical contributions include Naidu (2012), who examines the effect of voting
restrictions over the 1870-1920 period. Using adjacent county-pairs of counties that straddle state
boundaries, he finds that the introduction of poll taxes and/or literacy tests, captured jointly by a
time-varying dummy variable, lowered overall voter turnout, increased the Democratic vote share,
and reduced the teacher-child ratio in black schools. However, the potential role of competing
factors such as race is not explicitly investigated. Chay and Munshi (2011) examine political
participation in the U.S. South in the 1870-1890 period, that is during and just after Reconstruction,
and find that the Republican vote share, which they interpret as a measure of black political
mobilization, was larger in the presence of historical preconditions captured by the plantation share
(i.e., the share of land allocated to the major plantation crops). In other words, during this historical
period, which largely predates our main focus, a greater density of blacks allowed more social
cohesion and promoted though this channel their political participation. A common feature with our
findings is the prominent role of racial factors in determining electoral outcomes.1
A discussion on the relative relevance of de jure vs. de facto political power is contained in
Acemoglu and Robinson (2008a,b). However, their analysis is mainly theoretical and descriptive
and focuses on an earlier historical period, immediately before and after the Civil War. Their
general argument is that a change in political institutions that modifies the distribution of de jure
power may be offset by a change in the distribution of de facto political power. In the context of the
U.S. South, the abolition of slavery and the enfranchisement of blacks following the Civil War
represented a huge change in the distribution of de jure power. Yet, the economic and political
system changed very little if compared with the antebellum South, since the persistence of the de
facto political power of the landed elites was able to compensate effectively for the loss of their de
jure political power. The elites managed to keep control through the continuation of the plantation
economy and through intimidation and violence. In the present paper, we empirically test the
implications for this analysis over the Restoration.
There is also a related literature, including Welch (1973), Margo (1982, 1990), Smith (1984, 1989),
1 In contexts other than the U.S., Baland and Robinson (2008) look at the effect of the introduction of the secret ballot in Chile in 1958 and find that the change in political institutions had implications for voting behavior.
6
Orazem (1987), Pritchett (1989), Fishback and Baskin (1991), and Card and Krueger (1992), on the
effects of voting restrictions on the racial distribution of education outcomes, schooling segregation
and employment discrimination. These contributions are a relevant term of comparison for our
analysis of the effect of black registration on education policy and inequality.
Another stream of research has examined the removal of voting restrictions following the 1965
Voting Rights Act. The conclusions are that removal of restrictions increased black registration
(Alt, 1994), increased overall turnout and more strongly so in the presence of a larger black share
(Filer, Kenny, and Morton, 1991), increased welfare spending (Husted and Kenny, 1997), shifted
state aid toward localities with a larger black share (Cascio and Washington, 2012), and increased
political competition and growth-promoting policies (Besley, Persson, and Sturm, 2010).
Finally, models of franchise extensions are proposed by Ades and Verdier (1996), Acemoglu and
Robinson (2000), Bourguignon and Verdier (2000), and Lizzeri and Persico (2004), while Llavador
and Oxoby (2005) and Galor, Moav and Vollrath (2009) offer theoretical motivations for
landowners’ opposition to democracy.
3. Preliminary Analysis: Revised Voter Registration Data
After the adoption of the new constitution in 1890, black political participation in Mississippi
decreased sharply. Kousser (1974) estimates that in 1888 black turnout was about 30 percent, while
black registration was reduced to 5.4 and 8.5 percent in 1892 and 1896, respectively, against 53.8
and 76.2 percent for whites. Similarly, as reported by the U.S. Commission on Civil Rights (1965),
black registration decreased from almost 70 percent in 1867 to less than 6 percent in 1892. Is this
decline in black political participation explained by the new requirements introduced by the new
constitution? In this section we exploit a new source on voter registration by race in 1896, together
with data on overall voter turnout, to reconstruct the voting pattern in the state of Mississippi in the
proximity of the adoption of the 1890 constitution. In addition we try to understand the effect of the
new voting requirements on political participation.
The state of Mississippi has been one of the first U.S. states to enact disfranchisement schemes.
These schemes have often been considered responsible for the decline in turnout and the persistence
of the Democrats’ hegemony in the South. However, turnout in several southern U.S. states started
its decrease well before the 1890s. This fall was associated with a sharp decline in black
participation which started in the 1870s and was mainly attributable to the use of fraud,
7
intimidation, and violence. “In the election of 1875 local Democratic clubs announced that no
Negro who voted for a Republican could hope for any form of employment. Checkers were stationed
at the polls, and groups of armed men intercepted Negroes on their way to register. Negro Political
leaders were threatened that continued activity would results in deaths. As a result of these tactics,
Negro voting diminished throughout the state and Democrats returned to power” (U.S. Commission
of Civil Rights, 1965: 2). This downward trend has induced some academics (i.e., Key, 1949) to
consider the enactment of disfranchisement schemes in the South ineffective because they simply
consolidated a state of affairs which was already in place before their introduction. This position
contrasts with a more institutional view which ascribes the decline in black registration directly to
the effectiveness of voting restrictions. Using a series of ecological regressions, Kousser (1974)
concludes that the largest share of the decrease in black registration in the South is to be attributed
to the introduction of poll taxes and literacy tests which, for the state of Mississippi, reduced black
registration to 5.4 percent in 1892. Redding and James (2001) also use similar ecological
regressions and document a decline in the black turnout which by 1892 falls to 7.4 percent.
Ecological regressions have been quite popular in reconstructing racial voting patterns in the South
of the U.S. Because data on shares of whites and blacks registered voters are not available, they
exploit the variation in the number of white and black eligible voters together with data on the
turnout in order to estimate the racial voting patterns. Despite the simplicity of the procedure,
ecological regressions do not appear very robust since they are highly sensitive to spatial
dependence, model specification, and therefore aggregation bias. As a result, they can lead to
inconsistent conclusions: for example, for Mississippi Kousser (1974) estimates black registration
in 1892 at 5.4 percent, while for the same year Redding and James (2001) estimate black turnout at
7.4 percent.
Given that the United States v. Mississippi Interrogatory Answers provide real data on black and
white registration at the county level for the 1896 presidential election, we can use this valuable
information in order to construct estimates in the proximity of the 1890s in order to have a
consistent series which can then be compared with previous estimates. The only assumption which
we make in order to reconstruct such a series is that total voter turnout is a linear function of black
registration, so that we can consider the latter as an inverse function of total turnout. As result, we
can use a simple imputation in order to estimate black registration for years for which we do not
have data. The problem with the imputation is the potential for measurement bias and an improper
distribution with biased variation across counties. However, the average registration should be
unbiased given that the imputation exploits the variation in black registration and total turnout to
8
estimate the former for missing years. In addition, in the absence of other sources of electoral data
by race for the period under investigation, this procedure represents the only feasible alternative to
ecological regressions and can provides a term of comparison for the results in Kousser (1974) and
Redding and James (2001).
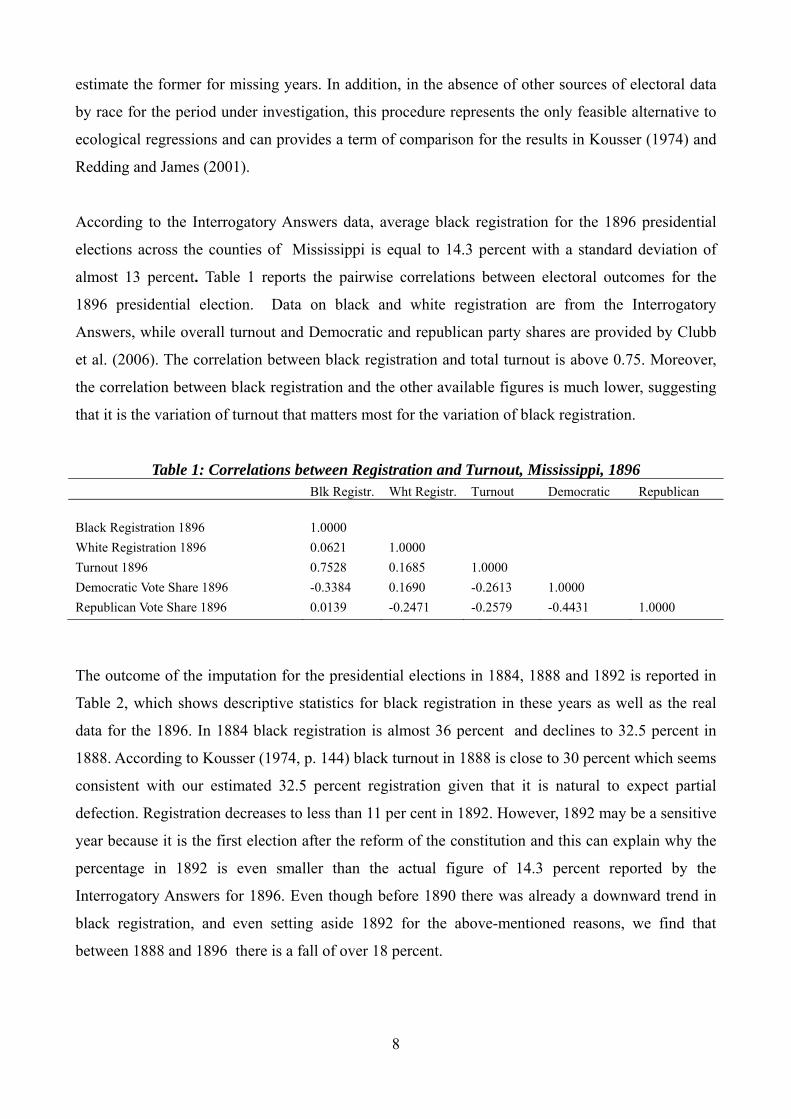
According to the Interrogatory Answers data, average black registration for the 1896 presidential
elections across the counties of Mississippi is equal to 14.3 percent with a standard deviation of
almost 13 percent. Table 1 reports the pairwise correlations between electoral outcomes for the
1896 presidential election. Data on black and white registration are from the Interrogatory
Answers, while overall turnout and Democratic and republican party shares are provided by Clubb
et al. (2006). The correlation between black registration and total turnout is above 0.75. Moreover,
the correlation between black registration and the other available figures is much lower, suggesting
that it is the variation of turnout that matters most for the variation of black registration.
Table 1: Correlations between Registration and Turnout, Mississippi, 1896 Blk Registr. Wht Registr. Turnout Democratic Republican
Black Registration 1896 1.0000
White Registration 1896 0.0621 1.0000
Turnout 1896 0.7528 0.1685 1.0000
Democratic Vote Share 1896 -0.3384 0.1690 -0.2613 1.0000
Republican Vote Share 1896 0.0139 -0.2471 -0.2579 -0.4431 1.0000
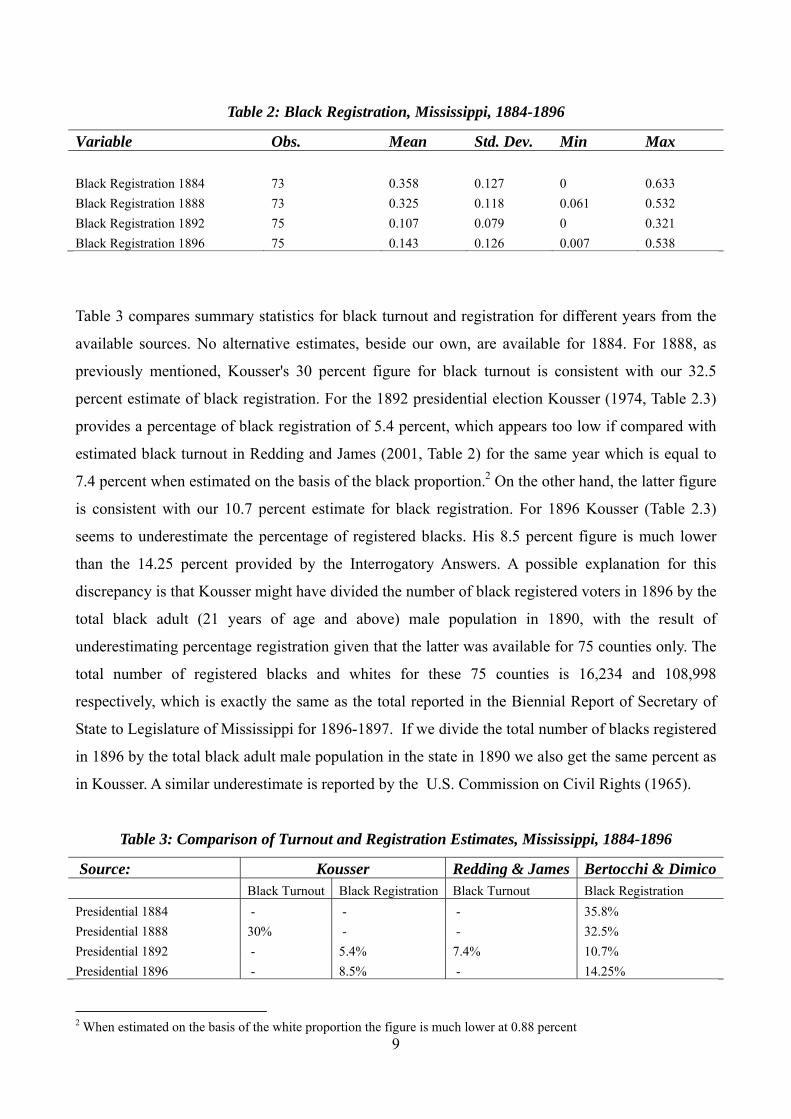
The outcome of the imputation for the presidential elections in 1884, 1888 and 1892 is reported in
Table 2, which shows descriptive statistics for black registration in these years as well as the real
data for the 1896. In 1884 black registration is almost 36 percent and declines to 32.5 percent in
1888. According to Kousser (1974, p. 144) black turnout in 1888 is close to 30 percent which seems
consistent with our estimated 32.5 percent registration given that it is natural to expect partial
defection. Registration decreases to less than 11 per cent in 1892. However, 1892 may be a sensitive
year because it is the first election after the reform of the constitution and this can explain why the
percentage in 1892 is even smaller than the actual figure of 14.3 percent reported by the
Interrogatory Answers for 1896. Even though before 1890 there was already a downward trend in
black registration, and even setting aside 1892 for the above-mentioned reasons, we find that
between 1888 and 1896 there is a fall of over 18 percent.
9
Table 2: Black Registration, Mississippi, 1884-1896
Variable Obs. Mean Std. Dev. Min Max
Black Registration 1884 73 0.358 0.127 0 0.633
Black Registration 1888 73 0.325 0.118 0.061 0.532
Black Registration 1892 75 0.107 0.079 0 0.321
Black Registration 1896 75 0.143 0.126 0.007 0.538
Table 3 compares summary statistics for black turnout and registration for different years from the
available sources. No alternative estimates, beside our own, are available for 1884. For 1888, as
previously mentioned, Kousser's 30 percent figure for black turnout is consistent with our 32.5
percent estimate of black registration. For the 1892 presidential election Kousser (1974, Table 2.3)
provides a percentage of black registration of 5.4 percent, which appears too low if compared with
estimated black turnout in Redding and James (2001, Table 2) for the same year which is equal to
7.4 percent when estimated on the basis of the black proportion.2 On the other hand, the latter figure
is consistent with our 10.7 percent estimate for black registration. For 1896 Kousser (Table 2.3)
seems to underestimate the percentage of registered blacks. His 8.5 percent figure is much lower
than the 14.25 percent provided by the Interrogatory Answers. A possible explanation for this
discrepancy is that Kousser might have divided the number of black registered voters in 1896 by the
total black adult (21 years of age and above) male population in 1890, with the result of
underestimating percentage registration given that the latter was available for 75 counties only. The
total number of registered blacks and whites for these 75 counties is 16,234 and 108,998
respectively, which is exactly the same as the total reported in the Biennial Report of Secretary of
State to Legislature of Mississippi for 1896-1897. If we divide the total number of blacks registered
in 1896 by the total black adult male population in the state in 1890 we also get the same percent as
in Kousser. A similar underestimate is reported by the U.S. Commission on Civil Rights (1965).
Table 3: Comparison of Turnout and Registration Estimates, Mississippi, 1884-1896
Source: Kousser Redding & James Bertocchi & Dimico Black Turnout Black Registration Black Turnout Black Registration
Presidential 1884 - - - 35.8%
Presidential 1888 30% - - 32.5%
Presidential 1892 - 5.4% 7.4% 10.7%
Presidential 1896 - 8.5% - 14.25% 2 When estimated on the basis of the white proportion the figure is much lower at 0.88 percent
10
Given that we now have data on black registration before and after the introduction of the 1890
constitution we can use this data in order to estimate a difference in mean between the two time
periods. Of course this procedure does not identify any casual effect since it does not take in
consideration the long-run time trend. However, when compared with the difference in mean in total
turnout it can provide useful insight on the overestimation of the effect of voting restrictions which
we can obtain using turnout rather than black registration.3
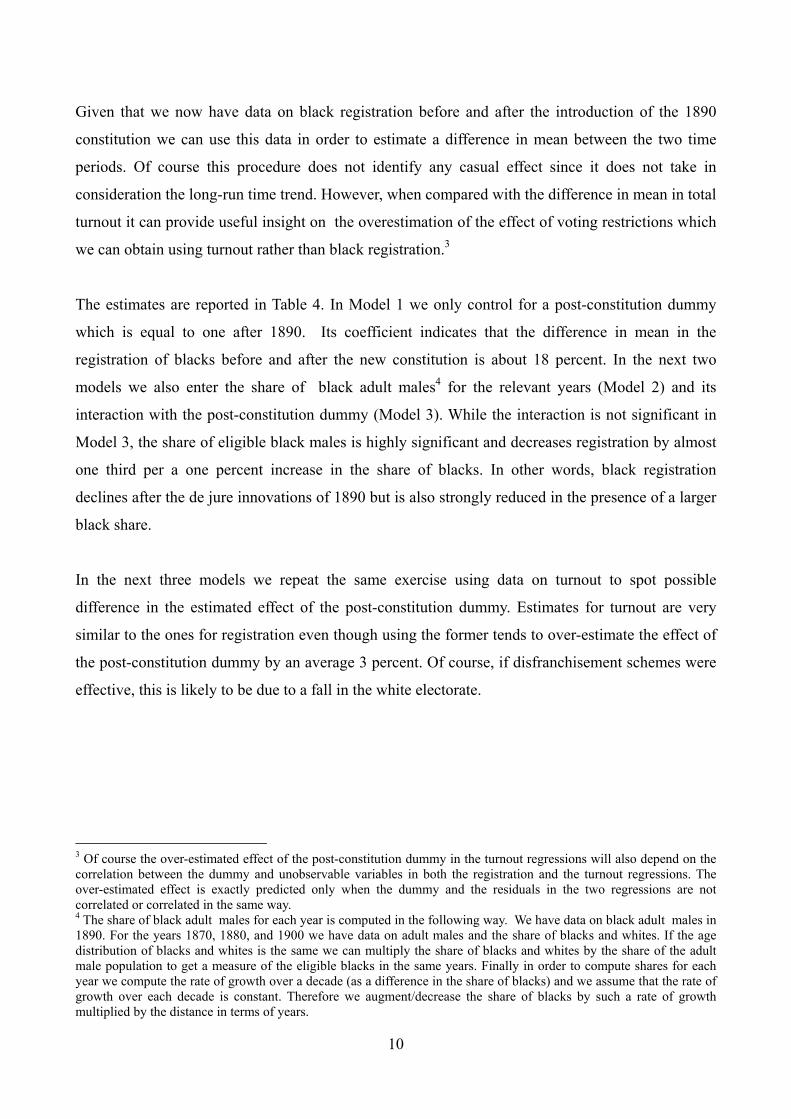
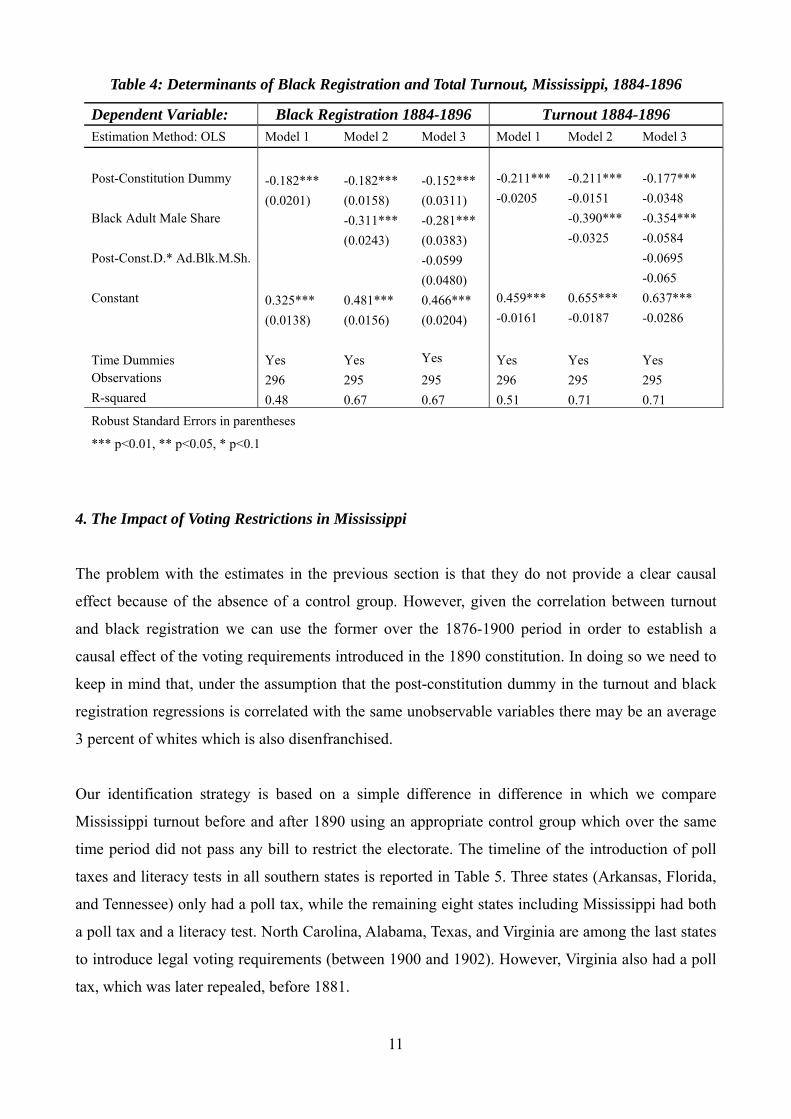
The estimates are reported in Table 4. In Model 1 we only control for a post-constitution dummy
which is equal to one after 1890. Its coefficient indicates that the difference in mean in the
registration of blacks before and after the new constitution is about 18 percent. In the next two
models we also enter the share of black adult males4 for the relevant years (Model 2) and its
interaction with the post-constitution dummy (Model 3). While the interaction is not significant in
Model 3, the share of eligible black males is highly significant and decreases registration by almost
one third per a one percent increase in the share of blacks. In other words, black registration
declines after the de jure innovations of 1890 but is also strongly reduced in the presence of a larger
black share.
In the next three models we repeat the same exercise using data on turnout to spot possible
difference in the estimated effect of the post-constitution dummy. Estimates for turnout are very
similar to the ones for registration even though using the former tends to over-estimate the effect of
the post-constitution dummy by an average 3 percent. Of course, if disfranchisement schemes were
effective, this is likely to be due to a fall in the white electorate.
3 Of course the over-estimated effect of the post-constitution dummy in the turnout regressions will also depend on the correlation between the dummy and unobservable variables in both the registration and the turnout regressions. The over-estimated effect is exactly predicted only when the dummy and the residuals in the two regressions are not correlated or correlated in the same way. 4 The share of black adult males for each year is computed in the following way. We have data on black adult males in 1890. For the years 1870, 1880, and 1900 we have data on adult males and the share of blacks and whites. If the age distribution of blacks and whites is the same we can multiply the share of blacks and whites by the share of the adult male population to get a measure of the eligible blacks in the same years. Finally in order to compute shares for each year we compute the rate of growth over a decade (as a difference in the share of blacks) and we assume that the rate of growth over each decade is constant. Therefore we augment/decrease the share of blacks by such a rate of growth multiplied by the distance in terms of years.
11
Table 4: Determinants of Black Registration and Total Turnout, Mississippi, 1884-1896
4. The Impact of Voting Restrictions in Mississippi
The problem with the estimates in the previous section is that they do not provide a clear causal
effect because of the absence of a control group. However, given the correlation between turnout
and black registration we can use the former over the 1876-1900 period in order to establish a
causal effect of the voting requirements introduced in the 1890 constitution. In doing so we need to
keep in mind that, under the assumption that the post-constitution dummy in the turnout and black
registration regressions is correlated with the same unobservable variables there may be an average
3 percent of whites which is also disenfranchised.
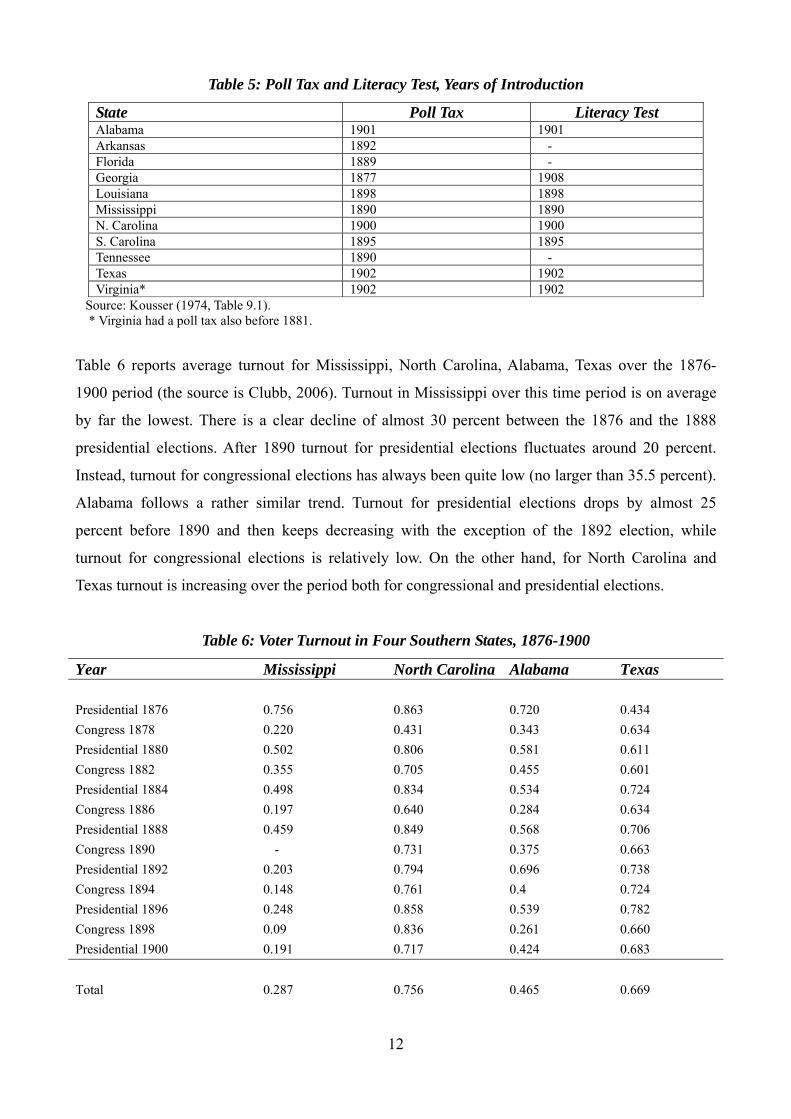
Our identification strategy is based on a simple difference in difference in which we compare
Mississippi turnout before and after 1890 using an appropriate control group which over the same
time period did not pass any bill to restrict the electorate. The timeline of the introduction of poll
taxes and literacy tests in all southern states is reported in Table 5. Three states (Arkansas, Florida,
and Tennessee) only had a poll tax, while the remaining eight states including Mississippi had both
a poll tax and a literacy test. North Carolina, Alabama, Texas, and Virginia are among the last states
to introduce legal voting requirements (between 1900 and 1902). However, Virginia also had a poll
tax, which was later repealed, before 1881.
Dependent Variable: Black Registration 1884-1896 Turnout 1884-1896 Estimation Method: OLS Model 1 Model 2 Model 3 Model 1 Model 2 Model 3
Post-Constitution Dummy -0.182*** -0.182*** -0.152*** -0.211*** -0.211*** -0.177***
(0.0201) (0.0158) (0.0311) -0.0205 -0.0151 -0.0348
Black Adult Male Share -0.311*** -0.281*** -0.390*** -0.354***
(0.0243) (0.0383) -0.0325 -0.0584
Post-Const.D.* Ad.Blk.M.Sh. -0.0599 -0.0695
(0.0480) -0.065
Constant 0.325*** 0.481*** 0.466*** 0.459*** 0.655*** 0.637***
(0.0138) (0.0156) (0.0204) -0.0161 -0.0187 -0.0286
Time Dummies Yes Yes Yes Yes Yes Yes Observations 296 295 295 296 295 295 R-squared 0.48 0.67 0.67 0.51 0.71 0.71
Robust Standard Errors in parentheses
*** p<0.01, ** p<0.05, * p<0.1
12
Table 5: Poll Tax and Literacy Test, Years of Introduction
State Poll Tax Literacy Test Alabama 1901 1901 Arkansas 1892 - Florida 1889 - Georgia 1877 1908 Louisiana 1898 1898 Mississippi 1890 1890 N. Carolina 1900 1900 S. Carolina 1895 1895 Tennessee 1890 - Texas 1902 1902 Virginia* 1902 1902
Source: Kousser (1974, Table 9.1). * Virginia had a poll tax also before 1881.
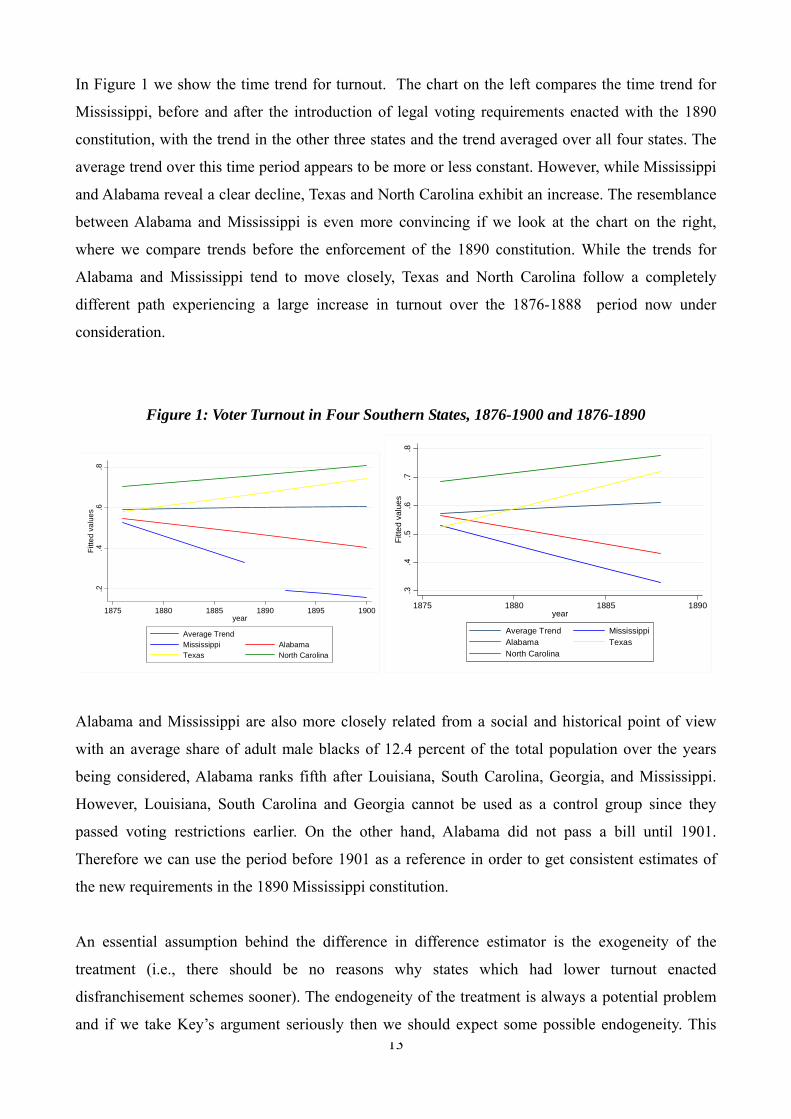
Table 6 reports average turnout for Mississippi, North Carolina, Alabama, Texas over the 1876-
1900 period (the source is Clubb, 2006). Turnout in Mississippi over this time period is on average
by far the lowest. There is a clear decline of almost 30 percent between the 1876 and the 1888
presidential elections. After 1890 turnout for presidential elections fluctuates around 20 percent.
Instead, turnout for congressional elections has always been quite low (no larger than 35.5 percent).
Alabama follows a rather similar trend. Turnout for presidential elections drops by almost 25
percent before 1890 and then keeps decreasing with the exception of the 1892 election, while
turnout for congressional elections is relatively low. On the other hand, for North Carolina and
Texas turnout is increasing over the period both for congressional and presidential elections.
Table 6: Voter Turnout in Four Southern States, 1876-1900
Year Mississippi North Carolina Alabama Texas
Presidential 1876 0.756 0.863 0.720 0.434
Congress 1878 0.220 0.431 0.343 0.634
Presidential 1880 0.502 0.806 0.581 0.611
Congress 1882 0.355 0.705 0.455 0.601
Presidential 1884 0.498 0.834 0.534 0.724
Congress 1886 0.197 0.640 0.284 0.634
Presidential 1888 0.459 0.849 0.568 0.706
Congress 1890 - 0.731 0.375 0.663
Presidential 1892 0.203 0.794 0.696 0.738
Congress 1894 0.148 0.761 0.4 0.724
Presidential 1896 0.248 0.858 0.539 0.782
Congress 1898 0.09 0.836 0.261 0.660
Presidential 1900 0.191 0.717 0.424 0.683
Total 0.287 0.756 0.465 0.669
13
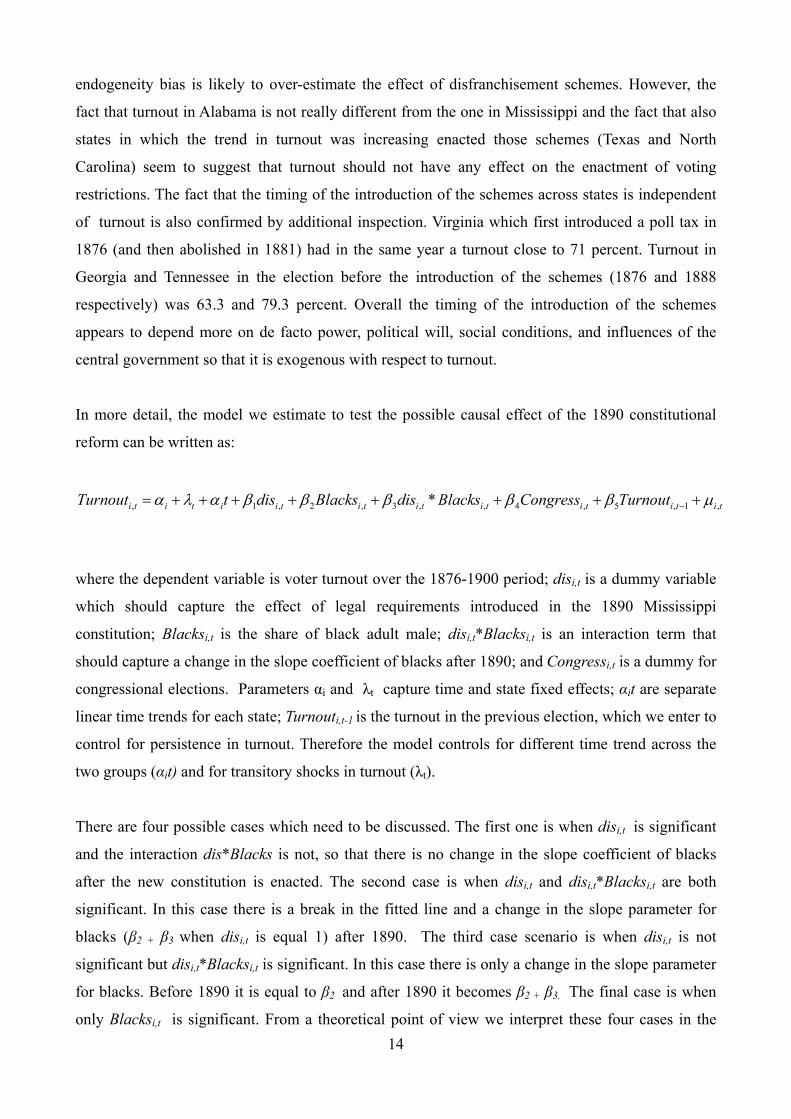
In Figure 1 we show the time trend for turnout. The chart on the left compares the time trend for
Mississippi, before and after the introduction of legal voting requirements enacted with the 1890
constitution, with the trend in the other three states and the trend averaged over all four states. The
average trend over this time period appears to be more or less constant. However, while Mississippi
and Alabama reveal a clear decline, Texas and North Carolina exhibit an increase. The resemblance
between Alabama and Mississippi is even more convincing if we look at the chart on the right,
where we compare trends before the enforcement of the 1890 constitution. While the trends for
Alabama and Mississippi tend to move closely, Texas and North Carolina follow a completely
different path experiencing a large increase in turnout over the 1876-1888 period now under
consideration.
Figure 1: Voter Turnout in Four Southern States, 1876-1900 and 1876-1890
.2.4
.6.8
Fitt
ed
valu
es
1875 1880 1885 1890 1895 1900year
Average TrendMississippi AlabamaTexas North Carolina
.3.4
.5.6
.7.8
Fitt
ed
valu
es
1875 1880 1885 1890year
Average Trend MississippiAlabama TexasNorth Carolina
Alabama and Mississippi are also more closely related from a social and historical point of view
with an average share of adult male blacks of 12.4 percent of the total population over the years
being considered, Alabama ranks fifth after Louisiana, South Carolina, Georgia, and Mississippi.
However, Louisiana, South Carolina and Georgia cannot be used as a control group since they
passed voting restrictions earlier. On the other hand, Alabama did not pass a bill until 1901.
Therefore we can use the period before 1901 as a reference in order to get consistent estimates of
the new requirements in the 1890 Mississippi constitution.
An essential assumption behind the difference in difference estimator is the exogeneity of the
treatment (i.e., there should be no reasons why states which had lower turnout enacted
disfranchisement schemes sooner). The endogeneity of the treatment is always a potential problem
and if we take Key’s argument seriously then we should expect some possible endogeneity. This
14
endogeneity bias is likely to over-estimate the effect of disfranchisement schemes. However, the
fact that turnout in Alabama is not really different from the one in Mississippi and the fact that also
states in which the trend in turnout was increasing enacted those schemes (Texas and North
Carolina) seem to suggest that turnout should not have any effect on the enactment of voting
restrictions. The fact that the timing of the introduction of the schemes across states is independent
of turnout is also confirmed by additional inspection. Virginia which first introduced a poll tax in
1876 (and then abolished in 1881) had in the same year a turnout close to 71 percent. Turnout in
Georgia and Tennessee in the election before the introduction of the schemes (1876 and 1888
respectively) was 63.3 and 79.3 percent. Overall the timing of the introduction of the schemes
appears to depend more on de facto power, political will, social conditions, and influences of the
central government so that it is exogenous with respect to turnout.
In more detail, the model we estimate to test the possible causal effect of the 1890 constitutional
reform can be written as:
, 1 , 2 , 3 , , 4 , 5 , 1 ,*i t i t i i t i t i t i t i t i t i tTurnout t dis Blacks dis Blacks Congress Turnout
where the dependent variable is voter turnout over the 1876-1900 period; disi,t is a dummy variable
which should capture the effect of legal requirements introduced in the 1890 Mississippi
constitution; Blacksi,t is the share of black adult male; disi,t*Blacksi,t is an interaction term that
should capture a change in the slope coefficient of blacks after 1890; and Congressi,t is a dummy for
congressional elections. Parameters αi and λt capture time and state fixed effects; αit are separate
linear time trends for each state; Turnouti,t-1 is the turnout in the previous election, which we enter to
control for persistence in turnout. Therefore the model controls for different time trend across the
two groups (αit) and for transitory shocks in turnout (λt).
There are four possible cases which need to be discussed. The first one is when disi,t is significant
and the interaction dis*Blacks is not, so that there is no change in the slope coefficient of blacks
after the new constitution is enacted. The second case is when disi,t and disi,t*Blacksi,t are both
significant. In this case there is a break in the fitted line and a change in the slope parameter for
blacks (β2 + β3 when disi,t is equal 1) after 1890. The third case scenario is when disi,t is not
significant but disi,t*Blacksi,t is significant. In this case there is only a change in the slope parameter
for blacks. Before 1890 it is equal to β2 and after 1890 it becomes β2 + β3. The final case is when
only Blacksi,t is significant. From a theoretical point of view we interpret these four cases in the
15
following way. In the first case (when only disi,t is significant) there is evidence of de jure
disfranchisement which is binding for all citizens independently on race. Hence turnout drops
because illiterate and poor citizens belonging to both groups are not allowed to vote. The second
case (when disi,t and disi,t*Blacksi,t are both significant) still points to de jure disfranchisement, but
now restrictions are more binding for blacks, possibly because of characteristics related to blacks
(e.g., illiteracy and wealth). In the third case (when disi,t is not significant but disi,t*Blacksi,t is
significant) we have what we call the “institutionalization” of de facto disfranchisement.The last
case, when only the share of blacks is significant, can be interpreted as evidence of de facto
disfranchisement consistent with the fait accompli hypothesis in Key (1949).
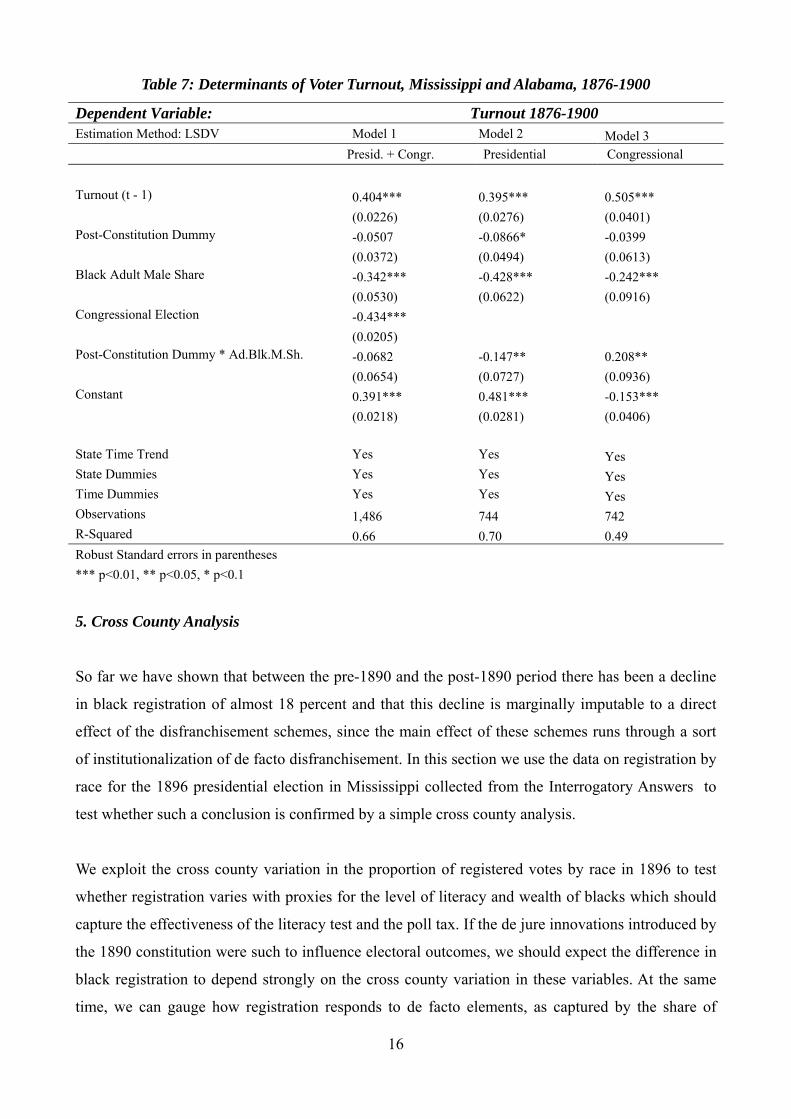
Table 7 shows county-level estimates for the 1876-1900 period using counties of Alabama as a
control group. In Model 1 we pool congressional and presidential elections together and the post-
constitution dummy which should capture the effect of the reform in Mississippi in not significant.
The effect of the share of black adult males is to decrease turnout by almost 0.34 percent per a one
percent change in the share. In addition the significant effect of turnout (t – 1) suggests persistence
in turnout: on average there is an increase in turnout of 0.40 percent per a one percent higher
turnout in the previous election. In Model 2 we confine the estimates to presidential elections only.
The 1890 constitutional reform now decreases turnout by an average 9 percent even though the
effect is marginally significant. The interaction between blacks and the post-1890 dummy is also
significantly reinforcing the negative effect of the share of blacks after 1890. Before 1890 a one
percent change in the share of blacks decreases turnout by an average 0.43 percent, compared to an
average 0.58 percent after 1890. In Model 3 we only look at congressional elections and we find
that the effect of the reform has no statistical significant effect, while the share of blacks and the
interaction between blacks and the post-1890 dummy remain significant. However, differently from
presidential election the racial effect diminishes after 1890.
Results in Table 7 therefore suggest that the effect of the restrictions to vote in Mississippi may
have had only a marginal effect on presidential elections and that the decrease in turnout is more
likely to depend on a long term trend which initiated after the 1876 election. In addition it seems
that de facto factors of disfranchisement, such as race, may have been the main reasons of turnout
reduction. The effect of race became even more binding after 1890 which suggests that the main
effect of constitutional reforms may have been though the institutionalization of de facto
disfranchisement.
16
Table 7: Determinants of Voter Turnout, Mississippi and Alabama, 1876-1900
Dependent Variable: Turnout 1876-1900 Estimation Method: LSDV Model 1 Model 2 Model 3 Presid. + Congr. Presidential Congressional
Turnout (t - 1) 0.404*** 0.395*** 0.505*** (0.0226) (0.0276) (0.0401) Post-Constitution Dummy -0.0507 -0.0866* -0.0399 (0.0372) (0.0494) (0.0613) Black Adult Male Share -0.342*** -0.428*** -0.242*** (0.0530) (0.0622) (0.0916) Congressional Election -0.434*** (0.0205) Post-Constitution Dummy * Ad.Blk.M.Sh. -0.0682 -0.147** 0.208** (0.0654) (0.0727) (0.0936) Constant 0.391*** 0.481*** -0.153*** (0.0218) (0.0281) (0.0406)
State Time Trend Yes Yes Yes State Dummies Yes Yes Yes Time Dummies Yes Yes Yes Observations 1,486 744 742 R-Squared 0.66 0.70 0.49 Robust Standard errors in parentheses *** p<0.01, ** p<0.05, * p<0.1
5. Cross County Analysis
So far we have shown that between the pre-1890 and the post-1890 period there has been a decline
in black registration of almost 18 percent and that this decline is marginally imputable to a direct
effect of the disfranchisement schemes, since the main effect of these schemes runs through a sort
of institutionalization of de facto disfranchisement. In this section we use the data on registration by
race for the 1896 presidential election in Mississippi collected from the Interrogatory Answers to
test whether such a conclusion is confirmed by a simple cross county analysis.
We exploit the cross county variation in the proportion of registered votes by race in 1896 to test
whether registration varies with proxies for the level of literacy and wealth of blacks which should
capture the effectiveness of the literacy test and the poll tax. If the de jure innovations introduced by
the 1890 constitution were such to influence electoral outcomes, we should expect the difference in
black registration to depend strongly on the cross county variation in these variables. At the same
time, we can gauge how registration responds to de facto elements, as captured by the share of
17
blacks and measures of the power of the landed elites. If the variation in black registration is
determined by de jure constraints, once we control for them de facto elements should not display
any explanatory power.
Our first set of regressors includes proxies for the de jure constraints which reflect the two
innovations introduced by the 1890 constitution, i.e., the literacy test and the poll tax. Of course,
these requirements were imposed on all residents of the state of Mississippi. However, their
practical relevance should vary with illiteracy and with the ability to pay, which in turn differ
between races and across counties. Thus, we employ the illiteracy rate per race as an indicator of
the impact of the literacy test. In particular, counties associated with higher shares of illiterate
blacks should exhibit lower registration. To proxy for blacks’ wealth, and therefore for the impact of
the poll tax,5 we use three variables: sharecropping intensity, black migration, and black infant
mortality. Sharecropping intensity should reflect cash flow availability. Consequently, the poll tax
should be more effective in counties where the population has tighter cash flow (see Kousser,
1974), so that we should expect a negative association between sharecropper intensity and
registration. Consistently with migration theory,6 we expect blacks to leave those counties where
their wage is lower.7 Thus, we should observe a negative correlation between migration and
registration. Infant mortality is in turn influenced by diseases and malnutrition and is therefore
closely associated with low income levels,8 so that we should expect a negative correlation with
registration. To sum up, we interpret illiteracy, sharecropping intensity, migration, and infant
mortality as variables capturing the effectiveness of the de jure determinants of voter registration.
Our main de facto determinant of voter registration is race, as measured by the share of black adult
males over total population. The use of the black adult male share as a proxy for de facto
disfranchisement is consistent with the literature in the field (Kousser, 1974; Key, 1949; and Ogden,
1958). The opposition to black registration was tougher in counties where blacks represented the
majority. For example Wharton (1947) reports that, except in counties where the Democrats had a
safe majority, blacks were strenuously pressured to refrain from voting, or even to vote the
Democratic ticket, both through economic means (such as threats of unemployment) and other
cooptative or intimidative practices. In their regression analysis of voter behavior, Redding and
James (2001) also employ black population as a proxy for a host of factors aimed at discouraging
5 In Mississippi the tax was cumulative, with a maximum total charge of four dollars: For the bottom three quarters of the southern population 1890 per capita income (including non-cash components) was estimated by Kousser (1974) at about 64 dollars. 6 See Harris and Todaro (1970). 7 See Irwin and O’Brien (2001) for migration patterns in the Mississippi-Yazoo Delta in 1880-1910. 8 See the Report on Vital Statistics in the 1880 and 1890 census.
18
black political participation. We also control for land inequality and for the share of urban
population. Both controls should capture the relative influence of the land-owning white elite,
whose presence may represent another de facto impediment to black political participation (as
suggested by Acemoglu and Robinson, 2008a).
In Table 8 we report descriptive statistics for the state of Mississippi at the turn of the century. In
1896 black registration9 is less than one fifth of white registration:10 the cross county average share
of black adult males who register in 1896 is about 14 percent against almost 73 percent for whites.11
In socio-economic terms, Mississippi is a striking image of the South in this time period. With a
51.8 percent of blacks over total population in 1890, it ranks third after South Carolina and
Louisiana. The black share increases by almost 0.2 percent in the 1860-1890 period, since the slave
share in 1860 is equal to 51.6 percent.12 We also calculate a proxy for black migration which is
equal to the difference between black population in 1890 and black population in 1880, the latter
augmented by the difference between birth and death rates in 1880 and 1890. From census data13
we know that the annual rate of birth among blacks is 3.1 percent and the annual rate of death is 1.5
percent.14 Using this measure we estimate an average migration rate in 1880-90 of 1 percent, with a
peak of 44 percent in Quitman.15 Next we report statistics for other controls, starting with the black
adult male share, which varies widely across counties following the pattern of the black share.
Black illiteracy, i.e., the share of illiterate black adult males, is much larger than that for whites (52
percent against 8 percent).16 The index of sharecropping intensity17 is on average almost 30 percent
of total farm population, with the highest share in Issaquena (over 80 percent). The infant mortality
rate for blacks in 1890, measured as the rate of death in black population under one year of age, is
on average 8.5 percent, with a maximum at 21.3 percent in Clay and a minimum at 1.97 percent in
9 Black registration is equal to the ratio of the number of registered blacks in 1896 to black male population of age 21 and above in 1900 (the closest available year as in Kousser, 1974). We proceed in a similar fashion for white registration. See also footnote 4. 10 The total number of registered blacks and whites is 16,234 and 108,998 respectively. These figures are consistent with totals provided by the Biennial Report of Secretary of State to Legislature of Mississippi for 1896-1897. 11 The maximal white registration is above 100 percent because of frauds, which at the time were common in the South. For example Kousser (1974, p. 49) reports that white registration in Louisiana in 1897 is 103.2 percent. 12 In 1860, there were fewer than 1,000 free people of colour. 13 The birth and death rates for 1880-90 are provided by the Report on Vital Statistics of the 1890 census. 14 The number of blacks in Mississippi in the 1890 census is 742,559. However, if we augment the 1880 number of blacks by taking into account birth and death rates, we obtain an estimated number of blacks in 1890 of 747,835. We impute this difference to migration outside the state. 15 If we take the difference between the share of blacks (including slaves and free coloured) in 1860 and the share of blacks in 1890 for the 60 counties that exist in 1860 we find that the increase in the share of blacks is 0.7 percent, which is larger than what previously reported in the text because of the creation of new counties from lands of pre-existing counties in the 1860s and the 1870s. We introduce our estimate of migration because of the lack of comparability between the counties in place in 1860 and 1890. 16 We use data on the share of illiterates in 1900 because figures for the adult population are available only for this year. 17 The index of sharecropping intensity is calculated as the ratio of farm population under a sharecropping scheme to total farm population. The index is equal to one if all farm population is under a sharecropping scheme.
19
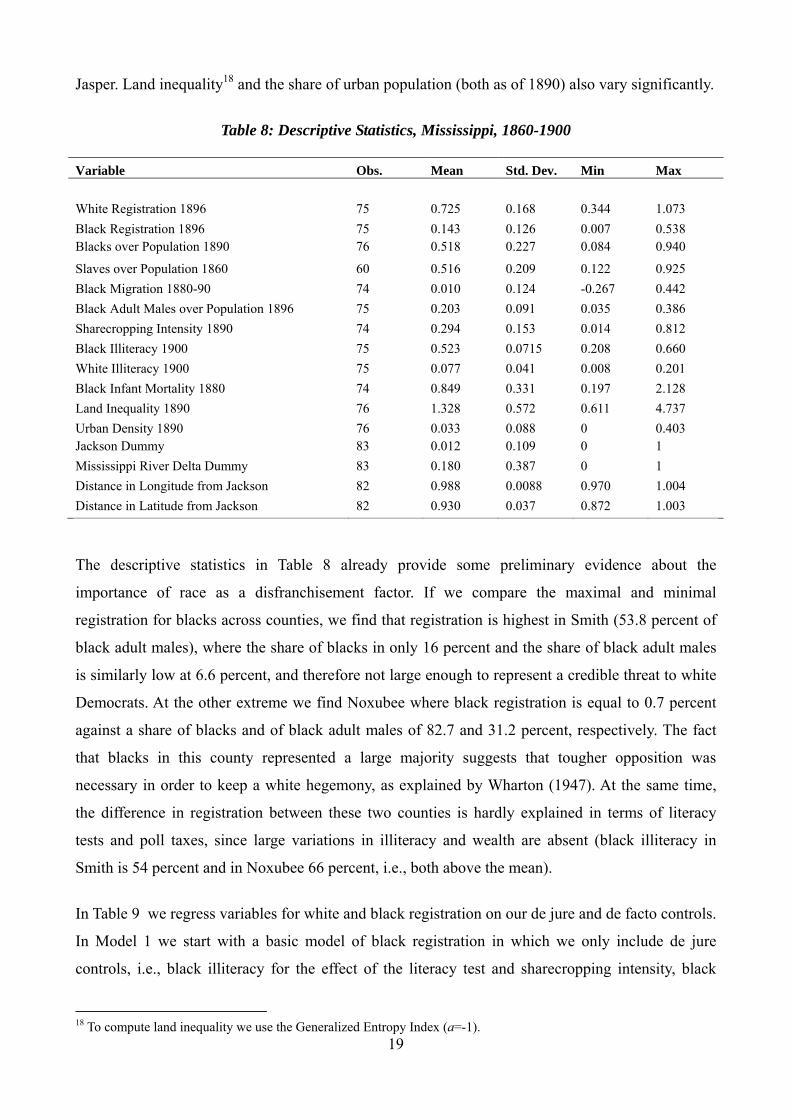
Jasper. Land inequality18 and the share of urban population (both as of 1890) also vary significantly.
Table 8: Descriptive Statistics, Mississippi, 1860-1900
Variable Obs. Mean Std. Dev. Min Max
White Registration 1896 75 0.725 0.168 0.344 1.073
Black Registration 1896 75 0.143 0.126 0.007 0.538 Blacks over Population 1890 76 0.518 0.227 0.084 0.940
Slaves over Population 1860 60 0.516 0.209 0.122 0.925
Black Migration 1880-90 74 0.010 0.124 -0.267 0.442
Black Adult Males over Population 1896 75 0.203 0.091 0.035 0.386
Sharecropping Intensity 1890 74 0.294 0.153 0.014 0.812
Black Illiteracy 1900 75 0.523 0.0715 0.208 0.660
White Illiteracy 1900 75 0.077 0.041 0.008 0.201
Black Infant Mortality 1880 74 0.849 0.331 0.197 2.128
Land Inequality 1890 76 1.328 0.572 0.611 4.737
Urban Density 1890 76 0.033 0.088 0 0.403 Jackson Dummy 83 0.012 0.109 0 1
Mississippi River Delta Dummy 83 0.180 0.387 0 1
Distance in Longitude from Jackson 82 0.988 0.0088 0.970 1.004
Distance in Latitude from Jackson 82 0.930 0.037 0.872 1.003
The descriptive statistics in Table 8 already provide some preliminary evidence about the
importance of race as a disfranchisement factor. If we compare the maximal and minimal
registration for blacks across counties, we find that registration is highest in Smith (53.8 percent of
black adult males), where the share of blacks in only 16 percent and the share of black adult males
is similarly low at 6.6 percent, and therefore not large enough to represent a credible threat to white
Democrats. At the other extreme we find Noxubee where black registration is equal to 0.7 percent
against a share of blacks and of black adult males of 82.7 and 31.2 percent, respectively. The fact
that blacks in this county represented a large majority suggests that tougher opposition was
necessary in order to keep a white hegemony, as explained by Wharton (1947). At the same time,
the difference in registration between these two counties is hardly explained in terms of literacy
tests and poll taxes, since large variations in illiteracy and wealth are absent (black illiteracy in
Smith is 54 percent and in Noxubee 66 percent, i.e., both above the mean).
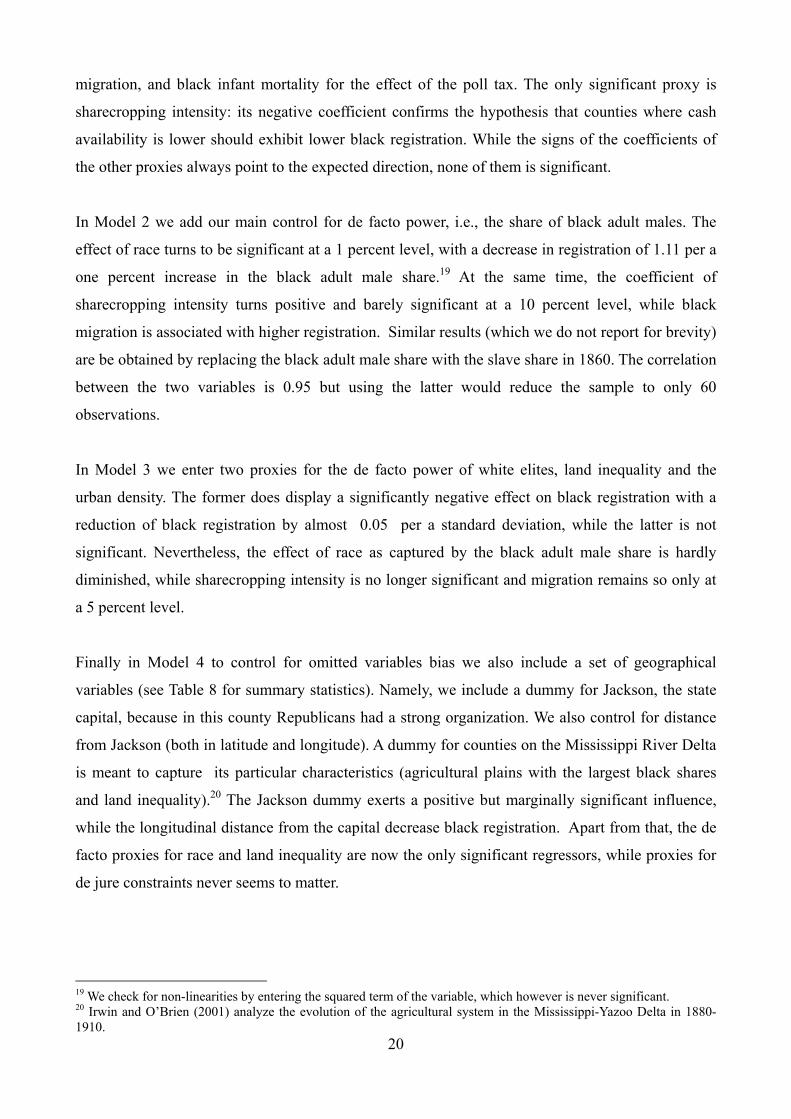
In Table 9 we regress variables for white and black registration on our de jure and de facto controls.
In Model 1 we start with a basic model of black registration in which we only include de jure
controls, i.e., black illiteracy for the effect of the literacy test and sharecropping intensity, black
18 To compute land inequality we use the Generalized Entropy Index (a=-1).
20
migration, and black infant mortality for the effect of the poll tax. The only significant proxy is
sharecropping intensity: its negative coefficient confirms the hypothesis that counties where cash
availability is lower should exhibit lower black registration. While the signs of the coefficients of
the other proxies always point to the expected direction, none of them is significant.
In Model 2 we add our main control for de facto power, i.e., the share of black adult males. The
effect of race turns to be significant at a 1 percent level, with a decrease in registration of 1.11 per a
one percent increase in the black adult male share.19 At the same time, the coefficient of
sharecropping intensity turns positive and barely significant at a 10 percent level, while black
migration is associated with higher registration. Similar results (which we do not report for brevity)
are be obtained by replacing the black adult male share with the slave share in 1860. The correlation
between the two variables is 0.95 but using the latter would reduce the sample to only 60
observations.
In Model 3 we enter two proxies for the de facto power of white elites, land inequality and the
urban density. The former does display a significantly negative effect on black registration with a
reduction of black registration by almost 0.05 per a standard deviation, while the latter is not
significant. Nevertheless, the effect of race as captured by the black adult male share is hardly
diminished, while sharecropping intensity is no longer significant and migration remains so only at
a 5 percent level.
Finally in Model 4 to control for omitted variables bias we also include a set of geographical
variables (see Table 8 for summary statistics). Namely, we include a dummy for Jackson, the state
capital, because in this county Republicans had a strong organization. We also control for distance
from Jackson (both in latitude and longitude). A dummy for counties on the Mississippi River Delta
is meant to capture its particular characteristics (agricultural plains with the largest black shares
and land inequality).20 The Jackson dummy exerts a positive but marginally significant influence,
while the longitudinal distance from the capital decrease black registration. Apart from that, the de
facto proxies for race and land inequality are now the only significant regressors, while proxies for
de jure constraints never seems to matter.
19 We check for non-linearities by entering the squared term of the variable, which however is never significant. 20 Irwin and O’Brien (2001) analyze the evolution of the agricultural system in the Mississippi-Yazoo Delta in 1880-1910.
21
Table 9: Determinants of Voter Registration per Race, Mississippi, 1896
Dependent Variable: Registration per Race 1896
Model 1 Model 2 Model 3 Model 4 Model 5
Estimation Method: OLS Blk Registr. Blk Registr. Blk Registr. Blk Registr. Wht Registr.
Black Adult Male Share 1896 -1.110*** -1.038*** -1.184*** -0.163 (0.139) (0.133) (0.189) (0.401) Black Illiteracy 1900 -0.152 0.158 0.00983 -0.0489 (0.175) (0.124) (0.137) (0.154) Sharecropping Intensity 1890 -0.289*** 0.0989* 0.0294 -0.0561 0.199 (0.0890) (0.0588) (0.0661) (0.0957) (0.216) Black Migration 1880-90 -0.137 0.194*** 0.155** 0.111 (0.0884) (0.0644) (0.0657) (0.0728) Black Infant Mortality 1890 -0.730 -0.0177 -0.0422 0.261 (0.619) (0.412) (0.407) (0.423) Land Inequality 1890 -0.0486*** -0.0560** -0.0656* (0.0177) (0.0234) (0.0372) Urban Density (log) 1890 -0.106 -0.104 -0.649*** (0.0740) (0.0838) (0.196) Jackson Dummy 0.0800* 0.232** (0.0467) (0.0893) Mississippi River Delta Dummy -0.0172 -0.0675 (0.0254) (0.0756) Distance in Longitude from Jackson -4.511** 0.122 (1.890) (3.354) Distance in Latitude from Jackson -0.195 -0.187 (0.546) (0.942) White Illiteracy 1900 -0.937 (0.726) Constant 0.343*** 0.257*** 0.409*** 5.134** 0.943 (0.104) (0.0687) (0.100) (2.175) (4.058)
Observations 74 74 74 74 75 R-Squared 0.16 0.47 0.51 0.55 0.22 Robust Standard Errors in parentheses
*** p<0.01, ** p<0.05, * p<0.1
Overall, the R-squareds (between 0.47 and 0.55 in the three models including the black adult male
share) imply that these models can explain a large portion of the variation in black registration,
consistently with the idea that blacks were more severely deprived of political power in counties
where the share of blacks was larger. On the other hand the effect of factors proxying for the poll
tax and the literacy test add no robust explanatory power to our models when race is accounted for.
In other words, de facto disfranchisement as captured by race prevails over de jure disfranchisement
22
as an explanation of black registration. The effect of land inequality is also significant and negative,
which suggests that the opposition to blacks' enfranchisement was tougher in counties in which
whites represented a strong elite.21
In Model 5 we replace black registration with white registration as the dependent variable and we
find that land inequality exerts a significant negative effect (significant at a 10 percent level) also on
white registration. A standard deviation in land inequality decreases white registration by almost
0.07 percent, suggesting that poor whites may also have been affected by the presence of white
elites. The Jackson dummy and urban density are the only other significant variables. This lack of
significance is likely to be explained by the large proportion of registered whites, close on average
to 73 percent and therefore in line with turnout in a full democracy. It is plausible therefore that
restrictions introduced with the 1890 constitutions had no effect on the white electorate, as
confirmed by the insignificance of the coefficient of white illiteracy.
Since voting and registration may follow spatial patterns (Darmofal, 2006), in Table 10 we repeat
the same exercise of Table 9 controlling for spatial correlation across counties, to obtain very
similar results. Sharecropping intensity is still significant at a 1 percent level in Model 1, but
consistently with simple OLS the variable loses significance in the following models. Land
inequality confirms its negative and significant coefficient and the effect of the other controls,
starting with that of race, is similar to what emerged from Table 9.22
Results in Table 10 are directly comparable with the difference in difference estimates presented in
the previous section, where we used turnout as the dependent variable. Both the cross county
analysis and the difference in difference approach suggest a marginal and non-robust effect of poll
taxes and literacy tests on black registration and voting behavior. On the other hand there is
evidence of a strong effect of race, which may have been used as a signalling device. Given that the
easiest way to ensure a Democratic victory in the election was to exclude potential voter for
Republicans, and given that blacks were likely to vote Republican, race was the simplest
characteristic which revealed voting preferences.
21 Alternative GE indices with a different coefficient (a=0, a=1, and a=2, where a lower a puts more weights on the lower tail of the distribution) and a Gini Index are not significant. 22 The Interrogatory Answers also provide cross county information about the 1899 primaries. Analogous regressions using these data, which we do not report for brevity, deliver similar results.
23
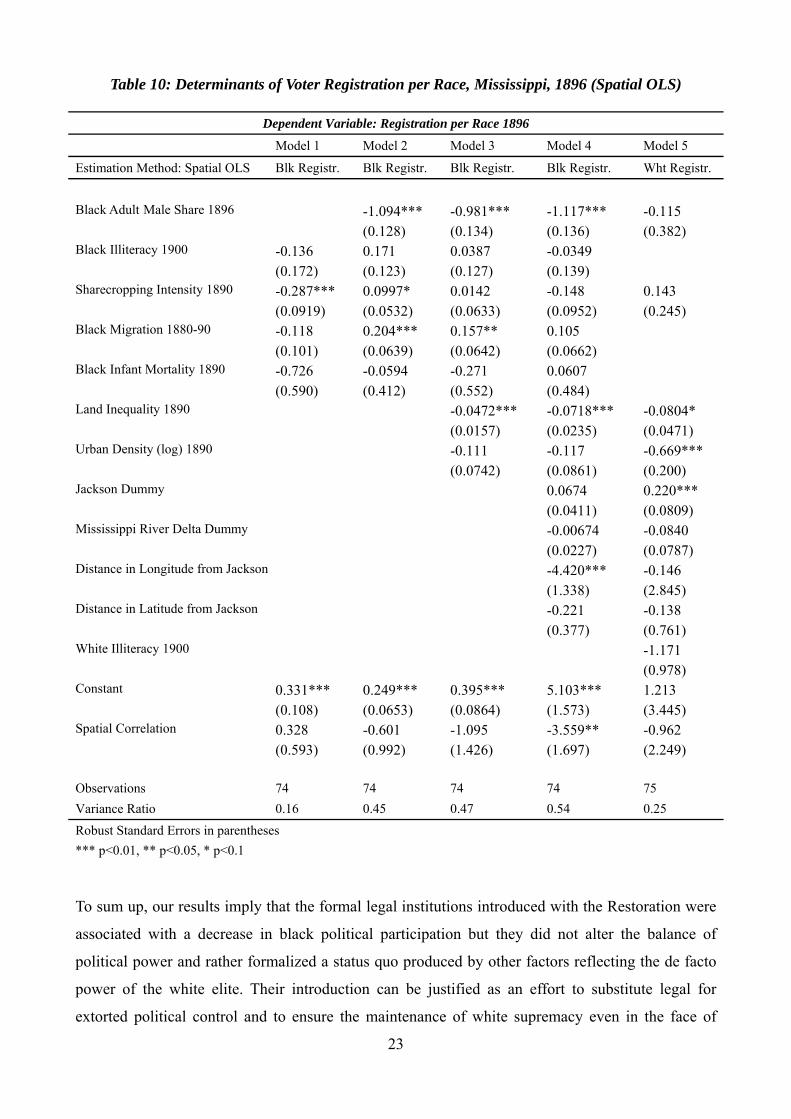
Table 10: Determinants of Voter Registration per Race, Mississippi, 1896 (Spatial OLS)
Dependent Variable: Registration per Race 1896
Model 1 Model 2 Model 3 Model 4 Model 5
Estimation Method: Spatial OLS Blk Registr. Blk Registr. Blk Registr. Blk Registr. Wht Registr.
Black Adult Male Share 1896 -1.094*** -0.981*** -1.117*** -0.115 (0.128) (0.134) (0.136) (0.382)Black Illiteracy 1900 -0.136 0.171 0.0387 -0.0349 (0.172) (0.123) (0.127) (0.139) Sharecropping Intensity 1890 -0.287*** 0.0997* 0.0142 -0.148 0.143 (0.0919) (0.0532) (0.0633) (0.0952) (0.245)Black Migration 1880-90 -0.118 0.204*** 0.157** 0.105 (0.101) (0.0639) (0.0642) (0.0662) Black Infant Mortality 1890 -0.726 -0.0594 -0.271 0.0607 (0.590) (0.412) (0.552) (0.484) Land Inequality 1890 -0.0472*** -0.0718*** -0.0804* (0.0157) (0.0235) (0.0471)Urban Density (log) 1890 -0.111 -0.117 -0.669*** (0.0742) (0.0861) (0.200)Jackson Dummy 0.0674 0.220*** (0.0411) (0.0809)Mississippi River Delta Dummy -0.00674 -0.0840 (0.0227) (0.0787)Distance in Longitude from Jackson -4.420*** -0.146 (1.338) (2.845)Distance in Latitude from Jackson -0.221 -0.138 (0.377) (0.761)White Illiteracy 1900 -1.171 (0.978)Constant 0.331*** 0.249*** 0.395*** 5.103*** 1.213 (0.108) (0.0653) (0.0864) (1.573) (3.445)Spatial Correlation 0.328 -0.601 -1.095 -3.559** -0.962 (0.593) (0.992) (1.426) (1.697) (2.249) Observations 74 74 74 74 75
Variance Ratio 0.16 0.45 0.47 0.54 0.25
Robust Standard Errors in parentheses
*** p<0.01, ** p<0.05, * p<0.1
To sum up, our results imply that the formal legal institutions introduced with the Restoration were
associated with a decrease in black political participation but they did not alter the balance of
political power and rather formalized a status quo produced by other factors reflecting the de facto
power of the white elite. Their introduction can be justified as an effort to substitute legal for
extorted political control and to ensure the maintenance of white supremacy even in the face of
24
economic and social transformation that may alter de facto power in the future. Although Wharton
(1947) concludes his work on the conditions of blacks in Mississippi in the 1865-1890 period by
asserting that by 1890 a transition from slavery to a caste system had been completed, and despite
the fact that Mississippi did represent an extreme situation of extraordinary violence and
discrimination, still even in this state the white elites had some reason to worry about the future.
Indeed in 1888 the Republicans had almost managed to pass through Congress the Lodge Election
Bill, which would have extended federal supervision of registration and voting and made fraud and
intimidation more difficult even in Mississippi. Moreover, there was also evidence of progressive
erosion of local Democratic power (see Kousser, 1974).
6. Disfranchisement and Economic Policies
Once having established the relative importance of de facto vs. de jure disfranchisement factors in
explaining voting outcomes, in this section we turn our attention to a related but distinct question,
namely what is the effect of voting restrictions on actual economic policy outcomes. In other words,
we now seek to establish whether voting behavior ultimately does matter in economic terms, as
predicted by distributive politics models. The available literature on this topic has never exploited
the variation in electoral data in order to investigate this issue.23 Here we focus on two outcomes,
education policy and economic inequality. 24
We can test the relationship between voting and education by merging the data on the 1896
presidential election with cross county data on educational outcomes. Section 207 of the 1915
constitution of Mississippi cites: “Separate schools should be maintained for children of the white
and colored races.” The importance of the discriminatory provision of schooling between races in
the South and its consequences in terms of education and employment has been exhaustively
documented. 25 In this section we add to this literature by investigating whether de jure and de facto
disfranchisement may have contributed to the unequal provision of public education in the state of
Mississippi.
While cross county data on education outcomes are available for 1917, our data on voter
registration refer to 1896. However, by assuming sufficient persistence in the de facto institutions
(see Acemoglu and Robinson, 2008a,b) which are responsible for electoral outcomes, we can use 23 See Naidu (2012) and the other references in the literature review. 24 Bertocchi and Dimico (2011) examine the effect of race on current economic performances in Mississippi, while Bertocchi and Dimico (2012, 2010) look at the impact of race on education and inequality, respectively, in the U.S. 25 See Margo (1982, 1990) and the other references in the literature review.
25
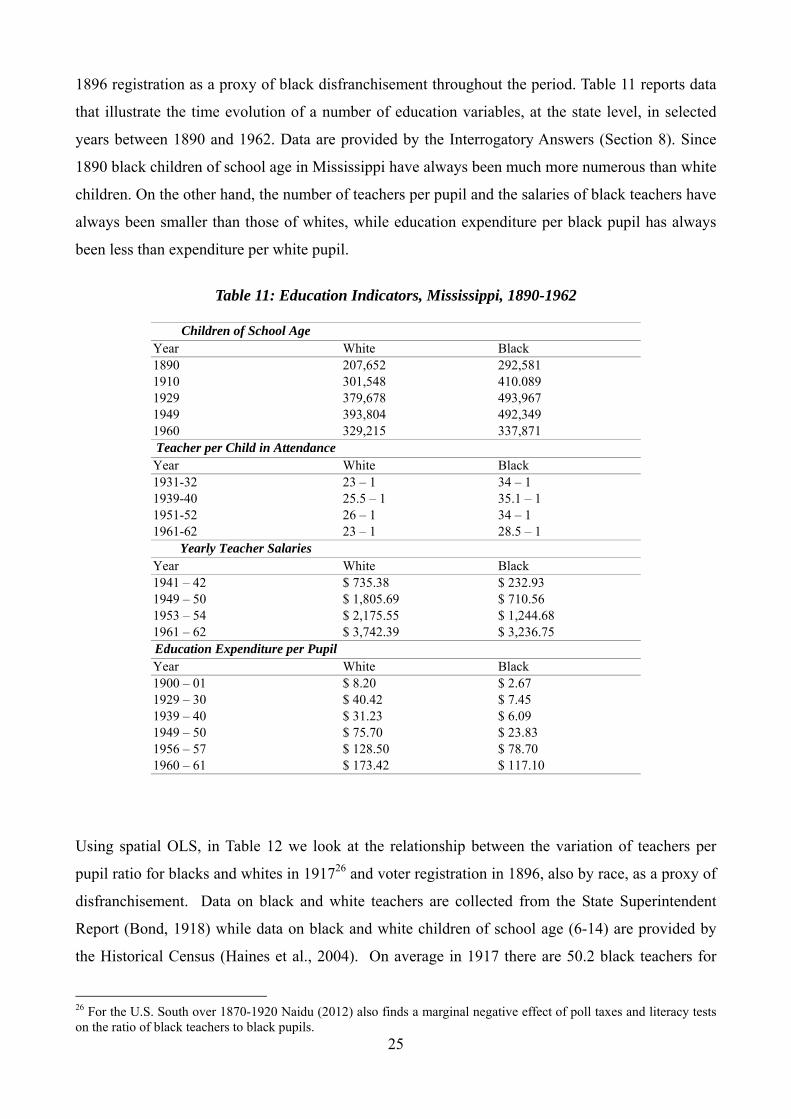
1896 registration as a proxy of black disfranchisement throughout the period. Table 11 reports data
that illustrate the time evolution of a number of education variables, at the state level, in selected
years between 1890 and 1962. Data are provided by the Interrogatory Answers (Section 8). Since
1890 black children of school age in Mississippi have always been much more numerous than white
children. On the other hand, the number of teachers per pupil and the salaries of black teachers have
always been smaller than those of whites, while education expenditure per black pupil has always
been less than expenditure per white pupil.
Table 11: Education Indicators, Mississippi, 1890-1962
Children of School Age
Year White Black 1890 207,652 292,581 1910 301,548 410.089 1929 379,678 493,967 1949 393,804 492,349 1960 329,215 337,871 Teacher per Child in Attendance Year White Black 1931-32 23 – 1 34 – 1 1939-40 25.5 – 1 35.1 – 1 1951-52 26 – 1 34 – 1 1961-62 23 – 1 28.5 – 1
Yearly Teacher Salaries Year White Black 1941 – 42 $ 735.38 $ 232.93 1949 – 50 $ 1,805.69 $ 710.56 1953 – 54 $ 2,175.55 $ 1,244.68 1961 – 62 $ 3,742.39 $ 3,236.75 Education Expenditure per Pupil Year White Black 1900 – 01 $ 8.20 $ 2.67 1929 – 30 $ 40.42 $ 7.45 1939 – 40 $ 31.23 $ 6.09 1949 – 50 $ 75.70 $ 23.83 1956 – 57 $ 128.50 $ 78.70 1960 – 61 $ 173.42 $ 117.10
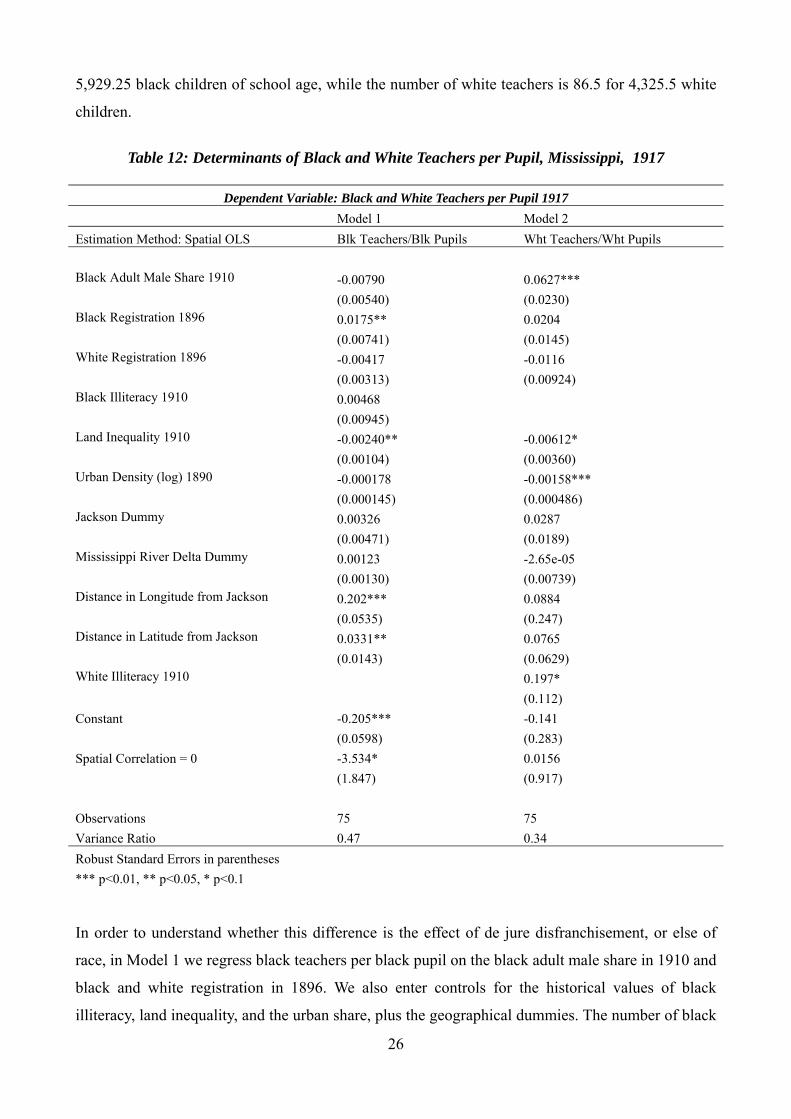
Using spatial OLS, in Table 12 we look at the relationship between the variation of teachers per
pupil ratio for blacks and whites in 191726 and voter registration in 1896, also by race, as a proxy of
disfranchisement. Data on black and white teachers are collected from the State Superintendent
Report (Bond, 1918) while data on black and white children of school age (6-14) are provided by
the Historical Census (Haines et al., 2004). On average in 1917 there are 50.2 black teachers for
26 For the U.S. South over 1870-1920 Naidu (2012) also finds a marginal negative effect of poll taxes and literacy tests on the ratio of black teachers to black pupils.
26
5,929.25 black children of school age, while the number of white teachers is 86.5 for 4,325.5 white
children.
Table 12: Determinants of Black and White Teachers per Pupil, Mississippi, 1917
Dependent Variable: Black and White Teachers per Pupil 1917
Model 1 Model 2
Estimation Method: Spatial OLS Blk Teachers/Blk Pupils Wht Teachers/Wht Pupils
Black Adult Male Share 1910 -0.00790 0.0627***
(0.00540) (0.0230) Black Registration 1896 0.0175** 0.0204
(0.00741) (0.0145) White Registration 1896 -0.00417 -0.0116
(0.00313) (0.00924) Black Illiteracy 1910 0.00468
(0.00945) Land Inequality 1910 -0.00240** -0.00612*
(0.00104) (0.00360) Urban Density (log) 1890 -0.000178 -0.00158***
(0.000145) (0.000486) Jackson Dummy 0.00326 0.0287
(0.00471) (0.0189) Mississippi River Delta Dummy 0.00123 -2.65e-05
(0.00130) (0.00739) Distance in Longitude from Jackson 0.202*** 0.0884
(0.0535) (0.247) Distance in Latitude from Jackson 0.0331** 0.0765
(0.0143) (0.0629) White Illiteracy 1910 0.197*
(0.112)
Constant -0.205*** -0.141
(0.0598) (0.283)
Spatial Correlation = 0 -3.534* 0.0156
(1.847) (0.917)
Observations 75 75
Variance Ratio 0.47 0.34
Robust Standard Errors in parentheses
*** p<0.01, ** p<0.05, * p<0.1
In order to understand whether this difference is the effect of de jure disfranchisement, or else of
race, in Model 1 we regress black teachers per black pupil on the black adult male share in 1910 and
black and white registration in 1896. We also enter controls for the historical values of black
illiteracy, land inequality, and the urban share, plus the geographical dummies. The number of black
27
teachers per black pupil significantly increases with black registration and decreases with land
inequality. At the mean a one percent change in the black registration increases the ratio of teachers
to pupils by almost 0.018 which means that the number of teachers increases by almost two teachers
per a hundred students.
In Model 2 we look at the ratio of white teachers per white pupils and consistently with Margo
(1990) we find that the number of white teachers increases with the share of blacks while voting
does not significantly affect white educational inputs. The positive effect of the share of blacks on
white teachers occurs because counties used to divert state funds, which were allocated on a per
child basis, from blacks to whites. For example in 1939-40 Sunflower county received for education
from the state of Mississippi a total of $73,626, computed on a per child basis. Since 79 percent of
the children of school age were black, the amount the county received for black pupils was $58.165.
However, only $35.564 was spent for black pupils. The remaining $22.601 was presumably spent
on additional schooling for whites. As a result, the amount spent per white pupil was much larger in
counties with a higher share of blacks.
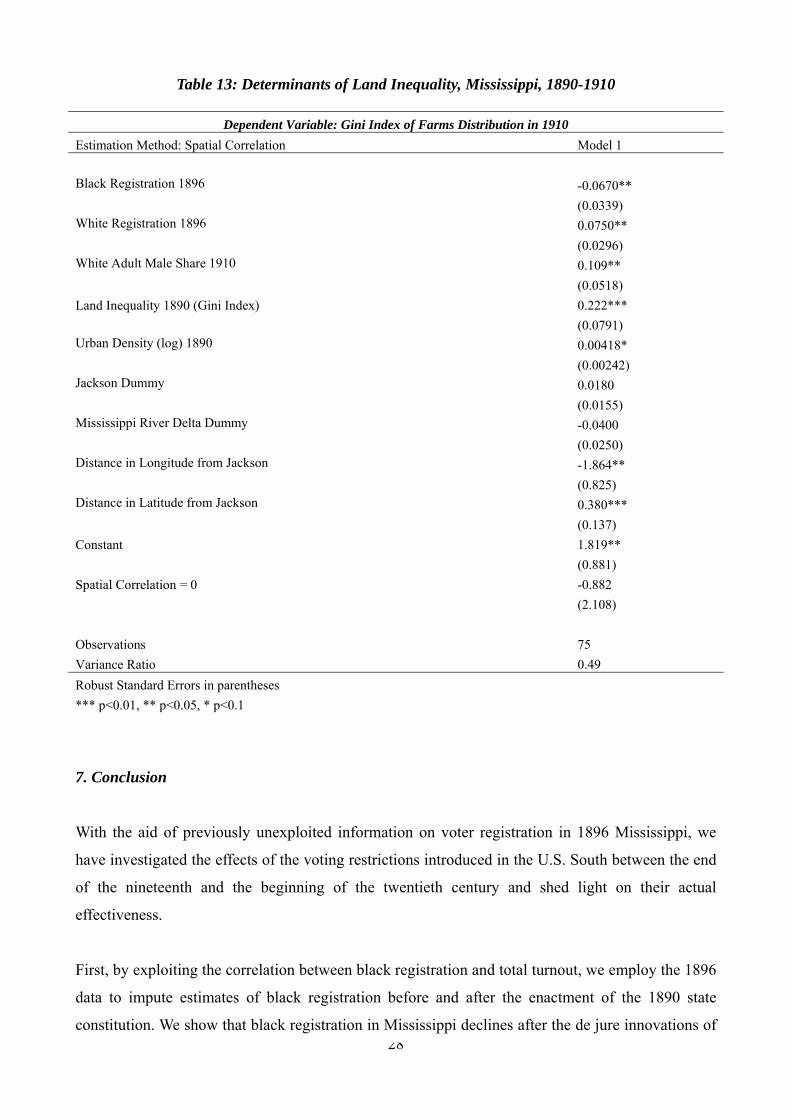
Another way to assess the economic impact of voting restrictions is to measure their effect on
inequality, which we can proxy for this time period using land inequality (as in Nunn, 2008). In
Table 13 we show a significant effect of the variation in voter registration on the Gini index of
farms distribution in 1910. This measure of land inequality also increases with its initial level and
with white registration, while it decreases with black registration. The share of white adult males,
which is used to proxy for the number of potential owners, is not significant, while the share of the
urban population is marginally significant.
To conclude, our results show that political participation matters both for educational policies and
inequality, since lower black registration is significantly correlated with lower resources for blacks
and higher inequality.
28
Table 13: Determinants of Land Inequality, Mississippi, 1890-1910
Dependent Variable: Gini Index of Farms Distribution in 1910
Estimation Method: Spatial Correlation Model 1
Black Registration 1896 -0.0670**
(0.0339) White Registration 1896 0.0750**
(0.0296) White Adult Male Share 1910 0.109**
(0.0518)
Land Inequality 1890 (Gini Index) 0.222***
(0.0791) Urban Density (log) 1890 0.00418*
(0.00242) Jackson Dummy 0.0180
(0.0155) Mississippi River Delta Dummy -0.0400
(0.0250) Distance in Longitude from Jackson -1.864**
(0.825) Distance in Latitude from Jackson 0.380***
(0.137)
Constant 1.819**
(0.881)
Spatial Correlation = 0 -0.882
(2.108)
Observations 75
Variance Ratio 0.49
Robust Standard Errors in parentheses
*** p<0.01, ** p<0.05, * p<0.1
7. Conclusion
With the aid of previously unexploited information on voter registration in 1896 Mississippi, we
have investigated the effects of the voting restrictions introduced in the U.S. South between the end
of the nineteenth and the beginning of the twentieth century and shed light on their actual
effectiveness.
First, by exploiting the correlation between black registration and total turnout, we employ the 1896
data to impute estimates of black registration before and after the enactment of the 1890 state
constitution. We show that black registration in Mississippi declines after the de jure innovations of
29
1890 but that it is also strongly affected by de facto racial factors captured by the share of blacks.
Next, in order to establish a causal effect, we apply a difference in difference approach that
indicates a marginal effect of voting restrictions and again a strong influence of race. The fact that
the effect of race becomes even stronger after 1890 suggests that the de jure barriers may have
served the purpose of institutionalizing a de facto condition of disfranchisement. Further cross
county evidence confirms that de facto disfranchisement as captured by race prevails over de jure
disfranchisement as an explanation of the observed pattern of black political participation. Finally
we provide evidence of an influence of political participation on education policy and inequality.
Our findings contribute not only to the literature on the socio-political history of the Restoration in
the U.S. South, but also to a broader current research line on the comparative relevance of de jure
and de facto sources of power. The main message of the paper is that the de facto power of the
southern white elites prevailed on the voting legislation as a determinant of black political
participation. This finding helps to understand why, almost fifty years after the Voting Rights Act,
enough “vestiges of discrimination” remain despite the removal of “first generation barriers”. This
is the motivation for the decision taken by Congress in 2009 to confirm until 2031 the preclearance
provision, that is the section of the Act that requires jurisdictions that used poll taxes and literacy
tests to obtain federal approval for any changes to their election practices, such as redistricting (The
Economist, 2011). In other words, as voting restrictions were not the main driver of black
disfranchisement during the Restoration, their de jure reversal was not enough to end racial
discrimination.
References Acemoglu, D. and Robinson, J.A., The Persistence and Change of Institutions in the Americas, Southern Economic Journal 75, 282-299, 2008a.
Acemoglu, D. and Robinson, J.A., Persistence of Power, Elites, and Institutions, American Economic Review 98, 267-293, 2008b. Acemoglu, D. and Robinson, J.A., Why Did the West Extend the Franchise? Democracy, Inequality, and Growth in Historical Perspective, Quarterly Journal of Economics 115, 1167-1199, 2000. Ades, A and Verdier, T., The Rise and Fall of Elites: A Theory of Economic Development and Social Polarization in Rent-Seeking Societies, CEPR Discussion Paper No. 1495, 1996. Alt, J.E., The Impact of the Voting Rights Act on Black and White Voter Registration in the South, in Davidson, C. and Grofman, B. (eds.), Quiet Revolution in the South: The Impact of the Voting Rights Act, 1965-1990, Princeton University Press, 1994. Baland, J.M. and Robinson, J.A., Land and Power: Theory and Evidence from Chile. American
30
Economic Review 98, 1737-1765, 2008. Bertocchi, G. and Dimico, A., 2012, The Racial Gap in Education and the Legacy of Slavery, Journal of Comparative Economics, forthcoming. Bertocchi, G. and Dimico, A., 2011, Race v. Suffrage: The Determinants of Development in Mississippi, CEPR Discussion Paper No. 8589. Bertocchi, G. and Dimico, A., Slavery, Education, and Inequality, CEPR Discussion Paper No. 8073, 2010. Besley, T., Persson, T. and Sturm, D.M., Political Competition, Policy and Growth: Theory and Evidence from the United States, Review of Economic Studies 77, 1329-1352, 2010. Bond, H.M., Negro Education in Alabama: A Study of Cotton and Steel, Associated Publishers, 1939. Bond, H.M., The Education of the Negro in the American Social Order, Prentice-Hall, inc., 1934. Bond, W.F., School Laws of the State of Mississippi, Report of the State Superintendent of Education, 1918. Bourguignon, F. and Verdier, T., Oligarchy, Democracy, Inequality and Growth, Journal of Development Economics 62, 285-314, 2000. Card, D. and Krueger, B.D., School Quality and Black-White Relative Earnings: A Direct Assessment, Quarterly Journal of Economics 107, 151-200, 1992. Cascio, E.U. and Washington, E., Valuing the Vote: The Redistribution of Voting Rights and State Funds Following the Voting Rights Act of 1965, NBER Working Paper No. 17776, 2012. Chay, K. and Munshi, K., Black Mobilization After Emancipation: Evidence from Reconstruction and the Great Migration, mimeo, Brown University, 2011.
Clubb, J.M., Flanigan, W.H. and Zingale, N.H., Electoral Data for Counties in the United States: Presidential and Congressional Races, 1840-1972, Inter-university Consortium for Political and Social Research, 2006.
Darmofal, D., The Political Geography of Macro-Level Turnout in American Political Development, Political Geography 25, 123-15, 2006. Filer, J.E., Kenny, L.W. and Morton, R.B., Voting Laws, Educational Policies, and Minority Turnout, Journal of Law and Economics 34, 371-393, 1991. Fishback, P.V. and Baskin, J.H., Narrowing the Black-White Gap in Child Literacy in 1910: The Roles of School Inputs and Family Inputs, Review of Economics and Statistics 73, 725-728, 1991. Galor, O., Moav, O. and Vollrath, D., Inequality in Landownership, the Emergence of Human-Capital Promoting Institutions, and the Great Divergence, Review of Economic Studies 76, 143-179, 2009.
31
Haines, M.R. and the Inter-University Consortium for Political and Social Research, Historical, Demographic, Economics, and Social Data: The USA, 1790-2000, ICPSR02896-v2, Colgate University/Inter-university Consortium for Political and Social Research, 2004. Harris, J.R. and Todaro, M.P., Migration, Unemployment and Development: A Two-Sector Analysis, American Economic Review 60, 126–142, 1970. Husted, T.A. and Kenny, L.W., The Effect of the Expansion of the Voting Franchise On the Size of Government, Journal of Political Economy 105, 54-82, 1997. Irwin, J.R. and O’Brien, A.P., Economic Progress in the Postbellum South? African-American Incomes in the Mississippi Delta, 1880–1910, Explorations in Economic History 38, 166-180, 2001. Key, V.O., Southern Politics in State and Nation, AA Knopf, 1949. Kousser, J.M., The Shaping of Southern Politics: Suffrage Restriction and the Establishment of the One-Party South, 1880-1910, Yale University Press, 1974. Kousser, J.M., Ecological Regression and the Analysis of Past Politics, The Journal of Interdisciplinary History 4, 237-262, 1973. Lizzeri, A and Persico, N., Why Did the Elites Extend the Suffrage? Democracy and the Scope Of Government, with an Application to Britain's Age of Reform, Quarterly Journal of Economics 119, 707-765, 2004. Llavador H. and Oxoby, R.J., Partisan Competition, Growth, and the Franchise, Quarterly Journal of Economics 120, 1155-1189, 2005. Margo, R.A, Race and Schooling in the South, 1880-1950: An Economic History, University of Chicago Press, 1990. Margo, R.A, Race Differences in Public School Expenditures: Disfranchisement and School Finance in Louisiana, 1890-1910, Social Science History 6, 9-23, 1982. Naidu, S., Suffrage, Schooling, and Sorting in the Post-Bellum U.S. South, NBER Working Paper No. 18129, 2012. Nunn, N., Slavery, Inequality, and Economic Development in the Americas: An Examination of the Engerman-Sokoloff Hypothesis, in Helpman, E. (ed.), Institutions and Economic Performance, Harvard University Press, 2008. Ogden, F.D., The Poll Tax in the South, University of Alabama Press, 1958. Orazem, P. F., Black-White Differences in Schooling Investment and Human Capital Production in Segregated Schools, American Economic Review 77, 714-723, 1987. Pritchett, J.B., The Burden of Negro Schooling: Tax Incidence and Racial Redistribution in Postbellum North Carolina, Journal of Economic History 49, 966-973, 1989. Redding, K. and James, D.R., Estimating Levels and Modeling Determinants of Black and White Voter Turnout in the South, 1880 to 1912, Historical Methods 34, 141-158, 2001.
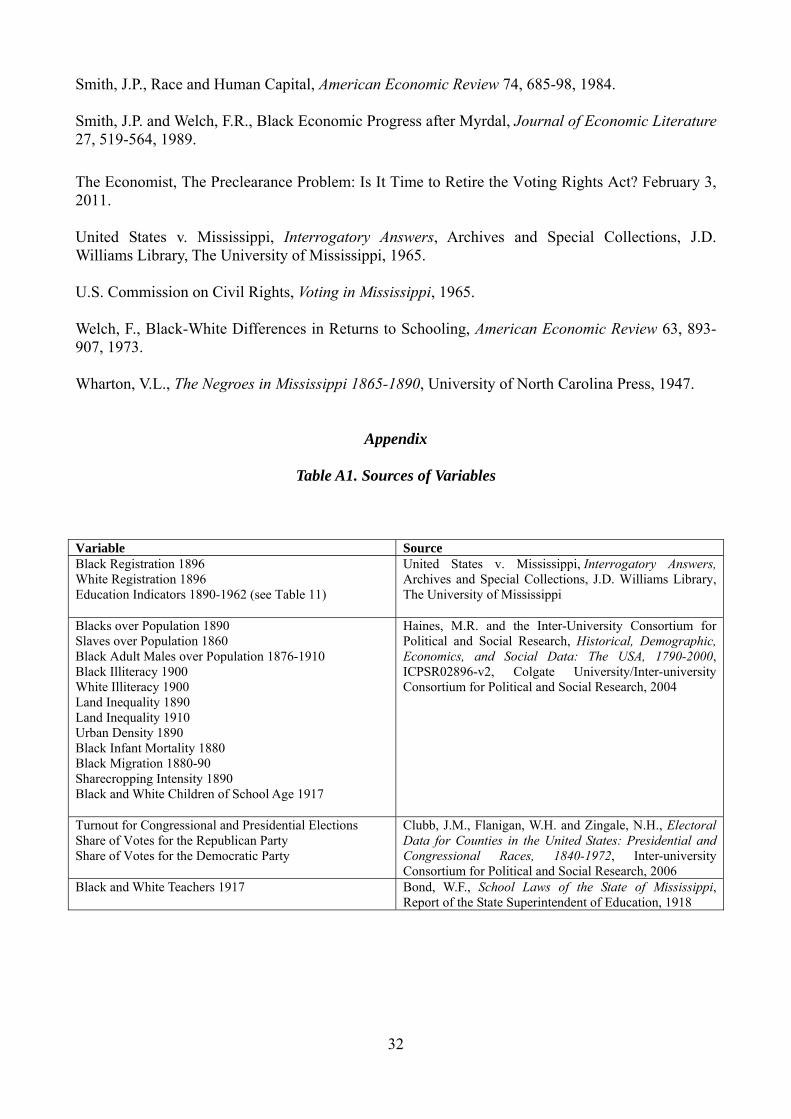
32
Smith, J.P., Race and Human Capital, American Economic Review 74, 685-98, 1984. Smith, J.P. and Welch, F.R., Black Economic Progress after Myrdal, Journal of Economic Literature 27, 519-564, 1989.
The Economist, The Preclearance Problem: Is It Time to Retire the Voting Rights Act? February 3, 2011. United States v. Mississippi, Interrogatory Answers, Archives and Special Collections, J.D. Williams Library, The University of Mississippi, 1965. U.S. Commission on Civil Rights, Voting in Mississippi, 1965. Welch, F., Black-White Differences in Returns to Schooling, American Economic Review 63, 893-907, 1973. Wharton, V.L., The Negroes in Mississippi 1865-1890, University of North Carolina Press, 1947.
Appendix
Table A1. Sources of Variables
Variable Source Black Registration 1896 White Registration 1896 Education Indicators 1890-1962 (see Table 11)
United States v. Mississippi, Interrogatory Answers, Archives and Special Collections, J.D. Williams Library, The University of Mississippi
Blacks over Population 1890 Slaves over Population 1860 Black Adult Males over Population 1876-1910 Black Illiteracy 1900 White Illiteracy 1900 Land Inequality 1890 Land Inequality 1910 Urban Density 1890 Black Infant Mortality 1880 Black Migration 1880-90 Sharecropping Intensity 1890 Black and White Children of School Age 1917
Haines, M.R. and the Inter-University Consortium for Political and Social Research, Historical, Demographic, Economics, and Social Data: The USA, 1790-2000, ICPSR02896-v2, Colgate University/Inter-university Consortium for Political and Social Research, 2004
Turnout for Congressional and Presidential Elections Share of Votes for the Republican Party Share of Votes for the Democratic Party
Clubb, J.M., Flanigan, W.H. and Zingale, N.H., Electoral Data for Counties in the United States: Presidential and Congressional Races, 1840-1972, Inter-university Consortium for Political and Social Research, 2006
Black and White Teachers 1917 Bond, W.F., School Laws of the State of Mississippi, Report of the State Superintendent of Education, 1918